

The DOI matches its Crossref record; 8 of the 8 references it cites were found in a registry or an index.
Modulation of microRNA-mRNA Target Pairs by Human Papillomavirus 16 Oncoproteins
Abstract
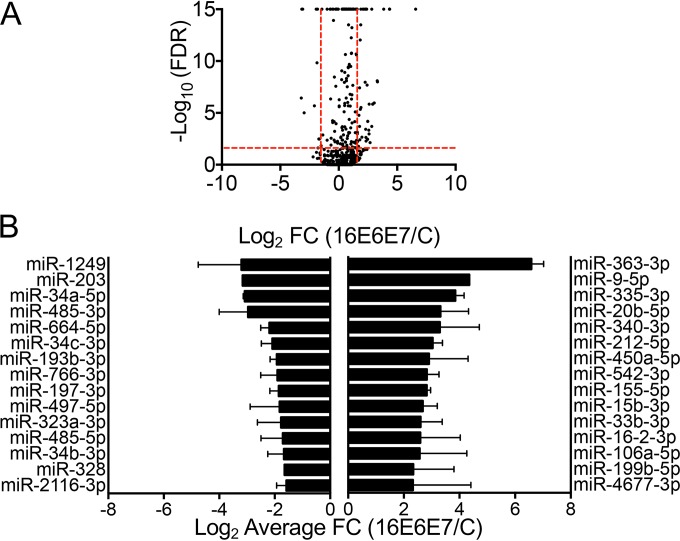
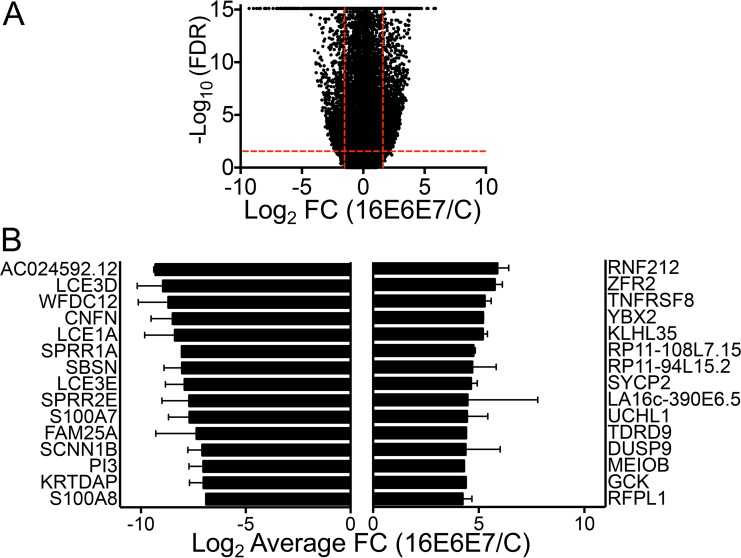
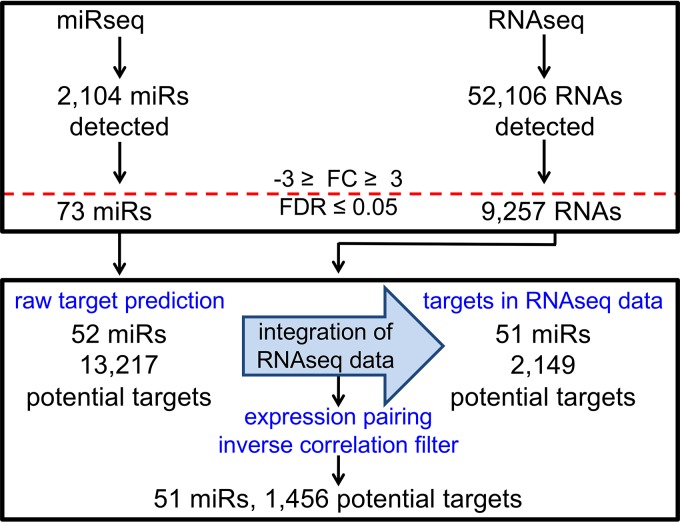
The E6 and E7 proteins are the major oncogenic drivers encoded by high-risk human papillomaviruses (HPVs). While many aspects of the transforming activities of these proteins have been extensively studied, there are fewer studies that have investigated how HPV E6/E7 expression affects the expression of cellular noncoding RNAs. The goal of our study was to investigate HPV16 E6/E7 modulation of cellular microRNA (miR) levels and to determine the potential consequences for cellular gene expression. We performed deep sequencing of small and large cellular RNAs in primary undifferentiated cultures of human foreskin keratinocytes (HFKs) with stable expression of HPV16 E6/E7 or a control vector. After integration of the two data sets, we identified 51 differentially expressed cellular miRs associated with the modulation of 1,456 potential target mRNAs in HPV16 E6/E7-expressing HFKs. We discovered that the degree of differential miR expression in HFKs expressing HPV16 E6/E7 was not necessarily predictive of the number of corresponding mRNA targets or the potential impact on gene expression. Additional analyses of the identified miR-mRNA pairs suggest modulation of specific biological activities and biochemical pathways. Overall, our study supports the model that perturbation of cellular miR expression by HPV16 E6/E7 importantly contributes to the rewiring of cellular regulatory circuits by the high-risk HPV E6 and E7 proteins that contribute to oncogenic transformation. IMPORTANCE High-risk human papillomaviruses (HPVs) are the causative agents of almost all cervical cancers and many other cancers, including anal, vaginal, vulvar, penile, and oropharyngeal cancers. Despite the availability of efficacious HPV vaccines, it is critical to determine how HPVs cause cancer, as many people remain unvaccinated and the vaccine does not prevent cancer development in individuals who are already infected. Two HPV proteins, E6 and E7, are the major drivers of cancer development, and much remains to be learned about how the expression of these viral proteins reprograms infected cells, ultimately resulting in cancer development. Small, noncoding human RNAs, termed microRNAs (miRs), regulate gene expression and have been implicated in almost all human cancers, including HPV-associated cancers. Our study provides a comprehensive analysis of how E6 and E7 alter the expression of human miRs and how this potentially impacts cellular gene expression, which may contribute to cancer development.
Overview
The claims and statistics of this paper haven’t been checked yet.
Run the check — free, no account needed. It reads the open-access text and checks the sources it cites.
Integrity signals
Registry
Cites
Statistics
Figures
Verification
Claims the paper makes
The claims and statistics of this paper haven’t been checked yet.
Run the check — free, no account needed. It reads the open-access text and checks the sources it cites.
Claims other papers make about this one
Each is checked against this paper’s own text: does it say what the citing paper says it does?
In the citing paper
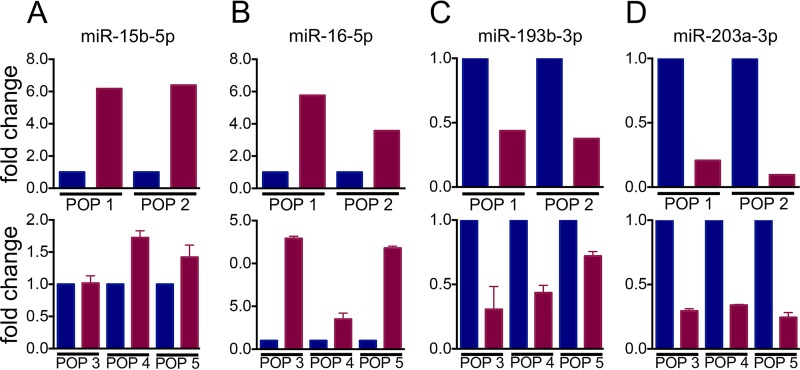
“miR-33b-3p, -542-3p and -33-3p—are upregulated and miR-193b-3p is downregulated in HPV-16 E6/E7 expressing HFKs.”
From The Not-So-Good, the Bad and the Ugly: HPV E5, E6 and E7 Oncoproteins in the Orchestration of Carcinogenesis (2021) · cites this paper as [341]
In the citing paper
“These microRNAs, together with others that are modulated by HPV oncoproteins, seem to affect several of the cellular signalling pathways including p38 MAPK signalling, G1/S checkpoint regulation, and ATM signalling, contributing towards rewiring of cellular regulatory pathways to oncogenic transformation [341,342]”
From The Not-So-Good, the Bad and the Ugly: HPV E5, E6 and E7 Oncoproteins in the Orchestration of Carcinogenesis (2021) · cites this paper as [341]
In the citing paper
“upregulation of miR-16-2-3p and downregulation of miR-197-3p and -1249 in HPV-16 E6/E7 expressing HFKs is driven by E7 expression [341]”
From The Not-So-Good, the Bad and the Ugly: HPV E5, E6 and E7 Oncoproteins in the Orchestration of Carcinogenesis (2021) · cites this paper as [341]
Self-check
Percentages, sums and reported differences re-computed from the paper’s own numbers.
The self-check needs the paper’s full text.
Citations
Cites
miRBase: annotating high confidence microRNAs using deep sequencing data
Kozomara, A., & Griffiths-Jones, S. (2014) · Nucleic Acids Research · doi:10.1093/nar/gkt1181 · Cited by 5,073
Mammalian microRNAs predominantly act to decrease target mRNA levels
Guo, H., Ingolia, N. T., Weissman, J. S., & Bartel, D. P. (2010) · Nature · doi:10.1038/nature09267 · Cited by 3,886
The human papilloma virus-16 E7-oncoprotein is able to bind to the retinoblastoma gene product
Dyson, N., Howley, P. M., Münger, K., & Harlow, E. (1989) · Science · doi:10.1126/science.2537532 · Cited by 3,017
Transactivation of miR-34a by p53 broadly influences gene expression and promotes apoptosis
Chang, T.-C., Wentzel, E. A., Kent, O. A., Ramachandran, K., Mullendore, M., Lee, K. H., Feldmann, G., Yamakuchi, M., Ferlito, M., Lowenstein, C. J., et al. (2007) · Molecular Cell · doi:10.1016/j.molcel.2007.05.010 · Cited by 2,010
Sempere, L. F., Freemantle, S., Pitha-Rowe, I., Moss, E., Dmitrovsky, E., & Ambros, V. (2004) · Genome Biology · doi:10.1186/gb-2004-5-3-r13 · Cited by 1,578
The miR-34 family in cancer and apoptosis
Hermeking, H. (2010) · Cell Death & Differentiation · doi:10.1038/cdd.2009.56 · Cited by 1,236
A skin microRNA promotes differentiation by repressing ‘stemness’
Yi, R., Poy, M. N., Stoffel, M., & Fuchs, E. (2008) · Nature · doi:10.1038/nature06642 · Cited by 790
Concordant Regulation of Translation and mRNA Abundance for Hundreds of Targets of a Human microRNA
Hendrickson, D. G., Hogan, D. J., McCullough, H. L., Myers, J. W., Herschlag, D., Ferrell, J. E., & Brown, P. O. (2009) · PLoS Biology · doi:10.1371/journal.pbio.1000238 · Cited by 418
Research works printed but not linked: 59
- 10.1016/j.coviro.2012.05.004 · DOI
- 10.1016/j.virusres.2009.06.008 · DOI
- 10.1016/j.chom.2014.02.011 · DOI
- 10.1016/S0092-8674(00)81683-9 · DOI · Paper page
- Boyer SN Wazer DE Band V . 1996. E7 protein of human papillomavirus-16 induces degradation of retinoblastoma protein through the ubiquitin-proteasome pathway. Cancer Res56:4620–4624.
- 10.1006/viro.1997.8851 · DOI · Paper page
- 10.1016/0092-8674(90)90409-8 · DOI · Paper page
- 10.2174/2211536611302010002 · DOI · Paper page
- 10.1101/gr.082701.108 · DOI · Paper page
- 10.1016/j.cell.2009.01.002 · DOI · Paper page
- 10.1016/j.molcel.2014.08.028 · DOI · Paper page
- 10.1038/nature03315 · DOI · Paper page
- 10.1128/JVI.01175-06 · DOI
- 10.1073/pnas.1401430111 · DOI
- 10.1128/JVI.00153-13 · DOI
- 10.1073/pnas.85.19.7169 · DOI · Paper page
- 10.1093/nar/gkq1027 · DOI · Paper page
- 10.1093/nar/gkm952 · DOI
- 10.1093/nar/gkj112 · DOI · Paper page
- 10.1093/nar/gkh023 · DOI
- 10.1039/c5mb00415b · DOI
- 10.1093/emboj/cdf476 · DOI
- 10.1016/j.cell.2008.02.019 · DOI
- 10.1016/S1534-5807(03)00227-2 · DOI
- 10.1101/gad.1310605 · DOI
- 10.1126/science.1109020 · DOI · Paper page
- 10.1016/j.ydbio.2004.02.019 · DOI
- 10.1038/ng1590 · DOI · Paper page
- 10.1155/2014/782490 · DOI
- 10.1128/JVI.77.18.9852-9861.2003 · DOI · Paper page
- 10.1126/science.2157286 · DOI · Paper page
- 10.1128/JVI.00078-10 · DOI · Paper page
- 10.1128/JVI.00703-10 · DOI
- 10.3892/ol.2015.3080 · DOI
- 10.1016/j.molonc.2012.09.006 · DOI
- 10.1038/nature03702 · DOI
- 10.1038/ng.2007.30 · DOI
- 10.1002/hed.21475 · DOI
- 10.1186/s12885-015-1888-3 · DOI
- 10.1038/bjc.2011.457 · DOI
- 10.1158/1940-6207.CAPR-13-0121 · DOI
- 10.1016/j.ajpath.2014.08.004 · DOI
- 10.4161/cc.9.13.12061 · DOI
- 10.1128/MCB.01372-09 · DOI
- 10.1016/j.molcel.2007.05.017 · DOI
- 10.4161/cc.6.13.4436 · DOI
- 10.1158/0008-5472.CAN-08-1569 · DOI
- 10.1371/journal.pone.0010615 · DOI
- 10.1038/nature08199 · DOI
- 10.3390/ijms160612773 · DOI
- 10.1126/scisignal.2000594 · DOI · Paper page
- 10.1038/onc.2012.424 · DOI · Paper page
- 10.1128/jvi.65.1.473-478.1991 · DOI · Paper page
- 10.1155/2014/289548 · DOI
- 10.1016/0306-9877(95)90228-7 · DOI
- 10.1186/gb-2009-10-3-r25 · DOI · Paper page
- 10.1093/bioinformatics/btp120 · DOI
- 10.1093/bioinformatics/btp352 · DOI · Paper page
- 10.1186/gb-2010-11-3-r25 · DOI · Paper page
Cited by
Basukala, O., & Banks, L. (2021) · Viruses · doi:10.3390/v13101892 · Cited by 137
Metadata
- Authors
- Harden, M. E., Prasad, N., Griffiths, A., & Munger, K.
- Affiliations
- Program in Virology, Division of Medical Sciences, Harvard Medical School, Boston, Massachusetts, USA
- Genomic Services Laboratory, HudsonAlpha Institute for Biotechnology, Huntsville, Alabama, USA
- Department of Virology and Immunology, Texas Biomedical Research Institute, San Antonio, Texas, USA
- Department of Developmental, Molecular and Chemical Biology, Tufts University School of Medicine, Boston, Massachusetts, USA
- Venue
- mBio
- Publisher
- American Society for Microbiology
- Published
- 2017-03-08
- Volume
- 8
- Issue
- 1
- ISSN
- 2161-2129
- 2150-7511
- PMC
- PMC5210503
- Cited by
- 64
- References
- 8
- Language
- en
- Funders
- HHS | NIH | National Cancer Institute (5F31CA180516-02, 5R01CA066980-22)
About these checks
Registry, retraction, Cites and statistics results are computed, not judged, with one exception: a printed reference that no index lists is read once by a model before it counts as a citation error. Claims are extracted by a model and kept only when their quote appears verbatim in the text; each cited source is then checked, with a model’s help, for whether it says what the claim relies on. Those verdicts can be wrong — read the claim’s quote and the cited source before relying on one.
Statistics and arithmetic are recomputed, not judged.
Confidence bands are shown only for fields calibrated on our annotated test set. None is calibrated yet, so no band is shown.
What counts as a claim ›How we measure confidence ›How we check this ›
Are you an author, or do you see a problem with this page? Request a review
