

The DOI matches its Crossref record; 57 of the 58 references it cites were found in a registry or an index.
Host lifestyle affects human microbiota on daily timescales
Open accessAbstract
BACKGROUND: Disturbance to human microbiota may underlie several pathologies. Yet, we lack a comprehensive understanding of how lifestyle affects the dynamics of human-associated microbial communities. RESULTS: Here, we link over 10,000 longitudinal measurements of human wellness and action to the daily gut and salivary microbiota dynamics of two individuals over the course of one year. These time series show overall microbial communities to be stable for months. However, rare events in each subjects’ life rapidly and broadly impacted microbiota dynamics. Travel from the developed to the developing world in one subject led to a nearly two-fold increase in the Bacteroidetes to Firmicutes ratio, which reversed upon return. Enteric infection in the other subject resulted in the permanent decline of most gut bacterial taxa, which were replaced by genetically similar species. Still, even during periods of overall community stability, the dynamics of select microbial taxa could be associated with specific host behaviors. Most prominently, changes in host fiber intake positively correlated with next-day abundance changes among 15% of gut microbiota members. CONCLUSIONS: Our findings suggest that although human-associated microbial communities are generally stable, they can be quickly and profoundly altered by common human actions and experiences.
Overview
The claims and statistics of this paper haven’t been checked yet.
Run the check — free, no account needed. It reads the open-access text and checks the sources it cites.
Integrity signals
Registry
Cites
Statistics
Figures
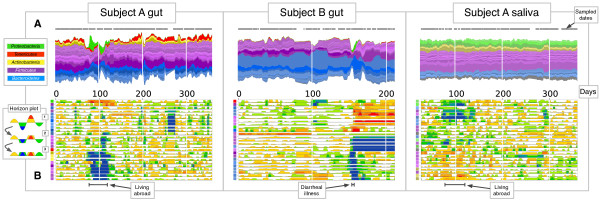
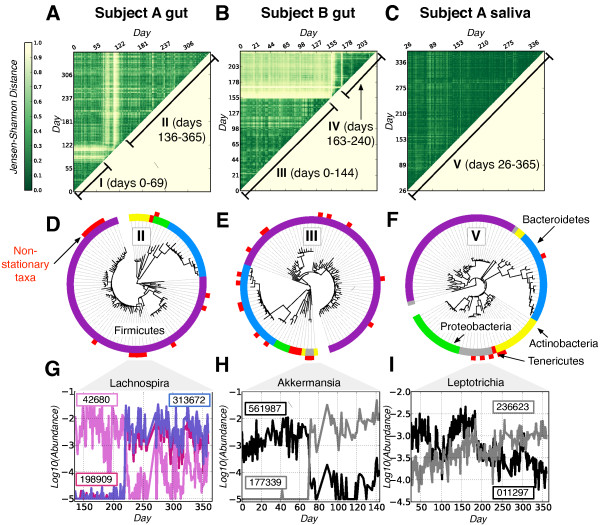
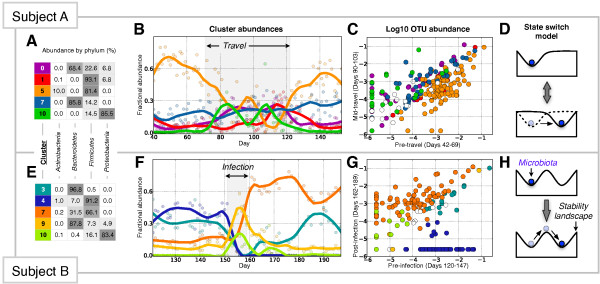
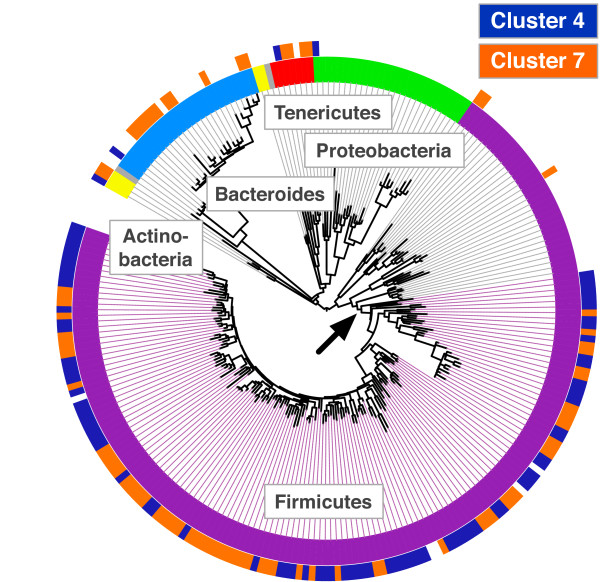
Verification
Claims the paper makes
The claims and statistics of this paper haven’t been checked yet.
Run the check — free, no account needed. It reads the open-access text and checks the sources it cites.
Claims other papers make about this one
Each is checked against this paper’s own text: does it say what the citing paper says it does?
The source backs part of the claim, not all of it — or backs it for a different population, condition or comparison.
In the citing paper
“Short-term, dramatic dietary interventions have demonstrated the ability to alter microbiota diversity quickly in humans [5].”
From Effect of Diet on the Gut Microbiota: Rethinking Intervention Duration (2019) · cites this paper as [5]
Experimental — accuracy not yet measuredIn the citing paper
“Likewise, mouse models have indicated that manipulation of macronutrient intake can consistently shift the composition of the gut microbiota within the span of a day [5,6,18,19].”
From Effect of Diet on the Gut Microbiota: Rethinking Intervention Duration (2019) · cites this paper as [5]
In the citing paper
“One longitudinal study involving daily gut microbiota investigations of two individuals over the course of a year found that changes in fibre intake are positively correlated with a change in abundance of 15% of the microbial community the following day [5].”
From Effect of Diet on the Gut Microbiota: Rethinking Intervention Duration (2019) · cites this paper as [5]
Self-check
Percentages, sums and reported differences re-computed from the paper’s own numbers.
The self-check needs the paper’s full text.
Citations
Cites
QIIME allows analysis of high-throughput community sequencing data
Caporaso, J. G., Kuczynski, J., Stombaugh, J., Bittinger, K., Bushman, F. D., Costello, E. K., Fierer, N., Peña, A. G., Goodrich, J. K., Gordon, J. I., et al. (2010) · Nature Methods · doi:10.1038/nmeth.f.303 · Cited by 34,887
Search and clustering orders of magnitude faster than BLAST
Edgar, R. C. (2010) · Bioinformatics · doi:10.1093/bioinformatics/btq461 · Cited by 21,098
An obesity-associated gut microbiome with increased capacity for energy harvest
Turnbaugh, P. J., Ley, R. E., Mahowald, M. A., Magrini, V., Mardis, E. R., & Gordon, J. I. (2006) · Nature · doi:10.1038/nature05414 · Cited by 12,444
Greengenes, a Chimera-Checked 16S rRNA Gene Database and Workbench Compatible with ARB
DeSantis, T. Z., Hugenholtz, P., Larsen, N., Rojas, M., Brodie, E. L., Keller, K., Huber, T., Dalevi, D., Hu, P., & Andersen, G. L. (2006) · Applied and Environmental Microbiology · doi:10.1128/aem.03006-05 · Cited by 10,891
Diet rapidly and reproducibly alters the human gut microbiome
David, L. A., Maurice, C. F., Carmody, R. N., Gootenberg, D. B., Button, J. E., Wolfe, B. E., Ling, A. V., Devlin, A. S., Varma, Y., Fischbach, M. A., et al. (2014) · Nature · doi:10.1038/nature12820 · Cited by 10,100
Self-citationGlobal patterns of 16S rRNA diversity at a depth of millions of sequences per sample
Caporaso, J. G., Lauber, C. L., Walters, W. A., Berg-Lyons, D., Lozupone, C., Turnbaugh, P. J., Fierer, N., & Knight, R. D. (2010) · Proceedings of the National Academy of Sciences · doi:10.1073/pnas.1000080107 · Cited by 9,944
Human gut microbes associated with obesity
Ley, R. E., Turnbaugh, P. J., Klein, S., & Gordon, J. I. (2006) · Nature · doi:10.1038/4441022a · Cited by 8,785
Human gut microbiome viewed across age and geography
Yatsunenko, T., Rey, F. E., Manary, M. J., Trehan, I., Dominguez-Bello, M. G., Contreras, M., Magris, M., Hidalgo, G., Baldassano, R. N., Anokhin, A. P., et al. (2012) · Nature · doi:10.1038/nature11053 · Cited by 7,815
Statsmodels: Econometric and Statistical Modeling with Python
Seabold, S., & Perktold, J. (2010) · Proceedings of the Python in Science Conferences · doi:10.25080/majora-92bf1922-011 · Cited by 6,968
Linking long-term dietary patterns with gut microbial enterotypes
Wu, G. D., Chen, J., Hoffmann, C., Bittinger, K., Chen, Y.-Y., Keilbaugh, S. A., Bewtra, M., Knights, D., Walters, W. A., Knight, R., et al. (2011) · Science · doi:10.1126/science.1208344 · Cited by 6,513
Cited by
Sorted by citations
Items 901–951 of 951
Mohammadi, T., & Mohebalizadeh, M. (2025) · Springer eBooks · doi:10.1007/978-3-032-00759-9_373
Macroecological Laws Can Naturally Arise from Chaotic Internal Species DynamicsPreprint
Tchourine, K., Carballo‐Pacheco, M., & Vitkup, D. (2025) · bioRxiv (Cold Spring Harbor Laboratory) · doi:10.1101/2025.10.05.680583 · Cited by 1
Inference of causal interaction networks of gut microbiota using transfer entropy
Park, C., Kim, J., & Lee, J. (2025) · BMC Genomics · doi:10.1186/s12864-025-12384-1
“One year time-series of gut microbiota for two people have been obtained in David et al. [31].”
InfluentialAdditional file 1 of Differential richness inference for 16S rRNA marker gene surveys
Kumar, M. S. B., SLUD, E. V., Hehnly, C., Zhang, L., Broach, J., Irizarry, R. A., Schiff, S. J., & Paulson, J. N. (2022) · Figshare · doi:10.6084/m9.figshare.20416536
Additional file 3 of Corncob structures in dental plaque reveal microhabitat taxon specificity
Morillo-López, V., Sjaarda, A., Islam, I., Borisy, G. G., & Mark Welch, J. L. (2022) · Figshare · doi:10.6084/m9.figshare.20968170
Kenney, T., Gao, J., & Gu, H. (2020) · Figshare · doi:10.6084/m9.figshare.13082973
Additional file 2 of Examination of hydrogen cross-feeders using a colonic microbiota model
Smith, N. W., Shorten, P. R., Altermann, E., Roy, N. C., & McNabb, W. C. (2021) · Figshare · doi:10.6084/m9.figshare.13535041
Watson, A. R., Füssel, J., Veseli, I., DeLongchamp, J. Z., Silva, M., Trigodet, F., Lolans, K., Shaiber, A., Fogarty, E., Runde, J. M., et al. (2023) · Figshare · doi:10.6084/m9.figshare.22649422
Watson, A. R., Füssel, J., Veseli, I., DeLongchamp, J. Z., Silva, M., Trigodet, F., Lolans, K., Shaiber, A., Fogarty, E., Runde, J. M., et al. (2023) · Figshare · doi:10.6084/m9.figshare.22649383
Wang, Y., Ye, J., Ju, F., Liu, L., Boyd, J. A., Deng, Y., Parks, D. H., Jiang, X., Yin, X., Woodcroft, B. J., et al. (2021) · Figshare · doi:10.6084/m9.figshare.16756015
Additional file 2 of Differential richness inference for 16S rRNA marker gene surveys
Kumar, M. S. B., SLUD, E. V., Hehnly, C., Zhang, L., Broach, J., Irizarry, R. A., Schiff, S. J., & Paulson, J. N. (2022) · Figshare · doi:10.6084/m9.figshare.20416539
Additional file 5 of Differential richness inference for 16S rRNA marker gene surveys
Kumar, M. S. B., SLUD, E. V., Hehnly, C., Zhang, L., Broach, J., Irizarry, R. A., Schiff, S. J., & Paulson, J. N. (2022) · Figshare · doi:10.6084/m9.figshare.20416548
Watson, A. R., Füssel, J., Veseli, I., DeLongchamp, J. Z., Silva, M., Trigodet, F., Lolans, K., Shaiber, A., Fogarty, E., Runde, J. M., et al. (2023) · Figshare · doi:10.6084/m9.figshare.22649395
Additional file 4 of Differential richness inference for 16S rRNA marker gene surveys
Kumar, M. S. B., SLUD, E. V., Hehnly, C., Zhang, L., Broach, J., Irizarry, R. A., Schiff, S. J., & Paulson, J. N. (2022) · Figshare · doi:10.6084/m9.figshare.20416545
Additional file 1 of Examination of hydrogen cross-feeders using a colonic microbiota model
Smith, N. W., Shorten, P. R., Altermann, E., Roy, N. C., & McNabb, W. C. (2021) · Figshare · doi:10.6084/m9.figshare.13535038
Abe, K., Hirayama, M., Ohno, K., & Shimamura, T. (2021) · Figshare · doi:10.6084/m9.figshare.13719025
Hoang, T., Kim, M. J., Park, J. W., Jeong, S.-Y., Lee, J., & Shin, A. (2022) · Figshare · doi:10.6084/m9.figshare.20070837
Additional file 2 of Corncob structures in dental plaque reveal microhabitat taxon specificity
Morillo-López, V., Sjaarda, A., Islam, I., Borisy, G. G., & Mark Welch, J. L. (2022) · Figshare · doi:10.6084/m9.figshare.20968167
Additional file 3 of Differential richness inference for 16S rRNA marker gene surveys
Kumar, M. S. B., SLUD, E. V., Hehnly, C., Zhang, L., Broach, J., Irizarry, R. A., Schiff, S. J., & Paulson, J. N. (2022) · Figshare · doi:10.6084/m9.figshare.20416542
Additional file 7 of Differential richness inference for 16S rRNA marker gene surveys
Kumar, M. S. B., SLUD, E. V., Hehnly, C., Zhang, L., Broach, J., Irizarry, R. A., Schiff, S. J., & Paulson, J. N. (2022) · Figshare · doi:10.6084/m9.figshare.20416554
Additional file 6 of Differential richness inference for 16S rRNA marker gene surveys
Kumar, M. S. B., SLUD, E. V., Hehnly, C., Zhang, L., Broach, J., Irizarry, R. A., Schiff, S. J., & Paulson, J. N. (2022) · Figshare · doi:10.6084/m9.figshare.20416551
Metabolic crossroads: Integrating ROS, SCF, and gut microbiota in cancer
Parihar, B. O., Kumar, A., & Yadav, A. K. (2025) · Elsevier eBooks · doi:10.1016/b978-0-443-33459-7.00011-9
Faust, K. (2016) · VUBIR (Vrije Universiteit Brussel)
Hatayama, K., Ebara, A., Hirano, C., Kono, K., Masuyama, H., & Ashikari, I. (2026) · Nutrients · doi:10.3390/nu18020219
“However, these changes were reversed within two weeks of returning from travel [42].”
Petakh, P., Halabitska, I., Petrecka, H., Huber, W., & Kamyshnyi, O. (2026) · The Journal of Nutritional Biochemistry · doi:10.1016/j.jnutbio.2026.110267
The macroecological dynamics of sojourn trajectories in the human gut microbiome
Shoemaker, W. R., & Grilli, J. (2026) · mSystems · doi:10.1128/msystems.01221-25
“…the CV (solely a function of σ i ), a relationship existed which could be captured using predictions derived from the SLM. 's rank Spearman correlation coefficient was used to assess the statistical significance of each relationship and predictions were obtained using ASV-specific values of σ i .”
Zhang, W., Han, N., Zhang, T., Qiang, Y., Peng, X., Li, X. P., & Kan, B. (2026) · ISME Communications · doi:10.1093/ismeco/ycag046
“Although daily lifestyle can drive rapid community shifts [9], advances in metagenomic profiling have unveiled another layer of complexity: strain-level dynamics that govern microbial persistence and turnover [10–12].”
Gut-brain axis in metabolic control
Singh, S. P., Ghosh, S., Singh, D. K. K., & Sinha, J. K. (2026) · Elsevier eBooks · doi:10.1016/b978-0-443-32848-0.00024-8
Shouman, S., Saif, N. A., Ahmed, S. M., Eltaher, S. S., Shehata, M., Abdelrahman, K., Elhadidy, M., & El‐Badri, N. (2026) · Stem cell biology and regenerative medicine · doi:10.1007/978-3-032-12705-1_1
Jacqueline, C. M. (2017) · theses.fr (ABES) · doi:10.70675/d539649bz1298z4794zab28z3d5d7540c85f
Deciphering in vivo efficacy of virulent phages in the mammalian gut
Lourenço, M. (2019) · theses.fr (ABES) · doi:10.70675/c305c7b8z2178z4a27z839fzc54f45a70648
Genome-wide effects of T4 phage Ndd protein expression on the Escherichia coli nucleoid
Foutel-Rodier, T. (2021) · theses.fr (ABES) · doi:10.70675/a5e4bd2az13bez477cz92aez8c90736cad60
Comparative genomic analysis in taxonomy : classification and reclassification of bacterial species
Zgheib, R. (2021) · theses.fr (ABES) · doi:10.70675/43888f17z8ddfz4c18za819zc86b2288b819
Diet-derived microbial metabolites modulate stress-responsive gene expression in germ-free zebrafish
Capistrano, J. D. R., Ketheeswaranathan, B., Horn, M., Tran, P. N. G., Ball, T., Chirmade, S., Vancuren, S. J., Ma, D. W. L., Walton, K., Allen‐Vercoe, E., et al. (2026) · Gut Microbiome · doi:10.64898/2026.05.04.722778
“Although we could not perform statistical tests for each donor due to the limited number of biological replicates, we did observe some trends (Supplementary Figures 2, 3).”
Stochastic colonization and host-to-host transmission shape gut bacterial variabilityPreprint
Lu, C. Y., Tashev, S. A., Pessoa, P., Kruithoff, R., Shepherd, D. P., & Pressé, S. (2026) · bioRxiv (Cold Spring Harbor Laboratory) · doi:10.64898/2026.05.11.724410 · Cited by 2
“While previous studies of gut microbiota dynamics have sought to link bacterial composition to host health using measurements within individual hosts [24–26], dysbiosis and related pathologies are often initiated by rare infection from the environment.”
Rivera, D. A., Lara-Guzmán, O. J., Villota-Salazar, N. A., Sierra, J. A., Muñoz-Durango, K., & Escobar, J. S. (2026) · Applied Microbiology and Biotechnology · doi:10.1007/s00253-026-13844-8
“This is consistent with previous studies showing that human-associated microbial communities are generally stable, although they can be quickly and pro-foundly altered by changes in lifestyle and disease (David et al. 2014a, b; Jie et al. 2017).”
Age influences serum immune indices and gut microbiota composition in adult broilers
Chen, J., Xiong, Z., Yu, C., 王降仙, Yu, C., Zhu, S., Peng, H., Yang, L., Hu, C., Xiong, X., et al. (2026) · Frontiers in Microbiology · doi:10.3389/fmicb.2026.1802596
“One possible interpretation of this observation is that hepatic synthetic function may decline with age, which would be consistent with the age-related decline in organ metabolic function reported in mammals (David et al., 2014).”
Association between daidzein metabolism to equol and fecal bile acid profiles in young women
Mizuno, N., Ashida, H., & Toda, T. (2026) · Food & Function · doi:10.1039/d6fo01483f
Design and analysis strategies for robust microbiome ageing research
Olenik, M., Güderer, İ., Wang, Y., Alvi, T., Pandey, P., & Dönertaş, H. M. (2026) · FEBS Letters · doi:10.1002/1873-3468.70397
Bell, A. G., West, K., Frost, G. S., Wist, J., Holmes, E. C., & Nicholson, J. K. (2026) · bioRxiv (Cold Spring Harbor Laboratory) · doi:10.64898/2026.07.22.739782
“Clinical presentation and co-occurring conditions vary across development, while biological profiles may also vary within individuals over time 2,6,7 .”
Gut microbiome modulation for military resilience and performance
Murphy, E. F., Templeman, I., Rimmer, J. E., & Harding, S. V. (2026) · Frontiers in Microbiomes · doi:10.3389/frmbi.2026.1828981
Addressing Overlooked Variables in Preclinical Fracture Repair Research for Improved Translation
Capobianco, C., Schmidt‐Bleek, K., Haffner‐Luntzer, M., Bahney, C. S., Roberts, J. L., Silva, M. J., & Lang, A. (2026) · Journal of Orthopaedic Research® · doi:10.1002/jor.70268
“Despite considerable inter‐individual variation, the gut microbiome remains relatively stable throughout an individual's lifetime in the absence of major lifestyle changes, such as moving abroad [63].”
CypA is a molecular barrier to HIV emergence from Eastern chimpanzeesPreprint
Young, M. J., Cotera, F., Gill, C. C. C., Lewis, J. A., Whitby, F. G., Abdellatif, A., Rocha, J. L., Singer, M., Nalls, M. A., Faghri, F., et al. (2026) · bioRxiv (Cold Spring Harbor Laboratory) · doi:10.64898/2026.09.08.747897
LGTM: Gaussian process modulated neural topic modeling for longitudinal microbiome
Yuan, X., Arany, Á., Formanek, A., Moreau, Y., Lähdesmäki, H. J., & Vatanen, T. (2026) · Gut Microbes · doi:10.1080/19490976.2026.2741488
“Third, longitudinal sampling is often sparse and irregular due to practical constraints common in gut microbiome studies, leading to missing data at various timepoints for many subjects.”
Çapaş, M., Bedir, E. Y., Ergan, K., Gedik, B. A., Dener, B., & Ağagündüz, D. (2026) · Frontiers in Nutrition · doi:10.3389/fnut.2026.1913324
Metadata
- Authors
- David, L. A., Materna, A. C., Friedman, J., Campos-Baptista, M. I., Blackburn, M. C., Perrotta, A., Erdman, S. E., & Alm, E. J.
- Affiliations
- Harvard University (US)
- Qiagen (Denmark) (DK)
- Massachusetts Institute of Technology (US)
- École Polytechnique Fédérale de Lausanne (CH)
- Broad Institute (US)
- Corresponding author
- Alm, Eric J
- Venue
- Genome biology
- Published
- 2014-07-25
- Volume
- 15
- Issue
- 7
- Pages
- R89-R89
- ISSN
- 1465-6906 (ISSN-L)
- 1474-760X
- PMC
- PMC4405912
- OpenAlex
- W2103088074
- Cited by
- 950
- References
- 58
- Citations by year
- 2026: 27 · 2025: 60 · 2024: 74 · 2023: 80 · 2022: 117 · 2021: 95 · 2020: 105 · 2019: 85 · 2018: 85 · 2017: 98 · 2016: 65 · 2015: 52 · 2014: 5
- FWCI
- 30.09
- Type
- journal article
- Language
- en
- Update notices
- correction (2016-05-31)
- Open access
- gold
- doi.org
- Locations
- Genome biology (publishedVersion, cc-by)
- PubMed Central (publishedVersion, cc-by)
- PubMed (publishedVersion)
- DSpace@MIT (Massachusetts Institute of Technology) (submittedVersion, cc-by)
- DSpace@MIT (Massachusetts Institute of Technology) (submittedVersion, cc-by-nc)
- Infoscience (Ecole Polytechnique Fédérale de Lausanne) (submittedVersion)
- Infoscience (Ecole Polytechnique Fédérale de Lausanne) (submittedVersion, cc-by-nc-nd)
- Funders
- National Science Foundation (0821391)
- Topics
- Life Sciences › Biochemistry, Genetics and Molecular Biology › Molecular Biology › Gut microbiota and health
- Health Sciences › Dentistry › Periodontics › Oral microbiology and periodontitis research
- Physical Sciences › Environmental Science › Ecology › Microbial Community Ecology and Physiology
- Keywords
- human microbiota, gut microbiota, salivary microbiota, host lifestyle, microbiota dynamics, daily fluctuations, microbial community stability, Firmicutes/Bacteroidetes ratio, gastrointestinal infections, dietary fiber intake, host behavior
- MeSH terms
- Bacteria, Bacterial Infections, Developing Countries, Feces, Humans, Life Style, Longitudinal Studies, Male, Phylogeny, Saliva, Genetic Variation, Sequence Analysis, DNA, Developed Countries, High-Throughput Nucleotide Sequencing, Microbiota
About these checks
Registry, retraction, Cites and statistics results are computed, not judged, with one exception: a printed reference that no index lists is read once by a model before it counts as a citation error. Claims are extracted by a model and kept only when their quote appears verbatim in the text; each cited source is then checked, with a model’s help, for whether it says what the claim relies on. Those verdicts can be wrong — read the claim’s quote and the cited source before relying on one.
Statistics and arithmetic are recomputed, not judged.
Confidence bands are shown only for fields calibrated on our annotated test set. None is calibrated yet, so no band is shown.
What counts as a claim ›How we measure confidence ›How we check this ›
Are you an author, or do you see a problem with this page? Request a review
