

The DOI matches its Crossref record; 48 of the 49 references it cites were found in a registry or an index.
DeepSurv: personalized treatment recommender system using a Cox proportional hazards deep neural network
Open accessAbstract
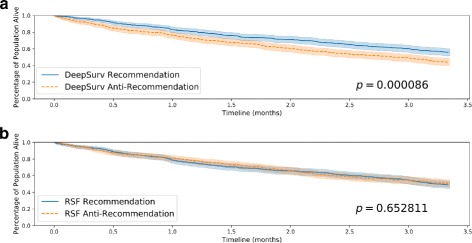
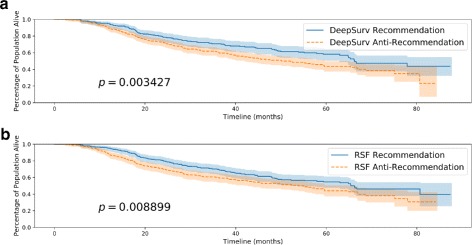
BACKGROUND: Medical practitioners use survival models to explore and understand the relationships between patients' covariates (e.g. clinical and genetic features) and the effectiveness of various treatment options. Standard survival models like the linear Cox proportional hazards model require extensive feature engineering or prior medical knowledge to model treatment interaction at an individual level. While nonlinear survival methods, such as neural networks and survival forests, can inherently model these high-level interaction terms, they have yet to be shown as effective treatment recommender systems. METHODS: We introduce DeepSurv, a Cox proportional hazards deep neural network and state-of-the-art survival method for modeling interactions between a patient's covariates and treatment effectiveness in order to provide personalized treatment recommendations. RESULTS: We perform a number of experiments training DeepSurv on simulated and real survival data. We demonstrate that DeepSurv performs as well as or better than other state-of-the-art survival models and validate that DeepSurv successfully models increasingly complex relationships between a patient's covariates and their risk of failure. We then show how DeepSurv models the relationship between a patient's features and effectiveness of different treatment options to show how DeepSurv can be used to provide individual treatment recommendations. Finally, we train DeepSurv on real clinical studies to demonstrate how it's personalized treatment recommendations would increase the survival time of a set of patients. CONCLUSIONS: The predictive and modeling capabilities of DeepSurv will enable medical researchers to use deep neural networks as a tool in their exploration, understanding, and prediction of the effects of a patient's characteristics on their risk of failure.
Overview
The claims and statistics of this paper haven’t been checked yet.
Run the check — free, no account needed. It reads the open-access text and checks the sources it cites.
Integrity signals
Registry
Cites
Statistics
Figures
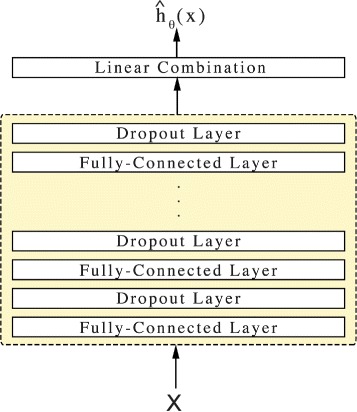
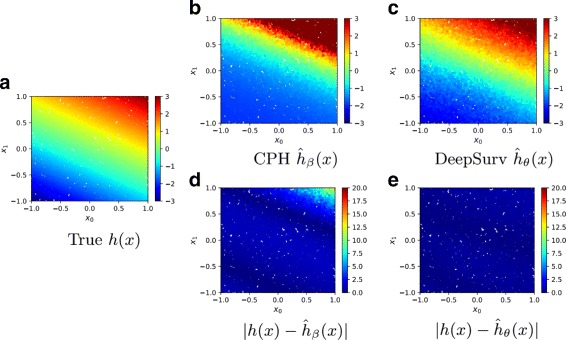
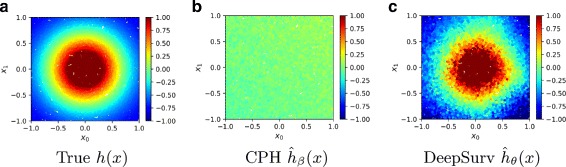
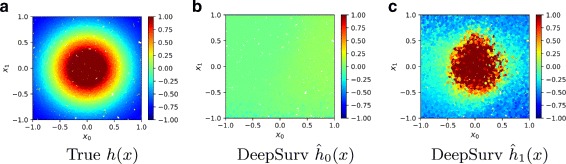
Verification
Claims the paper makes
The claims and statistics of this paper haven’t been checked yet.
Run the check — free, no account needed. It reads the open-access text and checks the sources it cites.
Self-check
Percentages, sums and reported differences re-computed from the paper’s own numbers.
The self-check needs the paper’s full text.
Citations
Cites
Adam: A Method for Stochastic Optimization
Kingma, D. P., & Ba, J. (2014) · arXiv · doi:10.48550/arxiv.1412.6980 · Cited by 98,946 · cited 1×
“more than one hidden layer) and apply modern techniques such as weight decay regularization, Rectified Linear Units (ReLU) [17] with batch normalization [18], Scaled Exponential Linear Units (SELU) [19], dropout [20], gradient descent optimization algorithms (Stochastic Gradient Descent and Adaptive Moment Estimation…”
MethodAn Introduction to the Bootstrap
Efron, B., & Tibshirani, R. J. (1994) · doi:10.1201/9780429246593 · Cited by 40,500
(2014) · Cited by 33,419
Batch Normalization: Accelerating Deep Network Training by Reducing Internal Covariate Shift
Ioffe, S., & Szegedy, C. (2015) · arXiv · doi:10.48550/arxiv.1502.03167 · Cited by 27,818
Regression Models and Life-Tables
Cox, D. R. (1992) · Springer Series in Statistics · doi:10.1007/978-1-4612-4380-9_37 · Cited by 26,297 · cited 1×
“iables in outcomes such as death or cancer recurrence and subsequently inform patients of their treatment options [1, 2, 3, 4]. One standard survival model is the Cox proportional hazards model (CPH) [5]. The CPH arXiv:1606.00931v3 [stat.ML] 9 Aug 2017 is a semiparametric model that calculates the effects of observed…”
MethodAn Introduction to the Bootstrap
Efron, B., & Tibshirani, R. J. (1993) · doi:10.1007/978-1-4899-4541-9 · Cited by 21,230
(2010) · International Conference on Machine Learning · Cited by 13,995
Modeling Survival Data: Extending the Cox Model
Therneau, T. M., & Grambsch, P. M. (2000) · Statistics for Biology and Health · doi:10.1007/978-1-4757-3294-8 · Cited by 8,674
(2012) · Cited by 8,009
The genomic and transcriptomic architecture of 2,000 breast tumours reveals novel subgroups
METABRIC Group, Curtis, C., Shah, S. P., Chin, S.-F., Turashvili, G., Rueda, O. M., Dunning, M. J., Speed, D., Lynch, A. G., Samarajiwa, S., et al. (2012) · Nature · doi:10.1038/nature10983 · Cited by 6,097 · cited 1×
“First, we simulate clinical treatment data by including an additional covariate to the simulated data from Section 4.1.2.”
MethodInfluential
Cited by
Sorted by citations
Items 101–200 of 1,000
Synthetic data for privacy-preserving clinical risk prediction
Qian, Z., Callender, T., Cebere, B., Janes, S. M., Navani, N., & van der Schaar, M. (2024) · Scientific Reports · doi:10.1038/s41598-024-72894-y · Cited by 75
CapSurv: Capsule Network for Survival Analysis With Whole Slide Pathological Images
Tang, B., Li, A., Li, B., & Wang, M. (2019) · IEEE Access · doi:10.1109/access.2019.2901049 · Cited by 66
PathologyGAN: Learning Deep Representations of Cancer Tissue
Quiros, A. C., Murray‐Smith, R., & Yuan, K. (2020) · ENLIGHTEN (Jurnal Bimbingan dan Konseling Islam) · Cited by 62
Westerlund, A. M., Hawe, J. S., Heinig, M., & Schunkert, H. (2021) · International Journal of Molecular Sciences · doi:10.3390/ijms221910291 · Cited by 63
Prediction and interpretation of cancer survival using graph convolution neural networks
Ramirez, R., Chiu, Y., Zhang, S., Ramirez, J., Chen, Y., Huang, Y., & Jin, Y.-F. (2021) · Methods · doi:10.1016/j.ymeth.2021.01.004 · Cited by 61
Nezhad, M. Z., Sadati, N., Yang, K., & Zhu, D. (2018) · Expert Systems with Applications · doi:10.1016/j.eswa.2018.07.070 · Cited by 65
Qu, W., Tian, M., Lü, H., Zhou, Y., Liu, W., Tang, Z., Yao, Z., Huang, R., Zhu, G., Jiang, X., et al. (2023) · Hepatology International · doi:10.1007/s12072-023-10511-2 · Cited by 60
Machine learning for radiomics-based multimodality and multiparametric modeling
Wei, L., Osman, S. O. S., Hatt, M., & Naqa, I. E. (2019) · The Quarterly Journal of Nuclear Medicine and Molecular Imaging · doi:10.23736/s1824-4785.19.03213-8 · Cited by 64
Development of a Spine X-Ray-Based Fracture Prediction Model Using a Deep Learning Algorithm
Kong, S. H., Lee, J.-W., Bae, B., Sung, J. K., Jung, K. H., Kim, J. H., & Shin, C. S. (2022) · Endocrinology and Metabolism · doi:10.3803/enm.2022.1461 · Cited by 59
Arai, J., Aoki, T., Sato, M., Niikura, R., Suzuki, N., Ishibashi, R., Tsuji, Y., Yamada, A., Hirata, Y., Ushiku, T., et al. (2022) · Gastrointestinal Endoscopy · doi:10.1016/j.gie.2021.12.033 · Cited by 59
Zhong, L., Fang, X., Dong, D., Peng, H., Fang, M., Huang, C., He, B., Lin, L. C., Ma, J., Tang, L., et al. (2020) · Radiotherapy and Oncology · doi:10.1016/j.radonc.2020.06.050 · Cited by 56
Failure modeling of water distribution pipelines using meta-learning algorithms
Almheiri, Z., Meguid, M. A., & Zayed, T. M. (2021) · Water Research · doi:10.1016/j.watres.2021.117680 · Cited by 57
Nigo, M., Rasmy, L., Mao, B., Kannadath, B. S., Xie, Z., & Zhi, D. (2024) · Nature Communications · doi:10.1038/s41467-024-46211-0 · Cited by 59
Starke, S., Leger, S., Zwanenburg, A., Leger, K., Lohaus, F., Linge, A., Schreiber, A., Kalinauskaitė, G., Tinhofer, I., Guberina, N., et al. (2020) · Scientific Reports · doi:10.1038/s41598-020-70542-9 · Cited by 57
Yang, X., Qiu, H., Wang, L., & Wang, X. (2023) · Journal of Medical Internet Research · doi:10.2196/44417 · Cited by 65
Li, T., Wu, H., & Wang, M. D. (2020) · Methods · doi:10.1016/j.ymeth.2020.07.008 · Cited by 55
A deep survival interpretable radiomics model of hepatocellular carcinoma patients
Wei, L., Owen, D., Rosen, B., Guo, X., Cuneo, K. C., Lawrence, T. S., Haken, R. K. T., & Naqa, I. E. (2021) · Physica Medica · doi:10.1016/j.ejmp.2021.02.013 · Cited by 55
High-Dimensional Survival Analysis: Methods and Applications
Salerno, S. M., & Li, Y. (2022) · Annual Review of Statistics and Its Application · doi:10.1146/annurev-statistics-032921-022127 · Cited by 66
Janßen, A., Bennis, F. C., & Mathôt, R. A. A. (2022) · Pharmaceutics · doi:10.3390/pharmaceutics14091814 · Cited by 57
TMO-Net: an explainable pretrained multi-omics model for multi-task learning in oncology
Wang, F.-A., Zhuang, Z., Gao, F., He, R., Zhang, S., Wang, L., Liu, J., & Li, Y. (2024) · Genome Biology · doi:10.1186/s13059-024-03293-9 · Cited by 51
“The prognosis prediction model was established with the Cox survival regression network [46] to predict the risk score of individual patients, and the model was trained with weak supervision method.”
MethodA machine learning approach to leveraging electronic health records for enhanced omics analysis
Mataraso, S. J., Espinosa, C. A., Seong, D., Reincke, S., Berson, E., Reiss, J., Kim, Y., Ghanem, M., Shu, C.-H., James, T., et al. (2025) · Nature Machine Intelligence · doi:10.1038/s42256-024-00974-9 · Cited by 53
“…and the superior ability of COMET to predict days to the onset of labour. approaches have also been applied to traditional statistical frameworks, like the Cox proportional hazards model, which can be used to analyse time-to-event data, especially in datasets with censored patients 10 .”
A Fracture Risk Assessment Tool for High Resolution Peripheral Quantitative Computed Tomography
Whittier, D. E., Samelson, E. J., Hannan, M. T., Burt, L. A., Hanley, D. A., Biver, E., Szulc, P., Sornay‐Rendu, E., Merle, B., Chapurlat, R. D., et al. (2023) · Journal of Bone and Mineral Research · doi:10.1002/jbmr.4808 · Cited by 53
Ning, Z., Pan, W., Chen, Y., Xiao, Q., Zhang, X., Luo, J., Wang, J., & Zhang, Y. (2020) · Bioinformatics · doi:10.1093/bioinformatics/btaa056 · Cited by 53
Deep Learning-Based Recurrence Prediction of Atrial Fibrillation After Catheter Ablation.
Zhou, X., Nakamura, K., Sahara, N., Takagi, T., Toyoda, Y., Enomoto, Y., Hara, H., Noro, M., Sugi, K., Moroi, M., et al. (2021) · Circulation Journal · doi:10.1253/circj.cj-21-0622 · Cited by 40
Lee, K.-S., Jang, J.-Y., Yu, Y.-D., Heo, J. S., Han, H.-S., Yoon, Y.-S., Kang, C. M., Hwang, H. K., & Kang, S. (2021) · International Journal of Surgery · doi:10.1016/j.ijsu.2021.106050 · Cited by 55
Wang, Z., & Sun, J. (2022) · ACM International Conference on Bioinformatics, Computational Biology, and Health Informatics (ACM-BCB) · doi:10.1145/3535508.3545521 · Cited by 74
Healthcare Applications of Artificial Intelligence and Analytics: A Review and Proposed Framework
Azzi, S., Gagnon, S., Ramirez, A., & Richards, G. (2020) · Applied Sciences · doi:10.3390/app10186553 · Cited by 59
Deng, Y., Bucchianico, A. D., & Pechenizkiy, M. (2019) · Reliability Engineering & System Safety · doi:10.1016/j.ress.2019.106727 · Cited by 53
Hanczar, B., Bourgeais, V., & Zehraoui, F. (2022) · BMC Bioinformatics · doi:10.1186/s12859-022-04807-7 · Cited by 54
Yin, Q., Chen, W., Zhang, C., & Wei, Z. (2022) · Laboratory Investigation · doi:10.1038/s41374-022-00801-y · Cited by 51
Mirabnahrazam, G., Ma, D., Beaulac, C., Lee, S., Popuri, K., Lee, H., Cao, J., Galvin, J. E., Wang, L., & Beg, M. F. (2022) · Neurobiology of Aging · doi:10.1016/j.neurobiolaging.2022.10.005 · Cited by 53
Prediction of conversion to Alzheimer’s disease using deep survival analysis of MRI images
Nakagawa, T., Ishida, M., Naito, J., Nagai, A., Yamaguchi, S., Onoda, K., & Initiative, O. B. O. T. A. D. N. (2020) · Brain Communications · doi:10.1093/braincomms/fcaa057 · Cited by 53
AiIoMT: IoMT-Based System-Enabled Artificial Intelligence for Enhanced Smart Healthcare Systems
Awotunde, J. B., Folorunso, S. O., Ajagbe, S. A., Garg, J., & Ajamu, G. J. (2022) · Springer eBooks · doi:10.1007/978-3-030-80928-7_10 · Cited by 54
Trinh, L., Mingo, S., Vanstrum, E. B., Sanford, D. I., Aastha, A., Ma, R., Nguyen, J. H., Liu, Y., & Hung, A. J. (2021) · European Urology Focus · doi:10.1016/j.euf.2021.04.001 · Cited by 50
CAMR: cross-aligned multimodal representation learning for cancer survival prediction
Wu, X., Shi, Y., Wang, M., & Li, A. (2023) · Bioinformatics · doi:10.1093/bioinformatics/btad025 · Cited by 51
Zhang, F., Zhong, L., Zhao, X., Dong, D., Yao, J., Wang, S., Liu, Y., Zhu, D. L., Wang, Y., Wang, G., et al. (2020) · Therapeutic Advances in Medical Oncology · doi:10.1177/1758835920971416 · Cited by 49
Hou, K., Chen, J.-R., Wang, Y.-C., Chiu, M.-H., Lin, S.-P., Mo, Y., Peng, S.-C., & Lu, C. (2022) · Cancers · doi:10.3390/cancers14153798 · Cited by 48
Darbandi, M. R., Darbandi, M., Darbandi, S., Bado, I., Hadizadeh, M. R., & Khorshid, H. R. K. (2024) · European Journal of Cancer · doi:10.1016/j.ejca.2024.114227 · Cited by 57
A scoping review of artificial intelligence applications in clinical trial risk assessment
Teodoro, D., Naderi, N., Yazdani, A., Zhang, B., & Bornet, A. (2025) · npj Digital Medicine · doi:10.1038/s41746-025-01886-7 · Cited by 56
“Only one study considered combined safety and ef fi cacy risks 47 .”
Jing, B., Deng, Y., Zhang, T., Hou, D., Li, B., Qiang, M., Liu, K., Ke, L., Li, T., Sun, Y., et al. (2020) · Computer Methods and Programs in Biomedicine · doi:10.1016/j.cmpb.2020.105684 · Cited by 46
Genome‐wide association study‐based deep learning for survival prediction
Sun, T., Wei, Y., Chen, W., & Ding, Y. (2020) · Statistics in Medicine · doi:10.1002/sim.8743 · Cited by 48
Comparison of time-to-event machine learning models in predicting oral cavity cancer prognosis
Adeoye, J., Hui, L., Koohi‐Moghadam, M., Tan, J., Choi, S. W., & Thomson, P. J. (2021) · International Journal of Medical Informatics · doi:10.1016/j.ijmedinf.2021.104635 · Cited by 46
Conformalized survival analysis
Candès, E. J., Lei, L., & Ren, Z. (2023) · Journal of the Royal Statistical Society Series B (Statistical Methodology) · doi:10.1093/jrsssb/qkac004 · Cited by 79
Jung, J., Crnovrsanin, N., Wirsik, N. M., Nienhüser, H., Peters, L., Popp, F., Schulze, A., Wagner, M., Müller-Stich, B. P., Büchler, M. W., et al. (2022) · Journal of Cancer Research and Clinical Oncology · doi:10.1007/s00432-022-04063-5 · Cited by 45
Zhang, Y., Wong, G., Mann, G. J., Müller, S., & Yang, J. Y. H. (2022) · GigaScience · doi:10.1093/gigascience/giac071 · Cited by 51
A weighted random survival forest
Utkin, L. V., Konstantinov, A. V., Chukanov, V. S., Kots, M. V., Ryabinin, M. A., & Мелдо, А. А. (2019) · Knowledge-Based Systems · doi:10.1016/j.knosys.2019.04.015 · Cited by 45
Extreme learning machine Cox model for high‐dimensional survival analysis
Wang, H., & Li, G. (2019) · Statistics in Medicine · doi:10.1002/sim.8090 · Cited by 43
Deep learning based prediction of prognosis in nonmetastatic clear cell renal cell carcinoma
Byun, S., Heo, T.-S., Choi, J.-M., Jeong, Y. S., Kim, Y. S., Lee, W. K., & Kim, C. (2021) · Scientific Reports · doi:10.1038/s41598-020-80262-9 · Cited by 44
Lee, B., Chun, S. H., Hong, J. H., Woo, I. S., Kim, S., Jeong, J. W., Kim, J. J., Lee, H. W., Na, S. J., Beck, K. S., et al. (2020) · Scientific Reports · doi:10.1038/s41598-020-58722-z · Cited by 43
Yu, H., Huang, T., Feng, B., & Lyu, J. (2022) · BMC Cancer · doi:10.1186/s12885-022-09217-9 · Cited by 43
Wu, W., Yan, J., Zhao, Y., Sun, Q., Zhang, H., Cheng, J., Liang, D., Chen, Y., Zhang, Z., & Li, Z. (2023) · Displays · doi:10.1016/j.displa.2023.102402 · Cited by 43
Lee, M. (2023) · Biology · doi:10.3390/biology12070893 · Cited by 48
Wu, X., Zhang, S., Zhang, Z., He, Z., Xu, Z., Wang, W., Jin, Z., You, J., Guo, Y., Zhang, L., et al. (2024) · npj Precision Oncology · doi:10.1038/s41698-024-00670-2 · Cited by 43
“Similar to the DeepSurv network 49 , the loss function was set to be the negative log partial likelihood: where N E =1 isthenumberofpatientswithanobservableeventand λ isthe ℓ 2 regularization parameter.”
ResultLopatina, A., Ropele, S., Sibgatulin, R., Reichenbach, J. R., & Güllmar, D. (2020) · Frontiers in Neuroscience · doi:10.3389/fnins.2020.609468 · Cited by 49
Role of Artificial Intelligence in Theranostics
Brosch-Lenz, J., Yousefirizi, F., Zukotynski, K., Beauregard, J.-M., Gaudet, V., Saboury, B., Rahmim, A., & Uribe, C. (2021) · PET Clinics · doi:10.1016/j.cpet.2021.06.002 · Cited by 42
Pai, R. K., Banerjee, I., Shivji, S., Jain, S., Hartman, D., Buchanan, D. D., Jenkins, M. A., Schaeffer, D. F., Rosty, C., Como, J., et al. (2022) · Gastroenterology · doi:10.1053/j.gastro.2022.08.025 · Cited by 44
Yu, Y., Lee, K.-S., Kim, J. M., Ryu, J. H., Lee, J. G., Lee, K., Kim, B., & Kim, D. (2022) · International Journal of Surgery · doi:10.1016/j.ijsu.2022.106838 · Cited by 42
Chapfuwa, P., Li, C., Mehta, N., Carin, L., & Henao, R. (2020) · ACM Conference on Health, Inference, and Learning (CHIL) · doi:10.1145/3368555.3384465 · Cited by 42
Kovalev, M. S., & Utkin, L. V. (2020) · Neural Networks · doi:10.1016/j.neunet.2020.08.007 · Cited by 43
Deep Learning-Based Survival Analysis for High-Dimensional Survival Data
Ha, I. D., Hao, L., Kim, J., & 권숙희 (2021) · Mathematics · doi:10.3390/math9111244 · Cited by 46
Park, S., Sham, J. G., Kawamoto, S., Blair, A. B., Rozich, N., Fouladi, D. F., Shayesteh, S., Hruban, R. H., He, J., Wolfgang, C. L., et al. (2021) · American Journal of Roentgenology · doi:10.2214/ajr.20.23490 · Cited by 42
Zhao, X., Liang, Y.-J., Zhang, X., Wen, D., Fan, W., Tang, L., Dong, D., Tian, J., & Mai, H. (2022) · European Journal of Nuclear Medicine and Molecular Imaging · doi:10.1007/s00259-022-05793-x · Cited by 42
Deep learning for the dynamic prediction of multivariate longitudinal and survival data
Lin, J. J., & Luo, S. (2022) · Statistics in Medicine · doi:10.1002/sim.9392 · Cited by 42
Twala, B. (2025) · Frontiers in Aging Neuroscience · doi:10.3389/fnagi.2025.1638340 · Cited by 49
“By simulating various scenarios and learning from patient feedback data, reinforcement learning algorithms can identify stimulation settings that maximize therapeutic benefits while minimizing side effects such as speech difficulties or mood disturbances (Katzman, 2018; Rosa et al., 2015).”
SAFE: A Neural Survival Analysis Model for Fraud Early Detection
Zheng, P., Yuan, S., & Wu, X. (2019) · Proceedings of the AAAI Conference on Artificial Intelligence · doi:10.1609/aaai.v33i01.33011278 · Cited by 41
Jamshidi, A., Pelletier, J., Labbe, A., Abram, F., Martel‐Pelletier, J., & Droit, A. (2021) · Arthritis Care & Research · doi:10.1002/acr.24601 · Cited by 41
Wang, M., Greenberg, M., Forkert, N. D., Chekouo, T., Afriyie, G., Ismail, Z., Smith, E. E., & Sajobi, T. T. (2022) · BMC Medical Research Methodology · doi:10.1186/s12874-022-01754-y · Cited by 41
Lin, J. J., Li, K., & Luo, S. (2020) · Statistical Methods in Medical Research · doi:10.1177/0962280220941532 · Cited by 40
Integrative survival analysis of breast cancer with gene expression and DNA methylation data
Bichindaritz, I., Liu, G., & Bartlett, C. (2021) · Bioinformatics · doi:10.1093/bioinformatics/btab140 · Cited by 41
Artificial intelligence for renal cancer: From imaging to histology and beyond
Kowalewski, K., Egen, L., Fischetti, C. E., Puliatti, S., Rivas, J. G., Taratkin, M. S., BELENCHON, I. R., Abate, M. A. S., Mühlbauer, J., Wessels, F., et al. (2022) · Asian journal of urology · doi:10.1016/j.ajur.2022.05.003 · Cited by 40
Yao, J., Cao, K., Hou, Y., Zhou, J. P., Xia, Y., Nogues, I., Song, Q., Jiang, H., Ye, X., Lu, J., et al. (2022) · Annals of Surgery · doi:10.1097/sla.0000000000005465 · Cited by 40
Zhang, Z., Huang, L., Li, J., & Wang, P. (2022) · BMC Bioinformatics · doi:10.1186/s12859-022-04657-3 · Cited by 39
Minami, T., Sato, M., Toyoda, H., Yasuda, S., Yamada, T., Nakatsuka, T., Enooku, K., Nakagawa, H., Fujinaga, H., Izumiya, M., et al. (2023) · Journal of Hepatology · doi:10.1016/j.jhep.2023.05.042 · Cited by 43
Liu, M., Liu, Y., Cui, H., Li, C., & Ma, J. (2023) · IEEE International Conference on Bioinformatics and Biomedicine (BIBM) · doi:10.1109/bibm58861.2023.10385897 · Cited by 42
Vollmer, A., Hartmann, S., Vollmer, M., Shavlokhova, V., Brands, R. C., Kübler, A. C., Wollborn, J., Hassel, F., Couillard‐Després, S., Lang, G. M., et al. (2024) · Scientific Reports · doi:10.1038/s41598-024-56172-5 · Cited by 39
Teshale, A. B., Htun, H. L., Vered, M., Owen, A. J., & Freak‐Poli, R. (2024) · Journal of Medical Systems · doi:10.1007/s10916-024-02087-7 · Cited by 42
“DeepSurv computes complex and non-linear features without a priori selection or domain expertise and is helpful for personalised risk prediction, even better than other linear and non-linear survival methods [78].”
BackgroundCox-PASNet: Pathway-based Sparse Deep Neural Network for Survival Analysis
Hao, J., Kim, Y. S., Mallavarapu, T., Oh, J. H., & Kang, M. (2018) · IEEE International Conference on Bioinformatics and Biomedicine (BIBM) · doi:10.1109/bibm.2018.8621345 · Cited by 39
Bice, N., Kirby, N., Bahr, T. A., Rasmussen, K., Saenz, D. B., Wagner, T. D., Papanikolaou, N., & Fakhreddine, M. (2020) · Journal of Applied Clinical Medical Physics · doi:10.1002/acm2.12995 · Cited by 41
Wang, S., Zhang, H., Liu, Z., & Liu, Y. (2022) · Frontiers in Genetics · doi:10.3389/fgene.2022.800853 · Cited by 39
Identification of Tumor-Specific MRI Biomarkers Using Machine Learning (ML)
Hajjo, R., Sabbah, D. A., Bardaweel, S. K., & Tropsha, A. (2021) · Diagnostics · doi:10.3390/diagnostics11050742 · Cited by 38
Yan, L., Gao, N., Ai, F., Zhao, Y., Kang, Y., Chen, J., & Weng, Y. (2022) · Frontiers in Oncology · doi:10.3389/fonc.2022.967758 · Cited by 38
Leveraging physiology and artificial intelligence to deliver advancements in health care
Zhang, A., Wu, Z., Wu, E., Wu, M. A., Snyder, M. P., Zou, J., & Wu, J. C. (2023) · Physiological Reviews · doi:10.1152/physrev.00033.2022 · Cited by 44
Mahootiha, M., Qadir, H. A., Bergsland, J., & Balasingham, I. (2023) · Computer Methods and Programs in Biomedicine · doi:10.1016/j.cmpb.2023.107978 · Cited by 38
Tanner, K., Sharples, L. D., Daniel, R., & Keogh, R. H. (2020) · Journal of the Royal Statistical Society Series A (Statistics in Society) · doi:10.1111/rssa.12611 · Cited by 38
Yan, Y., Shao, L., Liu, Z., He, W., Yang, G., Liu, J., Xia, H., Zhang, Y., Chen, H., Liu, C., et al. (2021) · Cancers · doi:10.3390/cancers13123098 · Cited by 38
Hao, D., Li, Q., Feng, Q.-X., Qi, L., Liu, X.-S., Arefan, D., Zhang, Y., & Wu, S. (2022) · Artificial Intelligence in Medicine · doi:10.1016/j.artmed.2022.102424 · Cited by 37
GAN-based data augmentation for transcriptomics: survey and comparative assessment
Lacan, A., Sébag, M., & Hanczar, B. (2023) · Bioinformatics · doi:10.1093/bioinformatics/btad239 · Cited by 42
Wakkerman, F. C., Wu, J., Putter, H., Jurgenliemk-Schulz, I. M., Jobsen, J. J., Lutgens, L. C. H. W., Haverkort, M. A. D., de Jong, M., Mens, J. W., Wortman, B. G., et al. (2024) · The Lancet Oncology · doi:10.1016/s1470-2045(24)00142-6 · Cited by 37
Lian, J., Deng, J., Hui, E. S. K., Koohi‐Moghadam, M., She, Y., Chen, C., & Vardhanabhuti, V. (2022) · eLife · doi:10.7554/elife.80547 · Cited by 37
Discovery of Targets for Immune–Metabolic Antitumor Drugs Identifies Estrogen-Related Receptor Alpha
Sahu, A. D., Wang, X., Munson, P. B., Klomp, J. P. G., Wang, X., Gu, S. S., Qian, G., Nicol, P., Zeng, Z., Wang, C., et al. (2023) · Cancer Discovery · doi:10.1158/2159-8290.cd-22-0244 · Cited by 35
Wei, Z., Xv, Y., Liu, H., Li, Y., Yin, S., Xie, Y., Chen, Y., Lv, F., Jiang, Q., Li, F., et al. (2024) · International Journal of Surgery · doi:10.1097/js9.0000000000001194 · Cited by 36
PathologyGAN: Learning deep representations of cancer tissue
Quiros, A. C., Murray‐Smith, R., & Yuan, K. (2021) · The Journal of Machine Learning for Biomedical Imaging · doi:10.59275/j.melba.2021-gfgg · Cited by 64
Artificial intelligence for the management of pancreatic diseases
Gorris, M., Hoogenboom, S. A. M., Wallace, M. B., & van Hooft, J. E. (2020) · Digestive Endoscopy · doi:10.1111/den.13875 · Cited by 36
Artificial Intelligence in Bulk and Single-Cell RNA-Sequencing Data to Foster Precision Oncology
Giudice, M. D., Peirone, S., Perrone, S., Priante, F., Varese, F., Tirtei, E., Fagioli, F., & Cereda, M. (2021) · International Journal of Molecular Sciences · doi:10.3390/ijms22094563 · Cited by 36
Lee, S., Zhou, J., Leung, K. S. K., Wu, W. K. K., Wong, W. T., Liu, T., Wong, I. C. K., Jeevaratnam, K., Zhang, Q., & Tse, G. (2021) · BMJ Open Diabetes Research & Care · doi:10.1136/bmjdrc-2020-001950 · Cited by 36
Strategies to Prevent Acute Kidney Injury after Pediatric Cardiac Surgery
den Eynde, J. V., Cloet, N., Lerberghe, R. V., Sá, M. P., Vlasselaers, D., Toelen, J., Verbakel, J. Y. J., Budts, W., Gewillig, M. H. M. L., Kutty, S., et al. (2021) · Clinical Journal of the American Society of Nephrology · doi:10.2215/cjn.05800421 · Cited by 36
Integrative analysis of clinical and epigenetic biomarkers of mortality
Huan, T., Nguyen, S., Colicino, E., Ochoa‐Rosales, C., Hill, W. D., Brody, J. A., Soerensen, M., Zhang, Y., Baldassari, A., Elhadad, M. A., et al. (2022) · Aging Cell · doi:10.1111/acel.13608 · Cited by 25
Cygu, S. B., Seow, H. Y., Dushoff, J. G., & Bolker, B. M. (2023) · Scientific Reports · doi:10.1038/s41598-023-28393-7 · Cited by 35
Wang, Z., Lin, R., Li, Y., Zeng, J., Chen, Y., Ouyang, W., Li, H., Jia, X., Lai, Z., Yu, Y., et al. (2024) · Precision Clinical Medicine · doi:10.1093/pcmedi/pbae012 · Cited by 44
Gomaa, A., Huang, Y., Hagag, A., Schmitter, C., Höfler, D., Weißmann, T., Breininger, K., Schmidt, M. A., Stritzelberger, J., Delev, D., et al. (2024) · Neuro-Oncology Advances · doi:10.1093/noajnl/vdae122 · Cited by 35
“47,49 In addition to the imaging data, these datasets encompass clinical and molecular-pathologic information, such as gender, age, resection status, Isocitrate dehydrogenase (IDH) mutation status, and O[6]-methylguanine-DNA methyltransferase (MGMT) promoter methylation status.”
Background
Metadata
- Authors
- Katzman, J. L., Shaham, U., Cloninger, A., Bates, J., Jiang, T., & Kluger, Y.
- Affiliations
- Yale University (US)
- Yale New Haven Hospital (US)
- Yale Cancer Center (US)
- Corresponding author
- Kluger, Yuval
- Venue
- BMC Medical Research Methodology
- Published
- 2018-02-26
- Volume
- 18
- Issue
- 1
- Pages
- 24-24
- ISSN
- 1471-2288 (ISSN-L)
- PMC
- PMC5828433
- OpenAlex
- W2753919178
- Cited by
- 1,995
- References
- 49
- Citations by year
- 2026: 376 · 2025: 386 · 2024: 321 · 2023: 301 · 2022: 238 · 2021: 206 · 2020: 94 · 2019: 54 · 2018: 18
- FWCI
- 52.41
- Type
- journal article
- Language
- en
- Open access
- gold
- doi.org
- Locations
- BMC Medical Research Methodology (publishedVersion, cc-by)
- PubMed Central (publishedVersion, cc-by)
- PubMed (publishedVersion)
- arXiv (Cornell University) (submittedVersion)
- DOAJ (DOAJ: Directory of Open Access Journals) (submittedVersion, cc-by-sa)
- arXiv (Cornell University)
- Funders
- National Human Genome Research Institute (1R01HG008383-01A1)
- Directorate for Mathematical and Physical Sciences (DMS-1402254)
- Topics
- Physical Sciences › Computer Science › Artificial Intelligence › Machine Learning in Healthcare
- Physical Sciences › Mathematics › Statistics and Probability › Statistical Methods and Inference
- Physical Sciences › Computer Science › Information Systems › Recommender Systems and Techniques
- Keywords
- DeepSurv, Cox proportional hazards model, deep neural network, survival analysis, personalized treatment recommendations, treatment effectiveness, clinical trials
- MeSH terms
- Algorithms, Humans, Proportional Hazards Models, Neural Networks, Computer, Outcome Assessment, Health Care, Kaplan-Meier Estimate, Precision Medicine
About these checks
Registry, retraction, Cites and statistics results are computed, not judged, with one exception: a printed reference that no index lists is read once by a model before it counts as a citation error. Claims are extracted by a model and kept only when their quote appears verbatim in the text; each cited source is then checked, with a model’s help, for whether it says what the claim relies on. Those verdicts can be wrong — read the claim’s quote and the cited source before relying on one.
Statistics and arithmetic are recomputed, not judged.
Confidence bands are shown only for fields calibrated on our annotated test set. None is calibrated yet, so no band is shown.
What counts as a claim ›How we measure confidence ›How we check this ›
Are you an author, or do you see a problem with this page? Request a review
