

The DOI matches its Crossref record; 70 of the 70 references it cites were found in a registry or an index; 27 of the 37 sources its claims cite were checked for support.
miR-27a and miR-27b regulate autophagic clearance of damaged mitochondria by targeting PTEN-induced putative kinase 1 (PINK1)
Open accessAbstract
BACKGROUND: Loss-of-function mutations in PINK1 and PARKIN are the most common causes of autosomal recessive Parkinson's disease (PD). PINK1 is a mitochondrial serine/threonine kinase that plays a critical role in mitophagy, a selective autophagic clearance of damaged mitochondria. Accumulating evidence suggests mitochondrial dysfunction is one of central mechanisms underlying PD pathogenesis. Therefore, identifying regulatory mechanisms of PINK1 expression may provide novel therapeutic opportunities for PD. Although post-translational stabilization of PINK1 upon mitochondrial damage has been extensively studied, little is known about the regulation mechanism of PINK1 at the transcriptional or translational levels. RESULTS: Here, we demonstrated that microRNA-27a (miR-27a) and miR-27b suppress PINK1 expression at the translational level through directly binding to the 3'-untranslated region (3'UTR) of its mRNA. Importantly, our data demonstrated that translation of PINK1 is critical for its accumulation upon mitochondrial damage. The accumulation of PINK1 upon mitochondrial damage was strongly regulated by expression levels of miR-27a and miR-27b. miR-27a and miR-27b prevent mitophagic influx by suppressing PINK1 expression, as evidenced by the decrease of ubiquitin phosphorylation, Parkin translocation, and LC3-II accumulation in damaged mitochondria. Consequently, miR-27a and miR-27b inhibit lysosomal degradation of the damaged mitochondria, as shown by the decrease of the delivery of damaged mitochondria to lysosome and the degradation of cytochrome c oxidase 2 (COX2), a mitochondrial marker. Furthermore, our data demonstrated that the expression of miR-27a and miR-27b is significantly induced under chronic mitophagic flux, suggesting a negative feedback regulation between PINK1-mediated mitophagy and miR-27a and miR-27b. CONCLUSIONS: We demonstrated that miR-27a and miR-27b regulate PINK1 expression and autophagic clearance of damaged mitochondria. Our data further support a novel negative regulatory mechanism of PINK1-mediated mitophagy by miR-27a and miR-27b. Therefore, our results considerably advance our understanding of PINK1 expression and mitophagy regulation and suggest that miR-27a and miR-27b may represent potential therapeutic targets for PD.
Overview
AI snapshot
Written from the paper’s full text.
TL;DR
This study shows that miR-27a and miR-27b directly target the PINK1 3′UTR to suppress PINK1 translation, limiting PINK1 accumulation, ubiquitin phosphorylation, Parkin translocation, and mitophagic clearance of damaged mitochondria. Chronic mitophagic flux induces miR-27a/b, suggesting a negative feedback loop.
Key findings
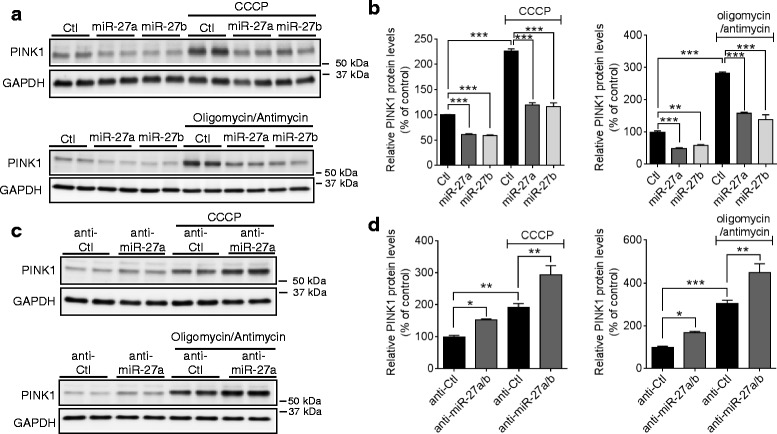
- miR-27a/b directly regulate PINK1 via its 3′UTR: luciferase reporters containing the full-length human PINK1 3′UTR were suppressed by miR-27a/b, mutation of either seed site increased activity, and combined mutation of both sites abolished the miR-27a/b effect. Overexpression decreased PINK1 protein in HeLa and M17 cells, while anti-miR-27a/b increased PINK1 protein.
- PINK1 translation is required for damage-induced accumulation: PINK1 mRNA was not altered by CCCP or oligomycin/antimycin, but cycloheximide completely abolished CCCP-induced PINK1 protein accumulation. miR-27a/b overexpression reduced PINK1 accumulation upon CCCP, whereas miR-27a/b inhibition increased it.
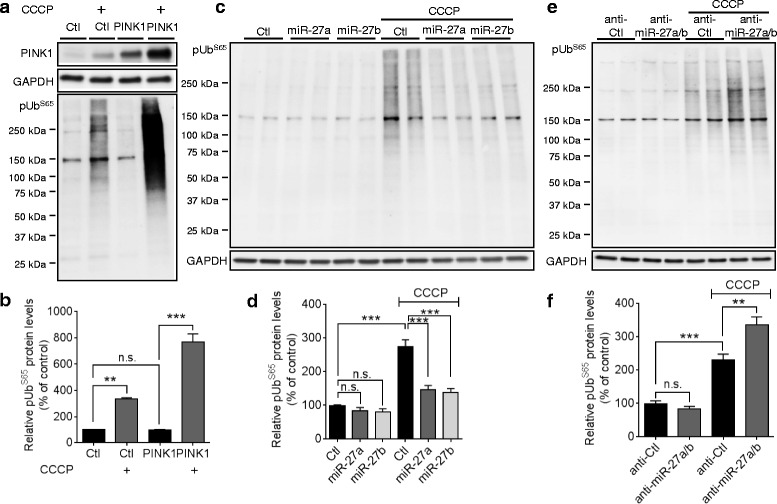
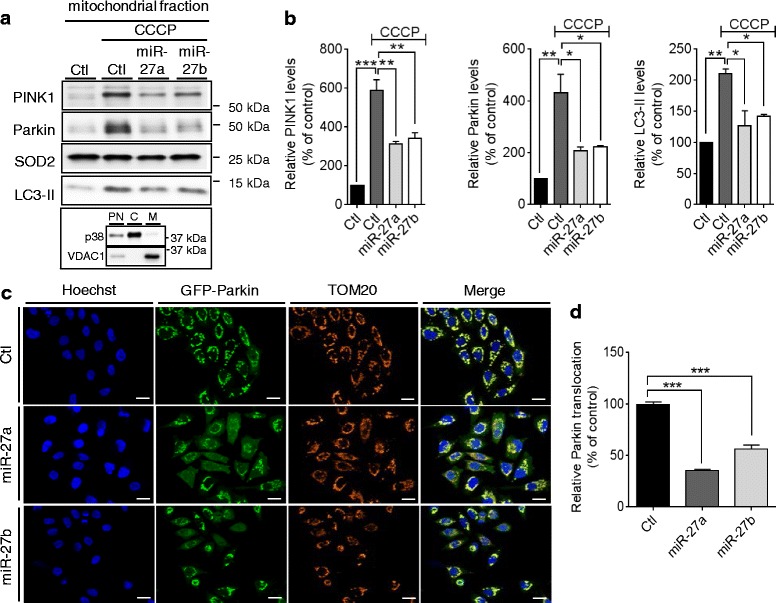
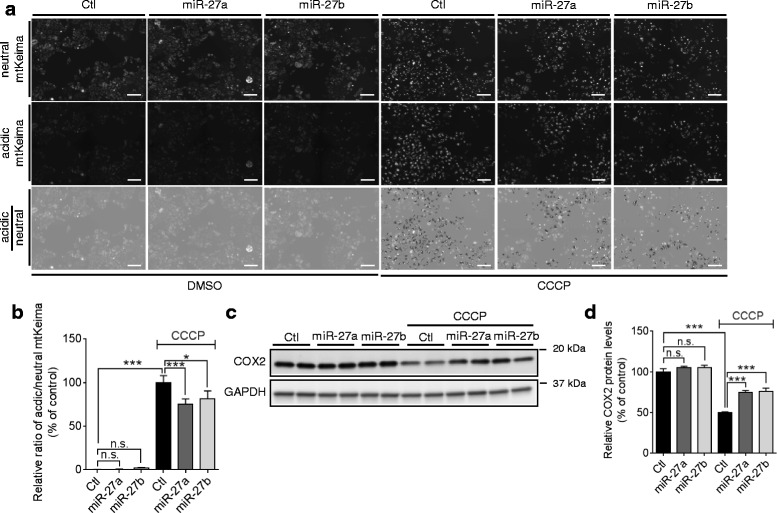
- miR-27a/b suppress mitophagic events: they reduced CCCP-induced pUbS65 accumulation, Parkin translocation to mitochondria (biochemical fractionation and imaging with >1000 cells), LC3-II accumulation, lysosomal delivery of damaged mitochondria by mtKeima (>300 cells, 12 replicates), and COX2 degradation.
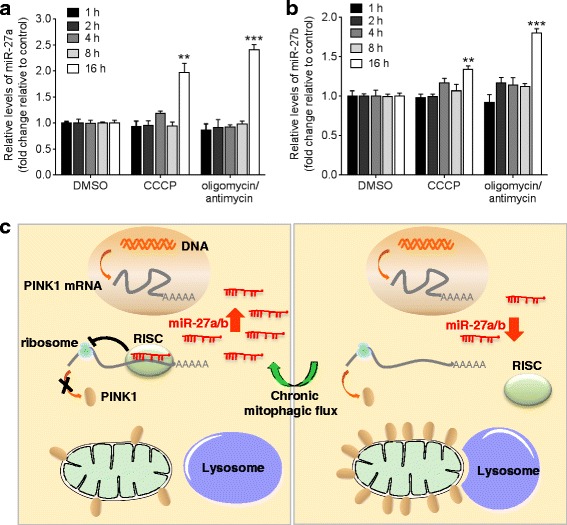
- Chronic mitophagic flux increased miR-27a/b and miR-23a/b levels, but not several other miRNAs, supporting a proposed negative feedback role for miR-27a/b in PINK1-mediated mitophagy.
Methods
- Cell models: human cervical HeLa cells, dopaminergic-like M17 cells, HeLa cells stably expressing GFP-Parkin, and HeLa cells stably expressing mitochondria-targeting Keima (mtKeima); treatments included CCCP, oligomycin/antimycin, and cycloheximide.
- Assays: AGO2-specific RNA immunoprecipitation, qRT-PCR, dual-luciferase reporter assays with wild-type or mutated PINK1 3′UTR, Western blot, mitochondrial fractionation, high-content imaging, and mtKeima live imaging.
- Statistics: two-tailed Student’s t-test for two groups; one-way or two-way ANOVA with Tukey’s post-hoc for multiple groups; sample sizes reported in figures include n = 4, 6, or 8 for several experiments and >1000 or >300 cells for imaging assays.
Limitations
- Stated: miRNA profiling studies in PD brains show discrepancies and relatively small sample sizes, making it difficult to conclude whether miR-27a/b are dysregulated in PD; the role of PINK1 in neuronal mitophagy is controversial; further studies are needed in dopaminergic neurons and human brain.
- Evident: the experimental work relies mainly on HeLa and M17 cell lines rather than primary neurons or in vivo PD models.
- Evident: the miR-27a/b binding sites in the PINK1 3′UTR are conserved in primates but not rodents, limiting direct translation to rodent models; no direct PD patient tissue validation of the miR-27a/b–PINK1 axis is presented.
Model-written summary. Check it against the paper before relying on it.
Integrity signals
Registry
Cites
Statistics
Figures
Verification
Claims the paper makes
35 Own result · 23 Own interpretation · 7 Partly supported · 5 Supported · 2 Couldn’t confirm · 2 No full text of the sources · 1 Supported so far · 1 Mixed support · 1 No basis given · accuracy not yet measured
The cited sources that could be checked couldn’t confirm or dispute this claim.
In the paper
“miR-27a/b are expressed in SN of human midbrain (Additional file 2a) [34–36]”
§ miR-27a and miR-27b regulate autophagic clearance of damaged mitochondria by targeting PTEN-induced putative kinase 1 (PINK1) > Results > miR-27a/b suppress human PINK1 expression by directly targeting 3′UTR of its mRNA
What the sources say
- Not checked — no full text of the sourcecites [34] Landgraf P, Rusu M, Sheridan R, Sewer A, Iovino N, Aravin A, et al. A mammalian microRNA expression atlas based on small RNA library sequencing. Cell. 2007;129(7):1401–14. source
- Could not verifycites [35] Kim J, Inoue K, Ishii J, Vanti WB, Voronov SV, Murchison E, et al. A MicroRNA feedback circuit in midbrain dopamine neurons. Science. 2007;317(5842):1220–4. sourceExperimental — accuracy not yet measured
The expression-analysis passage (p. 2) describes human midbrain samples and a panel of miRNAs, but identifies miR-133b rather than miR-27a/b. Searches for miR-27a/b and substantia nigra expression found no passage in our copy establishing the claimed expression. (LLM, conf=0.75)
- Not checked — no full text of the sourcecites [36] Cardo LF, Coto E, Ribacoba R, Menendez M, Moris G, Suarez E, et al. MiRNA profile in the substantia nigra of Parkinson’s disease and healthy subjects. J Mol Neurosci. 2014;54(4):830–6. source
plain- Asserted: passes — The authors put it forward as true.
- Checkable: passes — It can be checked against evidence.
- Load-bearing: passes — The paper’s conclusions depend on it.
- Based: passes — The paper gives a reason why it holds.
The cited sources support only part of this claim — read each source’s verdict below.
In the paper
“miR-27a/b have multiple putative binding sites in the 3′UTR of human PINK1 mRNA with low binding free energies (Additional file 2b) [37].”
§ miR-27a and miR-27b regulate autophagic clearance of damaged mitochondria by targeting PTEN-induced putative kinase 1 (PINK1) > Results > miR-27a/b suppress human PINK1 expression by directly targeting 3′UTR of its mRNA
What the sources say
- Partly supportedcites [37] Rehmsmeier M, Steffen P, Hochsmann M, Giegerich R. Fast and effective prediction of microRNA/target duplexes. RNA. 2004;10(10):1507–17. sourceExperimental — accuracy not yet measured
The Introduction and 'Multiple hits per target' section describe RNAhybrid as a method for predicting multiple miRNA binding sites and their free energies. The paper does not report binding sites for miR-27a/b in the human PINK1 3′UTR, so it supports the prediction method but not the specific result attributed here. (LLM, conf=0.84)
hedgedcorrelational- Asserted: passes — The authors put it forward as true.
- Checkable: passes — It can be checked against evidence.
- Load-bearing: passes — The paper’s conclusions depend on it.
- Based: passes — The paper gives a reason why it holds.
- Partly supported
The cited sources that could be checked couldn’t confirm or dispute this claim.
In the paper
“Several previous studies showed that miR-27a/b are expressed in human midbrain [34–36].”
§ miR-27a and miR-27b regulate autophagic clearance of damaged mitochondria by targeting PTEN-induced putative kinase 1 (PINK1) > Discussion
What the sources say
- Not checked — no full text of the sourcecites [34] Landgraf P, Rusu M, Sheridan R, Sewer A, Iovino N, Aravin A, et al. A mammalian microRNA expression atlas based on small RNA library sequencing. Cell. 2007;129(7):1401–14. source
- Could not verifycites [35] Kim J, Inoue K, Ishii J, Vanti WB, Voronov SV, Murchison E, et al. A MicroRNA feedback circuit in midbrain dopamine neurons. Science. 2007;317(5842):1220–4. sourceExperimental — accuracy not yet measured
The expression-analysis passage (p. 2) describes a panel of approximately 230 miRNAs tested in human midbrain, but does not identify miR-27a or miR-27b. Searches for “miR-27a miR-27b human midbrain” and “miR-27” found no passage in our copy establishing their expression there. (LLM, conf=0.73)
- Not checked — no full text of the sourcecites [36] Cardo LF, Coto E, Ribacoba R, Menendez M, Moris G, Suarez E, et al. MiRNA profile in the substantia nigra of Parkinson’s disease and healthy subjects. J Mol Neurosci. 2014;54(4):830–6. source
plain- Asserted: passes — The authors put it forward as true.
- Checkable: passes — It can be checked against evidence.
- Load-bearing: passes — The paper’s conclusions depend on it.
- Based: passes — The paper gives a reason why it holds.
A result the paper reports from its own data — it cites no other source for it, so there is none to check. The quote shows it is in the paper.
In the paper
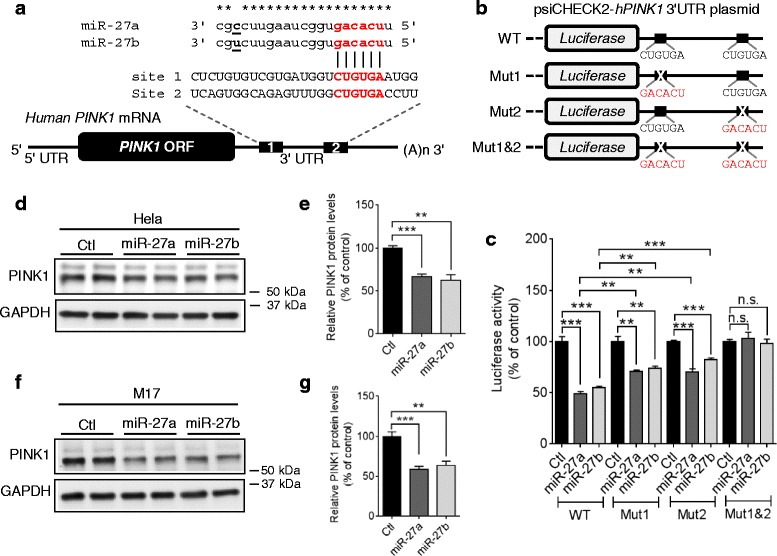
“miR-27a/b also suppressed PINK1 expression in human dopaminergic-like M17 cells (Fig. 2f, g).”
§ miR-27a and miR-27b regulate autophagic clearance of damaged mitochondria by targeting PTEN-induced putative kinase 1 (PINK1) > Results > miR-27a/b suppress human PINK1 expression by directly targeting 3′UTR of its mRNA
plaindirect- Asserted: passes — The authors put it forward as true.
- Checkable: passes — It can be checked against evidence.
- Load-bearing: passes — The paper’s conclusions depend on it.
- Based: passes — The paper gives a reason why it holds.
A result the paper reports from its own data — it cites no other source for it, so there is none to check. The quote shows it is in the paper.
In the paper
“miR-27a/b are commonly predicted by several algorithms to have seed match sequences in the 3′UTR of human PINK1 mRNA (Fig. 2a and Additional file 2a)”
§ miR-27a and miR-27b regulate autophagic clearance of damaged mitochondria by targeting PTEN-induced putative kinase 1 (PINK1) > Results > miR-27a/b suppress human PINK1 expression by directly targeting 3′UTR of its mRNA
plaincorrelational- Asserted: passes — The authors put it forward as true.
- Checkable: passes — It can be checked against evidence.
- Load-bearing: passes — The paper’s conclusions depend on it.
- Based: passes — The paper gives a reason why it holds.
A result the paper reports from its own data — it cites no other source for it, so there is none to check. The quote shows it is in the paper.
In the paper
“We also observed that pUbS65 levels were markedly increased by CCCP and overexpression of PINK1 further increased the pUbS65 accumulation by CCCP in HeLa cells (Fig. 6a).”
§ miR-27a and miR-27b regulate autophagic clearance of damaged mitochondria by targeting PTEN-induced putative kinase 1 (PINK1) > Results > miR-27a/b prevent the accumulation of phospho-ubiquitin upon mitochondrial damage
plaindirectn = 3- Asserted: passes — The authors put it forward as true.
- Checkable: passes — It can be checked against evidence.
- Load-bearing: unclear — It is unclear whether the paper’s conclusions depend on it.
- Based: passes — The paper gives a reason why it holds.
A result the paper reports from its own data — it cites no other source for it, so there is none to check. The quote shows it is in the paper.
In the paper
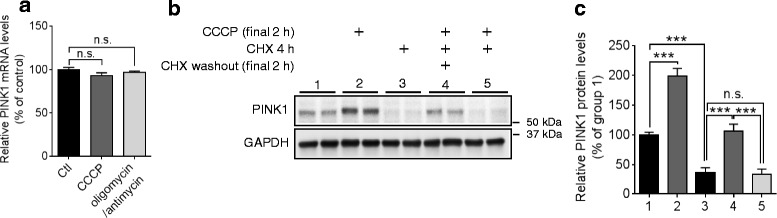
“Notably, blocking translation with cycloheximide (CHX) completely abolished the accumulation of PINK1 protein by CCCP (Fig. 4b, c).”
§ miR-27a and miR-27b regulate autophagic clearance of damaged mitochondria by targeting PTEN-induced putative kinase 1 (PINK1) > Results > PINK1 translation is indispensable for the accumulation of PINK1 upon mitochondrial damage
plaindirect- Asserted: passes — The authors put it forward as true.
- Checkable: passes — It can be checked against evidence.
- Load-bearing: passes — The paper’s conclusions depend on it.
- Based: passes — The paper gives a reason why it holds.
A result the paper reports from its own data — it cites no other source for it, so there is none to check. The quote shows it is in the paper.
In the paper
“Moreover, a combined mutation in both seed match sites (Mut 1&2) completely abolished the miR-27a/b-mediated reduction of luciferase activities, indicating that both seed match sites are functional (Fig. 2c).”
§ miR-27a and miR-27b regulate autophagic clearance of damaged mitochondria by targeting PTEN-induced putative kinase 1 (PINK1) > Results > miR-27a/b suppress human PINK1 expression by directly targeting 3′UTR of its mRNA
plain- Asserted: passes — The authors put it forward as true.
- Checkable: passes — It can be checked against evidence.
- Load-bearing: passes — The paper’s conclusions depend on it.
- Based: passes — The paper gives a reason why it holds.
A result the paper reports from its own data — it cites no other source for it, so there is none to check. The quote shows it is in the paper.
In the paper
“miR-27a/b inhibited the degradation of COX2 upon mitochondrial damage, compared to a negative control miR (Fig. 8c, d).”
§ miR-27a and miR-27b regulate autophagic clearance of damaged mitochondria by targeting PTEN-induced putative kinase 1 (PINK1) > Results > miR-27a/b inhibit the lysosomal degradation of damaged mitochondria
plaindirect- Asserted: passes — The authors put it forward as true.
- Checkable: passes — It can be checked against evidence.
- Load-bearing: passes — The paper’s conclusions depend on it.
- Based: passes — The paper gives a reason why it holds.
A result the paper reports from its own data — it cites no other source for it, so there is none to check. The quote shows it is in the paper.
In the paper
“whereas inhibition of miR-27a/b further increased PINK1 accumulation compared to the negative control (Fig. 5c, d).”
§ miR-27a and miR-27b regulate autophagic clearance of damaged mitochondria by targeting PTEN-induced putative kinase 1 (PINK1) > Results > miR-27a/b inhibit PINK1 accumulation upon mitochondrial damage
plaindirectn = 4- Asserted: passes — The authors put it forward as true.
- Checkable: passes — It can be checked against evidence.
- Load-bearing: passes — The paper’s conclusions depend on it.
- Based: passes — The paper gives a reason why it holds.
- Probably not a substantial claim. 17
- It may state two separate claims as one. 9
Some cited sources support this claim and some don’t — read each source’s verdict below.
In the paper
“Moreover, pUbS65 has been suggested to accumulate with mitochondrial stress, age, and disease [19] and to serve as a specific signal for recognition by autophagy receptors [20, 21].”
§ miR-27a and miR-27b regulate autophagic clearance of damaged mitochondria by targeting PTEN-induced putative kinase 1 (PINK1) > Background
What the sources say
- Supportedcites [19] Fiesel FC, Ando M, Hudec R, Hill AR, Castanedes-Casey M, Caulfield TR, et al. (Patho-)physiological relevance of PINK1-dependent ubiquitin phosphorylation. EMBO Rep. 2015;16(9):1114–30. source
Citation [19] is attached to the claim that pUbS65 accumulates with mitochondrial stress, age, and disease, not to the separate autophagy-receptor claim cited to [20, 21]. The Discussion (page not supplied) states that pS65-Ub accumulates with organelle damage, age, and disease; the Results (page not supplied) also report accumulation with age and disease in human brain. (LLM, conf=0.94)
- Disputedcites [20] Heo JM, Ordureau A, Paulo JA, Rinehart J, Harper JW. The PINK1-PARKIN mitochondrial ubiquitylation pathway drives a program of OPTN/NDP52 recruitment and TBK1 activation to promote mitophagy. Mol Cell. 2015;60(1):7–20. sourceExperimental — accuracy not yet measured
The citation to this paper concerns pUbS65 as a specific signal for autophagy-receptor recognition; the accumulation claim is attached to [19]. In the Results ("Focal localization of p-TBK1S172 with OPTN on depolarized mitochondria"), the authors conclude that p-S65 UB alone does not specify sites of adaptor recruitment. The Discussion likewise says p-S65 UB does not exclusively dictate those sites. (LLM, conf=0.88)
Checked by a reasoning model — may be wrong.
- Supportedcites [21] Lazarou M, Sliter DA, Kane LA, Sarraf SA, Wang C, Burman JL, et al. The ubiquitin kinase PINK1 recruits autophagy receptors to induce mitophagy. Nature. 2015;524(7565):309–14. source
This source is cited for the second clause, about recognition by autophagy receptors; the age-and-disease clause is cited to [19]. In “Ubiquitin phosphorylation in mitophagy” (page not available), OPTN and NDP52 preferentially bind phospho-mimetic Ser65 ubiquitin, and OPTN binds phosphorylated ubiquitin better than unphosphorylated ubiquitin in a cell-cytosol assay. (LLM, conf=0.90)
hedgedcorrelational- Asserted: passes — The authors put it forward as true.
- Checkable: passes — It can be checked against evidence.
- Load-bearing: fails — The paper’s conclusions may not depend on it.
- Based: passes — The paper gives a reason why it holds.
Probably not a substantial claim. The paper’s conclusions may not depend on it. It may state two separate claims as one.
- Supported
The cited sources support only part of this claim — read each source’s verdict below.
In the paper
“Upon mitochondrial damage, PINK1 is quickly stabilized on damaged mitochondria, which leads to translocation of cytosolic Parkin to damaged mitochondria [11–13].”
§ miR-27a and miR-27b regulate autophagic clearance of damaged mitochondria by targeting PTEN-induced putative kinase 1 (PINK1) > Background
What the sources say
- Partly supportedcites [11] Springer W, Kahle PJ. Regulation of PINK1-Parkin-mediated mitophagy. Autophagy. 2011;7(3):266–78. sourceExperimental — accuracy not yet measured
In “The PINK1-Parkin-Mediated Control of Mitochondrial Degradation” (page unavailable), the paper says full-length PINK1 is stabilized on depolarized mitochondria, resulting in Parkin recruitment, and describes Parkin as cytosolic. It does not support “quickly”: the same section says PINK1 levels gradually rise on depolarized mitochondria. (LLM, conf=0.83)
- Supportedcites [12] Narendra DP, Jin SM, Tanaka A, Suen DF, Gautier CA, Shen J, et al. PINK1 is selectively stabilized on impaired mitochondria to activate Parkin. PLoS Biol. 2010;8(1):e1000298. source
The Introduction states that PINK1 is selectively stabilized on impaired mitochondria and that its accumulation recruits Parkin. The Results report PINK1 accumulation beginning within 30 minutes of depolarization and show Parkin increasing in the mitochondrial fraction while decreasing in the supernatant. Page numbers are not available in our copy. (LLM, conf=0.93)
- Supportedcites [13] Matsuda N, Sato S, Shiba K, Okatsu K, Saisho K, Gautier CA, et al. PINK1 stabilized by mitochondrial depolarization recruits Parkin to damaged mitochondria and activates latent Parkin for mitophagy. J Cell Biol. 2010;189(2):211–21. source
In Results and discussion, the paper reports that depolarization causes PINK1 to accumulate on mitochondria and that Parkin translocates to mitochondria after depolarization in control cells, but not in PINK1-knockout cells. Its Conclusion explicitly identifies PINK1 as a factor that recruits Parkin from the cytoplasm to damaged mitochondria. The copy does not give a precise time for stabilization, but the claim’s general sequence is supported. (LLM, conf=0.92)
plaindirect- Asserted: passes — The authors put it forward as true.
- Checkable: passes — It can be checked against evidence.
- Load-bearing: passes — The paper’s conclusions depend on it.
- Based: passes — The paper gives a reason why it holds.
Probably not a substantial claim. It may state two separate claims as one.
- Partly supported
The cited sources support only part of this claim — read each source’s verdict below.
In the paper
“Beyond their roles in mitophagy, mounting evidence suggested that both PINK1 and Parkin have neuroprotective roles against various insults, such as oxidative stress and PD-relevant toxins, although the underlying mechanisms still remain elusive [22, 23].”
§ miR-27a and miR-27b regulate autophagic clearance of damaged mitochondria by targeting PTEN-induced putative kinase 1 (PINK1) > Background
What the sources say
- Partly supportedcites [22] Seirafi M, Kozlov G, Gehring K. Parkin structure and function. FEBS J. 2015;282(11):2076–88. sourceExperimental — accuracy not yet measured
The Abstract calls both PINK1 and parkin neuroprotective, and “Other functions of parkin” says they work together to repair mitochondria in response to mild oxidative stress. The References include studies of parkin protecting neurons against toxins, but the paper does not establish comparable protection by PINK1 against PD-relevant toxins. (LLM, conf=0.82)
- Partly supportedcites [23] Deas E, Plun-Favreau H, Wood NW. PINK1 function in health and disease. EMBO Mol Med. 2009;1(3):152–65. sourceExperimental — accuracy not yet measured
The section “PINK1 protects cells against oxidative stress-induced apoptosis” reports that PINK1 protects against oxidative-stress-induced death and chemical insults including MPTP. The paper discusses Parkin’s role in the PINK1 pathway, but the passages found do not establish that Parkin protects neurons against oxidative stress or PD-relevant toxins. Thus the claim is supported for PINK1, not for both proteins. (LLM, conf=0.86)
hedgeddirect- Asserted: passes — The authors put it forward as true.
- Checkable: passes — It can be checked against evidence.
- Load-bearing: fails — The paper’s conclusions may not depend on it.
- Based: passes — The paper gives a reason why it holds.
Probably not a substantial claim. The paper’s conclusions may not depend on it.
- Partly supported
The cited sources support only part of this claim — read each source’s verdict below.
In the paper
“Recently, several groups discovered that PINK1 also phosphorylates ubiquitin at Ser65 (pUbS65) and PINK1-dependent phosphorylation of ubiquitin is required for translocation and activation of Parkin to initiate mitophagy [16–18].”
§ miR-27a and miR-27b regulate autophagic clearance of damaged mitochondria by targeting PTEN-induced putative kinase 1 (PINK1) > Background
What the sources say
- Partly supportedcites [16] Kane LA, Lazarou M, Fogel AI, Li Y, Yamano K, Sarraf SA, et al. PINK1 phosphorylates ubiquitin to activate Parkin E3 ubiquitin ligase activity. J Cell Biol. 2014;205(2):143–53. sourceExperimental — accuracy not yet measured
The Introduction identifies ubiquitin Ser65 as a PINK1 phosphorylation site, and the Results and discussion report that nonphosphorylatable UbS65A reduces Parkin translocation and inhibits its activation. Those findings support a role for ubiquitin phosphorylation, but the observed translocation decrease was greater than 50%, not complete; the paper does not establish the claim’s absolute requirement for translocation or directly demonstrate that this phosphorylation is required to initiate mitophagy. (LLM, conf=0.85)
- Partly supportedcites [17] Kazlauskaite A, Kondapalli C, Gourlay R, Campbell DG, Ritorto MS, Hofmann K, et al. Parkin is activated by PINK1-dependent phosphorylation of ubiquitin at Ser65. Biochem J. 2014;460(1):127–39. sourceExperimental — accuracy not yet measured
The Introduction and Discussion show that PINK1 phosphorylates ubiquitin at Ser65 and that phosphorylated ubiquitin activates Parkin E3 ligase. The Introduction reports that PINK1 is required for Parkin recruitment to mitochondria, but our copy does not establish that ubiquitin phosphorylation is required for that translocation or for initiating mitophagy. No page numbers are available in the indexed passages. (LLM, conf=0.88)
- Not checked — no full text of the sourcecites [18] Koyano F, Okatsu K, Kosako H, Tamura Y, Go E, Kimura M, et al. Ubiquitin is phosphorylated by PINK1 to activate parkin. Nature. 2014;510(7503):162–6. source
plaindirect- Asserted: passes — The authors put it forward as true.
- Checkable: passes — It can be checked against evidence.
- Load-bearing: fails — The paper’s conclusions may not depend on it.
- Based: passes — The paper gives a reason why it holds.
Probably not a substantial claim. The paper’s conclusions may not depend on it. It may state two separate claims as one.
- Partly supported
Every source the paper cites for this claim was checked and supports it.
In the paper
“Together, they functionally mediate the stress-activated, selective clearance of impaired mitochondria via autophagic degradation (termed mitophagy) [11]”
§ miR-27a and miR-27b regulate autophagic clearance of damaged mitochondria by targeting PTEN-induced putative kinase 1 (PINK1) > Background
What the sources say
- Supportedcites [11] Springer W, Kahle PJ. Regulation of PINK1-Parkin-mediated mitophagy. Autophagy. 2011;7(3):266–78. source
The Introduction states that PINK1 and PARKIN functionally cooperate in the selective degradation of damaged mitochondria via autophagy. The section “The PINK1-Parkin-Mediated Control of Mitochondrial Degradation” also describes autophagic clearance of depolarized mitochondria, supporting the stress-related aspect of the paraphrase. (LLM, conf=0.94)
plaindirect- Asserted: passes — The authors put it forward as true.
- Checkable: passes — It can be checked against evidence.
- Load-bearing: passes — The paper’s conclusions depend on it.
- Based: passes — The paper gives a reason why it holds.
Probably not a substantial claim.
- Supported
Every source the paper cites for this claim was checked and supports it.
In the paper
“For example, miR-137 inhibits mitophagy by targeting FUNC1 and NIX [47].”
§ miR-27a and miR-27b regulate autophagic clearance of damaged mitochondria by targeting PTEN-induced putative kinase 1 (PINK1) > Discussion
What the sources say
- Supportedcites [47] Li W, Zhang X, Zhuang H, Chen HG, Chen Y, Tian W, et al. MicroRNA-137 is a novel hypoxia-responsive microRNA that inhibits mitophagy via regulation of two mitophagy receptors FUNDC1 and NIX. J Biol Chem. 2014;289(15):10691–701. source
The Abstract states that miR-137 inhibits hypoxia-induced mitophagy by targeting FUNDC1 and NIX. The citing sentence spells FUNDC1 as “FUNC1,” but otherwise matches the finding. (LLM, conf=0.94)
plaindirect- Asserted: passes — The authors put it forward as true.
- Checkable: passes — It can be checked against evidence.
- Load-bearing: fails — The paper’s conclusions may not depend on it.
- Based: passes — The paper gives a reason why it holds.
Probably not a substantial claim. The paper’s conclusions may not depend on it.
- Supported
Every source the paper cites for this claim was checked and supports it.
In the paper
“miR-351 and miR-125a are also known to regulate mitophagy [49].”
§ miR-27a and miR-27b regulate autophagic clearance of damaged mitochondria by targeting PTEN-induced putative kinase 1 (PINK1) > Discussion
What the sources say
- Supportedcites [49] Barde I, Rauwel B, Marin-Florez RM, Corsinotti A, Laurenti E, Verp S, et al. A KRAB/KAP1-miRNA cascade regulates erythropoiesis through stage-specific control of mitophagy. Science. 2013;340(6130):350–3. source
The paper reports that miR-351 overexpression caused erythroid cells to accumulate mitochondria, a phenotype reversed by restoring Bnip3L. It also reports that human miR-125a-5p overexpression reduced Nix expression and increased mitochondrial content. These passages support regulation of mitophagy by both miRNAs in the erythroid cells studied; page numbers are not provided in our copy. (LLM, conf=0.92)
boosteddirect- Asserted: passes — The authors put it forward as true.
- Checkable: passes — It can be checked against evidence.
- Load-bearing: fails — The paper’s conclusions may not depend on it.
- Based: passes — The paper gives a reason why it holds.
Probably not a substantial claim. The paper’s conclusions may not depend on it.
- Supported
Every source the paper cites for this claim was checked and supports it.
In the paper
“miR-320a promotes mitophagy by targeting VDAC1 [48].”
§ miR-27a and miR-27b regulate autophagic clearance of damaged mitochondria by targeting PTEN-induced putative kinase 1 (PINK1) > Discussion
What the sources say
- Supportedcites [48] Li QQ, Zhang L, Wan HY, Liu M, Li X, Tang H. CREB1-driven expression of miR-320a promotes mitophagy by down-regulating VDAC1 expression during serum starvation in cervical cancer cells. Oncotarget. 2015;6(33):34924–40. source
The Results section (‘miR-320a down-regulates VDAC1 expression to promote mitophagy in HeLa cells’; page not supplied) explicitly concludes that miR-320a promotes mitophagy by downregulating VDAC1. The finding was established in HeLa cells during serum starvation. (LLM, conf=0.94)
plaindirect- Asserted: passes — The authors put it forward as true.
- Checkable: passes — It can be checked against evidence.
- Load-bearing: fails — The paper’s conclusions may not depend on it.
- Based: passes — The paper gives a reason why it holds.
Probably not a substantial claim. The paper’s conclusions may not depend on it.
- Supported
The cited sources support only part of this claim — read each source’s verdict below.
In the paper
“Although the role of ATG4A in mitophagy is unclear, AMBRA1 and ATG12 positively regulate mitophagy [56–58].”
§ miR-27a and miR-27b regulate autophagic clearance of damaged mitochondria by targeting PTEN-induced putative kinase 1 (PINK1) > Discussion
What the sources say
- Partly supportedcites [56] Van Humbeeck C, Cornelissen T, Hofkens H, Mandemakers W, Gevaert K, De Strooper B, et al. Parkin interacts with Ambra1 to induce mitophagy. J Neurosci. 2011;31(28):10249–61. sourceExperimental — accuracy not yet measured
The Discussion (p. 10259) identifies Ambra1 as a key player in clearing depolarized mitochondria and says its activating role in mitophagy depends on Parkin. The cited paper does not establish the claim about ATG12 (searched: ATG12 and ATG12 positively regulates mitophagy). (LLM, conf=0.85)
- Partly supportedcites [57] Strappazzon F, Nazio F, Corrado M, Cianfanelli V, Romagnoli A, Fimia GM, et al. AMBRA1 is able to induce mitophagy via LC3 binding, regardless of PARKIN and p62/SQSTM1. Cell Death Differ. 2015;22(3):419–32. sourceExperimental — accuracy not yet measured
The Abstract (page unavailable) identifies AMBRA1 as a mitophagy regulator and reports that directing it to the outer mitochondrial membrane triggers mitophagy. Our copy does not establish that ATG12 positively regulates mitophagy; a search for ATG12 found no passage supporting that part of the claim. (LLM, conf=0.87)
- Partly supportedcites [58] Radoshevich L, Murrow L, Chen N, Fernandez E, Roy S, Fung C, et al. ATG12 conjugation to ATG3 regulates mitochondrial homeostasis and cell death. Cell. 2010;142(4):590–600. sourceExperimental — accuracy not yet measured
The Results (page unavailable) show that loss of ATG12 conjugation to ATG3 reduces mitochondrial targeting to autophagosomes during CCCP treatment, supporting a positive role for that complex in mitophagy. The paper does not address AMBRA1, so it does not support that part of the claim. (LLM, conf=0.90)
plaindirect- Asserted: passes — The authors put it forward as true.
- Checkable: passes — It can be checked against evidence.
- Load-bearing: fails — The paper’s conclusions may not depend on it.
- Based: passes — The paper gives a reason why it holds.
Probably not a substantial claim. The paper’s conclusions may not depend on it.
- Partly supported
Every source the paper cites for this claim was checked and supports it.
In the paper
“PINK1 plays critical roles in mitochondrial quality control, particularly in induction of mitophagy [39].”
§ miR-27a and miR-27b regulate autophagic clearance of damaged mitochondria by targeting PTEN-induced putative kinase 1 (PINK1) > Discussion
What the sources say
- Supportedcites [39] Pickrell AM, Youle RJ. The roles of PINK1, parkin, and mitochondrial fidelity in Parkinson’s disease. Neuron. 2015;85(2):257–73. source
The Introduction section “PINK1 and Parkin Mediate Mitophagy” says PINK1’s kinase activity is required for Parkin translocation and mitophagy, and describes the two proteins as performing a mitochondrial quality-control function. “PINK1 Detects Mitochondrial Damage via Selective Proteolysis” further describes how PINK1 flags damaged mitochondria for elimination. (LLM, conf=0.94)
plaindirect- Asserted: passes — The authors put it forward as true.
- Checkable: passes — It can be checked against evidence.
- Load-bearing: passes — The paper’s conclusions depend on it.
- Based: passes — The paper gives a reason why it holds.
Probably not a substantial claim.
- Supported
The cited sources support only part of this claim — read each source’s verdict below.
In the paper
“PINK1 also plays crucial roles in mitochondria trafficking, spine morphogenesis, and vulnerability to excitotoxicity in neurons [23].”
§ miR-27a and miR-27b regulate autophagic clearance of damaged mitochondria by targeting PTEN-induced putative kinase 1 (PINK1) > Discussion
What the sources say
- Partly supportedcites [23] Deas E, Plun-Favreau H, Wood NW. PINK1 function in health and disease. EMBO Mol Med. 2009;1(3):152–65. sourceExperimental — accuracy not yet measured
The “PINK1 and mitochondrial trafficking” section links PINK1 to a transport complex relevant to neurons. The “PINK1 in calcium signalling” section discusses susceptibility of PINK1-deficient dopaminergic neurons to cell death, but does not identify excitotoxicity as the cause. The passages do not support a role in spine morphogenesis. (LLM, conf=0.88)
plaindirect- Asserted: passes — The authors put it forward as true.
- Checkable: passes — It can be checked against evidence.
- Load-bearing: fails — The paper’s conclusions may not depend on it.
- Based: passes — The paper gives a reason why it holds.
Probably not a substantial claim. The paper’s conclusions may not depend on it. It may state two separate claims as one.
- Partly supported
The sources with a verdict support this claim; the rest weren’t checked yet, have no full text we could read, or their verdicts aren’t rated yet.
In the paper
“For example, miR-23a, miR-23b, and miR-24 suppress AMBRA1 [52], ATG12 [53, 54], and ATG4A [55], respectively.”
§ miR-27a and miR-27b regulate autophagic clearance of damaged mitochondria by targeting PTEN-induced putative kinase 1 (PINK1) > Discussion
What the sources say
- Supportedcites [52] Zhang JA, Zhou BR, Xu Y, Chen X, Liu J, Gozali M, et al. MiR-23a-depressed autophagy is a participant in PUVA- and UVB-induced premature senescence. Oncotarget. 2016. doi: 10.18632/oncotarget.9357 . source
The citation [52] is attached to the miR-23a–AMBRA1 pairing, not the other two pairings. In the Results section, the paper reports that miR-23a suppressed an AMBRA1 3′-UTR reporter and that reducing miR-23a increased AMBRA1 protein and mRNA levels in fibroblasts. (LLM, conf=0.94)
- Supportedcites [53] An Y, Zhang Z, Shang Y, Jiang X, Dong J, Yu P, et al. miR-23b-3p regulates the chemoresistance of gastric cancer cells by targeting ATG12 and HMGB2. Cell Death Dis. 2015;6:e1766. source
The citation to this paper is attached to the miR-23b–ATG12 pairing, not the AMBRA1 or ATG4A pairings. The Results section, “ATG12 and HMGB2 are direct targets of miR-23b-3p” (page not supplied), reports that restoring miR-23b-3p inhibited ATG12 expression and identifies ATG12 as a direct target. (LLM, conf=0.94)
- Not checked — no full text of the sourcecites [54] Wang P, Zhang J, Zhang L, Zhu Z, Fan J, Chen L, et al. MicroRNA 23b regulates autophagy associated with radioresistance of pancreatic cancer cells. Gastroenterology. 2013;145(5):1133–43. e12. source
- Supportedcites [55] Pan B, Chen Y, Song H, Xu Y, Wang R, Chen L. Mir-24-3p downregulation contributes to VP16-DDP resistance in small-cell lung cancer by targeting ATG4A. Oncotarget. 2015;6(1):317–31. source
The citation to this paper is attached to the miR-24–ATG4A relationship, not the preceding miRNA–target pairs. The Results section, “Mir-24-3p suppressed autophagy by directly targeting ATG4A” (page not provided), reports that miR-24-3p directly targets ATG4A and that increasing it reduces ATG4A mRNA and protein levels. (LLM, conf=0.94)
boosteddirect- Asserted: passes — The authors put it forward as true.
- Checkable: passes — It can be checked against evidence.
- Load-bearing: fails — The paper’s conclusions may not depend on it.
- Based: passes — The paper gives a reason why it holds.
Probably not a substantial claim. The paper’s conclusions may not depend on it. It may state two separate claims as one.
- Supported
The cited sources support only part of this claim — read each source’s verdict below.
In the paper
“Loss of PINK1 has been associated with mitochondrial dysfunction in Drosophila, mouse, and human, suggesting that the roles of PINK1 in mitochondrial quality control may be evolutionally conserved [50, 51].”
§ miR-27a and miR-27b regulate autophagic clearance of damaged mitochondria by targeting PTEN-induced putative kinase 1 (PINK1) > Discussion
What the sources say
- Supportedcites [50] Narendra DP, Youle RJ. Targeting mitochondrial dysfunction: role for PINK1 and Parkin in mitochondrial quality control. Antioxid Redox Signal. 2011;14(10):1929–38. source
The Introduction reports that Pink1-null Drosophila have the same phenotype as Parkin-knockout flies, whose affected tissues show mitochondrial dysfunction. Its section on conservation in mammals reports progressive loss of mitochondrial function in Pink1-null mice and mitochondrial dysfunction in cells from patients with PINK1 loss-of-function mutations. (LLM, conf=0.90)
- Partly supportedcites [51] Cookson MR. Parkinsonism due to mutations in PINK1, parkin, and DJ-1 and oxidative stress and mitochondrial pathways. Cold Spring Harb Perspect Med. 2012;2(9):a009415. sourceExperimental — accuracy not yet measured
The PATHWAYS TO PARKINSONISM section reports mitochondrial phenotypes in PINK1-deficient Drosophila and says the human PINK1 homolog rescues them. The BIOCHEMICAL FUNCTION IN THE PINK1/PARKIN PATHWAY section also links loss of PINK1 to altered mitochondrial shape and function in cells. The passages do not establish mitochondrial dysfunction specifically in PINK1-deficient mice, so the three-species claim is only partly supported. (LLM, conf=0.83)
hedgedcorrelational- Asserted: passes — The authors put it forward as true.
- Checkable: passes — It can be checked against evidence.
- Load-bearing: fails — The paper’s conclusions may not depend on it.
- Based: passes — The paper gives a reason why it holds.
Probably not a substantial claim. The paper’s conclusions may not depend on it.
- Supported
A result the paper reports from its own data — it cites no other source for it, so there is none to check. The quote shows it is in the paper.
In the paper
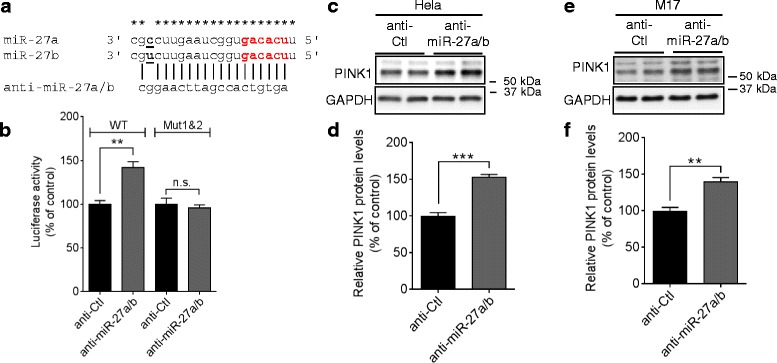
“Inhibition of endogenous miR-27a/b significantly increased luciferase activities from the reporter construct with WT PINK1 3′UTR, whereas combined mutations of both seed match sites blocked the anti-miR-27a/b-mediated induction of luciferase activities in HeLa cells (Fig. 3b).”
§ miR-27a and miR-27b regulate autophagic clearance of damaged mitochondria by targeting PTEN-induced putative kinase 1 (PINK1) > Results > miR-27a/b suppress human PINK1 expression by directly targeting 3′UTR of its mRNA
plaindirect- Asserted: passes — The authors put it forward as true.
- Checkable: passes — It can be checked against evidence.
- Load-bearing: passes — The paper’s conclusions depend on it.
- Based: passes — The paper gives a reason why it holds.
It may state two separate claims as one.
A result the paper reports from its own data — it cites no other source for it, so there is none to check. The quote shows it is in the paper.
In the paper
“Of note, both putative binding sites of miR-27a/b in the 3′UTR of PINK1 mRNA are well conserved in primates, such as human, chimpanzee, and monkey, but not in rodents, such as rat and mouse (Additional file 3)”
§ miR-27a and miR-27b regulate autophagic clearance of damaged mitochondria by targeting PTEN-induced putative kinase 1 (PINK1) > Results > miR-27a/b suppress human PINK1 expression by directly targeting 3′UTR of its mRNA
boosted- Asserted: passes — The authors put it forward as true.
- Checkable: passes — It can be checked against evidence.
- Load-bearing: passes — The paper’s conclusions depend on it.
- Based: passes — The paper gives a reason why it holds.
It may state two separate claims as one.
The paper states this without a source or data behind it here, so there is nothing to check it against. The quote shows it is in the paper.
In the paper
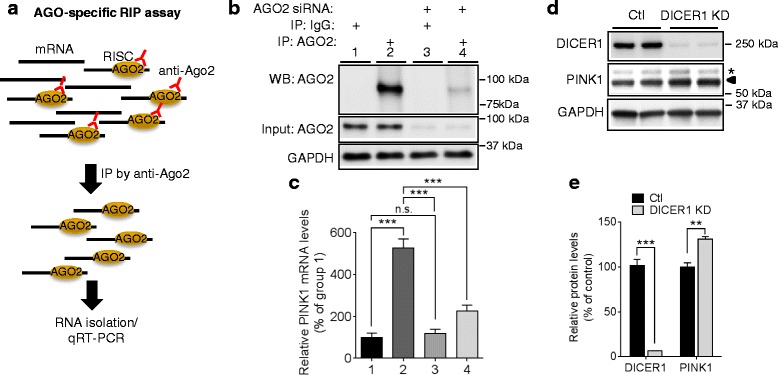
“PINK1 mRNA (NM_032409) has a long 3′UTR, ~840 nucleotides, raising the possibility that its expression may be regulated by miRNAs which often target 3′UTR sequences.”
§ miR-27a and miR-27b regulate autophagic clearance of damaged mitochondria by targeting PTEN-induced putative kinase 1 (PINK1) > Results > PINK1 expression is regulated by miRNAs
plain- Asserted: passes — The authors put it forward as true.
- Checkable: passes — It can be checked against evidence.
- Load-bearing: passes — The paper’s conclusions depend on it.
- Based: passes — The paper gives a reason why it holds.
Probably not a substantial claim.
A claim is checked only against the cited paper’s full text, never its abstract, and none is available for its sources.
In the paper
“Mutations in PARKIN and PINK1 are the leading causes of autosomal recessive PD [9, 10].”
§ miR-27a and miR-27b regulate autophagic clearance of damaged mitochondria by targeting PTEN-induced putative kinase 1 (PINK1) > Background
What the sources say
- Not checked — no full text of the sourcecites [9] Kitada T, Asakawa S, Hattori N, Matsumine H, Yamamura Y, Minoshima S, et al. Mutations in the parkin gene cause autosomal recessive juvenile parkinsonism. Nature. 1998;392(6676):605–8. source
- Not checked — no full text of the sourcecites [10] Valente EM, Abou-Sleiman PM, Caputo V, Muqit MM, Harvey K, Gispert S, et al. Hereditary early-onset Parkinson’s disease caused by mutations in PINK1. Science. 2004;304(5674):1158–60. source
plaindirect- Asserted: passes — The authors put it forward as true.
- Checkable: passes — It can be checked against evidence.
- Load-bearing: fails — The paper’s conclusions may not depend on it.
- Based: passes — The paper gives a reason why it holds.
Probably not a substantial claim. The paper’s conclusions may not depend on it.
A conclusion the paper draws from its own results — it cites no other source for it, so there is none to check. The quote shows it is in the paper.
In the paper
“Because we demonstrated that endogenous miR-27a/b regulate PINK1 expression in human dopaminergic-like M17 cells, our study raises the possibility that miR-27a/b may regulate PINK1 expression in dopaminergic neurons of the human midbrain.”
§ miR-27a and miR-27b regulate autophagic clearance of damaged mitochondria by targeting PTEN-induced putative kinase 1 (PINK1) > Discussion
hedgedconditional- Asserted: passes — The authors put it forward as true.
- Checkable: passes — It can be checked against evidence.
- Load-bearing: passes — The paper’s conclusions depend on it.
- Based: passes — The paper gives a reason why it holds.
Probably not a substantial claim.
A conclusion the paper draws from its own results — it cites no other source for it, so there is none to check. The quote shows it is in the paper.
In the paper
“We demonstrated that miR-27a and miR-27b regulate PINK1 expression and autophagic clearance of damaged mitochondria.”
§ miR-27a and miR-27b regulate autophagic clearance of damaged mitochondria by targeting PTEN-induced putative kinase 1 (PINK1) > Abstract > Conclusions
boosteddirect- Asserted: passes — The authors put it forward as true.
- Checkable: passes — It can be checked against evidence.
- Load-bearing: passes — The paper’s conclusions depend on it.
- Based: passes — The paper gives a reason why it holds.
It may state two separate claims as one.
A conclusion the paper draws from its own results — it cites no other source for it, so there is none to check. The quote shows it is in the paper.
In the paper
“Taken together, miR-27a/b are endogenous inhibitors of mitophagy and may function as a negative feedback loop under chronic mitophagic flux (Fig. 9c).”
§ miR-27a and miR-27b regulate autophagic clearance of damaged mitochondria by targeting PTEN-induced putative kinase 1 (PINK1) > Results > Induction of miR-27a/b under the chronic mitophagic flux condition
hedgedconditional- Asserted: passes — The authors put it forward as true.
- Checkable: passes — It can be checked against evidence.
- Load-bearing: passes — The paper’s conclusions depend on it.
- Based: passes — The paper gives a reason why it holds.
It may state two separate claims as one.
A conclusion the paper draws from its own results — it cites no other source for it, so there is none to check. The quote shows it is in the paper.
In the paper
“These studies suggest that mitophagy is actively regulated by diverse miRNAs at multiple levels.”
§ miR-27a and miR-27b regulate autophagic clearance of damaged mitochondria by targeting PTEN-induced putative kinase 1 (PINK1) > Discussion
hedgeddirect- Asserted: passes — The authors put it forward as true.
- Checkable: passes — It can be checked against evidence.
- Load-bearing: fails — The paper’s conclusions may not depend on it.
- Based: passes — The paper gives a reason why it holds.
Probably not a substantial claim. The paper’s conclusions may not depend on it.
The paper relies on this without support.
Post-transcriptional regulation of human PINK1 by miRNAs is poorly defined.
“However, post-transcriptional regulation of human PINK1 by miRNAs is poorly defined.”
The paper relies on this without support.
PINK1 is maintained at low levels under normal physiological conditions.
“PINK1, a mitochondrial serine/threonine kinase, is maintained at low levels under normal physiological conditions.”
The paper relies on this without support.
PINK1 activates Parkin by phosphorylating it at Ser65.
“PINK1 activates Parkin by phosphorylating it at Ser65.”
Claims other papers make about this one
Each is checked against this paper’s own text: does it say what the citing paper says it does?
The cited source says what the claim attributes to it.
In the citing paper
“transfection of miR-27b caused impaired PRKN translocation, in line with our previous description [32].”
From miRNA family miR-29 inhibits PINK1-PRKN signaling via ATG9A (2026) · cites this paper as [32]
The cited source says what the claim attributes to it.
In the citing paper
“However, of the five miRNAs that have been experimentally confirmed to directly target PINK1 [37–39], only miR-27b [32] was among the top hits in our genome-wide screen.”
From miRNA family miR-29 inhibits PINK1-PRKN signaling via ATG9A (2026) · cites this paper as [32]
In the citing paper
“These mitochondria and MAM-enriched miRNAs have been reported to be involved in regulating inflammatory and immune responses, and/or autophagy [66, 67], which is particularly intriguing, given the role of mitochondria and MAMs in these same cellular response events [4, 5, 9].”
From The Mitochondria-Associated ER Membranes Are Novel Subcellular Locations Enriched for Inflammatory-Responsive MicroRNAs (2020) · cites this paper as [67]
Self-check
Percentages, sums and reported differences re-computed from the paper’s own numbers.
Each contradiction between two passages listed here was confirmed by an independent check.
Rated minor: it would not touch a result — a value no result rests on, a p-value that stays on the same side of the significance level, or a conflict that is clerical, resolved elsewhere in the paper, or outside its own findings.
In the paper
§ miR-27a and miR-27b regulate autophagic clearance of damaged mitochondria by targeting PTEN-induced putative kinase 1 (PINK1) > Results > Induction of miR-27a/b under the chronic mitophagic flux condition
“miR-27a and miR-27b are produced from miR-23a ~ 27a ~ 24–2 cluster at chromosome 19p13 and miR-23b ~ 27b ~ 24–1 cluster at chromosome 9q22, respectively”
§ miR-27a and miR-27b regulate autophagic clearance of damaged mitochondria by targeting PTEN-induced putative kinase 1 (PINK1) > Discussion
“miR-27a and miR-27b are produced from miR-23a ~ 27a ~ 24–2 and miR-23b ~ 27b ~ 24–2 cluster, respectively.”
Citations
Cites
MicroRNAs: Target Recognition and Regulatory Functions
Bartel, D. P. (2009) · Cell · doi:10.1016/j.cell.2009.01.002 · Cited by 20,068 · cited 1×
“microRNAs (miRNAs) have been gaining growing attention as key regulators of protein coding genes [25, 26].”
Lewis, B. P., Burge, C. B., & Bartel, D. P. (2005) · Cell · doi:10.1016/j.cell.2004.12.035 · Cited by 11,855
Dauer, W., & Przedborski, S. (2003) · Neuron · doi:10.1016/s0896-6273(03)00568-3 · Cited by 5,469
Mutations in the parkin gene cause autosomal recessive juvenile parkinsonism
Kitada, T., Asakawa, S., Hattori, N., Matsumine, H., Yamamura, Y., Minoshima, S., Yokochi, M., Mizuno, Y., & Shimizu, N. (1998) · Nature · doi:10.1038/33416 · Cited by 5,227 · cited 1×
“Mutations in PARKIN and PINK1 are the leading causes of autosomal recessive PD [9, 10].”
BackgroundThe widespread regulation of microRNA biogenesis, function and decay
Krol, J., Loedige, I., & Filipowicz, W. (2010) · Nature Reviews Genetics · doi:10.1038/nrg2843 · Cited by 4,672 · cited 1×
“microRNAs (miRNAs) have been gaining growing attention as key regulators of protein coding genes [25, 26].”
BackgroundMicroRNA genes are transcribed by RNA polymerase II
Lee, Y., Kim, M., Han, J., Yeom, K.-H., Lee, S., Baek, S. H., & Kim, V. N. (2004) · The EMBO Journal · doi:10.1038/sj.emboj.7600385 · Cited by 4,556 · cited 1×
“The mature miRNAs of miR-23a ~ 27a ~ 24–2 cluster are known to be derived from a single primary transcript [42].”
BackgroundA Mammalian microRNA Expression Atlas Based on Small RNA Library Sequencing
Landgraf, P., Rusu, M., Sheridan, R., Sewer, A., Iovino, N., Aravin, A., Pfeffer, S., Rice, A., Kamphorst, A. O., Landthaler, M., et al. (2007) · Cell · doi:10.1016/j.cell.2007.04.040 · Cited by 3,626 · cited 1×
“Among 49 miRNAs commonly predicted by different algorithms, 7 miRNAs were known to be expressed in human midbrain [34].”
BackgroundHereditary Early-Onset Parkinson's Disease Caused by Mutations in PINK1
Valente, E. M., Abou-Sleiman, P. M., Caputo, V., Muqit, M. M. K., Harvey, K., Gispert, S., Ali, Z., Del Turco, D., Bentivoglio, A. R., Healy, D. G., et al. (2004) · Science · doi:10.1126/science.1096284 · Cited by 3,481 · cited 1×
“Mutations in PARKIN and PINK1 are the leading causes of autosomal recessive PD [9, 10].”
BackgroundMitochondria: In Sickness and in Health
Nunnari, J., & Suomalainen, A. (2012) · Cell · doi:10.1016/j.cell.2012.02.035 · Cited by 3,479 · cited 2×
“Discussion Mitochondria play critical roles in a variety of cellular functions, such as energy production, calcium homeostasis, and apoptosis [44].”
BackgroundPINK1 Is Selectively Stabilized on Impaired Mitochondria to Activate Parkin
Narendra, D. P., Jin, S. M., Tanaka, A., Suen, D.-F., Gautier, C. A., Shen, J., Cookson, M. R., & Youle, R. J. (2010) · PLoS Biology · doi:10.1371/journal.pbio.1000298 · Cited by 2,944 · cited 1×
“Upon mitochondrial damage, PINK1 is quickly stabilized on damaged mitochondria, which leads to translocation of cytosolic Parkin to damaged mitochondria [11–13].”
Background
Cited by
Sorted by citations
Items 101–163 of 163
Oh, M., Park, H. S., Chae, D., Yu, A., Park, J. H., Heo, J., Cho, K., Kim, J., Lim, B., Kim, J.-M., et al. (2025) · Signal Transduction and Targeted Therapy · doi:10.1038/s41392-025-02516-0 · Cited by 12
Self-citationLi, J., Cui, X., Ma, X., Li, C., & Wang, Z. (2019) · Gerontology · doi:10.1159/000500156 · Cited by 12
Xin, G., Niu, J., Tian, Q., Fu, Y., Chen, L., Yi, T., Tian, K., Sun, X.-S., Wang, N., Wang, J., et al. (2023) · PLoS ONE · doi:10.1371/journal.pone.0294984 · Cited by 10
miR-27b promotes angiogenesis and skin repair in scalded rats through regulating VEGF-C expression
Liu, J., Sun, F.-R., Wang, X., et al. (2020) · Lasers in Medical Science · doi:10.1007/s10103-020-02991-7 · Cited by 11
Lanore, A., Lesage, S., Mariani, L., Menon, P. J., Ravassard, P., Cheval, H., Corti, O., Brice, A., & Corvol, J. (2022) · Genes · doi:10.3390/genes13030479 · Cited by 11
“Mitochondrial damage could induce overexpression of PINK1 [130].”
BackgroundMicroRNAs in Parkinson’s disease: From pathogenesis to diagnostics and therapeutic strategies
Zheng, D., & Chen, J. (2025) · Neuroscience · doi:10.1016/j.neuroscience.2025.01.038 · Cited by 14
Elucidation of how the Mir-23-27-24 cluster regulates development and aging
Yap, X.-L., & Chen, J. (2024) · Experimental & Molecular Medicine · doi:10.1038/s12276-024-01266-3 · Cited by 9
“Interestingly, under chronic mitophagic fl ux, the expression of both of these miRNAs was signi fi cantly upregulated, indicating a negative feedback mechanism between PINK1-mediated mitophagy and the MIR-23-27-24 cluster.”
BackgroundProtein Translation in the Pathogenesis of Parkinson’s Disease
Ashraf, D., Khan, M. R., Dawson, T. M., & Dawson, V. L. (2024) · International Journal of Molecular Sciences · doi:10.3390/ijms25042393 · Cited by 13
“One example of an actionable regulatory mechanism was provided by Kim et al., 2016, who reported that miR-27b acted to suppress the expression of PINK1 by binding to its 3-UTR [64].”
BackgroundShi, J., Wang, S., He, Q., Liu, K., Zhao, W. H., Xie, Q., & Cheng, L. (2021) · Journal of Cellular and Molecular Medicine · doi:10.1111/jcmm.16745 · Cited by 8
Mohan, J., Abdul, N. S., Nagiah, S., et al. (2022) · Toxins · doi:10.3390/toxins14030171 · Cited by 9
“MiR-27b is a negative regulator of mitophagy as it can directly inhibit PINK1 expression via binding to the 3′-UTR of PINK1 mRNA [29].”
BackgroundGuidelines for mitochondrial RNA analysis
Jusić, A., Erpapazoglou, Z., Dalgaard, L. T., Lakkisto, P., de Gonzalo‐Calvo, D., Benczik, B., Ágg, B., Ferdinandy, P., Fiedorowicz, K., Schroen, B. L. M., et al. (2024) · Molecular Therapy — Nucleic Acids · doi:10.1016/j.omtn.2024.102262 · Cited by 8
Yang, Z., Wang, J., Zhao, T., Wang, L., Liang, T., & Zheng, Y. (2024) · Journal of Ethnopharmacology · doi:10.1016/j.jep.2024.118461 · Cited by 8
Click RNA for Rapid Capture and Identification of Intracellular MicroRNA Targets
Zhang, P., Fu, H., Du, S., Wang, F., Yang, J. A., Cai, W., & Liu, D. (2019) · Analytical Chemistry · doi:10.1021/acs.analchem.9b03943 · Cited by 7
miRNA family miR-29 inhibits PINK1-PRKN dependent mitophagy via ATG9APreprint
Markham, B. N., Ramnarine, C., Kim, S., Grever, W. E., Soto‐Beasley, A. I., Heckman, M. G., Ren, Y., Osborne, A. C., Bhagwate, A. V., Liu, Y., et al. (2024) · bioRxiv (Cold Spring Harbor Laboratory) · doi:10.1101/2024.01.17.576122 · Cited by 7
Self-citationDeng, L., Huo, P., Feng, M., et al. (2023) · Molecular Oral Microbiology · doi:10.1111/omi.12416 · Cited by 6
Unlocking Parkinson’s disease: the role of microRNAs in regulation, diagnosis, and therapy
Li, X., Fu, Q., Guo, M., Du, Y., & Cheng, Y. (2025) · APOPTOSIS · doi:10.1007/s10495-025-02117-w · Cited by 8
“Moreover, miR-27a/b directly target the 3’-UTR of PINK1 mRNA, downregulating PINK1 expression and impairing the autophagic clearance of damaged mitochondria [ 50 ].”
Sanadgol, N., Samadi, M., Voelz, C., Khalseh, R., Amini, J., Beyer, C., Kipp, M., & Clarner, T. (2025) · Cell & Bioscience · doi:10.1186/s13578-025-01438-2 · Cited by 8
“…therapy to enhance mitochondrial clearance by modulating miR-27/ PINK1 pathway) In vitro (Human cervical HeLa and dopamin-ergic-like M17 cells) [75] miR-34a,b,c PINK1 (Therapeutic potential of modulating miR-34a-5p to restore PINK1-mediated mitophagy) In vitro (HEK293 cells) & in vivo (old…”
InfluentialMitophagy Unveiled: Exploring the Nexus of Mitochondrial Health and Neuroendocrinopathy
Oyovwi, M. O., Ugwuishi, E. W., Udi, O. A., & Joseph, G. U. (2024) · Journal of Molecular Neuroscience · doi:10.1007/s12031-024-02280-w · Cited by 7
“For instance, certain miRNAs can bind to the messenger RNAs (mRNAs) of proteins involved in the mitophagic pathway, such as PINK1, Parkin, and LC3, thereby influencing their expression levels (Kim et al. 2016).”
Tsamou, M., Carpi, D., Pistollato, F., & Roggen, E. (2022) · Journal of Alzheimer s Disease · doi:10.3233/jad-215434 · Cited by 6
“…and miR-27b regulated PTEN-induced kinase 1 expression and autophagic clearance of damaged mitochondria in human dopaminergic-like M17 cells [158]. miR-124 regu-latedautophagyviatargetingAMPK/mTORpathway inhumandopaminergicneurons[159]. miR-128tar-geted key members in mTOR signaling,…”
Brown, J. S. (2023) · Neuroscience & Biobehavioral Reviews · doi:10.1016/j.neubiorev.2023.105206 · Cited by 6
Kaur, S., Bhatti, G. K., Khullar, N., & Bhatti, J. S. (2025) · Ageing Research Reviews · doi:10.1016/j.arr.2025.102920 · Cited by 6
Specific microRNAs for Modulation of Autophagy in Spinal Cord Injury
Visintin, R., & Ray, S. K. (2022) · Brain Sciences · doi:10.3390/brainsci12020247 · Cited by 6
Functional and molecular early enteric biomarkers for Parkinson’s disease in mice and menPreprint
Gries, M., Christmann, A., Schulte, S., Weyland, M., Rommel, S., Martin, M., Baller, M. K., Röth, R., Schmitteckert, S., Unger, M. M., et al. (2020) · bioRxiv (Cold Spring Harbor Laboratory) · doi:10.1101/2020.06.06.136556 · Cited by 5
PINK1: Multiple mechanisms of neuroprotection
Lizama, B. N., Otero, P. A., & Chu, C. T. (2021) · International review of movement disorders · doi:10.1016/bs.irmvd.2021.08.003 · Cited by 4
PTEN: a new dawn in Parkinson’s disease treatment
Yang, X., Liu, T., & Cheng, H. (2025) · Frontiers in Cellular Neuroscience · doi:10.3389/fncel.2025.1497555 · Cited by 4
Khish, N. S., Ghiasizadeh, P., rasti, A., Moghimi, O., Zadeh, A. Z., Bahiraee, A., & Ebrahimi, R. (2023) · Current Medicinal Chemistry · doi:10.2174/0929867331666230817102135 · Cited by 4
Vastegani, Z. M., Ghaedi-Heidari, R., Oroujalian, A., et al. (2025) · Metabolic Brain Disease · doi:10.1007/s11011-025-01568-z · Cited by 3
“These miRNAs influence autophagic clearance of damaged mitochondria, a process crucial in PD pathology (Kim et al. 2016).”
Mondal, A., Banerjee, S. S., Naskar, S., Bose, C., Saha, C., Pramanik, S., Mukherjee, B., Jati, P., Sahana, P. K., Malik, R. A., et al. (2025) · European Journal of Neurology · doi:10.1111/ene.70449 · Cited by 3
“Moreover, high urinary miR- 27a-3p has been shown to be a biomarker for diabetic kidney disease [26] and diabetic retinopathy [27]. miR-27a, together with miR-27b, has been shown to play an important role in an in vitro model of neurovegetative disease [28].”
Mitochondria-Associated MicroRNAs: Emerging Roles in the Pathogenesis of Parkinson’s Disease
Catanesi, M., Leandro, L. D., Colasante, M., Cimini, A., d’Angelo, M., Castelli, V., Obreja, C. M., & Ippoliti, R. (2026) · Biomedicines · doi:10.3390/biomedicines14020313 · Cited by 3
“MiRNAs called miR-27a and miR-27b have been implicated in the regulation of mitophagy through their direct interaction, at the level of the outer membrane, with PINK1 [39], a serine/threonine kinase essential for the selective autophagic clearance of damaged mitochondria.”
Zhao, F., Wei, W., Huang, D., & Guo, Y. (2023) · PubMed Central · Cited by 3
Genetic Evaluation of Mitochondria Dysfunction in Coronary Artery Disease
Doğan, N. (2023) · Turk Kardiyoloji Dernegi Arsivi-Archives of the Turkish Society of Cardiology · doi:10.5543/tkda.2022.39448 · Cited by 3
MicroRNA-27b alleviates septic cardiomyopathy by targeting the Mff/MAVS axis
Wang, X., Huang, L., Xu, J., et al. (2025) · Frontiers in Cellular and Infection Microbiology · doi:10.3389/fcimb.2025.1588461 · Cited by 2
Azam, H. M. H., Mumtaz, M., Rödiger, S., Schierack, P., Hussain, N., & Ambreen, A. (2025) · Neurological Sciences · doi:10.1007/s10072-025-08419-w · Cited by 4
Possible Role of Cellular Polyamine Metabolism in Neuronal Apoptosis
Ji, X., Yu, W., Jin, M.-J., Lu, L., Yin, H., & Wang, H. (2024) · Current Medical Science · doi:10.1007/s11596-024-2843-9 · Cited by 2
Unlocking molecular secrets: The role of miRNAs in Parkinson's disease dynamics
Abdelhamid, R., Abobakr, M., Mohamed, M., Hussieny, A., Mohamed, A., tarek, M., & Elshaer, S. S. (2025) · Neuropharmacology · doi:10.1016/j.neuropharm.2025.110542 · Cited by 1
Murakami, T., Ohuchi, K., Kiuchi, M., Kurita, H., Kawai, K., Kakiuchi, R., Hirayama, T., Nagasawa, H., Wu, Z., Maekawa, Y., et al. (2026) · Scientific Reports · doi:10.1038/s41598-026-35368-x · Cited by 1
“It is known that PINK1 deficiency induced mitophagy dysfunction 47 .”
The role of non-coding RNA-mediated autophagy in Alzheimer’s disease
Wang, Y., Bao, G., Li, H., Li, X., & Lv, L. (2026) · Brain Research Bulletin · doi:10.1016/j.brainresbull.2026.111860 · Cited by 1
Sundram, S., Dhiman, N., Malviya, R., & Awasthi, R. (2023) · Current Gene Therapy · doi:10.2174/1566523223666230731093030 · Cited by 4
Nguyen, H. D., & Kim, M.-S. (2024) · Epigenetics and human health · doi:10.1007/978-3-031-64788-8_10 · Cited by 1
Xu, Y., Wang, Y., Yang, M., Yuan, P., Xu, W., Jiang, T., & Huang, J. J. (2025) · Nutrients · doi:10.3390/nu17132204 · Cited by 2
“The aforementioned results are consistent with the majority of previous reports on oxidative stress [29–32].”
MicroRNAs Regulating Autophagy in Neurodegeneration
Lai, Q., Kovzel, N., Konovalov, R., & Vinnikov, I. A. (2021) · Advances in experimental medicine and biology · doi:10.1007/978-981-16-2830-6_11 · Cited by 1
Alkhazaali-Ali, Z., Negah, S. S., Boroumand, A. R., & Afshari, J. T. (2024) · Preprints.org · doi:10.20944/preprints202404.0366.v1 · Cited by 1
miRNA family miR-29 inhibits PINK1-PRKN signaling via ATG9A
Markham, B. N., Ramnarine, C., Kim, S., Grever, W. E., Soto-Beasley, A. I., Heckman, M. G., Ren, Y., Osborne, A. C., Kehili, M., Bhagwate, A. V., et al. (2026) · Molecular Neurodegeneration Advances · doi:10.1186/s44477-026-00029-w
“However, of the five miRNAs that have been experimentally confirmed to directly target PINK1 [37–39], only miR-27b [32] was among the top hits in our genome-wide screen.”
Self-citationOverview of the Cross-Talk Between Hormones and Mitochondria
Morio, B., Casas, F., & Pénicaud, L. (2019) · Elsevier eBooks · doi:10.1016/b978-0-12-811752-1.00003-1
Jiang, H., Fu, C., Yuan, D., Jiang, Y., & Li, Y. (2021) · Research Square · doi:10.21203/rs.3.rs-482635/v1
MicroRNA Candidate Biomarkers for Parkinson’s Disease and Idiopathic REM Sleep Behavior DisorderPreprint
Wu, L., Liu, J., Li, Y., Cao, Y. J., Liu, W., Zhang, H., Zhao, A., & Luo, N. (2021) · Research Square · doi:10.21203/rs.3.rs-1163742/v1
ROLE OF MICRORNAS IN THE PATHOGENESIS OF PARKINSON'S DISEASEPreprint
Hou, J., & Wang, S. (2022) · doi:10.22541/au.166811281.13825488/v1
Sanadgol, N., Samadi, M., Voelz, C., Khalseh, R., Amini, J., Beyer, C., Kipp, M., & Clarner, T. (2025) · Research Square · doi:10.21203/rs.3.rs-6391900/v1
Afrooghe, A., Ahmadi, E., Shayan, M., Ohadi, M. A. D., Behnoush, A. H., & Dehpour, A. R. (2025) · Journal of Pharmacy and Pharmacology · doi:10.1093/jpp/rgaf039
MicroRNA Dysregulation in Neurodegeneration: Role, Biomarker Potential and Therapeutics
Dogra, S. R., Bhonsle, J., & Sharma, A. (2025) · Canadian Journal of Neurological Sciences / Journal Canadien des Sciences Neurologiques · doi:10.1017/cjn.2025.10361 · Cited by 1
Bhamare, U. U., Talpade, A., Pingili, R. B., & Palkar, M. B. (2025) · European Journal of Neuroscience · doi:10.1111/ejn.70343
“Furthermore, miR-27a has been implicated in the repression of NDUFS4 (Complex I subunit) and, together with miR-155, suppression of ATP5G3 (Complex V subunit) (Prajapati et al. 2015), thereby compounding mitochondrial respiratory inefficiency and oxidative stress (Kim et al. 2016).”
Jia, L., Zhu, M., Yang, J., Pang, Y., Wang, Q., Li, Y., Li, T., Li, F., Wang, Q., Li, Y., et al. (2021) · Figshare · doi:10.6084/m9.figshare.17010109
Jia, L., Zhu, M., Yang, J., Pang, Y., Wang, Q., Li, Y., Li, T., Li, F., Wang, Q., Li, Y., et al. (2021) · Figshare · doi:10.6084/m9.figshare.17010112
Targeted regulation of mitophagy as a potential target for liver fibrosis therapy
Yang, X., Zhiguo, M. A. O., Lin, X., Liu, Y., Miao, M. S., & Bai, M. (2025) · Discover Medicine · doi:10.1007/s44337-025-00554-9
“An abnormal decrease in the MMP was observed in activated LX2 cells, suggesting that miR-27a negatively regulates the expression of PINK1 and impairs mitochondrial function, especially mitophagy, in activated HSCs [47].”
Zhou, L., Qi, H., Zhu, L., et al. (2026) · Apmis · doi:10.1111/apm.70157
Giardino, D. L., Huck-Iriart, C., Gonzalez, P. M., Aguirre, P. A., Fededa, J. P., Peralta, C., Valiensi, S. M., & Garay, A. D. C. (2026) · Neurological Sciences · doi:10.1007/s10072-026-08945-1
Cell-free mitochondrial DNA and microRNA-137 for early diagnosis of preeclampsia
Marek‐Iannucci, S., Tigano, M., Cardetti, C., Sheu, S.-S., Huaman, M. G., Alvarez, R., Rame, J. E., Boelig, R. C., & Rajapreyar, I. N. (2026) · Frontiers in Cardiovascular Medicine · doi:10.3389/fcvm.2026.1778221
“Furthermore, the miRNAs we chose for the purpose of this study have been associated with mitochondrial turnover and therefore mtDNA content (34). miRNA-27a and miRNA-27b have been associated with the regulation of mitophagy by targeting PINK1 (35).”
Noncoding RNAs regulating serine/threonine kinases in neurodegeneration
Khamineh, Y., Ghiasvand, M., Zolghadri, S., & Saboury, A. A. (2026) · Elsevier eBooks · doi:10.1016/b978-0-443-44173-8.00007-3
The Diagnostic and Therapeutic Value of Micro-RNA in Parkinson’s Disease
Lin, G.-L., Wang, Y., & Cheng, B.-H. (2026) · Cellular and Molecular Neurobiology · doi:10.1007/s10571-026-01767-x
“…pathway and leading to cell death (Yoo et al. 2023). miR-27a/b strongly downregulate PINK1 expression, resulting in the failure of Parkin to trans-locate to mitochondria, diminished ubiquitin phosphorylation, reduced accumulation of LC3-II, and ultimately, impaired mitophagy (Kim et al. 2016).”
MicroRNAs modulate cell death mechanisms in neurodegenerative disorders
Singh, A., Subramanian, M., & Singh, A. (2026) · Aging advances. · doi:10.4103/agingadv.agingadv-d-26-00023
Kothari, A., Narayanan, M. P., Yadav, S. R. M., Kumari, R., Kumar, H., KHERDEKAR, R. S., Yadav, S., Shaw, P., Chakrapani, B., Ansari, P., et al. (2026) · Biomedicines · doi:10.3390/biomedicines14091886
Hu, X., Jiang, W., Yuan, X., Pu, Q., Zhao, K., & Huang, T. (2026) · Frontiers in Microbiology · doi:10.3389/fmicb.2026.1941726
“An earlier study has determined the key role for miR-27a and miR-27b in the regulation of mitophagy (Kim et al., 2016).”
Metadata
- Authors
- Kim, J., Fiesel, F. C., Belmonte, K. C., Hudec, R., Wang, W.-X., Kim, C., Nelson, P. T., Springer, W., & Kim, J.
- Affiliations
- Mayo Clinic (US)
- University of Kentucky (US)
- Corresponding author
- Kim, Jaekwang
- Kim, Jungsu
- ORCID
- Venue
- Molecular Neurodegeneration
- Published
- 2016-07-26
- Volume
- 11
- Issue
- 1
- Pages
- 55-55
- ISSN
- 1750-1326 (ISSN-L)
- PMC
- PMC4960690
- OpenAlex
- W2504529755
- Semantic Scholar
- bb585ee0de9115f5d851f228e68e14e168788670
- Cited by
- 163
- References
- 70
- Citations by year
- 2026: 12 · 2025: 24 · 2024: 15 · 2023: 19 · 2022: 20 · 2021: 28 · 2020: 14 · 2019: 11 · 2018: 12 · 2017: 5 · 2016: 3
- FWCI
- 6.65
- Type
- journal article
- Language
- en
- Open access
- gold
- doi.org
- Locations
- Molecular Neurodegeneration (publishedVersion, cc-by)
- PubMed (publishedVersion)
- PubMed Central (submittedVersion, cc-by)
- UKnowledge (University of Kentucky) (submittedVersion, cc-by)
- Funders
- National Institute on Aging (AG016574, AG005681, AG028383)
- National Institute of Neurological Disorders and Stroke (NS085830, NS085070)
- Topics
- Health Sciences › Medicine › Clinical Neurology › Parkinson's Disease Mechanisms and Treatments
- Life Sciences › Biochemistry, Genetics and Molecular Biology › Cell Biology › Autophagy in Disease and Therapy
- Life Sciences › Biochemistry, Genetics and Molecular Biology › Cancer Research › MicroRNA in disease regulation
- Keywords
- miR-27a, miR-27b, PINK1, mitophagy, autophagy, Parkinson's disease, microRNA regulation, 3' untranslated region, translational regulation, mitochondrial damage, Parkin, ubiquitin phosphorylation, LC3-II, lysosomal degradation, cyclooxygenase-2, negative feedback regulation, miRNA-based therapy, neuroprotection
- MeSH terms
- PTEN-Induced Putative Kinase, Autophagy, Cell Line, Fluorescent Antibody Technique, Gene Expression Regulation, Humans, Mitochondria, Parkinson Disease, Protein Kinases, Blotting, Western, MicroRNAs, Immunoprecipitation, Real-Time Polymerase Chain Reaction
About these checks
Registry, retraction, Cites and statistics results are computed, not judged, with one exception: a printed reference that no index lists is read once by a model before it counts as a citation error. Claims are extracted by a model and kept only when their quote appears verbatim in the text; each cited source is then checked, with a model’s help, for whether it says what the claim relies on. Those verdicts can be wrong — read the claim’s quote and the cited source before relying on one.
A language model drew the claims from the paper on 2026-10-17, under version 3 of the claim definition (model deepseek-v4.1-flash, prompt extract-v3).
A second model labelled each claim on 2026-10-17 (model jev-1.13-20260917, definition revision gold-guideline-v0.2).
Cited sources are checked with a language model’s help (gpt-6-sol).
Statistics and arithmetic are recomputed, not judged.
Confidence bands are shown only for fields calibrated on our annotated test set. None is calibrated yet, so no band is shown.
What counts as a claim ›How we measure confidence ›How we check this ›
Are you an author, or do you see a problem with this page? Request a review
