

The DOI matches its Crossref record; 129 of the 129 references it cites were found in a registry or an index.
Locus coeruleus cellular and molecular pathology during the progression of Alzheimer’s disease
Open accessAbstract
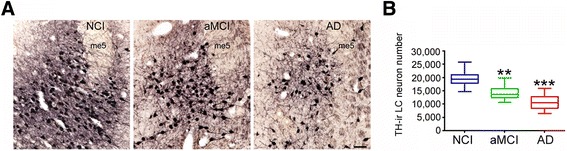
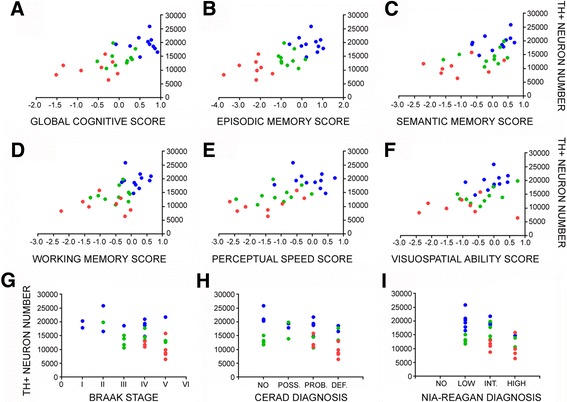
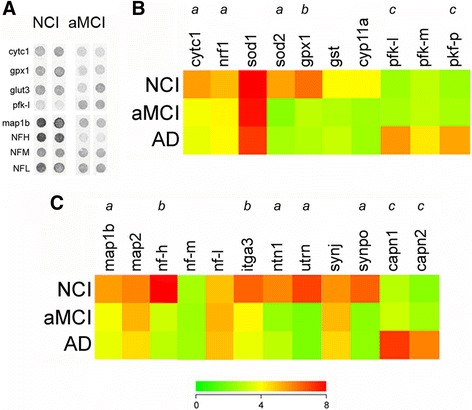
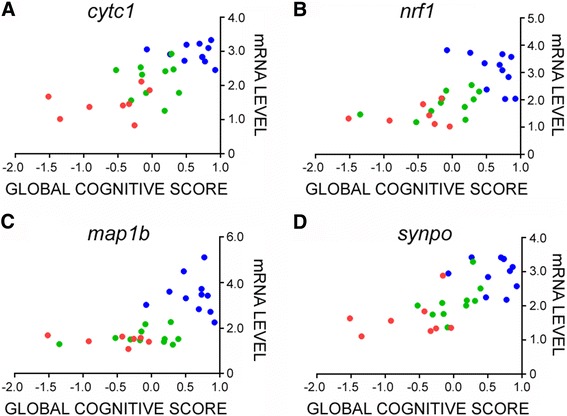
A major feature of Alzheimer's disease (AD) is the loss of noradrenergic locus coeruleus (LC) projection neurons that mediate attention, memory, and arousal. However, the extent to which the LC projection system degenerates during the initial stages of AD is still under investigation. To address this question, we performed tyrosine hydroxylase (TH) immunohistochemistry and unbiased stereology of noradrenergic LC neurons in tissue harvested postmortem from subjects who died with a clinical diagnosis of no cognitive impairment (NCI), amnestic mild cognitive impairment (aMCI, a putative prodromal AD stage), or mild/moderate AD. Stereologic estimates of total LC neuron number revealed a 30% loss during the transition from NCI to aMCI, with an additional 25% loss of LC neurons in AD. Decreases in noradrenergic LC neuron number were significantly associated with worsening antemortem global cognitive function as well as poorer performance on neuropsychological tests of episodic memory, semantic memory, working memory, perceptual speed, and visuospatial ability. Reduced LC neuron numbers were also associated with increased postmortem neuropathology. To examine the cellular and molecular pathogenic processes underlying LC neurodegeneration in aMCI, we performed single population microarray analysis. These studies revealed significant reductions in select functional classes of mRNAs regulating mitochondrial respiration, redox homeostasis, and neuritic structural plasticity in neurons accessed from both aMCI and AD subjects compared to NCI. Specific gene expression levels within these functional classes were also associated with global cognitive deterioration and neuropathological burden. Taken together, these observations suggest that noradrenergic LC cellular and molecular pathology is a prominent feature of prodromal disease that contributes to cognitive dysfunction. Moreover, they lend support to a rational basis for targeting LC neuroprotection as a disease modifying strategy.
Overview
The claims and statistics of this paper haven’t been checked yet.
Run the check — free, no account needed. It reads the open-access text and checks the sources it cites.
Integrity signals
Registry
Cites
Statistics
Figures
Verification
Claims the paper makes
The claims and statistics of this paper haven’t been checked yet.
Run the check — free, no account needed. It reads the open-access text and checks the sources it cites.
Claims other papers make about this one
Each is checked against this paper’s own text: does it say what the citing paper says it does?
In the citing paper
“Subsequent studies identified the locus coeruleus as the first site of pathology in AD subjects, with NFTs preceding cortical tau or Aβ deposits [41–43].”
From Systems-based proteomics to resolve the biology of Alzheimer’s disease beyond amyloid and tau (2021) · cites this paper as [41]
Self-check
Percentages, sums and reported differences re-computed from the paper’s own numbers.
The self-check needs the paper’s full text.
Citations
Cites
McKhann, G., Drachman, D., Folstein, M., Katzman, R., Price, D., & Stadlan, E. M. (1984) · Neurology · doi:10.1212/wnl.34.7.939 · Cited by 27,915
McKhann, G. M., Knopman, D. S., Chertkow, H., Hyman, B. T., Jack, C. R., Kawas, C. H., Klunk, W. E., Koroshetz, W. J., Manly, J. J., Mayeux, R., et al. (2011) · Alzheimer's & Dementia · doi:10.1016/j.jalz.2011.03.005 · Cited by 18,657
Neuropathological stageing of Alzheimer-related changes.
Braak, H., & Braak, E. (1991) · Acta Neuropathologica · doi:10.1007/bf00308809 · Cited by 16,123
Albert, M. S., DeKosky, S. T., Dickson, D., Dubois, B., Feldman, H. H., Fox, N. C., Gamst, A., Holtzman, D. M., Jagust, W. J., Petersen, R. C., et al. (2011) · Alzheimer's & Dementia · doi:10.1016/j.jalz.2011.03.008 · Cited by 10,152 · cited 1×
“Sporadic Alzheimer’s disease (AD) is believed to have an extensive preclinical stage since neuropathological examinations of older people with a clinical diagnosis of no or mild cognitive impairment (MCI; a putative prodromal stage of AD) consistently reveal similar pathological signatures to those with frank AD [2, 7…”
Mild cognitive impairment as a diagnostic entity
Petersen, R. C. (2004) · Journal of Internal Medicine · doi:10.1111/j.1365-2796.2004.01388.x · Cited by 7,864
Highly parallel genome-wide expression profiling of individual cells using nanoliter droplets.
Macosko, E. Z., Basu, A., Satija, R., Nemesh, J., Shekhar, K., Goldman, M., Tirosh, I., Bialas, A. R., Kamitaki, N., Martersteck, E. M., et al. (2015) · Cell · doi:10.1016/j.cell.2015.05.002 · Cited by 7,110
Dahlstroem, A., & Fuxé, K. (1964) · PubMed · Cited by 5,133
Mirra, S. S., Heyman, A., McKeel, D., Sumi, S. M., Crain, B. J., Brownlee, L. M., Vogel, F. S., Hughes, J. P., Belle, G. V., Berg, L., et al. (1991) · Neurology · doi:10.1212/wnl.41.4.479 · Cited by 4,961
Winblad, B., Palmer, K., Kivipelto, M., Jelic, V., Fratiglioni, L., Wahlund, L. ‐., Nordberg, A., Bäckman, L., Albert, M., Almkvist, O., et al. (2004) · Journal of Internal Medicine · doi:10.1111/j.1365-2796.2004.01380.x · Cited by 4,946
Current concepts in mild cognitive impairment
Petersen, R. C., Doody, R., Kurz, A., Mohs, R. C., Morris, J. C., Rabins, P. V., Ritchie, K., Rossor, M., Thal, L., & Winblad, B. (2001) · Archives of Neurology · doi:10.1001/archneur.58.12.1985 · Cited by 4,781
Aston-Jones, G., & Cohen, J. D. (2005) · Annual Review of Neuroscience · doi:10.1146/annurev.neuro.28.061604.135709 · Cited by 4,472
SELECTIVE LOSS OF CENTRAL CHOLINERGIC NEURONS IN ALZHEIMER'S DISEASE
DAVIES, P. (1976) · The Lancet · doi:10.1016/s0140-6736(76)91936-x · Cited by 3,565
Hyman, B. T., Phelps, C. H., Beach, T. G., Bigio, E. H., Cairns, N. J., Carrillo, M. C., Dickson, D. W., Duyckaerts, C., Frosch, M. P., Masliah, E., et al. (2012) · Alzheimer's & Dementia · doi:10.1016/j.jalz.2011.10.007 · Cited by 3,092
GUNDERSEN, H. J. G., BENDTSEN, T. F., KORBO, L., MARCUSSEN, N., MØLLER, A., NIELSEN, K., NYENGAARD, J. R., PAKKENBERG, B., SØRENSEN, F. B., VESTERBY, A., et al. (1988) · APMIS · doi:10.1111/j.1699-0463.1988.tb05320.x · Cited by 2,929
Albert, M., DeKosky, S. T., Dickson, D. W., Dubois, B., Feldman, H., Fox, N. C., Gamst, A. C., Holtzman, D. M., Jagust, W. J., Petersen, R. C., et al. (2013) · FOCUS The Journal of Lifelong Learning in Psychiatry · doi:10.1176/appi.focus.11.1.96 · Cited by 2,643
Berridge, C. W., & Waterhouse, B. D. (2003) · Brain Research Reviews · doi:10.1016/s0165-0173(03)00143-7 · Cited by 2,529
Nucleus locus ceruleus: new evidence of anatomical and physiological specificity
Foote, S. L., Bloom, F. E., & Aston-Jones, G. (1983) · Physiological Reviews · doi:10.1152/physrev.1983.63.3.844 · Cited by 1,901
The locus coeruleus and noradrenergic modulation of cognition
Sara, S. J. (2009) · Nature Reviews Neuroscience · doi:10.1038/nrn2573 · Cited by 1,848
Identifying differentially expressed genes using false discovery rate controlling procedures
Reiner, A., Yekutieli, D., & Benjamini, Y. (2003) · Bioinformatics · doi:10.1093/bioinformatics/btf877 · Cited by 1,765
Alzheimer disease: Evidence for selective loss of cholinergic neurons in the nucleus basalis
Whitehouse, P. J., Price, D. L., Clark, A. W., Coyle, J. T., & DeLong, M. R. (1981) · Annals of Neurology · doi:10.1002/ana.410100203 · Cited by 1,736
Mitochondrial abnormalities in Alzheimer's disease
Hirai, K., Aliev, G., Nunomura, A., Fujioka, H., Russell, R. L., Atwood, C. S., Johnson, A. B., Kress, Y., Vinters, H. V., Tabaton, M., et al. (2001) · The Journal of Neuroscience · doi:10.1523/jneurosci.21-09-03017.2001 · Cited by 1,367
Asher, R. (1961) · The Lancet · doi:10.1016/s0140-6736(61)91217-x · Cited by 1,293
Buettner, F., Natarajan, K. N., Casale, F. P., Proserpio, V., Scialdone, A., Theis, F. J., Teichmann, S. A., Marioni, J. C., & Stegle, O. (2015) · Nature Biotechnology · doi:10.1038/nbt.3102 · Cited by 1,136
Natural history of mild cognitive impairment in older persons
Bennett, D. A., Wilson, R. S., Schneider, J. A., Evans, D. A., Beckett, L. A., Aggarwal, N. T., Barnes, L. L., Fox, J. H., & Bach, J. (2002) · Neurology · doi:10.1212/wnl.59.2.198 · Cited by 1,037
Zarow, C., Lyness, S. A., Mortimer, J. A., & Chui, H. C. (2003) · Archives of Neurology · doi:10.1001/archneur.60.3.337 · Cited by 1,003
Ageing and neuronal vulnerability
Mattson, M. P., & Magnus, T. (2006) · Nature Reviews Neuroscience · doi:10.1038/nrn1886 · Cited by 957
Handbook of chemical neuroanatomy
(2005) · Handbook of chemical neuroanatomy · doi:10.1016/s0924-8196(05)80001-6 · Cited by 906
The pathological process underlying Alzheimer’s disease in individuals under thirty
Braak, H., & Del Tredici, K. (2011) · Acta Neuropathologica · doi:10.1007/s00401-010-0789-4 · Cited by 812
An autoradiographic study of the projections of the central nucleus of the monkey amygdala
Price, J. L., & Amaral, D. (1981) · Journal of Neuroscience · doi:10.1523/jneurosci.01-11-01242.1981 · Cited by 709
Unnerstall, J. R., Kopajtic, T. A., & Kuhar, M. J. (1984) · Brain Research Reviews · doi:10.1016/0165-0173(84)90030-4 · Cited by 708
Regionally specific loss of neurons in the aging human hippocampus
West, M. J. (1993) · Neurobiology of Aging · doi:10.1016/0197-4580(93)90113-p · Cited by 626
Liang, W. S., Reiman, E. M., Valla, J., Dunckley, T., Beach, T. G., Grover, A., Niedzielko, T. L., Schneider, L. E., Mastroeni, D., Caselli, R., et al. (2008) · Proceedings of the National Academy of Sciences · doi:10.1073/pnas.0709259105 · Cited by 585
Mild cognitive impairment is related to Alzheimer disease pathology and cerebral infarctions
Bennett, D. A., Schneider, J. A., Bienias, J. L., Evans, D. A., & Wilson, R. S. (2005) · Neurology · doi:10.1212/01.wnl.0000152982.47274.9e · Cited by 537
Disease‐specific patterns of locus coeruleus cell loss
German, D. C., Manaye, K. F., White, C. L., Woodward, D. J., McIntire, D. D., Smith, W. K., Kalaria, R. N., & Mann, D. M. A. (1992) · Annals of Neurology · doi:10.1002/ana.410320510 · Cited by 512
Chan‐Palay, V., & Asan, E. (1989) · The Journal of Comparative Neurology · doi:10.1002/cne.902870308 · Cited by 493
Neuropathologic Substrate of Mild Cognitive Impairment
Markesbery, W. R., Schmitt, F. A., Kryscio, R. J., Davis, D. G., Smith, C. D., & Wekstein, D. R. (2006) · Archives of Neurology · doi:10.1001/archneur.63.1.38 · Cited by 460
Increased oxidative damage in nuclear and mitochondrial DNA in Alzheimer's disease
Wang, J., Xiong, S., Xie, C., Markesbery, W. R., & Lovell, M. A. (2005) · Journal of Neurochemistry · doi:10.1111/j.1471-4159.2005.03053.x · Cited by 452
Neuroplasticity Failure in Alzheimer's Disease
Mesulam, M.-M. (1999) · Neuron · doi:10.1016/s0896-6273(00)81109-5 · Cited by 449
Changes in the Brain Catecholamines in Patients with Dementia of Alzheimer Type
Adolfsson, R., Gottfries, C. G., Roos, B. E., & Winblad, B. G. (1979) · The British Journal of Psychiatry · doi:10.1192/bjp.135.3.216 · Cited by 449
Role of fructose 2,6-bisphosphate in the control of glycolysis in mammalian tissues
Hue, L., & Rider, M. H. (1987) · Biochemical Journal · doi:10.1042/bj2450313 · Cited by 421
Theofilas, P., Ehrenberg, A. J., Dunlop, S., Di Lorenzo Alho, A. T., Nguy, A., Leite, R. E. P., Rodriguez, R. D., Mejia, M. B., Suemoto, C. K., Ferretti-Rebustini, R. E. D. L., et al. (2017) · Alzheimer's & Dementia · doi:10.1016/j.jalz.2016.06.2362 · Cited by 416
Colocalization of Tau and Alpha-Synuclein Epitopes in Lewy Bodies
Ishizawa, T., Mattila, P. M., Davies, P., Wang, D., & Dickson, D. W. (2003) · Journal of Neuropathology & Experimental Neurology · doi:10.1093/jnen/62.4.389 · Cited by 402
Grudzien, A., Shaw, P., Weintraub, S., Bigio, E., Mash, D. C., & Mesulam, M. M. (2007) · Neurobiology of Aging · doi:10.1016/j.neurobiolaging.2006.02.007 · Cited by 396
Reddy, P. H., Tripathi, R., Troung, Q., Tirumala, K., Reddy, T. P., Anekonda, V., Shirendeb, U. P., Calkins, M. J., Reddy, A. P., Mao, P., et al. (2012) · Biochimica et Biophysica Acta (BBA) - Molecular Basis of Disease · doi:10.1016/j.bbadis.2011.10.011 · Cited by 394
Oxidative Stress Signaling in Alzheimers Disease
Su, B., Wang, X., Nunomura, A., Moreira, P., Lee, H.-G., Perry, G., Smith, M., & Zhu, X. (2008) · Current Alzheimer Research · doi:10.2174/156720508786898451 · Cited by 344
Subtype of Mild Cognitive Impairment and Progression to Dementia and Death
Yaffe, K. S., Petersen, R. C., Lindquist, K. J., Kramer, J. H., & Miller, B. L. (2006) · Dementia and Geriatric Cognitive Disorders · doi:10.1159/000095427 · Cited by 339
Arnsten, A. F. T., & Goldman-Rakic, P. S. (1984) · Brain Research · doi:10.1016/0006-8993(84)90351-2 · Cited by 333
Bondareff, W. (1981) · The Lancet · doi:10.1016/s0140-6736(81)92657-x · Cited by 332
Arendt, T., Schindler, C., Brückner, M. K., Eschrich, K., Bigl, V., Zedlick, D., & Marcova, L. (1997) · The Journal of Neuroscience · doi:10.1523/jneurosci.17-02-00516.1997 · Cited by 319
Reddy, P. H. (2011) · Brain Research · doi:10.1016/j.brainres.2011.07.052 · Cited by 311
Monoaminergic neuropathology in Alzheimer’s disease
Šimić, G., Leko, M. B., Wray, S., Harrington, C. R., Delalle, I., Milošević, N. J., Bažadona, D., Buée, L., de Silva, R., Giovanni, G. D., et al. (2016) · Progress in Neurobiology · doi:10.1016/j.pneurobio.2016.04.001 · Cited by 297
Synaptopodin-deficient mice lack a spine apparatus and show deficits in synaptic plasticity
Deller, T., Körte, M., Chabanis, S., Drakew, A., Schwegler, H., Stefani, G. G., Zúñiga, A., Schwarz, K., Bonhoeffer, T., Zeller, R., et al. (2003) · Proceedings of the National Academy of Sciences · doi:10.1073/pnas.1832384100 · Cited by 291
Changes in the Monoamine Containing Neurones of the Human Cns in Senile Dementia
Mann, D. M. A., Lincoln, J., Yates, P. O., Stamp, J., & Toper, S. (1980) · The British Journal of Psychiatry · doi:10.1192/bjp.136.6.533 · Cited by 285
Neural reserve, neuronal density in the locus ceruleus, and cognitive decline
Wilson, R. S., Nag, S., Boyle, P. A., Hizel, L. P., Yu, L., Buchman, A. S., Schneider, J. A., & Bennett, D. A. (2013) · Neurology · doi:10.1212/wnl.0b013e3182897103 · Cited by 283
Mufson, E. J., Bothwell, M. A., & Kordower, J. H. (1989) · Experimental Neurology · doi:10.1016/0014-4886(89)90124-6 · Cited by 279
Self-citationMild cognitive impairment: pathology and mechanisms
Mufson, E. J., Binder, L. I., Counts, S., DeKosky, S. T., deToledo‐Morrell, L., Ginsberg, S. D., Ikonomović, M. D., Perez, S. E., & Scheff, S. W. (2011) · Acta Neuropathologica · doi:10.1007/s00401-011-0884-1 · Cited by 268
Self-citationCalcium‐Activated Neutral Proteinase (Calpain) System in Aging and Alzheimer's Diseasea
Nixon, R. A., Saito, K., Grynspan, F., Griffin, W. R., Katayama, S., Honda, T., Mohan, P. S., Shea, T. B., & Beermann, M. L. (1994) · Annals of the New York Academy of Sciences · doi:10.1111/j.1749-6632.1994.tb44402.x · Cited by 257
Heneka, M. T., Galea, E., Gavriluyk, V., Dumitrescu‐Ozimek, L., Daeschner, J., O’Banion, M. K., Weinberg, G. L., Klockgether, T., & Feinstein, D. L. (2002) · Journal of Neuroscience · doi:10.1523/jneurosci.22-07-02434.2002 · Cited by 255
Ginsberg, S. D., Alldred, M. J., Counts, S. E., Cataldo, A. M., Neve, R. L., Jiang, Y., Wuu, J., Chao, M. V., Mufson, E. J., Nixon, R. A., et al. (2010) · Biological Psychiatry · doi:10.1016/j.biopsych.2010.05.030 · Cited by 243
Self-citationEntorhinal Cortex β-Amyloid Load in Individuals with Mild Cognitive Impairment
Mufson, E. J., Chen, E.-Y., Cochran, E. J., Beckett, L. A., Bennett, D. A., & Kordower, J. H. (1999) · Experimental Neurology · doi:10.1006/exnr.1999.7086 · Cited by 241
Self-citationChan‐Palay, V., & Asan, E. (1989) · The Journal of Comparative Neurology · doi:10.1002/cne.902870307 · Cited by 237
Role of Nrf1 in antioxidant response element-mediated gene expression and beyond
Biswas, M., & Chan, J. Y. (2009) · Toxicology and Applied Pharmacology · doi:10.1016/j.taap.2009.07.034 · Cited by 229
Noradrenergic regulation of inflammatory gene expression in brain
Feinstein, D. L., Heneka, M. T., Gavrilyuk, V., Russo, C. D., Weinberg, G. L., & Galea, E. (2002) · Neurochemistry International · doi:10.1016/s0197-0186(02)00049-9 · Cited by 222
de Silva, R., Lashley, T., Gibb, G., Hanger, D. P., Hope, A., Reid, A. R., Bandopadhyay, R., Utton, M. A., Strand, C., Jowett, T. P., et al. (2003) · Neuropathology and Applied Neurobiology · doi:10.1046/j.1365-2990.2003.00463.x · Cited by 221
Mufson, E. J., Ma, S. Y., Cochran, E. J., Bennett, D. A., Beckett, L., Jaffar, S., Saragovi, H. U., & Kordower, J. H. (2000) · The Journal of Comparative Neurology · doi:10.1002/1096-9861(20001106)427:1 · Cited by 219
Postsynaptic Abnormalities at the Neuromuscular Junctions of Utrophin-deficient Mice
Deconinck, A. E., Potter, A. C., Tinsley, J. M., Wood, S. J., Vater, R., Young, C., Metzinger, L., Vincent, A. C., Slater, C. R., & Davies, K. E. (1997) · The Journal of Cell Biology · doi:10.1083/jcb.136.4.883 · Cited by 218
Counts, S., Nadeem, M., Lad, S. P., Wuu, J., & Mufson, E. J. (2006) · Journal of Neuropathology & Experimental Neurology · doi:10.1097/00005072-200606000-00007 · Cited by 212
Self-citationNoradrenergic Innervation of Cerebral Cortex: Widespread Effects of Local Cortical Lesions
Morrison, J. H., Molliver, M. E., & Grzanna, R. (1979) · Science · doi:10.1126/science.451605 · Cited by 210
Early neurone loss in Alzheimer’s disease: cortical or subcortical?
Arendt, T., Brückner, M. K., Morawski, M., Jäger, C., & Gertz, H. (2015) · Acta Neuropathologica Communications · doi:10.1186/s40478-015-0187-1 · Cited by 210
The human locus coeruleus: computer reconstruction of cellular distribution
German, D. C., Walker, B., Manaye, K. F., Smith, W. K., Woodward, D., & Aj, N. (1988) · Journal of Neuroscience · doi:10.1523/jneurosci.08-05-01776.1988 · Cited by 208
A role for netrin-1 in the guidance of cortical efferents
Métin, C., Deléglise, D., Serafini, T. A., Kennedy, T. E., & Tessier‐Lavigne, M. (1997) · Development · doi:10.1242/dev.124.24.5063 · Cited by 205
Trumpower, B. L. (1981) · Biochimica et Biophysica Acta (BBA) - Reviews on Bioenergetics · doi:10.1016/0304-4173(81)90008-2 · Cited by 204
Alzheimer's disease: Neurofibrillary tangles in nuclei that project to the cerebral cortex
German, D. C., White, C. L., & Sparkman, D. R. (1987) · Neuroscience · doi:10.1016/0306-4522(87)90123-0 · Cited by 204
Mufson, E. J., Ma, S. Y., Dills, J. L., Cochran, E. J., Leurgans, S. E., Wuu, J., Bennett, D. A., Jaffar, S., Gilmor, M. L., Levey, A. I., et al. (2002) · The Journal of Comparative Neurology · doi:10.1002/cne.10122 · Cited by 198
Self-citationMitochondrial abnormalities and oxidative imbalance in Alzheimer disease
Zhu, X., Perry, G. L., Moreira, P. I., Aliev, G., Cash, A., Hirai, K., & Smith, M. A. (2006) · Journal of Alzheimer s Disease · doi:10.3233/jad-2006-9207 · Cited by 195
Dhar, S. S., Ongwijitwat, S., & Wong-Riley, M. T. T. (2008) · Journal of Biological Chemistry · doi:10.1074/jbc.m707587200 · Cited by 188
Morrison, J. H., Foote, S. L., O’Connor, D., & Bloom, F. E. (1982) · Brain Research Bulletin · doi:10.1016/0361-9230(82)90144-7 · Cited by 186
Monoaminergic innervation of the frontal and temporal lobes in Alzheimer's disease
Palmer, A. M., Wilcock, G. K., Esiri, M. M., Francis, P. T., & Bowen, D. M. (1987) · Brain Research · doi:10.1016/0006-8993(87)91408-9 · Cited by 186
Feinstein, D. L., Kalinin, S., & Braun, D. J. (2016) · Journal of Neurochemistry · doi:10.1111/jnc.13447 · Cited by 185
Functional Consequences of Locus Coeruleus Degeneration in Alzheimers Disease
Weinshenker, D. (2008) · Current Alzheimer Research · doi:10.2174/156720508784533286 · Cited by 180
Increased 4R-Tau Induces Pathological Changes in a Human-Tau Mouse Model
Schoch, K. M., DeVos, S. L., Miller, R. L., Chun, S. J., Norrbom, M., Wozniak, D. F., Dawson, H. N., Bennett, C. F., Rigo, F., & Miller, T. M. (2016) · Neuron · doi:10.1016/j.neuron.2016.04.042 · Cited by 175
NEURONAL DEGENERATION IN LOCUS CERULEUS AND CORTICAL CORRELATES OF ALZHEIMER DISEASE
Bondareff, W., Mountjoy, C. Q., Roth, M., Rossor, M. N., Iversen, L. L., Reynolds, G. P., & Hauser, D. L. (1987) · Alzheimer Disease & Associated Disorders · doi:10.1097/00002093-198701040-00005 · Cited by 166 · cited 2×
“As reductions in LC neuron number have been associated with increased cortical amyloid plaque and NFT loads in cases of frank AD [18, 108], these observations in early stage cases indicate a strong relationship between LC projection system degeneration and the pathologic sequela of AD.”
Noradrenaline activation of neurotrophic pathways protects against neuronal amyloid toxicity
Counts, S., & Mufson, E. J. (2010) · Journal of Neurochemistry · doi:10.1111/j.1471-4159.2010.06622.x · Cited by 160
Self-citationRequirement of Heavy Neurofilament Subunit in the Development of Axons with Large Calibers
Elder, G. A., Friedrich, V. L., Kang, C., Bosco, P., Gourov, A., Tu, P., Zhang, B., Lee, V. M. ‐., & Lazzarini, R. A. (1998) · The Journal of Cell Biology · doi:10.1083/jcb.143.1.195 · Cited by 146
Synaptic gene dysregulation within hippocampal CA1 pyramidal neurons in mild cognitive impairment
Counts, S., Alldred, M. J., Che, S., Ginsberg, S. D., & Mufson, E. J. (2013) · Neuropharmacology · doi:10.1016/j.neuropharm.2013.10.018 · Cited by 144
Self-citationORAL CONTRACEPTION AND GENITAL TRACT MALIGNANCY
Kay, C. R., Beral, V., & Hannaford, P. (1989) · The Lancet · doi:10.1016/s0140-6736(89)92601-9 · Cited by 141
Evidence for Mitochondrial UPR Gene Activation in Familial and Sporadic Alzheimer's Disease
Beck, J. S., Mufson, E. J., & Counts, S. (2016) · Current Alzheimer Research · doi:10.2174/1567205013666151221145445 · Cited by 139
Self-citationMolecular and cellular pathophysiology of preclinical Alzheimer’s disease
Mufson, E. J., Ikonomović, M. D., Counts, S., Perez, S. E., Malek‐Ahmadi, M. H., Scheff, S. W., & Ginsberg, S. D. (2016) · Behavioural Brain Research · doi:10.1016/j.bbr.2016.05.030 · Cited by 134
Self-citationUnbiased Estimation of Neuronal Numbers in the Human Nucleus Coeruleus during Aging
Ohm, T. G., Busch, C., & Bohl, J. R. E. (1997) · Neurobiology of Aging · doi:10.1016/s0197-4580(97)00034-1 · Cited by 126
Berchtold, N. C., Sabbagh, M. N., Beach, T. G., Kim, R. C., Cribbs, D. H., & Cotman, C. W. (2014) · Neurobiology of Aging · doi:10.1016/j.neurobiolaging.2014.03.031 · Cited by 124
A comparison of changes in the nucleus basalis and locus caeruleus in Alzheimer's disease.
Mann, D. M. A., Yates, P. O., & Marcyniuk, B. (1984) · Journal of Neurology Neurosurgery & Psychiatry · doi:10.1136/jnnp.47.2.201 · Cited by 123
Cellular, synaptic, and biochemical features of resilient cognition in Alzheimer’s disease
Arnold, S. E., Louneva, N., Cao, K., Wang, L.-S., Han, L.-Y., Wolk, D. A., Negash, S., Leurgans, S. E., Schneider, J. A., Buchman, A. S., et al. (2013) · Neurobiology of Aging · doi:10.1016/j.neurobiolaging.2012.03.004 · Cited by 123
α7 Nicotinic Receptor Up-regulation in Cholinergic Basal Forebrain Neurons in Alzheimer Disease
Counts, S., He, B., Che, S., Ikonomović, M. D., DeKosky, S. T., Ginsberg, S. D., & Mufson, E. J. (2007) · Archives of Neurology · doi:10.1001/archneur.64.12.1771 · Cited by 117
Self-citationThe noradrenaline precursor L-DOPS reduces pathology in a mouse model of Alzheimer’s disease
Kalinin, S., Polak, P. E., Lin, S. X., Sakharkar, A. J., Pandey, S. C., & Feinstein, D. L. (2012) · Neurobiology of Aging · doi:10.1016/j.neurobiolaging.2011.04.012 · Cited by 116
Ginsberg, S. D., Che, S., Counts, S. E., & Mufson, E. J. (2006) · Journal of Neurochemistry · doi:10.1111/j.1471-4159.2005.03641.x · Cited by 111
Self-citationFornůsková, D., Stibůrek, L., Wenchich, L., Vinšová, K., Hansíková, H., & Zeman, J. (2010) · Biochemical Journal · doi:10.1042/bj20091714 · Cited by 105
Spatial, Temporal and Numeric Analysis of Alzheimer Changes in the Nucleus Coeruleus
Busch, C., Bohl, J. R. E., & Ohm, T. G. (1997) · Neurobiology of Aging · doi:10.1016/s0197-4580(97)00035-3 · Cited by 105
Levy, S. F., LeBoeuf, A. C., Massie, M. R., Jordan, M. A., Wilson, L., & Feinstein, S. C. (2005) · Journal of Biological Chemistry · doi:10.1074/jbc.m413490200 · Cited by 102
Arendt, T. (2000) · Neurobiology of Aging · doi:10.1016/s0197-4580(00)00216-5 · Cited by 91
Brain site‐specific gene expression analysis in Alzheimer's disease patients
Yokota, T., Mishra, M., Akatsu, H., Tani, Y., Miyauchi, T., Yamamoto, T., Kosaka, K., Nagai, Y., Sawada, T., & Heese, K. (2006) · European Journal of Clinical Investigation · doi:10.1111/j.1365-2362.2006.01722.x · Cited by 86
Relevance of parahippocampal-locus coeruleus connectivity to memory in early dementia
Jacobs, H. I. L., Wiese, S., van de Ven, V. G., Gronenschild, E. H. B. M., Verhey, F. R. J., & Matthews, P. M. (2014) · Neurobiology of Aging · doi:10.1016/j.neurobiolaging.2014.10.041 · Cited by 85
RNA amplification strategies for small sample populations
Ginsberg, S. D. (2005) · Methods · doi:10.1016/j.ymeth.2005.09.003 · Cited by 85
Self-citationAmplification of RNA transcripts using terminal continuation
Che, S., & Ginsberg, S. D. (2004) · Laboratory Investigation · doi:10.1038/labinvest.3700005 · Cited by 83
Self-citationLiang, W. S., Dunckley, T. L., Beach, T. G., Grover, A., Mastroeni, D., Ramsey, K. M., Caselli, R. J., Kukull, W. A., McKeel, D. W., Morris, J. C., et al. (2008) · Neurobiology of Aging · doi:10.1016/j.neurobiolaging.2008.05.013 · Cited by 81
Kremerskothen, J., Plaas, C., Kindler, S., Frotscher, M., & Barnekow, A. (2004) · Journal of Neurochemistry · doi:10.1111/j.1471-4159.2004.02888.x · Cited by 80
MAP1B enhances microtubule assembly rates and axon extension rates in developing neurons
Tymanskyj, S. R., Scales, T. M. E., & Gordon‐Weeks, P. R. (2011) · Molecular and Cellular Neuroscience · doi:10.1016/j.mcn.2011.10.003 · Cited by 79
Madrigal, J. L. M., Kalinin, S., Richardson, J. C., & Feinstein, D. L. (2007) · Journal of Neurochemistry · doi:10.1111/j.1471-4159.2007.04888.x · Cited by 77
Arendt, T., Brückner, M. K., Bigl, V., & Marcova, L. (1995) · The Journal of Comparative Neurology · doi:10.1002/cne.903510204 · Cited by 72
Alldred, M. J., Duff, K., & Ginsberg, S. D. (2011) · Neurobiology of Disease · doi:10.1016/j.nbd.2011.10.022 · Cited by 61
Self-citationNeuropathology of the locus ceruleus: a semi-quantitative study
Tomonaga, M. (1983) · Journal of Neurology · doi:10.1007/bf00313699 · Cited by 61
Norepinephrine Protects against Amyloid-β Toxicity via TrkB
Liu, X., Ye, K., & Weinshenker, D. (2015) · Journal of Alzheimer s Disease · doi:10.3233/jad-141062 · Cited by 60
Improved Detection of Substantia Nigra Pathology in Alzheimer's Disease
Schneider, J. A., Bienias, J. L., Gilley, D. W., Kvarnberg, D. E., Mufson, E. J., & Bennett, D. A. A. (2002) · Journal of Histochemistry & Cytochemistry · doi:10.1177/002215540205000111 · Cited by 57
Self-citationCounts, S., He, B., Che, S., Ginsberg, S. D., & Mufson, E. J. (2009) · Journal of Alzheimer s Disease · doi:10.3233/jad-2009-1196 · Cited by 54
Self-citationFörstl, H., Levy, R., Burns, A. S., Luthert, P. J., & Cairns, N. (1994) · Pharmacopsychiatry · doi:10.1055/s-2007-1014267 · Cited by 52
Terminal continuation (TC) RNA amplification without second strand synthesis
Alldred, M. J., Che, S., & Ginsberg, S. D. (2008) · Journal of Neuroscience Methods · doi:10.1016/j.jneumeth.2008.10.027 · Cited by 50
Self-citationCounts, S., Chen, E., Che, S., Ikonomović, M. D., Wuu, J., Ginsberg, S. D., DeKosky, S. T., & Mufson, E. J. (2006) · Dementia and Geriatric Cognitive Disorders · doi:10.1159/000090906 · Cited by 48
Self-citationNoradrenergic System in Down Syndrome and Alzheimer's Disease A Target for Therapy
Phillips, C., Fahimi, A., Das, D., Mojabi, F. S., Ponnusamy, R., & Salehi, A. (2015) · Current Alzheimer Research · doi:10.2174/1567205012666150921095924 · Cited by 48
Perez, S. E., He, B., Nadeem, M., Wuu, J., Scheff, S. W., Abrahamson, E. E., Ikonomović, M. D., & Mufson, E. J. (2014) · Biological Psychiatry · doi:10.1016/j.biopsych.2013.12.016 · Cited by 47
Self-citationAlterations of Ca2+-responsive proteins within cholinergic neurons in aging and Alzheimer's disease
Riascos, D., Nicholas, A., Samaeekia, R., Yukhananov, R. Y., Mesulam, M. M., Bigio, E. H., Weıntraub, S., Guo, L., & Geula, C. (2013) · Neurobiology of Aging · doi:10.1016/j.neurobiolaging.2013.12.017 · Cited by 47
Dhar, S. S., Liang, H., & Wong‐Riley, M. T. T. (2009) · Journal of Neurochemistry · doi:10.1111/j.1471-4159.2009.05929.x · Cited by 45
Counts, S., & Mufson, E. J. (2012) · Elsevier eBooks · doi:10.1016/b978-0-12-374236-0.10012-4 · Cited by 44
Self-citationImmunocytochemical localization of dopamine-β-hydroxylase in neurons of the human brain stem
Kemper, C. M., O’Connor, D. T., & Westlund, K. N. (1987) · Neuroscience · doi:10.1016/0306-4522(87)90173-4 · Cited by 42
Counts, S., He, B., Che, S., Ginsberg, S. D., & Mufson, E. J. (2008) · Neurodegenerative Diseases · doi:10.1159/000113710 · Cited by 39
Self-citationTiernan, C. T., Ginsberg, S. D., Guillozet-Bongaarts, A. L., Ward, S., He, B., Kanaan, N. M., Mufson, E. J., Binder, L. I., & Counts, S. (2016) · Neurobiology of Aging · doi:10.1016/j.neurobiolaging.2016.02.031 · Cited by 38
Self-citationMitew, S., Kirkcaldie, M., Dickson, T. C., & Vickers, J. C. (2013) · Frontiers in Neuroanatomy · doi:10.3389/fnana.2013.00030 · Cited by 22
Kim, T., Lim, C., & Kaang, B. (2015) · BMB Reports · doi:10.5483/bmbrep.2015.48.7.218 · Cited by 21
A methodological study of locus coeruleus degeneration in dementing disorders
Haglund, M., Friberg, N., Danielsson, E., Norrman, J., & Englund, E. M. (2016) · Clinical Neuropathology · doi:10.5414/np300930 · Cited by 17
Role for peroxisome proliferator-activated receptor-gamma in Alzheimer's disease.
van Geel (2001) · Open Repository and Bibliography (University of Luxembourg) · doi:10.1002/1531-8249(20010201)49:2 · Cited by 7
Self-citationPrice (1999) · doi:10.1002/1531-8249(199903)45:3
Cited by
Sorted by citations
Locus coeruleus imaging as a biomarker for noradrenergic dysfunction in neurodegenerative diseases
Betts, M. J., Kirilina, E. P., Otaduy, M. C. G., Ivanov, D., Acosta‐Cabronero, J., Callaghan, M. F., Lambert, C., Cárdenas‐Blanco, A., Pine, K., Passamonti, L., et al. (2019) · Brain · doi:10.1093/brain/awz193 · Cited by 367
Tau and neuroinflammation: what impact for Alzheimer's disease and tauopathies?
Laurent, C., Buée, L., & Blum, D. (2018) · Biomedical Journal · doi:10.1016/j.bj.2018.01.003 · Cited by 348
Long Road to Ruin: Noradrenergic Dysfunction in Neurodegenerative Disease
Weinshenker, D. (2018) · Trends in Neurosciences · doi:10.1016/j.tins.2018.01.010 · Cited by 339
Jeremic, D., Jiménez-Díaz, L., & Navarro-López, J. D. (2021) · Ageing Research Reviews · doi:10.1016/j.arr.2021.101496 · Cited by 306
The role of the locus coeruleus in the generation of pathological anxiety
Morris, L. S., McCall, J. G., Charney, D. S., & Murrough, J. W. (2020) · Brain and Neuroscience Advances · doi:10.1177/2398212820930321 · Cited by 244
Metadata
- Authors
- Kelly, S. C., He, B., Perez, S. E., Ginsberg, S. D., Mufson, E. J., & Counts, S. E.
- Affiliations
- Michigan State University (US)
- Barrow Neurological Institute (US)
- Nathan Kline Institute for Psychiatric Research (US)
- Trinity Health Grand Rapids (US)
- Corresponding author
- Counts, Scott E.
- Venue
- Acta Neuropathologica Communications
- Published
- 2017-01-21
- Volume
- 5
- Issue
- 1
- Pages
- 8-8
- ISSN
- 2051-5960 (ISSN-L)
- PMC
- PMC5251221
- OpenAlex
- W2579788133
- Cited by
- 286
- References
- 129
- Citations by year
- 2026: 22 · 2025: 28 · 2024: 41 · 2023: 35 · 2022: 34 · 2021: 48 · 2020: 27 · 2019: 26 · 2018: 12 · 2017: 12
- FWCI
- 15.57
- Type
- journal article
- Language
- en
- Open access
- gold
- doi.org
- Locations
- Acta Neuropathologica Communications (publishedVersion, cc-by)
- PubMed Central (publishedVersion, cc-by)
- PubMed (publishedVersion)
- Funders
- National Institute on Aging (AG043375, AG042146)
- Saint Mary's Foundation
- Barrow and Beyond
- Topics
- Life Sciences › Neuroscience › Cellular and Molecular Neuroscience › Alzheimer's disease research and treatments
- Health Sciences › Medicine › Psychiatry and Mental health › Dementia and Cognitive Impairment Research
- Life Sciences › Neuroscience › Neurology › Neuroinflammation and Neurodegeneration Mechanisms
- Keywords
- Alzheimer's disease, locus coeruleus, noradrenergic neurons, neuronal loss, amnestic mild cognitive impairment, prodromal Alzheimer's disease, tyrosine hydroxylase, stereology, gene expression, mitochondrial respiration, redox homeostasis, cognitive decline, postmortem neuropathology, neuroprotection
- MeSH terms
- Aged, Aged, 80 and over, Alzheimer Disease, Cell Count, Female, Humans, Immunohistochemistry, Locus Coeruleus, Longitudinal Studies, Male, Neurons, Neuropsychological Tests, RNA, Messenger, Tyrosine 3-Monooxygenase, Gene Expression, Disease Progression, Microarray Analysis, Cognitive Dysfunction
About these checks
Registry, retraction, Cites and statistics results are computed, not judged, with one exception: a printed reference that no index lists is read once by a model before it counts as a citation error. Claims are extracted by a model and kept only when their quote appears verbatim in the text; each cited source is then checked, with a model’s help, for whether it says what the claim relies on. Those verdicts can be wrong — read the claim’s quote and the cited source before relying on one.
Statistics and arithmetic are recomputed, not judged.
Confidence bands are shown only for fields calibrated on our annotated test set. None is calibrated yet, so no band is shown.
What counts as a claim ›How we measure confidence ›How we check this ›
Are you an author, or do you see a problem with this page? Request a review
