

The DOI matches its Crossref record; 117 of the 117 references it cites were found in a registry or an index; 59 of the 124 sources its claims cite were checked for support.
Stabilization of Microtubule-Unbound Tau via Tau Phosphorylation at Ser262/356 by Par-1/MARK Contributes to Augmentation of AD-Related Phosphorylation and Aβ42-Induced Tau Toxicity
Open accessAbstract
Abnormal accumulation of the microtubule-interacting protein tau is associated with neurodegenerative diseases including Alzheimer's disease (AD). β-amyloid (Aβ) lies upstream of abnormal tau behavior, including detachment from microtubules, phosphorylation at several disease-specific sites, and self-aggregation into toxic tau species in AD brains. To prevent the cascade of events leading to neurodegeneration in AD, it is essential to elucidate the mechanisms underlying the initial events of tau mismetabolism. Currently, however, these mechanisms remain unclear. In this study, using transgenic Drosophila co-expressing human tau and Aβ, we found that tau phosphorylation at AD-related Ser262/356 stabilized microtubule-unbound tau in the early phase of tau mismetabolism, leading to neurodegeneration. Aβ increased the level of tau detached from microtubules, independent of the phosphorylation status at GSK3-targeted SP/TP sites. Such mislocalized tau proteins, especially the less phosphorylated species, were stabilized by phosphorylation at Ser262/356 via PAR-1/MARK. Levels of Ser262 phosphorylation were increased by Aβ42, and blocking this stabilization of tau suppressed Aβ42-mediated augmentation of tau toxicity and an increase in the levels of tau phosphorylation at the SP/TP site Thr231, suggesting that this process may be involved in AD pathogenesis. In contrast to PAR-1/MARK, blocking tau phosphorylation at SP/TP sites by knockdown of Sgg/GSK3 did not reduce tau levels, suppress tau mislocalization to the cytosol, or diminish Aβ-mediated augmentation of tau toxicity. These results suggest that stabilization of microtubule-unbound tau by phosphorylation at Ser262/356 via the PAR-1/MARK may act in the initial steps of tau mismetabolism in AD pathogenesis, and that such tau species may represent a potential therapeutic target for AD.
Overview
AI snapshot
Written from the paper’s full text.
TL;DR
In transgenic Drosophila co-expressing human tau and Aβ42, Aβ42 increases cytosolic microtubule-unbound tau, and PAR-1/MARK phosphorylation of tau at Ser262/356 stabilizes less-phosphorylated tau (taulower), contributing to Aβ42-induced tau toxicity and increased pThr231. Blocking this phosphorylation suppresses Aβ42-mediated augmentation of tau toxicity, whereas GSK3/Sgg SP/TP phosphorylation is not required for tau mislocalization or toxicity in this model.
Key findings
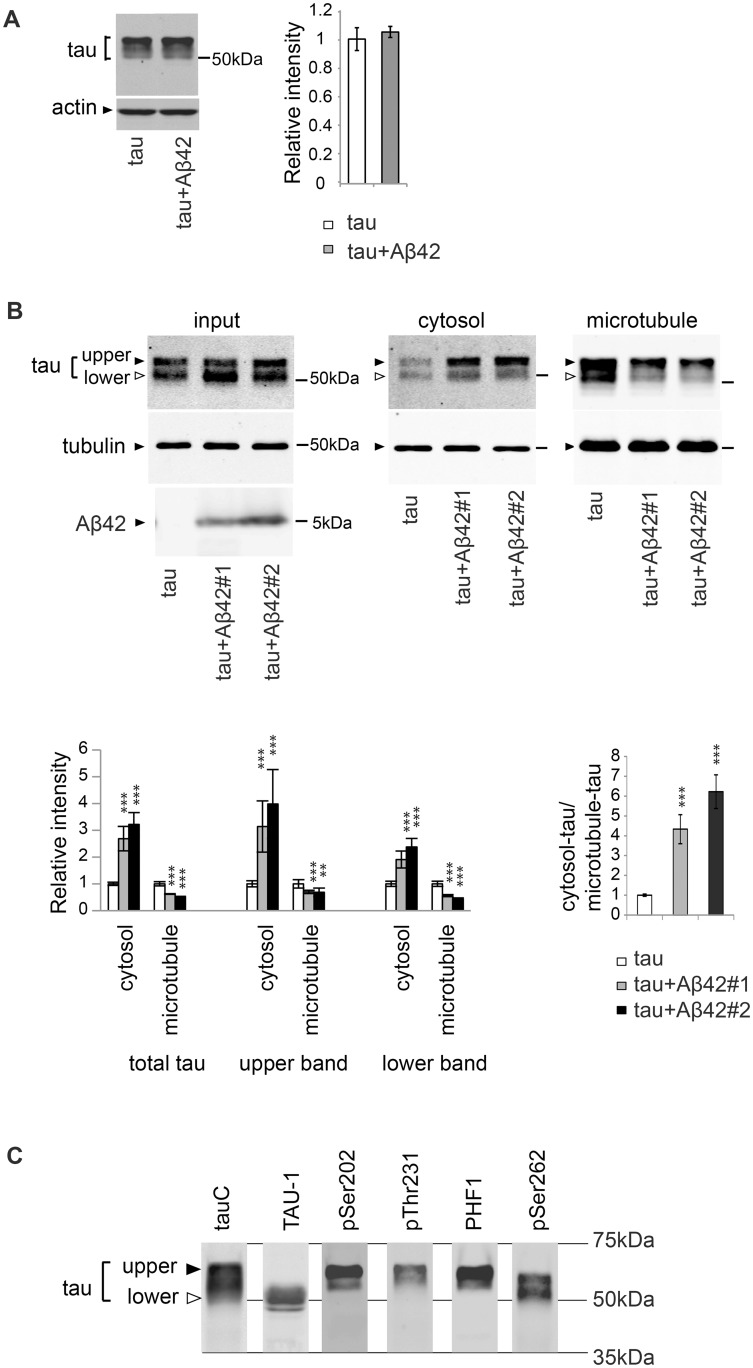
- Aβ42 co-expression increased tau in the cytosol and reduced microtubule-bound tau without changing total tau levels; both tauupper and taulower shifted, and a higher-Aβ42-expressing line showed a larger effect (Fig 1).
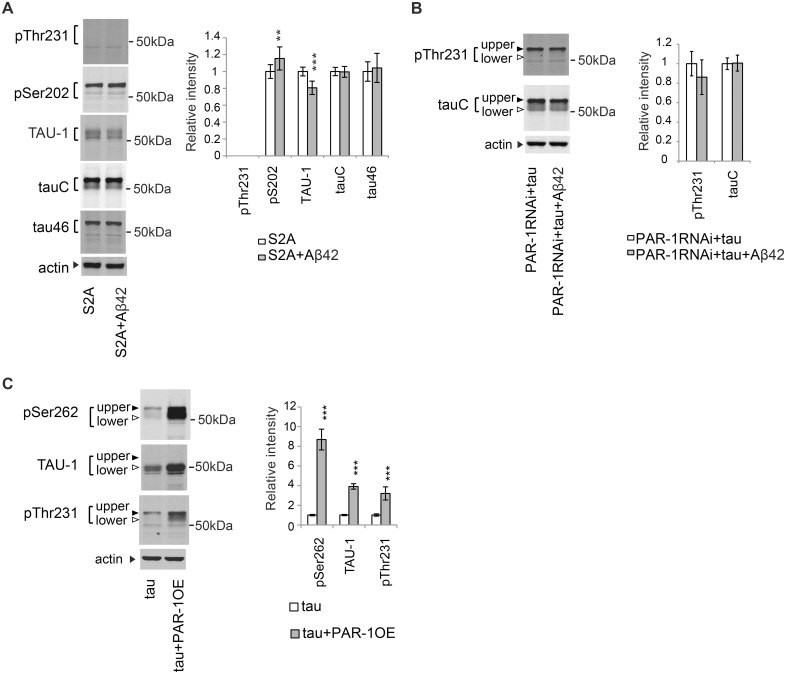
- S2A mutation at Ser262/356 preferentially reduced taulower and partially suppressed Aβ42-mediated mislocalization: Aβ42 caused a 3-fold increase in wild-type tauupper in the cytosol but only a 1.6-fold increase in S2A tauupper; S2A also blocked Aβ42-induced increases in pThr231 and suppressed tau-mediated eye degeneration (Figs 3 and 7).
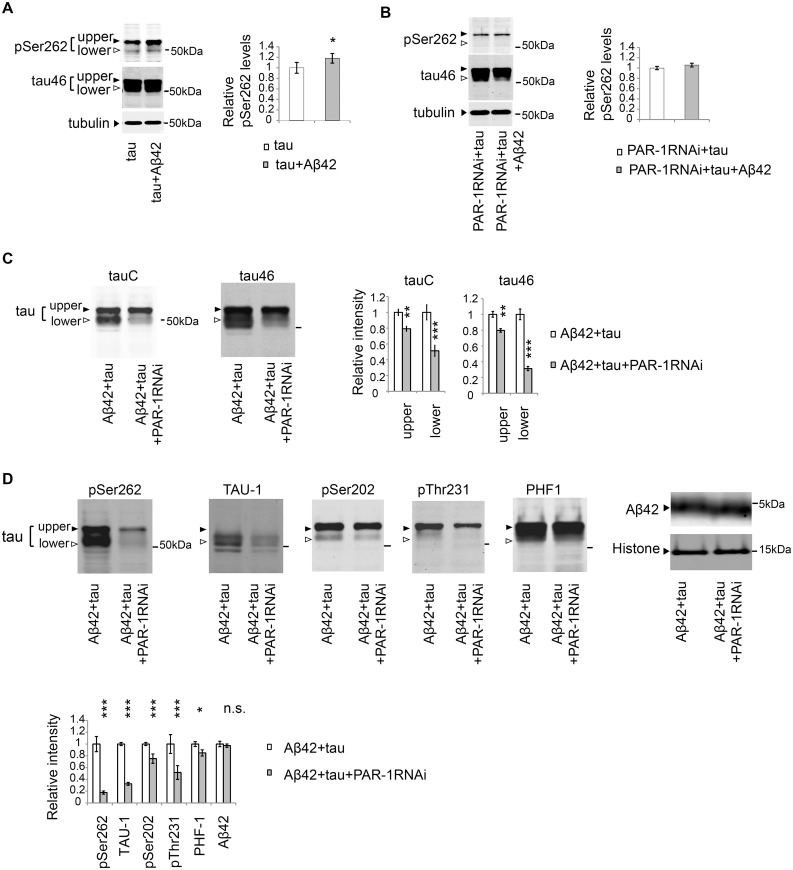
- PAR-1 knockdown reduced taulower and pSer262, while PAR-1 overexpression increased taulower and pThr231; these effects required Ser262/356, as PAR-1 did not alter S2A tau levels. Aβ42 increased pSer262, and this increase was suppressed by PAR-1 knockdown (Figs 4, 5, and 7).
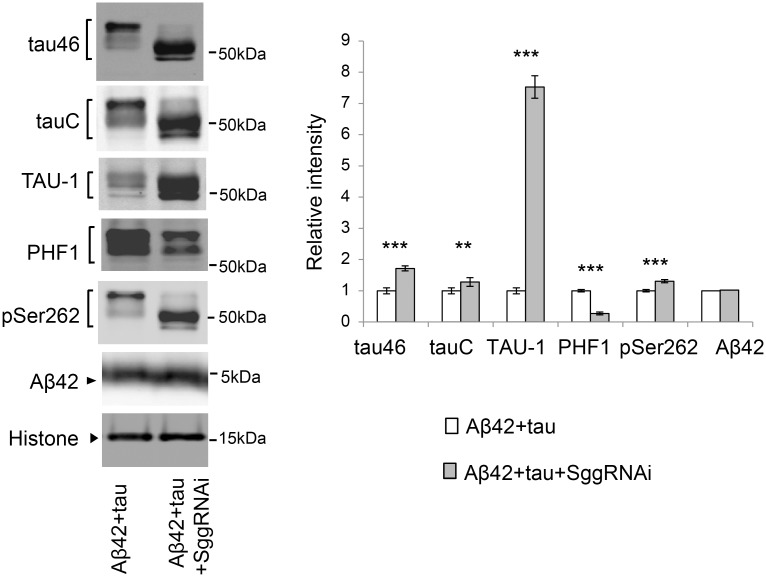
- GSK3/Sgg knockdown reduced SP/TP phosphorylation but did not reduce tau levels, did not prevent Aβ42-induced cytosolic tau increase or microtubule-bound tau decrease, and did not suppress Aβ42-enhanced tau toxicity (Figs 2 and 6).
Methods
- Transgenic Drosophila expressing human 0N4R tau alone or with Aβ42, driven by gmr-GAL4 in the retina or elav-GAL4 pan-neuronally; RNAi knockdown or overexpression of PAR-1 and Sgg/GSK3; age-matched male flies used.
- In vivo microtubule-binding assay: head lysates with taxol, centrifugation to separate cytosol supernatant and microtubule pellet, then western blotting with pan-tau and phospho-specific antibodies; phosphatase treatment and quantification by ImageJ/Odyssey.
- Toxicity assessed by eye surface area and histology; statistics used Student’s t-test or one-way ANOVA with Tukey post hoc; typical n = 4–5 for blots and N = 6–8 for eye area.
Limitations
- Stated: the authors cannot draw an explicit conclusion about which tau species, tauupper or taulower, is more toxic; mechanisms of tau-mediated neurodegeneration remain unclear; further studies in mammalian model systems are warranted.
- Stated/evident: the Drosophila model does not form fibrils or detergent-insoluble aggregates, so findings may reflect toxicity of soluble, non-aggregated tau and early stages of tau mismetabolism rather than NFT formation.
- Evident: conclusions rely on overexpression and RNAi in fly retina/neurons, with no human tissue or mammalian in vivo validation in this paper.
Model-written summary. Check it against the paper before relying on it.
Integrity signals
Registry
Cites
Statistics
Figures
Verification
Claims the paper makes
63 Own result · 49 Own interpretation · 19 Partly supported · 7 No full text of the sources · 6 Supported so far · 5 Supported · 3 Own method · 1 Not checked yet · 1 No basis given · accuracy not yet measured
Every source the paper cites for this claim was checked and supports it.
In the paper
“As reported previously, co-expression of Aβ42 in fly eyes using the pan-retinal driver gmr-Gal4 enhanced tau-mediated retinal degeneration ([58] and S1 Fig).”
§ Stabilization of Microtubule-Unbound Tau via Tau Phosphorylation at Ser262/356 by Par-1/MARK Contributes to Augmentation of AD-Related Phosphorylation and Aβ42-Induced Tau Toxicity > Results > Aβ42 increases the level of tau in the cytosol and decreases the level of microtubule-bound tau
What the sources say
- Supportedcites [58] K Iijima, 2010, Tau Ser262 phosphorylation is critical for Abeta42-induced tau toxicity in a transgenic Drosophila model of Alzheimer's disease, Hum Mol Genet source
The section “Human Aβ42 enhances human tau-induced toxicity in transgenic fly eyes and brains” reports that co-expression of Aβ42 with tau using the pan-retinal gmr-GAL4 driver significantly worsened eye-size reduction and reduced retinal thickness (Fig. 1). This directly supports the attributed claim. (LLM, conf=0.95)
plaindirect- Asserted: passes — The authors put it forward as true.
- Checkable: passes — It can be checked against evidence.
- Load-bearing: passes — The paper’s conclusions depend on it.
- Based: passes — The paper gives a reason why it holds.
- Supported
The cited sources support only part of this claim — read each source’s verdict below.
In the paper
“Tau phosphorylation at GSK3-target sites, as well as Ser262/356, has prominent effects on tau toxicity [26, 53–56].”
§ Stabilization of Microtubule-Unbound Tau via Tau Phosphorylation at Ser262/356 by Par-1/MARK Contributes to Augmentation of AD-Related Phosphorylation and Aβ42-Induced Tau Toxicity > Introduction
What the sources say
- Partly supportedcites [26] S Chatterjee, 2009, Dissociation of tau toxicity and phosphorylation: role of GSK-3beta, MARK and Cdk5 in a Drosophila model, Hum Mol Genet sourceExperimental — accuracy not yet measured
The Results sections on S2A tau identify Ser262/356 as PAR-1 phosphorylation sites and report that the phosphorylation-resistant mutant was less toxic than wild-type tau in the fly eye. The claim overstates the GSK3-target-site part: the Discussion reports substantial toxicity in tau resistant to GSK-3β/Shaggy phosphorylation, while the Results report relatively normal eyes despite elevated phosphorylation at GSK-3β-relevant epitopes. No page numbers are available in our copy. (LLM, conf=0.89)
- Not checked — no full text of the sourcecites [53] I Nishimura, 2004, PAR-1 kinase plays an initiator role in a temporally ordered phosphorylation process that confers tau toxicity in Drosophila, Cell source
- Not checked — no full text of the sourcecites [54] ML Steinhilb, 2007, S/P and T/P phosphorylation is critical for tau neurotoxicity in Drosophila, J Neurosci Res source
- Not checked — no full text of the sourcecites [55] K Papanikolopoulou, 2015, Temporally distinct phosphorylations differentiate Tau-dependent learning deficits and premature mortality in Drosophila, Hum Mol Genet source
- Not checked — no full text of the sourcecites [56] TA Fulga, 2007, Abnormal bundling and accumulation of F-actin mediates tau-induced neuronal degeneration in vivo, Nat Cell Biol source
plaindirect- Asserted: passes — The authors put it forward as true.
- Checkable: passes — It can be checked against evidence.
- Load-bearing: passes — The paper’s conclusions depend on it.
- Based: passes — The paper gives a reason why it holds.
- Partly supported
The cited sources support only part of this claim — read each source’s verdict below.
In the paper
“Formation of fibrils or detergent-insoluble aggregates are not detected in the presence or absence of Aβ [58, 59]”
§ Stabilization of Microtubule-Unbound Tau via Tau Phosphorylation at Ser262/356 by Par-1/MARK Contributes to Augmentation of AD-Related Phosphorylation and Aβ42-Induced Tau Toxicity > Introduction
What the sources say
- Partly supportedcites [58] K Iijima, 2010, Tau Ser262 phosphorylation is critical for Abeta42-induced tau toxicity in a transgenic Drosophila model of Alzheimer's disease, Hum Mol Genet sourceExperimental — accuracy not yet measured
The Introduction (page unavailable) says neurofibrillary tangles are not observed in fly neurons. Figure 2D (page unavailable) reports that Aβ42 co-expression did not increase sarkosyl-insoluble tau, but it does not say detergent-insoluble tau was undetectable in either condition. The claim of no detectable fibrils or insoluble aggregates with or without Aβ is therefore stronger than the cited evidence. (LLM, conf=0.85)
- Not checked — no full text of the sourcecites [59] CW Wittmann, 2001, Tauopathy in Drosophila: neurodegeneration without neurofibrillary tangles, Science source
plain- Asserted: passes — The authors put it forward as true.
- Checkable: passes — It can be checked against evidence.
- Load-bearing: passes — The paper’s conclusions depend on it.
- Based: passes — The paper gives a reason why it holds.
- Partly supported
Every source the paper cites for this claim was checked and supports it.
In the paper
“suggesting that Aβ42-mediated augmentation of tau toxicity is not simply due to an overall increase in the level of tau [58].”
§ Stabilization of Microtubule-Unbound Tau via Tau Phosphorylation at Ser262/356 by Par-1/MARK Contributes to Augmentation of AD-Related Phosphorylation and Aβ42-Induced Tau Toxicity > Results > Aβ42 increases the level of tau in the cytosol and decreases the level of microtubule-bound tau
What the sources say
- Supportedcites [58] K Iijima, 2010, Tau Ser262 phosphorylation is critical for Abeta42-induced tau toxicity in a transgenic Drosophila model of Alzheimer's disease, Hum Mol Genet source
The Discussion (page unavailable) reports that Aβ42 enhances tau-induced neurodegeneration, but co-expression with tau carrying a non-phosphorylatable Ser262 mutation did not cause neurodegeneration. This supports the citing sentence’s qualified inference that the enhancement is not simply due to more tau. (LLM, conf=0.86)
hedged- Asserted: passes — The authors put it forward as true.
- Checkable: passes — It can be checked against evidence.
- Load-bearing: passes — The paper’s conclusions depend on it.
- Based: passes — The paper gives a reason why it holds.
- Supported
The cited sources support only part of this claim — read each source’s verdict below.
In the paper
“Notably, studies in cultured neurons and transgenic Drosophila showed that Aβ-induced augmentation of tau toxicity caused by Aβ depends on tau phosphorylation at these sites [39, 45, 56–58].”
§ Stabilization of Microtubule-Unbound Tau via Tau Phosphorylation at Ser262/356 by Par-1/MARK Contributes to Augmentation of AD-Related Phosphorylation and Aβ42-Induced Tau Toxicity > Introduction
What the sources say
- Partly supportedcites [39] H Zempel, 2010, Abeta oligomers cause localized Ca(2+) elevation, missorting of endogenous Tau into dendrites, Tau phosphorylation, and destruction of microtubules and spines, J Neurosci sourceExperimental — accuracy not yet measured
The results section (page unavailable) reports increased tau phosphorylation at pS262/pS356 and pS202/pT205 in Aβ-exposed cultured hippocampal neurons. It does not report a transgenic Drosophila experiment or establish that phosphorylation at those sites is required for Aβ-induced augmentation of tau toxicity. (LLM, conf=0.85)
- Partly supportedcites [45] W Yu, 2012, A critical role for the PAR-1/MARK-tau axis in mediating the toxic effects of Abeta on synapses and dendritic spines, Hum Mol Genet sourceExperimental — accuracy not yet measured
In 'Expression of non-phosphorylatable form of tau blocks Aβ toxicity' (page not available), Aβ increased tau phosphorylation at the 12E8 sites in cultured rat hippocampal neurons, and non-phosphorylatable tau ameliorated Aβ-induced spine and synaptic-marker loss. The Introduction and 'Expression of a non-phosphorylatable form of tau blocks PAR-1/MARK toxicity' describe Drosophila evidence that PAR-1-site phosphorylation is required for tau toxicity, but do not show Aβ-induced augmentation of tau toxicity in transgenic Drosophila. (LLM, conf=0.86)
- Not checked — no full text of the sourcecites [56] TA Fulga, 2007, Abnormal bundling and accumulation of F-actin mediates tau-induced neuronal degeneration in vivo, Nat Cell Biol source
- Supportedcites [57] G Mairet-Coello, 2013, The CAMKK2-AMPK kinase pathway mediates the synaptotoxic effects of Abeta oligomers through Tau phosphorylation, Neuron source
The Results section (page unavailable) reports that nonphosphorylatable Tau at S262 or S356 protected cultured hippocampal neurons from Aβ42-induced spine loss. The Discussion (page unavailable) also reports that an S262 mutation was protective in a transgenic fly model overexpressing human Aβ42. The paper thus supports the claim across both models, although it reports rather than conducts the fly study. (LLM, conf=0.88)
- Partly supportedcites [58] K Iijima, 2010, Tau Ser262 phosphorylation is critical for Abeta42-induced tau toxicity in a transgenic Drosophila model of Alzheimer's disease, Hum Mol Genet sourceExperimental — accuracy not yet measured
The Results and Discussion report that the non-phosphorylatable Ser262Ala mutation prevented Aβ42-associated neurodegeneration in transgenic Drosophila. The paper does not establish the same dependence in cultured neurons, or show that phosphorylation at the other sites measured is required for the effect. (LLM, conf=0.86)
plaindirect- Asserted: passes — The authors put it forward as true.
- Checkable: passes — It can be checked against evidence.
- Load-bearing: passes — The paper’s conclusions depend on it.
- Based: passes — The paper gives a reason why it holds.
- Partly supported
The cited sources support only part of this claim — read each source’s verdict below.
In the paper
“tau proteins detached from microtubules are prone to be phosphorylated at disease-associated sites [19, 25–28].”
§ Stabilization of Microtubule-Unbound Tau via Tau Phosphorylation at Ser262/356 by Par-1/MARK Contributes to Augmentation of AD-Related Phosphorylation and Aβ42-Induced Tau Toxicity > Introduction
What the sources say
- Partly supportedcites [19] E Thies, 2007, Missorting of tau in neurons causes degeneration of synapses that can be rescued by the kinase MARK2/Par-1, J Neurosci sourceExperimental — accuracy not yet measured
The 'Phosphorylation of tau by MARK2' section (page unavailable) links increased phosphorylation at KXGS motifs with tau’s detachment from microtubules. It does not show that tau already detached from microtubules is more prone to phosphorylation, or identify those motifs as disease-associated sites; the reported sequence is phosphorylation followed by detachment. (LLM, conf=0.79)
- Not checked — no full text of the sourcecites [25] S Feuillette, 2010, Drosophila models of human tauopathies indicate that Tau protein toxicity in vivo is mediated by soluble cytosolic phosphorylated forms of the protein, J Neurochem source
- Could not verifycites [26] S Chatterjee, 2009, Dissociation of tau toxicity and phosphorylation: role of GSK-3beta, MARK and Cdk5 in a Drosophila model, Hum Mol Genet sourceExperimental — accuracy not yet measured
The Results section on microtubule binding describes a proposed sequence in which tau is hyperphosphorylated and then detaches from microtubules. The Discussion likewise says kinases can release tau from microtubules. Neither passage says that detached tau is more prone to phosphorylation at disease-associated sites; searches for that subsequent susceptibility found no supporting passage. (LLM, conf=0.72)
- Supportedcites [27] E Planel, 2008, Anesthesia-induced hyperphosphorylation detaches 3-repeat tau from microtubules without affecting their stability in vivo, J Neurosci source
The Discussion (page unavailable in our copy) reports that free tau was more susceptible than microtubule-bound tau to phosphorylation at several epitopes, including S202/T205 and T231. It also notes that bound tau could still be phosphorylated at other sites; the claim says detached tau is prone to phosphorylation, not that phosphorylation is exclusive to it. (LLM, conf=0.88)
- Not checked — no full text of the sourcecites [28] T Miyasaka, 2010, Microtubule destruction induces tau liberation and its subsequent phosphorylation, FEBS Lett source
plaincorrelational- Asserted: passes — The authors put it forward as true.
- Checkable: passes — It can be checked against evidence.
- Load-bearing: passes — The paper’s conclusions depend on it.
- Based: passes — The paper gives a reason why it holds.
- Partly supported
The cited sources support only part of this claim — read each source’s verdict below.
In the paper
“Tau phosphorylation at these sites decreases the protein’s affinity toward microtubules in vitro, in cultured cells, transgenic Drosophila, and transgenic mice [18, 19, 25–27, 50–52].”
§ Stabilization of Microtubule-Unbound Tau via Tau Phosphorylation at Ser262/356 by Par-1/MARK Contributes to Augmentation of AD-Related Phosphorylation and Aβ42-Induced Tau Toxicity > Introduction
What the sources say
- Not checked — no full text of the sourcecites [18] D Fischer, 2009, Conformational changes specific for pseudophosphorylation at serine 262 selectively impair binding of tau to microtubules, Biochemistry source
- Partly supportedcites [19] E Thies, 2007, Missorting of tau in neurons causes degeneration of synapses that can be rescued by the kinase MARK2/Par-1, J Neurosci sourceExperimental — accuracy not yet measured
The ‘Phosphorylation of tau by MARK2’ section reports that increased phosphorylation at tau’s KXGS motifs in cultured neurons is associated with detachment from microtubules. It does not identify Ser262/356 specifically or establish this effect in vitro, in transgenic Drosophila, or in transgenic mice; the Introduction mentions the animal models in connection with tau pathology, not this affinity finding. The supplied copy gives no page numbers for these passages. (LLM, conf=0.84)
- Not checked — no full text of the sourcecites [25] S Feuillette, 2010, Drosophila models of human tauopathies indicate that Tau protein toxicity in vivo is mediated by soluble cytosolic phosphorylated forms of the protein, J Neurochem source
- Supportedcites [26] S Chatterjee, 2009, Dissociation of tau toxicity and phosphorylation: role of GSK-3beta, MARK and Cdk5 in a Drosophila model, Hum Mol Genet source
The Results sections identify Ser262 and Ser356 as the two PAR-1 phosphorylation sites altered in S2A tau. In transgenic Drosophila, PAR-1 increased phosphorylation at those sites and released wild-type tau from microtubules, but did not release S2A tau. This paper supports the Drosophila portion of the multiply cited sentence; it does not establish the other listed settings. (LLM, conf=0.87)
- Partly supportedcites [27] E Planel, 2008, Anesthesia-induced hyperphosphorylation detaches 3-repeat tau from microtubules without affecting their stability in vivo, J Neurosci sourceExperimental — accuracy not yet measured
The Discussion (page unavailable) states that phosphorylation at S262 or S262/S356 prevents tau from binding microtubules. The Introduction and Results report reduced tau binding and detachment of 3-repeat tau in old transgenic hTau mice, but do not establish that Ser262/356 phosphorylation specifically caused that detachment. The paper does not substantiate the claim’s transgenic Drosophila setting or establish the site-specific effect across every listed setting. (LLM, conf=0.85)
- Not checked — no full text of the sourcecites [50] G Drewes, 1997, MARK, a novel family of protein kinases that phosphorylate microtubule-associated proteins and trigger microtubule disruption, Cell source
- Not checked — no full text of the sourcecites [51] J Biernat, 1993, Phosphorylation of Ser262 strongly reduces binding of tau to microtubules: distinction between PHF-like immunoreactivity and microtubule binding, Neuron source
- Not checked — no full text of the sourcecites [52] S Lovestone, 1996, Phosphorylation of tau by glycogen synthase kinase-3 beta in intact mammalian cells: the effects on the organization and stability of microtubules, Neuroscience source
plaindirect- Asserted: passes — The authors put it forward as true.
- Checkable: passes — It can be checked against evidence.
- Load-bearing: passes — The paper’s conclusions depend on it.
- Based: passes — The paper gives a reason why it holds.
The cited sources support only part of this claim — read each source’s verdict below.
In the paper
“RNAi-mediated knockdown of PAR-1 effectively decreases tau phosphorylation at Ser262 and Ser356 [63, 70].”
§ Stabilization of Microtubule-Unbound Tau via Tau Phosphorylation at Ser262/356 by Par-1/MARK Contributes to Augmentation of AD-Related Phosphorylation and Aβ42-Induced Tau Toxicity > Results > Tau phosphorylation at Ser262 and Ser356 via PAR-1 is critical for stabilization of taulower
What the sources say
- Partly supportedcites [63] K Iijima-Ando, 2012, Loss of Axonal Mitochondria Promotes Tau-Mediated Neurodegeneration and Alzheimer's Disease-Related Tau Phosphorylation Via PAR-1, PLoS Genet sourceExperimental — accuracy not yet measured
The Results section, “PAR-1 mediates the increase in tau phosphorylation at Ser262 caused by milton knockdown” (page unavailable), reports that RNAi-mediated PAR-1 knockdown significantly reduced tau phosphorylation at Ser262 in fly eyes. Our copy does not report a corresponding reduction at Ser356, so it supports only one of the two sites named in the claim. (LLM, conf=0.90)
- Could not verifycites [70] JA McDonald, 2008, PAR-1 kinase regulates epithelial detachment and directional protrusion of migrating border cells, Curr Biol sourceExperimental — accuracy not yet measured
The Results section, “PAR-1 is Required for Border Cell Detachment from the Epithelium” (page unavailable), reports that PAR-1 RNAi reduced PAR-1 protein levels and disrupted border-cell migration. Our copy does not report tau phosphorylation after knockdown or measurements at Ser262 and Ser356 (searched: tau phosphorylation, Ser262, Ser356, PAR-1 RNAi). (LLM, conf=0.76)
plaindirect- Asserted: passes — The authors put it forward as true.
- Checkable: passes — It can be checked against evidence.
- Load-bearing: passes — The paper’s conclusions depend on it.
- Based: passes — The paper gives a reason why it holds.
- Partly supported
The sources with a verdict support this claim; the rest weren’t checked yet, have no full text we could read, or their verdicts aren’t rated yet.
In the paper
“introduction of pseudophosphorylation at Thr231 and Thr212 with Ser262 augments tau toxicity in cultured cells [96] and transgenic Drosophila [97].”
§ Stabilization of Microtubule-Unbound Tau via Tau Phosphorylation at Ser262/356 by Par-1/MARK Contributes to Augmentation of AD-Related Phosphorylation and Aβ42-Induced Tau Toxicity > Discussion > Blocking tau phosphorylation at Ser262/356 also reduces tau phosphorylated at Thr231
What the sources say
- Supportedcites [96] AD Alonso, 2010, Phosphorylation of tau at Thr212, Thr231, and Ser262 combined causes neurodegeneration, J Biol Chem source
The paper’s “Phosphorylated Tau Causes Neurodegeneration” section reports that combined pseudophosphorylation at Thr212, Thr231, and Ser262 made tau toxic in transfected PC12 and CHO cells. In the citing sentence, this source is cited for the cultured-cell finding [96]; transgenic Drosophila is assigned a separate citation [97]. (LLM, conf=0.93)
- Not checked — no full text of the sourcecites [97] C Beharry, 2013, Expression of Alzheimer-like pathological human tau induces a behavioral motor and olfactory learning deficit in Drosophila melanogaster, J Alzheimers Dis source
plaindirect- Asserted: passes — The authors put it forward as true.
- Checkable: passes — It can be checked against evidence.
- Load-bearing: passes — The paper’s conclusions depend on it.
- Based: passes — The paper gives a reason why it holds.
- Supported
The cited sources support only part of this claim — read each source’s verdict below.
In the paper
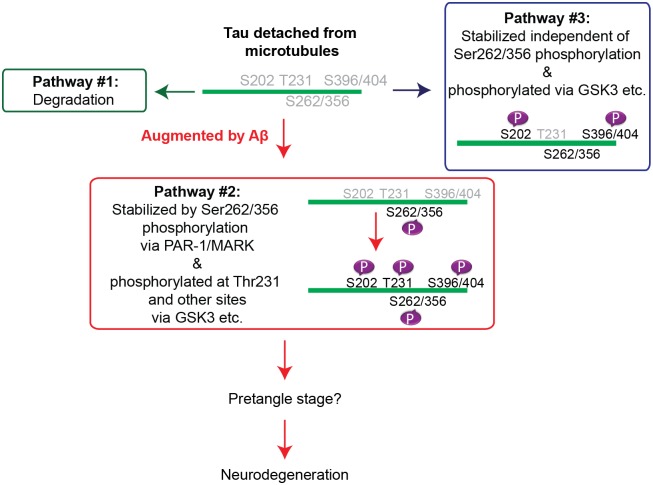
“Tau toxicity is likely to be qualitatively and quantitatively heterogeneous, possibly due to the diversity of tau species associated with distinct modifications, binding partners, and/or cellular locations [113].”
§ Stabilization of Microtubule-Unbound Tau via Tau Phosphorylation at Ser262/356 by Par-1/MARK Contributes to Augmentation of AD-Related Phosphorylation and Aβ42-Induced Tau Toxicity > Discussion > Several pathways in tau mismetabolism have been dissected
What the sources say
- Partly supportedcites [113] DW Sanders, 2014, Distinct tau prion strains propagate in cells and mice and define different tauopathies, Neuron sourceExperimental — accuracy not yet measured
The Results section (“Tau RD propagates conformationally distinct strains”; page not provided) reports that two tau strains differed in their effects on cell growth and survival, supporting heterogeneous toxicity. The paper also reports diverse patient-derived tau strains, but the passages do not attribute differences in toxicity to distinct modifications, binding partners, or cellular locations. (LLM, conf=0.88)
hedgedcorrelational- Asserted: passes — The authors put it forward as true.
- Checkable: passes — It can be checked against evidence.
- Load-bearing: unclear — It is unclear whether the paper’s conclusions depend on it.
- Based: passes — The paper gives a reason why it holds.
- Partly supported
- Probably not a substantial claim. 12
- It may state two separate claims as one. 26
- The quote only partly states this claim. 1
The cited sources support only part of this claim — read each source’s verdict below.
In the paper
“GSK3 is a proline-directed kinase that contributes to phosphorylation of tau at serine or threonine followed by proline (i.e., SP/TP sites) [46–49]”
§ Stabilization of Microtubule-Unbound Tau via Tau Phosphorylation at Ser262/356 by Par-1/MARK Contributes to Augmentation of AD-Related Phosphorylation and Aβ42-Induced Tau Toxicity > Introduction
What the sources say
- Not checked — no full text of the sourcecites [46] F Hernandez, 2010, GSK3: a possible link between beta amyloid peptide and tau protein, Exp Neurol source
- Partly supportedcites [47] K Ishiguro, 1993, Glycogen synthase kinase 3 beta is identical to tau protein kinase I generating several epitopes of paired helical filaments, FEBS Lett sourceExperimental — accuracy not yet measured
The Results identify GSK3β as TPKI and report that TPKI phosphorylates tau at specific serine and threonine residues, supporting its role in tau phosphorylation. The passages do not identify those residues as SP/TP sites or describe GSK3β as proline-directed, so that specificity is not established by our copy. (LLM, conf=0.83)
- Partly supportedcites [48] BR Sperber, 1995, Glycogen synthase kinase-3 beta phosphorylates tau protein at multiple sites in intact cells, Neurosci Lett sourceExperimental — accuracy not yet measured
The Results report increased tau phosphorylation at several serine and threonine sites in cells expressing GSK3β. The introduction says GSK3α has been suggested to act as a proline-directed threonine kinase, but says GSK3β’s site specificity was not fully elucidated. The paper therefore supports GSK3β’s contribution to tau phosphorylation, but does not establish the claimed SP/TP specificity for GSK3β. (LLM, conf=0.86)
- Supportedcites [49] DP Hanger, 2007, Novel phosphorylation sites in tau from Alzheimer brain support a role for casein kinase 1 in disease pathogenesis, J Biol Chem source
In the discussion (page unavailable), the paper identifies tau Thr111 as adjacent to proline and says GSK-3β was likely responsible for its phosphorylation. The Results also report numerous tau sites phosphorylated by GSK-3β. This supports the claim that GSK3 contributes to phosphorylation at SP/TP sites; the paper does not suggest it acts only at those sites. (LLM, conf=0.84)
plaindirect- Asserted: passes — The authors put it forward as true.
- Checkable: passes — It can be checked against evidence.
- Load-bearing: fails — The paper’s conclusions may not depend on it.
- Based: passes — The paper gives a reason why it holds.
Probably not a substantial claim. The paper’s conclusions may not depend on it.
The cited sources support only part of this claim — read each source’s verdict below.
In the paper
“In cellular and animal models, co-expression of Aβ augments tau phosphorylation at these sites and increases the levels of active GSK3 and PAR-1/MARK [2, 35–41, 43, 44].”
§ Stabilization of Microtubule-Unbound Tau via Tau Phosphorylation at Ser262/356 by Par-1/MARK Contributes to Augmentation of AD-Related Phosphorylation and Aβ42-Induced Tau Toxicity > Introduction
What the sources say
- Not checked — no full text of the sourcecites [2] M Jin, 2011, Soluble amyloid beta-protein dimers isolated from Alzheimer cortex directly induce Tau hyperphosphorylation and neuritic degeneration, Proc Natl Acad Sci U S A source
- Not checked — no full text of the sourcecites [35] J Busciglio, 1995, beta-amyloid fibrils induce tau phosphorylation and loss of microtubule binding, Neuron source
- Not checked — no full text of the sourcecites [36] A Ferreira, 1997, Selective phosphorylation of adult tau isoforms in mature hippocampal neurons exposed to fibrillar A beta, Mol Cell Neurosci source
- Not checked — no full text of the sourcecites [37] A Takashima, 1998, Activation of tau protein kinase I/glycogen synthase kinase-3beta by amyloid beta peptide (25–35) enhances phosphorylation of tau in hippocampal neurons, Neurosci Res source
- Partly supportedcites [38] QL Ma, 2009, Beta-amyloid oligomers induce phosphorylation of tau and inactivation of insulin receptor substrate via c-Jun N-terminal kinase signaling: suppression by omega-3 fatty acids and curcumin, J Neurosci sourceExperimental — accuracy not yet measured
Figure 5 reports increased tau Ser422 phosphorylation after Aβ oligomer treatment in cultured neurons, and the Discussion reports increased phosphorylated tau in a 3xTg-AD mouse model under a high-fat diet. The Discussion says GSK3β is known to be activated by Aβ, but predicts rather than demonstrates its activation through the mechanism studied here. The cited passages do not establish that Aβ co-expression increases active GSK3 and PAR-1/MARK; PAR-1/MARK is not reported. Page numbers are unavailable in our copy. (LLM, conf=0.86)
- Partly supportedcites [39] H Zempel, 2010, Abeta oligomers cause localized Ca(2+) elevation, missorting of endogenous Tau into dendrites, Tau phosphorylation, and destruction of microtubules and spines, J Neurosci sourceExperimental — accuracy not yet measured
In “Synapses disappear in regions of Tau missorting” (page unavailable), the paper reports increased Tau phosphorylation and strong local activation of MARK after Aβ-oligomer treatment. It explicitly says GSK3β activity remained unchanged. The experiments described used treated cultured neurons, not co-expression of Aβ in both cellular and animal models. (LLM, conf=0.90)
- Partly supportedcites [40] FG De Felice, 2008, Alzheimer's disease-type neuronal tau hyperphosphorylation induced by A beta oligomers, Neurobiol Aging sourceExperimental — accuracy not yet measured
Results §3.3 reports increased tau phosphorylation at Thr231 and Ser404 after Aβ-oligomer exposure in cultured rat hippocampal neurons. The Introduction also reports prior findings of GSK-3β activation and describes transgenic mice expressing APP and tau. However, this paper does not show that Aβ co-expression increases active GSK3 in its models, and the cited passages do not establish an increase in active PAR-1/MARK. (LLM, conf=0.88)
- Not checked — no full text of the sourcecites [41] J Folwell, 2010, Abeta exacerbates the neuronal dysfunction caused by human tau expression in a Drosophila model of Alzheimer's disease, Exp Neurol source
- Not checked — no full text of the sourcecites [43] QL Ma, 2006, Antibodies against beta-amyloid reduce Abeta oligomers, glycogen synthase kinase-3beta activation and tau phosphorylation in vivo and in vitro, J Neurosci Res source
- Partly supportedcites [44] O Sofola, 2010, Inhibition of GSK-3 ameliorates Abeta pathology in an adult-onset Drosophila model of Alzheimer's disease, PLoS Genet sourceExperimental — accuracy not yet measured
The Discussion reports that Aβ42 increased tau phosphorylation in earlier cell and mouse studies, and that Arctic Aβ42 increased GSK-3 activity in this paper's flies. But the Results found no increase in phosphorylation at the tested Ser262 and Ser356 tau sites in those flies; the paper identifies these as MARK substrates without reporting increased PAR-1/MARK activity. The citation therefore supports only part of the combined claim. (LLM, conf=0.86)
plaindirect- Asserted: passes — The authors put it forward as true.
- Checkable: passes — It can be checked against evidence.
- Load-bearing: passes — The paper’s conclusions depend on it.
- Based: passes — The paper gives a reason why it holds.
It may state two separate claims as one.
The cited sources support only part of this claim — read each source’s verdict below.
In the paper
“Drosophila models expressing human tau recapitulate key features of human tauopathies, including progressive neurodegeneration and phosphorylation at AD-related sites via conserved kinases [41, 44, 53, 59–63].”
§ Stabilization of Microtubule-Unbound Tau via Tau Phosphorylation at Ser262/356 by Par-1/MARK Contributes to Augmentation of AD-Related Phosphorylation and Aβ42-Induced Tau Toxicity > Introduction
What the sources say
- Not checked — no full text of the sourcecites [41] J Folwell, 2010, Abeta exacerbates the neuronal dysfunction caused by human tau expression in a Drosophila model of Alzheimer's disease, Exp Neurol source
- Partly supportedcites [44] O Sofola, 2010, Inhibition of GSK-3 ameliorates Abeta pathology in an adult-onset Drosophila model of Alzheimer's disease, PLoS Genet sourceExperimental — accuracy not yet measured
The Introduction describes human-tau fly models with neuronal dysfunction and reports that co-expression with Shaggy, a conserved GSK-3 homologue, worsens neurotoxic phenotypes. It does not establish progressive neurodegeneration or show that conserved kinases phosphorylate human tau at AD-related sites in those models. The Results examine phosphorylation sites on endogenous fly tau instead and find no change at the Ser262 or Ser356 homologous epitopes under the conditions tested. No page numbers are available in our copy. (LLM, conf=0.85)
- Not checked — no full text of the sourcecites [53] I Nishimura, 2004, PAR-1 kinase plays an initiator role in a temporally ordered phosphorylation process that confers tau toxicity in Drosophila, Cell source
- Not checked — no full text of the sourcecites [59] CW Wittmann, 2001, Tauopathy in Drosophila: neurodegeneration without neurofibrillary tangles, Science source
- Not checked — no full text of the sourcecites [60] A Mudher, 2004, GSK-3beta inhibition reverses axonal transport defects and behavioural phenotypes in Drosophila, Mol Psychiatry source
- Supportedcites [61] GR Jackson, 2002, Human wild-type tau interacts with wingless pathway components and produces neurofibrillary pathology in Drosophila, Neuron source
The discussion (page unavailable in our copy) describes the tau-expressing fly eye phenotype as involving progressive neurodegeneration. The section on GSK-3β/shaggy identifies shaggy as the fly counterpart of a human tau kinase, and Figure 2 reports tau aggregates recognized by an antibody to a phosphorylated, Alzheimer’s-related epitope when shaggy is coexpressed. (LLM, conf=0.90)
- Supportedcites [62] S Grammenoudi, 2006, Cell type-specific processing of human Tau proteins in Drosophila, FEBS Lett source
The Introduction (page unavailable) describes age-dependent neurodegeneration in Drosophila tau models. The phosphorylation results and Discussion (page unavailable) report phosphorylation of human Tau at AD-associated sites in fly neurons and identify Tau-targeting kinases, including GSK-3β. The paper cautions that phosphorylation varies by cell type, but that does not undermine the broad claim about these models. (LLM, conf=0.88)
- Supportedcites [63] K Iijima-Ando, 2012, Loss of Axonal Mitochondria Promotes Tau-Mediated Neurodegeneration and Alzheimer's Disease-Related Tau Phosphorylation Via PAR-1, PLoS Genet source
The Results report age-dependent, progressive neurodegeneration in flies expressing human tau. They also report phosphorylation at the AD-related Ser262 site and show that PAR-1, a homolog of mammalian MARK, mediates its increase after milton knockdown. The phosphorylation finding is specific to that site and condition, rather than every AD-related site. (LLM, conf=0.89)
plaindirect- Asserted: passes — The authors put it forward as true.
- Checkable: passes — It can be checked against evidence.
- Load-bearing: passes — The paper’s conclusions depend on it.
- Based: passes — The paper gives a reason why it holds.
It may state two separate claims as one.
The sources with a verdict support this claim; the rest weren’t checked yet, have no full text we could read, or their verdicts aren’t rated yet.
In the paper
“suggesting that the neurodegeneration observed in these models reflects toxicity of soluble, non-aggregated forms of tau, and may recapitulate early stages of the abnormal metabolism and toxicity of tau [11–14].”
§ Stabilization of Microtubule-Unbound Tau via Tau Phosphorylation at Ser262/356 by Par-1/MARK Contributes to Augmentation of AD-Related Phosphorylation and Aβ42-Induced Tau Toxicity > Introduction
What the sources say
- Supportedcites [11] CM Cowan, 2013, Are tau aggregates toxic or protective in tauopathies?, Frontiers in neurology source
In “Soluble tau: Evidence for toxicity” (page unavailable), the paper reports neurodegeneration in Drosophila models without insoluble tau and says this is strong evidence that soluble tau can cause toxicity. The same section describes soluble tau species appearing at very early disease stages, supporting the claim’s hedged suggestion about early tau toxicity. (LLM, conf=0.88)
- Not checked — no full text of the sourcecites [12] N Sahara, 2008, Tau oligomerization: a role for tau aggregation intermediates linked to neurodegeneration, Curr Alzheimer Res source
- Not checked — no full text of the sourcecites [13] KV Kuchibhotla, 2014, Neurofibrillary tangle-bearing neurons are functionally integrated in cortical circuits in vivo, Proc Natl Acad Sci U S A source
- Not checked — no full text of the sourcecites [14] K Santacruz, 2005, Tau suppression in a neurodegenerative mouse model improves memory function, Science source
hedgedconditional- Asserted: passes — The authors put it forward as true.
- Checkable: passes — It can be checked against evidence.
- Load-bearing: passes — The paper’s conclusions depend on it.
- Based: passes — The paper gives a reason why it holds.
It may state two separate claims as one.
- Supported
The cited sources support only part of this claim — read each source’s verdict below.
In the paper
“Aβ promotes tau phosphorylation at disease-associated sites in in vitro and in vivo models of AD [2, 35–41].”
§ Stabilization of Microtubule-Unbound Tau via Tau Phosphorylation at Ser262/356 by Par-1/MARK Contributes to Augmentation of AD-Related Phosphorylation and Aβ42-Induced Tau Toxicity > Introduction
What the sources say
- Not checked — no full text of the sourcecites [2] M Jin, 2011, Soluble amyloid beta-protein dimers isolated from Alzheimer cortex directly induce Tau hyperphosphorylation and neuritic degeneration, Proc Natl Acad Sci U S A source
- Not checked — no full text of the sourcecites [35] J Busciglio, 1995, beta-amyloid fibrils induce tau phosphorylation and loss of microtubule binding, Neuron source
- Not checked — no full text of the sourcecites [36] A Ferreira, 1997, Selective phosphorylation of adult tau isoforms in mature hippocampal neurons exposed to fibrillar A beta, Mol Cell Neurosci source
- Not checked — no full text of the sourcecites [37] A Takashima, 1998, Activation of tau protein kinase I/glycogen synthase kinase-3beta by amyloid beta peptide (25–35) enhances phosphorylation of tau in hippocampal neurons, Neurosci Res source
- Partly supportedcites [38] QL Ma, 2009, Beta-amyloid oligomers induce phosphorylation of tau and inactivation of insulin receptor substrate via c-Jun N-terminal kinase signaling: suppression by omega-3 fatty acids and curcumin, J Neurosci sourceExperimental — accuracy not yet measured
The Results section on cultured hippocampal neurons (page unavailable) reports that Aβ42 oligomers significantly increased tau phosphorylation at Ser422, a site the paper associates with AD neurodegeneration. The paper also reports increased tau Ser422 phosphorylation in 3xTg-AD mice on a high-fat diet, but it does not establish that Aβ itself caused that increase in vivo. (LLM, conf=0.84)
- Partly supportedcites [39] H Zempel, 2010, Abeta oligomers cause localized Ca(2+) elevation, missorting of endogenous Tau into dendrites, Tau phosphorylation, and destruction of microtubules and spines, J Neurosci sourceExperimental — accuracy not yet measured
The Abstract and Figure 5 passage report that Aβ oligomers increased tau phosphorylation at AD-associated epitopes, including 12E8 and AT8, in cultured hippocampal neurons. The paper’s experimental model was in vitro; it does not establish the claimed effect in an in vivo model. (LLM, conf=0.88)
- Partly supportedcites [40] FG De Felice, 2008, Alzheimer's disease-type neuronal tau hyperphosphorylation induced by A beta oligomers, Neurobiol Aging sourceExperimental — accuracy not yet measured
The Results (§3.3; page unavailable) show that Aβ oligomers increased phosphorylation at the AD-associated Thr231 and Ser404 sites in cultured neurons. The Introduction (§1; page unavailable) reports tau hyperphosphorylation after Aβ injection in animals, but does not establish phosphorylation at those specific sites in vivo; this paper's own experiments were in vitro. (LLM, conf=0.82)
- Not checked — no full text of the sourcecites [41] J Folwell, 2010, Abeta exacerbates the neuronal dysfunction caused by human tau expression in a Drosophila model of Alzheimer's disease, Exp Neurol source
plaindirect- Asserted: passes — The authors put it forward as true.
- Checkable: passes — It can be checked against evidence.
- Load-bearing: passes — The paper’s conclusions depend on it.
- Based: passes — The paper gives a reason why it holds.
Probably not a substantial claim.
The sources with a verdict support this claim; the rest weren’t checked yet, have no full text we could read, or their verdicts aren’t rated yet.
In the paper
“Genetic, pathological, and biochemical evidence suggests that elevation of Aβ levels is a causal event in AD pathogenesis [2–8] that lies upstream of tau-induced neurodegeneration [3, 5, 9, 10].”
§ Stabilization of Microtubule-Unbound Tau via Tau Phosphorylation at Ser262/356 by Par-1/MARK Contributes to Augmentation of AD-Related Phosphorylation and Aβ42-Induced Tau Toxicity > Introduction
What the sources say
- Not checked — no full text of the sourcecites [2] M Jin, 2011, Soluble amyloid beta-protein dimers isolated from Alzheimer cortex directly induce Tau hyperphosphorylation and neuritic degeneration, Proc Natl Acad Sci U S A source
- Not checked — no full text of the sourcecites [3] J Lewis, 2001, Enhanced neurofibrillary degeneration in transgenic mice expressing mutant tau and APP, Science source
- Not checked — no full text of the sourcecites [4] J Gotz, 2001, Formation of neurofibrillary tangles in P301l tau transgenic mice induced by Abeta 42 fibrils, Science source
- Not checked — no full text of the sourcecites [5] S Oddo, 2004, Abeta immunotherapy leads to clearance of early, but not late, hyperphosphorylated tau aggregates via the proteasome, Neuron source
- Not checked — no full text of the sourcecites [6] DJ Selkoe, 2011, Resolving controversies on the path to Alzheimer's therapeutics, Nat Med source
- Not checked — no full text of the sourcecites [7] ED Roberson, 2007, Reducing endogenous tau ameliorates amyloid beta-induced deficits in an Alzheimer's disease mouse model, Science source
- Supportedcites [8] TL Spires-Jones, 2014, The intersection of amyloid beta and tau at synapses in Alzheimer's disease, Neuron source
The Abstract (page not provided) says genetic evidence strongly supports Aβ accumulation as causative in AD. “The intersection of Aβ and tau at the synapse” describes a model in which tau alterations occur downstream of Aβ-induced changes, while noting that further studies are needed; the claim’s “suggests” reflects that uncertainty. (LLM, conf=0.88)
- Not checked — no full text of the sourcecites [9] A Caccamo, 2005, Age- and region-dependent alterations in Abeta-degrading enzymes: implications for Abeta-induced disorders, Neurobiol Aging source
- Supportedcites [10] MA Chabrier, 2012, Soluble abeta promotes wild-type tau pathology in vivo, J Neurosci source
The citation is attached to the claim that Aβ lies upstream of tau-induced neurodegeneration. The Discussion reports that reducing soluble Aβ in ArcTau mice reduced tau pathology and cognitive decline, and concludes that Aβ can drive tau pathogenesis and contribute to tau-mediated neuronal dysfunction in AD. (LLM, conf=0.88)
hedgeddirect- Asserted: passes — The authors put it forward as true.
- Checkable: passes — It can be checked against evidence.
- Load-bearing: passes — The paper’s conclusions depend on it.
- Based: passes — The paper gives a reason why it holds.
It may state two separate claims as one.
The cited sources support only part of this claim — read each source’s verdict below.
In the paper
“the activities of two major tau kinases, GSK3 and PAR-1/microtubule affinity-regulating kinases (MARKs), are often associated with tau detachment from microtubules and Aβ-induced augmentation of tau toxicity [37, 39, 43–45].”
§ Stabilization of Microtubule-Unbound Tau via Tau Phosphorylation at Ser262/356 by Par-1/MARK Contributes to Augmentation of AD-Related Phosphorylation and Aβ42-Induced Tau Toxicity > Introduction
What the sources say
- Not checked — no full text of the sourcecites [37] A Takashima, 1998, Activation of tau protein kinase I/glycogen synthase kinase-3beta by amyloid beta peptide (25–35) enhances phosphorylation of tau in hippocampal neurons, Neurosci Res source
- Partly supportedcites [39] H Zempel, 2010, Abeta oligomers cause localized Ca(2+) elevation, missorting of endogenous Tau into dendrites, Tau phosphorylation, and destruction of microtubules and spines, J Neurosci sourceExperimental — accuracy not yet measured
In the Discussion and Figure 6, the paper links Aβ-induced MARK/Par-1 activity to tau detachment from microtubules and microtubule destabilization. It does not support the same association for GSK3β in this experiment: the Discussion says GSK3β activity did not increase in dendrites with missorted tau. (LLM, conf=0.88)
- Not checked — no full text of the sourcecites [43] QL Ma, 2006, Antibodies against beta-amyloid reduce Abeta oligomers, glycogen synthase kinase-3beta activation and tau phosphorylation in vivo and in vitro, J Neurosci Res source
- Partly supportedcites [44] O Sofola, 2010, Inhibition of GSK-3 ameliorates Abeta pathology in an adult-onset Drosophila model of Alzheimer's disease, PLoS Genet sourceExperimental — accuracy not yet measured
The Introduction links Aβ to increased tau phosphorylation and GSK-3 activation; the Discussion identifies MARK as a kinase that phosphorylates tau. But the paper does not establish that either kinase causes tau to detach from microtubules or that PAR-1/MARK augments Aβ-induced tau toxicity. In its fly model, the Discussion reports no observable change in overall tau phosphorylation with Aβ42 expression. (LLM, conf=0.84)
- Partly supportedcites [45] W Yu, 2012, A critical role for the PAR-1/MARK-tau axis in mediating the toxic effects of Abeta on synapses and dendritic spines, Hum Mol Genet sourceExperimental — accuracy not yet measured
The Introduction and the section ‘Expression of non-phosphorylatable form of tau blocks Aβ toxicity’ link PAR-1/MARK-mediated tau phosphorylation to tau toxicity and Aβ-induced synaptic and spine damage (page numbers unavailable). Our copy does not establish the corresponding role for GSK3 or state that either kinase causes tau to detach from microtubules. (LLM, conf=0.87)
plaincorrelational- Asserted: passes — The authors put it forward as true.
- Checkable: passes — It can be checked against evidence.
- Load-bearing: passes — The paper’s conclusions depend on it.
- Based: passes — The paper gives a reason why it holds.
Probably not a substantial claim.
The sources with a verdict support this claim; the rest weren’t checked yet, have no full text we could read, or their verdicts aren’t rated yet.
In the paper
“In Drosophila, tau phosphorylation at proline-directed Ser and Thr (SP/TP) sites decreases tau binding to microtubules, whereas replacing these phosphorylation sites with unphosphorylatable Ala significantly increases binding [25, 26].”
§ Stabilization of Microtubule-Unbound Tau via Tau Phosphorylation at Ser262/356 by Par-1/MARK Contributes to Augmentation of AD-Related Phosphorylation and Aβ42-Induced Tau Toxicity > Results > Tau phosphorylation at SP/TP sites via GSK3β/Sgg negatively regulates tau binding to microtubules
What the sources say
- Not checked — no full text of the sourcecites [25] S Feuillette, 2010, Drosophila models of human tauopathies indicate that Tau protein toxicity in vivo is mediated by soluble cytosolic phosphorylated forms of the protein, J Neurochem source
- Supportedcites [26] S Chatterjee, 2009, Dissociation of tau toxicity and phosphorylation: role of GSK-3beta, MARK and Cdk5 in a Drosophila model, Hum Mol Genet source
The Results section, “Microtubule binding of S2A tau is reduced, whereas that of S11A is increased compared with wild-type tau” (page not provided), reports significantly greater microtubule binding for the alanine-substituted S11A tau. The Discussion, “Perspectives on the relationship between tau phosphorylation and toxicity in the context of animal models” (page not provided), says proline-directed kinases release tau from microtubules and that inability to be phosphorylated by Shaggy may cause S11A tau to remain bound. (LLM, conf=0.91)
plaindirect- Asserted: passes — The authors put it forward as true.
- Checkable: passes — It can be checked against evidence.
- Load-bearing: unclear — It is unclear whether the paper’s conclusions depend on it.
- Based: passes — The paper gives a reason why it holds.
It may state two separate claims as one.
The cited sources support only part of this claim — read each source’s verdict below.
In the paper
“The majority of tau species (including tau lacking phosphorylation at Ser262/356) are degraded by the proteasome [20], while aggregated tau or tau phosphorylated at Ser262/356 is degraded by the autophagy-lysosome system [79–84].”
§ Stabilization of Microtubule-Unbound Tau via Tau Phosphorylation at Ser262/356 by Par-1/MARK Contributes to Augmentation of AD-Related Phosphorylation and Aβ42-Induced Tau Toxicity > Discussion > How tau phosphorylation at Ser262/356 contributes to neurodegeneration
What the sources say
- Not checked — no full text of the sourcecites [79] CA Dickey, 2006, HSP induction mediates selective clearance of tau phosphorylated at proline-directed Ser/Thr sites but not KXGS (MARK) sites, FASEB J source
- Partly supportedcites [80] Y Wang, 2010, Synergy and antagonism of macroautophagy and chaperone-mediated autophagy in a cell model of pathological tau aggregation, Autophagy sourceExperimental — accuracy not yet measured
The paper’s discussion of tau degradation (page unavailable) says aggregated tau is removed by macroautophagy and tau phosphorylated at KXGS motifs in the repeat domains can be degraded by the autophagy-lysosomal system. Our copy does not identify Ser262/356 specifically, so it does not establish that site-specific part of the claim. (LLM, conf=0.82)
- Partly supportedcites [81] PJ Dolan, 2011, Decreases in valosin-containing protein result in increased levels of tau phosphorylated at Ser262/356, FEBS Lett sourceExperimental — accuracy not yet measured
The Discussion states that tau phosphorylated at KXGS motifs is degraded by autophagy rather than the proteasome, and §3.4 reports increased soluble Ser262/356-phosphorylated tau after autophagy inhibition. These passages support the phosphorylated-tau part of the claim, but our copy does not establish that aggregated tau is degraded by the autophagy-lysosome system; the study reports no change in insoluble tau after VCP knockdown. (LLM, conf=0.87)
- Not checked — no full text of the sourcecites [82] T Hamano, 2008, Autophagic-lysosomal perturbation enhances tau aggregation in transfectants with induced wild-type tau expression, Eur J Neurosci source
- Partly supportedcites [83] Z Berger, 2006, Rapamycin alleviates toxicity of different aggregate-prone proteins, Human Molecular Genetics sourceExperimental — accuracy not yet measured
In “Rapamycin enhances clearance of tau and decreases tau toxicity in vivo” (pp. 4–5), rapamycin reduced aggregate-prone or insoluble tau, and blocking autophagy abolished its effect on insoluble tau. The paper does not identify phosphorylation at Ser262/356, and it says mutant tau can be degraded by autophagy when induced but is not predominantly degraded that way under basal conditions. (LLM, conf=0.88)
- Partly supportedcites [84] C Jo, 2014, Nrf2 reduces levels of phosphorylated tau protein by inducing autophagy adaptor protein NDP52, Nature communications sourceExperimental — accuracy not yet measured
The Results ('Autophagy mediates the degradation of phosphorylated tau'; page unavailable) show that blocking autophagy or lysosomal function attenuated phosphorylated-tau degradation. The Discussion reports reduced Ser262/356-phosphorylated tau after Nrf2 activation or NDP52 overexpression. The Results ('NDP52 decreases sarkosyl-insoluble tau in AD cases'; page unavailable) link NDP52 to less insoluble tau, but suggest prevention of aggregation through phosphorylated-tau clearance rather than demonstrating degradation of already aggregated tau. (LLM, conf=0.85)
plaindirect- Asserted: passes — The authors put it forward as true.
- Checkable: passes — It can be checked against evidence.
- Load-bearing: passes — The paper’s conclusions depend on it.
- Based: passes — The paper gives a reason why it holds.
It may state two separate claims as one.
The cited sources support only part of this claim — read each source’s verdict below.
In the paper
“Consistent with this, the autophagic system and endosome/lysosome pathways are compromised in AD brains, and chronic disturbance of this system is thought to contribute to protein accumulation and neurodegeneration [85–87].”
§ Stabilization of Microtubule-Unbound Tau via Tau Phosphorylation at Ser262/356 by Par-1/MARK Contributes to Augmentation of AD-Related Phosphorylation and Aβ42-Induced Tau Toxicity > Discussion > How tau phosphorylation at Ser262/356 contributes to neurodegeneration
What the sources say
- Not checked — no full text of the sourcecites [85] RA Nixon, 2007, Autophagy, amyloidogenesis and Alzheimer disease, J Cell Sci source
- Partly supportedcites [86] K Inoue, 2012, Macroautophagy deficiency mediates age-dependent neurodegeneration through a phospho-tau pathway, Mol Neurodegener sourceExperimental — accuracy not yet measured
The Background reports macroautophagy defects in brain sections from patients with AD and discusses disruption of the macroautophagy–lysosomal pathway. It also presents defective protein degradation as a possible contributor to pathological inclusions. The cited passages do not establish that the endosomal pathway is compromised in AD brains. (LLM, conf=0.84)
- Partly supportedcites [87] K Moreau, 2014, PICALM modulates autophagy activity and tau accumulation, Nature communications sourceExperimental — accuracy not yet measured
The paper’s introductory discussion (page not available) describes excess autophagosomes in affected AD neurons and suggests defects in their removal. Its Discussion links altered autophagy to tau accumulation and possible neurodegeneration. It does not establish that endosome/lysosome pathways themselves are compromised in AD brains; its evidence about those pathways concerns how CALM regulates autophagy. (LLM, conf=0.83)
plain- Asserted: passes — The authors put it forward as true.
- Checkable: passes — It can be checked against evidence.
- Load-bearing: passes — The paper’s conclusions depend on it.
- Based: passes — The paper gives a reason why it holds.
It may state two separate claims as one.
The cited sources support only part of this claim — read each source’s verdict below.
In the paper
“Drosophila PAR-1 kinase, a functional homolog of MARKs, is the major kinase of human tau at Ser262 and Ser356 expressed in fly eye and brain [53, 63]”
§ Stabilization of Microtubule-Unbound Tau via Tau Phosphorylation at Ser262/356 by Par-1/MARK Contributes to Augmentation of AD-Related Phosphorylation and Aβ42-Induced Tau Toxicity > Results > Tau phosphorylation at Ser262 and Ser356 via PAR-1 is critical for stabilization of taulower
What the sources say
- Not checked — no full text of the sourcecites [53] I Nishimura, 2004, PAR-1 kinase plays an initiator role in a temporally ordered phosphorylation process that confers tau toxicity in Drosophila, Cell source
- Partly supportedcites [63] K Iijima-Ando, 2012, Loss of Axonal Mitochondria Promotes Tau-Mediated Neurodegeneration and Alzheimer's Disease-Related Tau Phosphorylation Via PAR-1, PLoS Genet sourceExperimental — accuracy not yet measured
The Results section on PAR-1 and Ser262 identifies MARK as the mammalian homolog of Drosophila PAR-1 and says PAR-1 knockdown reduces tau phosphorylation at Ser262, suggesting it is the major Ser262 kinase in the fly eye. The paper does not establish that PAR-1 is the major kinase at Ser356 or that this major-kinase finding applies to the fly brain. (LLM, conf=0.88)
plaindirect- Asserted: passes — The authors put it forward as true.
- Checkable: passes — It can be checked against evidence.
- Load-bearing: passes — The paper’s conclusions depend on it.
- Based: passes — The paper gives a reason why it holds.
It may state two separate claims as one.
A result the paper reports from its own data — it cites no other source for it, so there is none to check. The quote shows it is in the paper.
In the paper
“In contrast to PAR-1/MARK, blocking tau phosphorylation at SP/TP sites by knockdown of Sgg/GSK3 did not reduce tau levels, suppress tau mislocalization to the cytosol, or diminish Aβ-mediated augmentation of tau toxicity.”
§ Stabilization of Microtubule-Unbound Tau via Tau Phosphorylation at Ser262/356 by Par-1/MARK Contributes to Augmentation of AD-Related Phosphorylation and Aβ42-Induced Tau Toxicity > Abstract
plain- Asserted: passes — The authors put it forward as true.
- Checkable: passes — It can be checked against evidence.
- Load-bearing: passes — The paper’s conclusions depend on it.
- Based: passes — The paper gives a reason why it holds.
It may state two separate claims as one.
A result the paper reports from its own data — it cites no other source for it, so there is none to check. The quote shows it is in the paper.
In the paper
“Tau proteins expressed in the fly retina are detected as two major bands by western blotting with pan-tau antibody (Fig 1B).”
§ Stabilization of Microtubule-Unbound Tau via Tau Phosphorylation at Ser262/356 by Par-1/MARK Contributes to Augmentation of AD-Related Phosphorylation and Aβ42-Induced Tau Toxicity > Results > Aβ42 increases the level of tau in the cytosol and decreases the level of microtubule-bound tau
plain- Asserted: passes — The authors put it forward as true.
- Checkable: passes — It can be checked against evidence.
- Load-bearing: fails — The paper’s conclusions may not depend on it.
- Based: passes — The paper gives a reason why it holds.
Probably not a substantial claim. The paper’s conclusions may not depend on it.
A result the paper reports from its own data — it cites no other source for it, so there is none to check. The quote shows it is in the paper.
In the paper
“Western blotting with TAU-1 antibody, which specifically recognizes tau protein without phosphorylation at several AD-related sites (Ser194, Ser195, Ser198, and Ser202), detected taulower (Fig 1C, TAU-1)”
§ Stabilization of Microtubule-Unbound Tau via Tau Phosphorylation at Ser262/356 by Par-1/MARK Contributes to Augmentation of AD-Related Phosphorylation and Aβ42-Induced Tau Toxicity > Results > Aβ42 increases the level of tau in the cytosol and decreases the level of microtubule-bound tau
plain- Asserted: passes — The authors put it forward as true.
- Checkable: passes — It can be checked against evidence.
- Load-bearing: passes — The paper’s conclusions depend on it.
- Based: passes — The paper gives a reason why it holds.
Probably not a substantial claim.
A result the paper reports from its own data — it cites no other source for it, so there is none to check. The quote shows it is in the paper.
In the paper
“We found that the levels of tau in the cytosol fraction were significantly elevated, whereas the levels in the microtubule fraction were reduced, in the fly retina co-expressing Aβ42 and tau (Fig 1B).”
§ Stabilization of Microtubule-Unbound Tau via Tau Phosphorylation at Ser262/356 by Par-1/MARK Contributes to Augmentation of AD-Related Phosphorylation and Aβ42-Induced Tau Toxicity > Results > Aβ42 increases the level of tau in the cytosol and decreases the level of microtubule-bound tau
plaindirect- Asserted: passes — The authors put it forward as true.
- Checkable: passes — It can be checked against evidence.
- Load-bearing: passes — The paper’s conclusions depend on it.
- Based: passes — The paper gives a reason why it holds.
It may state two separate claims as one.
A result the paper reports from its own data — it cites no other source for it, so there is none to check. The quote shows it is in the paper.
In the paper
“blocking this stabilization of tau suppressed Aβ42-mediated augmentation of tau toxicity and an increase in the levels of tau phosphorylation at the SP/TP site Thr231”
§ Stabilization of Microtubule-Unbound Tau via Tau Phosphorylation at Ser262/356 by Par-1/MARK Contributes to Augmentation of AD-Related Phosphorylation and Aβ42-Induced Tau Toxicity > Abstract
plaindirect- Asserted: passes — The authors put it forward as true.
- Checkable: passes — It can be checked against evidence.
- Load-bearing: passes — The paper’s conclusions depend on it.
- Based: passes — The paper gives a reason why it holds.
It may state two separate claims as one.
A result the paper reports from its own data — it cites no other source for it, so there is none to check. The quote shows it is in the paper.
In the paper
“co-expression of Aβ42 did not significantly change the levels of tubulin in the form of microtubules (Fig 1B, tubulin) or the levels of acetylated or tyrosinated tubulin (S4 Fig)”
§ Stabilization of Microtubule-Unbound Tau via Tau Phosphorylation at Ser262/356 by Par-1/MARK Contributes to Augmentation of AD-Related Phosphorylation and Aβ42-Induced Tau Toxicity > Results > Aβ42 increases the level of tau in the cytosol and decreases the level of microtubule-bound tau
plain- Asserted: passes — The authors put it forward as true.
- Checkable: passes — It can be checked against evidence.
- Load-bearing: passes — The paper’s conclusions depend on it.
- Based: passes — The paper gives a reason why it holds.
It may state two separate claims as one.
A result the paper reports from its own data — it cites no other source for it, so there is none to check. The quote shows it is in the paper.
In the paper
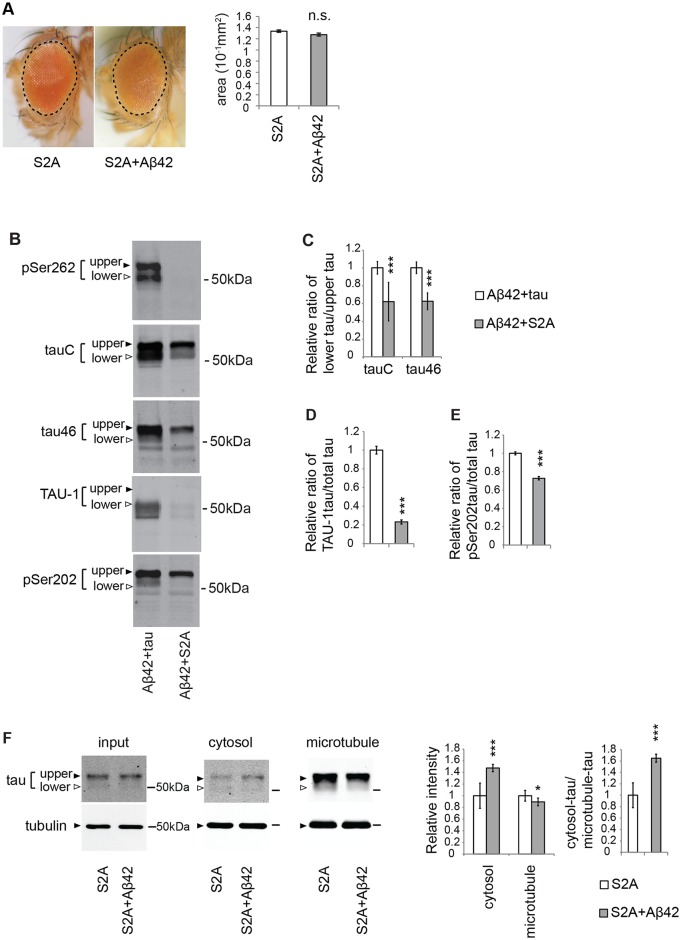
“the effects were smaller than those in wild-type tau: Aβ42 caused a 3-fold increase in the level of wild-type tauupper in the cytosol (Fig 1B), but only a 1.6-fold increase in the level of S2A tauupper (Fig 3F, right).”
§ Stabilization of Microtubule-Unbound Tau via Tau Phosphorylation at Ser262/356 by Par-1/MARK Contributes to Augmentation of AD-Related Phosphorylation and Aβ42-Induced Tau Toxicity > Results > Blocking tau phosphorylation at Ser262/356 with unphosphorylatable alanine substitutions preferentially reduces the levels of taulower and partially suppresses the Aβ42-mediated increase in tau mislocalization from the microtubule to the cytosol
plaindirect- Asserted: passes — The authors put it forward as true.
- Checkable: passes — It can be checked against evidence.
- Load-bearing: passes — The paper’s conclusions depend on it.
- Based: passes — The paper gives a reason why it holds.
It may state two separate claims as one.
A result the paper reports from its own data — it cites no other source for it, so there is none to check. The quote shows it is in the paper.
In the paper
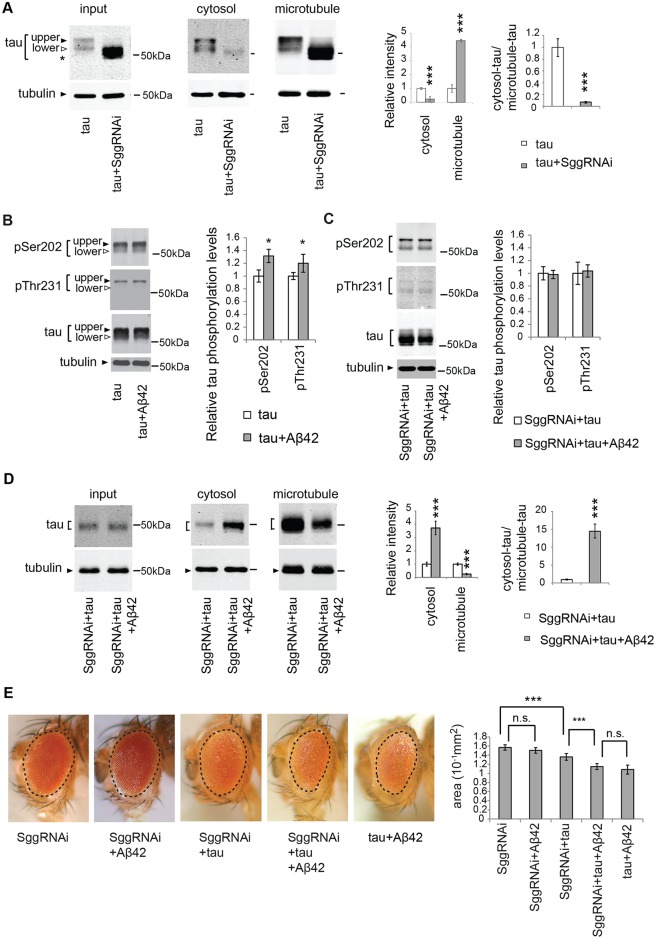
“knockdown of Sgg significantly decreased phosphorylation levels of tau at SP/TP sites and shifted all tau species to lower–molecular weight regions (Fig 2)”
§ Stabilization of Microtubule-Unbound Tau via Tau Phosphorylation at Ser262/356 by Par-1/MARK Contributes to Augmentation of AD-Related Phosphorylation and Aβ42-Induced Tau Toxicity > Discussion > Microtubule-detached, taulower species contributes to the augmentation of tau toxicity caused by Aβ42
plaindirect- Asserted: passes — The authors put it forward as true.
- Checkable: passes — It can be checked against evidence.
- Load-bearing: passes — The paper’s conclusions depend on it.
- Based: passes — The paper gives a reason why it holds.
It may state two separate claims as one.
A result the paper reports from its own data — it cites no other source for it, so there is none to check. The quote shows it is in the paper.
In the paper
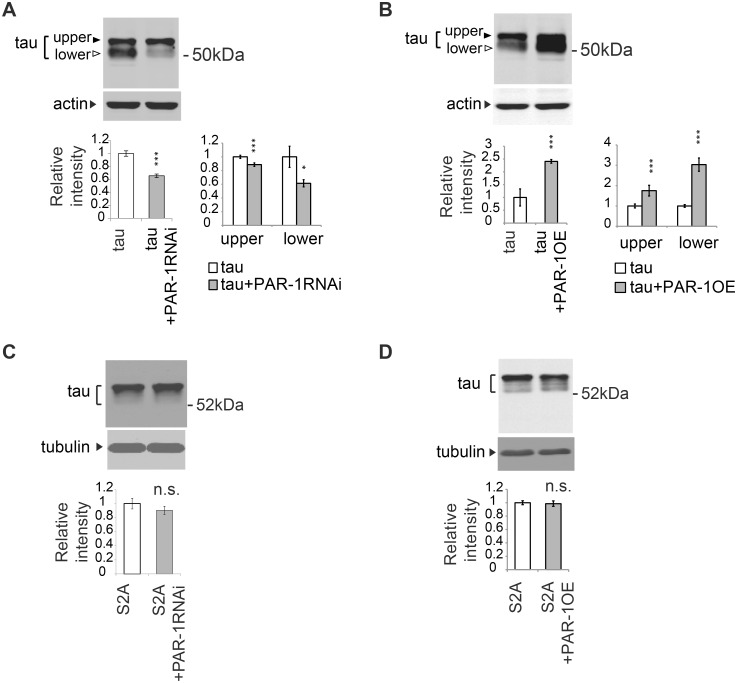
“PAR-1 knockdown reduced the levels of tau (Fig 5C, tauC/Tau46), and the reductions in the levels of taulower were more prominent than those of tauupper (Fig 5C, tauC/Tau46,).”
§ Stabilization of Microtubule-Unbound Tau via Tau Phosphorylation at Ser262/356 by Par-1/MARK Contributes to Augmentation of AD-Related Phosphorylation and Aβ42-Induced Tau Toxicity > Results > PAR-1/MARK mediates the increase in the level of tau phosphorylated at Ser262 caused by Aβ42, and knockdown of PAR-1/MARK markedly decreases the levels of taulower
plaindirect- Asserted: passes — The authors put it forward as true.
- Checkable: passes — It can be checked against evidence.
- Load-bearing: passes — The paper’s conclusions depend on it.
- Based: passes — The paper gives a reason why it holds.
It may state two separate claims as one.
A result the paper reports from its own data — it cites no other source for it, so there is none to check. The quote shows it is in the paper.
In the paper
“although Aβ42 still increased the level of S2A tauupper in the cytosol and decreased that in the microtubule fraction (Fig 3F)”
§ Stabilization of Microtubule-Unbound Tau via Tau Phosphorylation at Ser262/356 by Par-1/MARK Contributes to Augmentation of AD-Related Phosphorylation and Aβ42-Induced Tau Toxicity > Results > Blocking tau phosphorylation at Ser262/356 with unphosphorylatable alanine substitutions preferentially reduces the levels of taulower and partially suppresses the Aβ42-mediated increase in tau mislocalization from the microtubule to the cytosol
plaindirect- Asserted: passes — The authors put it forward as true.
- Checkable: passes — It can be checked against evidence.
- Load-bearing: passes — The paper’s conclusions depend on it.
- Based: passes — The paper gives a reason why it holds.
It may state two separate claims as one.
A result the paper reports from its own data — it cites no other source for it, so there is none to check. The quote shows it is in the paper.
In the paper
“In vivo microtubule-binding assays revealed that, in the GSK3/Sgg knockdown background, co-expression of Aβ42 was still capable of increasing the level of tau in the cytosolic fraction and decreasing the level in the microtubule fraction (Fig 2D).”
§ Stabilization of Microtubule-Unbound Tau via Tau Phosphorylation at Ser262/356 by Par-1/MARK Contributes to Augmentation of AD-Related Phosphorylation and Aβ42-Induced Tau Toxicity > Results > Knockdown of GSK3β/Sgg is not sufficient to suppress either mislocalization of tau to the cytosol or Aβ42-induced augmentation of tau toxicity
plaindirect- Asserted: passes — The authors put it forward as true.
- Checkable: passes — It can be checked against evidence.
- Load-bearing: passes — The paper’s conclusions depend on it.
- Based: passes — The paper gives a reason why it holds.
It may state two separate claims as one.
A result the paper reports from its own data — it cites no other source for it, so there is none to check. The quote shows it is in the paper.
In the paper
“Under this experimental condition, expression of neither Aβ42 alone nor Aβ42 with GSK3β/Sgg RNAi caused a reduction in eye size (S6 Fig)”
§ Stabilization of Microtubule-Unbound Tau via Tau Phosphorylation at Ser262/356 by Par-1/MARK Contributes to Augmentation of AD-Related Phosphorylation and Aβ42-Induced Tau Toxicity > Results > Knockdown of GSK3β/Sgg is not sufficient to suppress either mislocalization of tau to the cytosol or Aβ42-induced augmentation of tau toxicity
plain- Asserted: passes — The authors put it forward as true.
- Checkable: passes — It can be checked against evidence.
- Load-bearing: passes — The paper’s conclusions depend on it.
- Based: passes — The paper gives a reason why it holds.
It may state two separate claims as one.
A result the paper reports from its own data — it cites no other source for it, so there is none to check. The quote shows it is in the paper.
In the paper
“Moreover, the SDS-PAGE migration pattern of S2A tau differed from that of wild-type tau.”
§ Stabilization of Microtubule-Unbound Tau via Tau Phosphorylation at Ser262/356 by Par-1/MARK Contributes to Augmentation of AD-Related Phosphorylation and Aβ42-Induced Tau Toxicity > Results > Blocking tau phosphorylation at Ser262/356 with unphosphorylatable alanine substitutions preferentially reduces the levels of taulower and partially suppresses the Aβ42-mediated increase in tau mislocalization from the microtubule to the cytosol
plaincorrelational- Asserted: passes — The authors put it forward as true.
- Checkable: passes — It can be checked against evidence.
- Load-bearing: fails — The paper’s conclusions may not depend on it.
- Based: passes — The paper gives a reason why it holds.
Probably not a substantial claim. The paper’s conclusions may not depend on it.
A result the paper reports from its own data — it cites no other source for it, so there is none to check. The quote shows it is in the paper.
In the paper
“when the phosphorylation levels of S2A tau at Ser202 were normalized against total levels of S2A tau, they were not elevated; instead, they were reduced relative to those of wild-type tau (Fig 3B and 3E).”
§ Stabilization of Microtubule-Unbound Tau via Tau Phosphorylation at Ser262/356 by Par-1/MARK Contributes to Augmentation of AD-Related Phosphorylation and Aβ42-Induced Tau Toxicity > Results > Blocking tau phosphorylation at Ser262/356 with unphosphorylatable alanine substitutions preferentially reduces the levels of taulower and partially suppresses the Aβ42-mediated increase in tau mislocalization from the microtubule to the cytosol
plain- Asserted: passes — The authors put it forward as true.
- Checkable: passes — It can be checked against evidence.
- Load-bearing: passes — The paper’s conclusions depend on it.
- Based: passes — The paper gives a reason why it holds.
It may state two separate claims as one.
In the paper
“whereas PAR-1/MARKs are non-SP/TP kinases that phosphorylate tau at Ser262 and Ser356 in the repeat domains located in the microtubule-binding region [50].”
§ Stabilization of Microtubule-Unbound Tau via Tau Phosphorylation at Ser262/356 by Par-1/MARK Contributes to Augmentation of AD-Related Phosphorylation and Aβ42-Induced Tau Toxicity > Introduction
What the sources say
- Not checked — no full text of the sourcecites [50] G Drewes, 1997, MARK, a novel family of protein kinases that phosphorylate microtubule-associated proteins and trigger microtubule disruption, Cell source
plaindirect- Asserted: passes — The authors put it forward as true.
- Checkable: passes — It can be checked against evidence.
- Load-bearing: passes — The paper’s conclusions depend on it.
- Based: passes — The paper gives a reason why it holds.
It may state two separate claims as one.
A conclusion the paper draws from its own results — it cites no other source for it, so there is none to check. The quote shows it is in the paper.
In the paper
“These results suggest that, regardless of its phosphorylation status, microtubule-unbound free tau in the cytosol is more abundant in the presence of Aβ42.”
§ Stabilization of Microtubule-Unbound Tau via Tau Phosphorylation at Ser262/356 by Par-1/MARK Contributes to Augmentation of AD-Related Phosphorylation and Aβ42-Induced Tau Toxicity > Results > Aβ42 increases the level of tau in the cytosol and decreases the level of microtubule-bound tau
hedgeddirect- Asserted: passes — The authors put it forward as true.
- Checkable: passes — It can be checked against evidence.
- Load-bearing: passes — The paper’s conclusions depend on it.
- Based: passes — The paper gives a reason why it holds.
It may state two separate claims as one.
The paper states this without a source or data behind it here, so there is nothing to check it against. The quote shows it is in the paper.
In the paper
“However, the roles of, and interdependency between, tau phosphorylation by GSK3 and MARK/PAR-1 in an early step of tau mismetabolism, such as tau mislocalization and stabilization of mislocalized tau, are not fully understood.”
§ Stabilization of Microtubule-Unbound Tau via Tau Phosphorylation at Ser262/356 by Par-1/MARK Contributes to Augmentation of AD-Related Phosphorylation and Aβ42-Induced Tau Toxicity > Introduction
plain- Asserted: passes — The authors put it forward as true.
- Checkable: passes — It can be checked against evidence.
- Load-bearing: passes — The paper’s conclusions depend on it.
- Based: passes — The paper gives a reason why it holds.
Probably not a substantial claim.
A conclusion the paper draws from its own results — it cites no other source for it, so there is none to check. The quote shows it is in the paper.
In the paper
“These results raise the possibility that the difference between the original taulower and tauupper species includes not only phosphorylation status at GSK3-target sites but also additional post-transcriptional modifications and/or differences in cellular localization.”
§ Stabilization of Microtubule-Unbound Tau via Tau Phosphorylation at Ser262/356 by Par-1/MARK Contributes to Augmentation of AD-Related Phosphorylation and Aβ42-Induced Tau Toxicity > Discussion > Microtubule-detached, taulower species contributes to the augmentation of tau toxicity caused by Aβ42
hedgedcorrelational- Asserted: passes — The authors put it forward as true.
- Checkable: passes — It can be checked against evidence.
- Load-bearing: fails — The paper’s conclusions may not depend on it.
- Based: passes — The paper gives a reason why it holds.
Probably not a substantial claim. The paper’s conclusions may not depend on it. It may state two separate claims as one.
What the paper did — it cites no source for this, so there is none to check. The quote shows it is in the paper.
In the paper
“One of the membranes was probed with anti-tubulin, and used as the loading control for other blots in each experiment.”
§ Stabilization of Microtubule-Unbound Tau via Tau Phosphorylation at Ser262/356 by Par-1/MARK Contributes to Augmentation of AD-Related Phosphorylation and Aβ42-Induced Tau Toxicity > Materials and Methods > Western blotting
plain- Asserted: passes — The authors put it forward as true.
- Checkable: passes — It can be checked against evidence.
- Load-bearing: fails — The paper’s conclusions may not depend on it.
- Based: passes — The paper gives a reason why it holds.
Probably not a substantial claim. The paper’s conclusions may not depend on it.
What the paper did — it cites no source for this, so there is none to check. The quote shows it is in the paper.
In the paper
“All experiments were performed using age-matched male flies, and genotypes are described in S1 Table.”
§ Stabilization of Microtubule-Unbound Tau via Tau Phosphorylation at Ser262/356 by Par-1/MARK Contributes to Augmentation of AD-Related Phosphorylation and Aβ42-Induced Tau Toxicity > Materials and Methods > Fly stocks
plain- Asserted: passes — The authors put it forward as true.
- Checkable: passes — It can be checked against evidence.
- Load-bearing: fails — The paper’s conclusions may not depend on it.
- Based: passes — The paper gives a reason why it holds.
Probably not a substantial claim. The paper’s conclusions may not depend on it.
A conclusion the paper draws from its own results — it cites no other source for it, so there is none to check. The quote shows it is in the paper.
In the paper
“Taken together, these data demonstrate that S2A mutation preferentially reduces the levels of taulower, and partially suppresses the Aβ42-mediated increase in the levels of tau mislocalized from the microtubule to the cytosol.”
§ Stabilization of Microtubule-Unbound Tau via Tau Phosphorylation at Ser262/356 by Par-1/MARK Contributes to Augmentation of AD-Related Phosphorylation and Aβ42-Induced Tau Toxicity > Results > Blocking tau phosphorylation at Ser262/356 with unphosphorylatable alanine substitutions preferentially reduces the levels of taulower and partially suppresses the Aβ42-mediated increase in tau mislocalization from the microtubule to the cytosol
boosteddirect- Asserted: passes — The authors put it forward as true.
- Checkable: passes — It can be checked against evidence.
- Load-bearing: passes — The paper’s conclusions depend on it.
- Based: passes — The paper gives a reason why it holds.
It may state two separate claims as one.
- Rests on an assumption: Changes in the levels of tau species measured by western blotting reflect changes in tau protein stability.
- Rests on an assumption: The S2A mutation (Ser262/356 to Ala) does not alter tau properties other than preventing phosphorylation at these sites.
What the paper did — it cites no source for this, so there is none to check. The quote shows it is in the paper.
In the paper
“Western blots were repeated a minimum of three times with different animals and representative blots are shown.”
§ Stabilization of Microtubule-Unbound Tau via Tau Phosphorylation at Ser262/356 by Par-1/MARK Contributes to Augmentation of AD-Related Phosphorylation and Aβ42-Induced Tau Toxicity > Materials and Methods > Western blotting
plainn = 3- Asserted: passes — The authors put it forward as true.
- Checkable: passes — It can be checked against evidence.
- Load-bearing: fails — The paper’s conclusions may not depend on it.
- Based: passes — The paper gives a reason why it holds.
Probably not a substantial claim. The paper’s conclusions may not depend on it.
A conclusion the paper draws from its own results — it cites no other source for it, so there is none to check. The quote shows it is in the paper.
In the paper
“Taken together, these results suggest that blocking tau phosphorylation at GSK3/Sgg sites is not sufficient to suppress either mislocalization of tau to the cytosol or Aβ42-induced augmentation of tau toxicity.”
§ Stabilization of Microtubule-Unbound Tau via Tau Phosphorylation at Ser262/356 by Par-1/MARK Contributes to Augmentation of AD-Related Phosphorylation and Aβ42-Induced Tau Toxicity > Results > Knockdown of GSK3β/Sgg is not sufficient to suppress either mislocalization of tau to the cytosol or Aβ42-induced augmentation of tau toxicity
hedged- Asserted: passes — The authors put it forward as true.
- Checkable: passes — It can be checked against evidence.
- Load-bearing: passes — The paper’s conclusions depend on it.
- Based: passes — The paper gives a reason why it holds.
It may state two separate claims as one. The quote only partly states this claim.
A conclusion the paper draws from its own results — it cites no other source for it, so there is none to check. The quote shows it is in the paper.
In the paper
“This study highlights the critical roles of tau phosphorylation at Ser262/356 in stabilization of tau and its contribution to tau-mediated neurodegeneration.”
§ Stabilization of Microtubule-Unbound Tau via Tau Phosphorylation at Ser262/356 by Par-1/MARK Contributes to Augmentation of AD-Related Phosphorylation and Aβ42-Induced Tau Toxicity > Discussion > Several pathways in tau mismetabolism have been dissected
plaindirect- Asserted: passes — The authors put it forward as true.
- Checkable: passes — It can be checked against evidence.
- Load-bearing: passes — The paper’s conclusions depend on it.
- Based: passes — The paper gives a reason why it holds.
It may state two separate claims as one.
A conclusion the paper draws from its own results — it cites no other source for it, so there is none to check. The quote shows it is in the paper.
In the paper
“These results suggest that tau phosphorylation at Ser262 and Ser356 stabilizes less phosphorylated forms of tau (taulower) but does not promote tau phosphorylation at SP/TP sites (see also Fig 4).”
§ Stabilization of Microtubule-Unbound Tau via Tau Phosphorylation at Ser262/356 by Par-1/MARK Contributes to Augmentation of AD-Related Phosphorylation and Aβ42-Induced Tau Toxicity > Results > Blocking tau phosphorylation at Ser262/356 with unphosphorylatable alanine substitutions preferentially reduces the levels of taulower and partially suppresses the Aβ42-mediated increase in tau mislocalization from the microtubule to the cytosol
hedgeddirect- Asserted: passes — The authors put it forward as true.
- Checkable: passes — It can be checked against evidence.
- Load-bearing: passes — The paper’s conclusions depend on it.
- Based: passes — The paper gives a reason why it holds.
It may state two separate claims as one.
- Rests on an assumption: Changes in the levels of tau species measured by western blotting reflect changes in tau protein stability.
A conclusion the paper draws from its own results — it cites no other source for it, so there is none to check. The quote shows it is in the paper.
In the paper
“Thus, targeting multiple pools of abnormal tau stabilized by distinct pathways could additively suppress tau-mediated toxicity.”
§ Stabilization of Microtubule-Unbound Tau via Tau Phosphorylation at Ser262/356 by Par-1/MARK Contributes to Augmentation of AD-Related Phosphorylation and Aβ42-Induced Tau Toxicity > Discussion > Several pathways in tau mismetabolism have been dissected
hedgedconditional- Asserted: passes — The authors put it forward as true.
- Checkable: fails — It may be too vague to check against evidence.
- Load-bearing: passes — The paper’s conclusions depend on it.
- Based: passes — The paper gives a reason why it holds.
Probably not a substantial claim. It may be too vague to check against evidence.
The paper relies on this without support.
Changes in the levels of tau species measured by western blotting reflect changes in tau protein stability.
“These results suggest that tau phosphorylation at Ser262 and Ser356 stabilizes less phosphorylated forms of tau (taulower) but does not promote tau phosphorylation at SP/TP sites (see also Fig 4).”
The paper relies on this without support.
The S2A mutation (Ser262/356 to Ala) does not alter tau properties other than preventing phosphorylation at these sites.
“These mutations abolished tau phosphorylation at Ser262 (Fig 3B, pSer262).”
The paper relies on this without support.
Changes in tau protein levels reflect changes in tau stability rather than synthesis or other processes.
“Taken together, these results indicate that PAR-1 stabilizes less phosphorylated forms of tau (taulower) through phosphorylation at Ser262 and Ser356.”
The paper relies on this without support.
Aβ42-induced tau toxicity in the Drosophila retina is relevant to AD pathogenesis.
“suggesting the relevance of this step to AD pathogenesis.”
The paper relies on this without support.
The TAU-1 antibody specifically recognizes tau lacking phosphorylation at Ser202.
“western blot analysis using the TAU-1 antibody, which specifically recognizes tau lacking phosphorylation at Ser202, revealed that blocking tau phosphorylation at Ser262/356 by either by PAR-1 knockdown (Fig 5D) or introduction of the S2A mutation (Fig 3B), did not increase, but rather significantly decreased, the levels of tau species that are not phosphorylated at Ser202.”
Self-check
Percentages, sums and reported differences re-computed from the paper’s own numbers.
Each contradiction between two passages listed here was confirmed by an independent check.
Rated major: it would touch a result — a value a result rests on, reported and recomputed p-values on opposite sides of the significance level, two passages that conflict with no sign which is right, or a cited work retracted before this paper was published.
In the paper
§ Stabilization of Microtubule-Unbound Tau via Tau Phosphorylation at Ser262/356 by Par-1/MARK Contributes to Augmentation of AD-Related Phosphorylation and Aβ42-Induced Tau Toxicity > Materials and Methods > Fly stocks
“All experiments were performed using age-matched male flies, and genotypes are described in S1 Table.”
§ Stabilization of Microtubule-Unbound Tau via Tau Phosphorylation at Ser262/356 by Par-1/MARK Contributes to Augmentation of AD-Related Phosphorylation and Aβ42-Induced Tau Toxicity > Materials and Methods > Histological analysis
“To analyze internal eye structure, heads of female flies were fixed in Bouin's fixative (EMS) for 48 hr at room temperature”
Citations
Cites
The Amyloid Hypothesis of Alzheimer’s Disease: Progress and Problems on the Road to Therapeutics
Hardy, J., & Selkoe, D. J. (2002) · Science · doi:10.1126/science.1072994 · Cited by 13,864
Tau-mediated neurodegeneration in Alzheimer’s disease and related disorders
Ballatore, C., Lee, V. M.-Y., & Trojanowski, J. Q. (2007) · Nature Reviews Neuroscience · doi:10.1038/nrn2194 · Cited by 2,174
Tau Suppression in a Neurodegenerative Mouse Model Improves Memory Function
SantaCruz, K., Lewis, J., Spires, T., Paulson, J., Kotilinek, L., Ingelsson, M., Guimaraes, A., DeTure, M., Ramsden, M., McGowan, E., et al. (2005) · Science · doi:10.1126/science.1113694 · Cited by 2,014
Reducing Endogenous Tau Ameliorates Amyloid ß-Induced Deficits in an Alzheimer's Disease Mouse Model
Roberson, E. D., Scearce-Levie, K., Palop, J. J., Yan, F., Cheng, I. H., Wu, T., Gerstein, H., Yu, G.-Q., & Mucke, L. (2007) · Science · doi:10.1126/science.1141736 · Cited by 1,892
Transmission and spreading of tauopathy in transgenic mouse brain
Clavaguera, F., Bolmont, T., Crowther, R. A., Abramowski, D., Frank, S., Probst, A., Fraser, G., Stalder, A. K., Beibel, M., Staufenbiel, M., et al. (2009) · Nature Cell Biology · doi:10.1038/ncb1901 · Cited by 1,803
Enhanced neurofibrillary degeneration in transgenic mice expressing mutant tau and APP
Lewis, J., Dickson, D. W., Lin, W.-L., Chisholm, L., Corral, A., Jones, G., Yen, S.-H., Sahara, N., Skipper, L., Yager, D., et al. (2001) · Science · doi:10.1126/science.1058189 · Cited by 1,611
Formation of Neurofibrillary Tangles in P301L Tau Transgenic Mice Induced by Aβ42 Fibrils
Götz, J., Chen, F., van Dorpe, J., & Nitsch, R. M. (2001) · Science · doi:10.1126/science.1062097 · Cited by 1,526
Propagation of Tau Misfolding from the Outside to the Inside of a Cell
Frost, B., Jacks, R. L., & Diamond, M. I. (2009) · Journal of Biological Chemistry · doi:10.1074/jbc.m808759200 · Cited by 1,252
The Intersection of Amyloid Beta and Tau at Synapses in Alzheimer’s Disease
Spires-Jones, T. L., & Hyman, B. T. (2014) · Neuron · doi:10.1016/j.neuron.2014.05.004 · Cited by 1,201
Hoover, B. R., Reed, M. N., Su, J., Penrod, R. D., Kotilinek, L. A., Grant, M. K., Pitstick, R., Carlson, G. A., Lanier, L. M., Yuan, L.-L., et al. (2010) · Neuron · doi:10.1016/j.neuron.2010.11.030 · Cited by 1,118
Cited by
Sorted by citations
Alzheimer’s disease: Recent treatment strategies
Vaz, M., & Silvestre, S. (2020) · European Journal of Pharmacology · doi:10.1016/j.ejphar.2020.173554 · Cited by 547
Wang, M., Li, A., Sekiya, M., Beckmann, N. D., Quan, X., Schrode, N., Fernando, M. B., Yu, A., Zhu, L., Cao, J., et al. (2021) · Neuron · doi:10.1016/j.neuron.2020.11.002 · Cited by 185
Self-citationAmyloidogenesis of Tau protein
Niżyński, B., Dzwolak, W., & Nieznański, K. (2017) · Protein Science · doi:10.1002/pro.3275 · Cited by 166
Reduction of Nuak1 Decreases Tau and Reverses Phenotypes in a Tauopathy Mouse Model
Lasagna‐Reeves, C. A., de Haro, M., Hao, S., Park, J., Rousseaux, M. W. C., Al‐Ramahi, I., Jafar‐Nejad, P., Vilanova-Velez, L., See, L., Maio, A. D., et al. (2016) · Neuron · doi:10.1016/j.neuron.2016.09.022 · Cited by 154
Katsumoto, A., Takeuchi, H., & Tanaka, F. (2019) · Frontiers in Neurology · doi:10.3389/fneur.2019.00980 · Cited by 151
Metadata
- Authors
- Ando, K., Maruko-Otake, A., Ohtake, Y., Hayashishita, M., Sekiya, M., & Iijima, K. M.
- Affiliations
- Thomas Jefferson University (US)
- National Center for Geriatrics and Gerontology (JP)
- Corresponding author
- Ando, Kanae
- Iijima, Koichi M.
- Venue
- PLOS Genetics
- Publisher
- Public Library of Science (PLoS)
- Published
- 2016-03-29
- Volume
- 12
- Issue
- 3
- Pages
- e1005917
- ISSN
- 1553-7390 (ISSN-L)
- 1553-7404
- PMC
- PMC4811436
- OpenAlex
- W2325575548
- Cited by
- 105
- References
- 117
- Citations by year
- 2026: 5 · 2025: 11 · 2024: 11 · 2023: 7 · 2022: 13 · 2021: 5 · 2020: 16 · 2019: 10 · 2018: 10 · 2017: 10 · 2016: 7
- FWCI
- 9.93
- Type
- journal article
- Language
- en
- Open access
- gold
- doi.org
- Licence
- Locations
- PLoS Genetics (publishedVersion, cc-by)
- PubMed Central (publishedVersion, cc-by)
- PubMed (publishedVersion)
- The Medicine Forum (submittedVersion, cc-by)
- DOAJ (DOAJ: Directory of Open Access Journals) (submittedVersion, cc-by-sa)
- Figshare (submittedVersion, cc-by)
- Funders
- Alzheimer's Association (NIRG-08-91985)
- Hoansha Foundation
- National Center for Geriatrics and Gerontology
- Tokyo Metropolitan University
- National Institutes of Health
- Japan Society for the Promotion of Science (15K06712, 15H01564)
- National Institute on Aging (U01AG046170, R01AG032279)
- National Institute of General Medical Sciences (R01GM084947, GM084947)
- Topics
- Life Sciences › Neuroscience › Cellular and Molecular Neuroscience › Alzheimer's disease research and treatments
- Health Sciences › Medicine › Psychiatry and Mental health › Dementia and Cognitive Impairment Research
- Life Sciences › Neuroscience › Neurology › Neuroinflammation and Neurodegeneration Mechanisms
- Keywords
- tau phosphorylation, amyloid-beta 42, Alzheimer's disease, glycogen synthase kinase-3, tau toxicity, neurodegeneration, Drosophila model
- MeSH terms
- Glycogen Synthase Kinase 3 beta, Alzheimer Disease, Animals, Disease Models, Animal, Drosophila, Hippocampus, Humans, Microtubules, Neurons, Phosphorylation, Tubulin, Amyloid beta-Peptides, tau Proteins, Animals, Genetically Modified, Glycogen Synthase Kinase 3, Receptor, PAR-1
About these checks
Registry, retraction, Cites and statistics results are computed, not judged, with one exception: a printed reference that no index lists is read once by a model before it counts as a citation error. Claims are extracted by a model and kept only when their quote appears verbatim in the text; each cited source is then checked, with a model’s help, for whether it says what the claim relies on. Those verdicts can be wrong — read the claim’s quote and the cited source before relying on one.
A language model drew the claims from the paper on 2026-11-02, under version 3 of the claim definition (model deepseek-v4.1-flash, prompt extract-v3).
A second model labelled each claim on 2026-11-02 (model jev-1.13-20260917, definition revision gold-guideline-v0.2).
Cited sources are checked with a language model’s help (gpt-6-sol).
Statistics and arithmetic are recomputed, not judged.
Confidence bands are shown only for fields calibrated on our annotated test set. None is calibrated yet, so no band is shown.
What counts as a claim ›How we measure confidence ›How we check this ›
Are you an author, or do you see a problem with this page? Request a review
