

The DOI matches its Crossref record; 51 of the 51 references it cites were found in a registry or an index.
A Normalization Model of Attentional Modulation of Single Unit Responses
Open accessAbstract
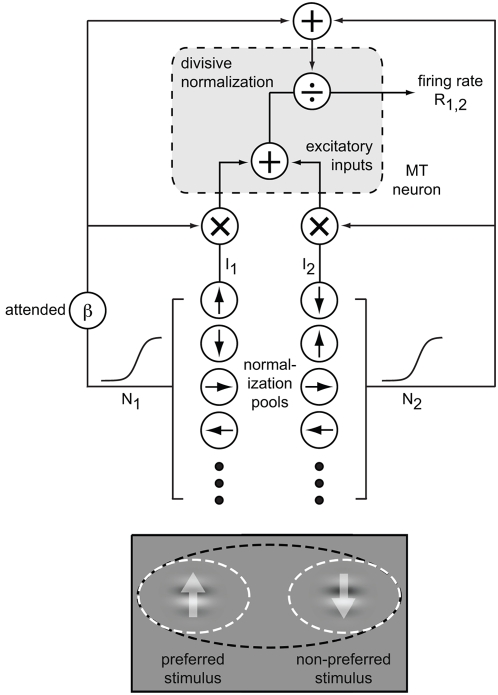
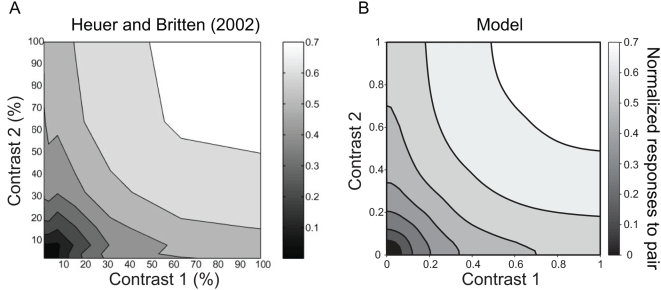
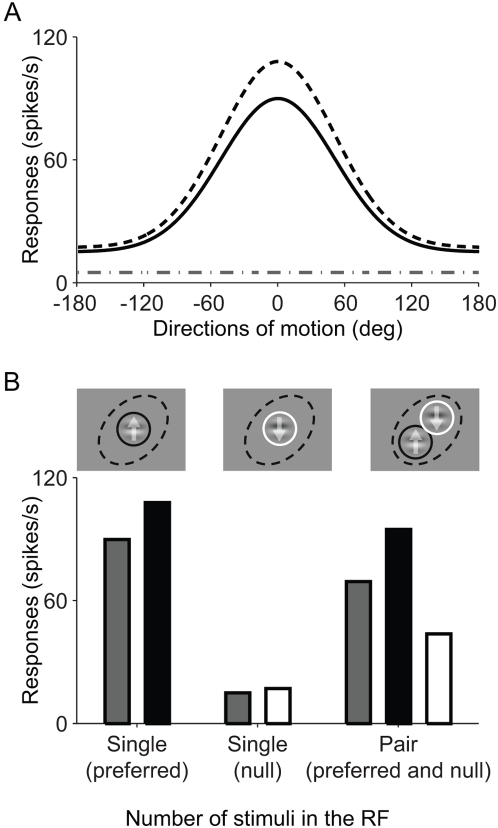
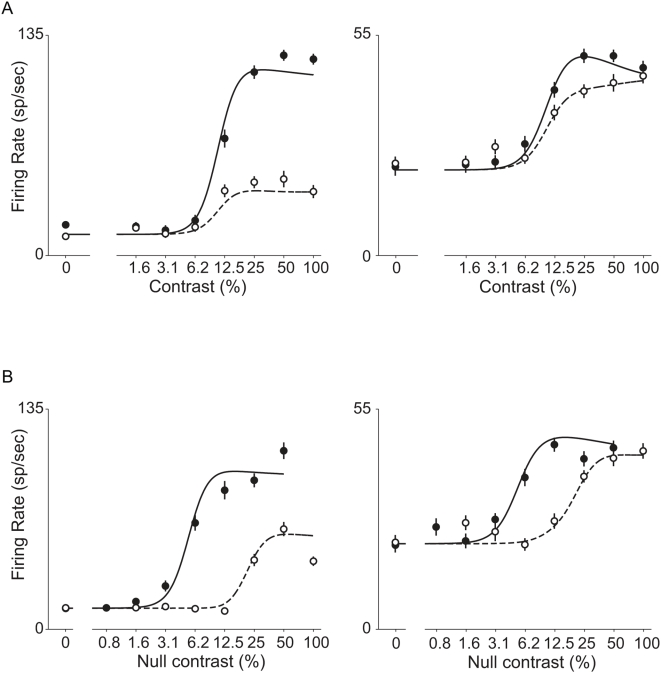
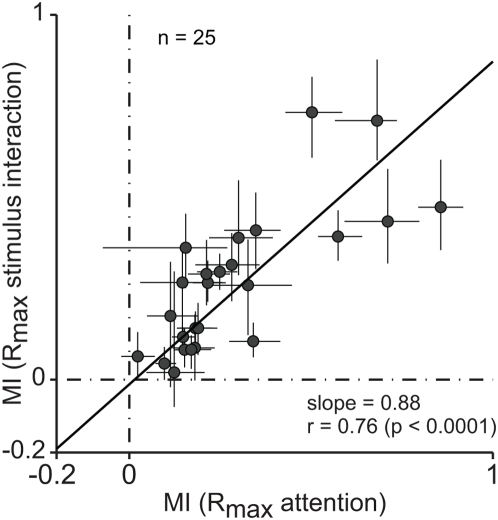
Although many studies have shown that attention to a stimulus can enhance the responses of individual cortical sensory neurons, little is known about how attention accomplishes this change in response. Here, we propose that attention-based changes in neuronal responses depend on the same response normalization mechanism that adjusts sensory responses whenever multiple stimuli are present. We have implemented a model of attention that assumes that attention works only through this normalization mechanism, and show that it can replicate key effects of attention. The model successfully explains how attention changes the gain of responses to individual stimuli and also why modulation by attention is more robust and not a simple gain change when multiple stimuli are present inside a neuron's receptive field. Additionally, the model accounts well for physiological data that measure separately attentional modulation and sensory normalization of the responses of individual neurons in area MT in visual cortex. The proposal that attention works through a normalization mechanism sheds new light a broad range of observations on how attention alters the representation of sensory information in cerebral cortex.
Overview
The claims and statistics of this paper haven’t been checked yet.
Run the check — free, no account needed. It reads the open-access text and checks the sources it cites.
Integrity signals
Registry
Cites
Statistics
Figures
Verification
Claims the paper makes
The claims and statistics of this paper haven’t been checked yet.
Run the check — free, no account needed. It reads the open-access text and checks the sources it cites.
Claims other papers make about this one
Each is checked against this paper’s own text: does it say what the citing paper says it does?
In the citing paper
“Attentional modulation of neural gain has been particularly well studied in the non-human primate visual system1,42,43, in which visual spatial attention within the receptive field of a recorded neuron enhances both contrast gain (that is, scaling of that neuron’s stimulus-response relationship along the contrast axis)43 and response gain (that is, multiplicative transformation of responses to all”
From Mechanisms underlying gain modulation in the cortex (2020) · cites this paper as [46]
Self-check
Percentages, sums and reported differences re-computed from the paper’s own numbers.
The self-check needs the paper’s full text.
Citations
Cites
Neural Mechanisms of Selective Visual Attention
Desimone, R., & Duncan, J. (1995) · Annual Review of Neuroscience · doi:10.1146/annurev.ne.18.030195.001205 · Cited by 8,388
Selective Attention Gates Visual Processing in the Extrastriate Cortex
Moran, J., & Desimone, R. (1985) · Science · doi:10.1126/science.4023713 · Cited by 2,433
Shadlen, M. N., & Newsome, W. T. (1998) · The Journal of Neuroscience · doi:10.1523/jneurosci.18-10-03870.1998 · Cited by 2,178
Selective Attention Gates Visual Processing in the Extrastriate Cortex
Moran, J., & Desimone, R. (2003) · The MIT Press eBooks · doi:10.7551/mitpress/2834.003.0024 · Cited by 2,164
Normalization of cell responses in cat striate cortex
Heeger, D. J. (1992) · Visual Neuroscience · doi:10.1017/s0952523800009640 · Cited by 1,835
Synaptic depression and cortical gain control
Abbott, L. F., Varela, J. A., Sen, K., & Nelson, S. B. (1997) · Science · doi:10.1126/science.275.5297.221 · Cited by 1,690
Neural mechanisms of spatial selective attention in areas V1, V2, and V4 of macaque visual cortex
Luck, S. J., Chelazzi, L., Hillyard, S. A., & Desimone, R. (1997) · Journal of Neurophysiology · doi:10.1152/jn.1997.77.1.24 · Cited by 1,615
The neural bases of momentary lapses in attention
Weissman, D. H., Roberts, K. C., Visscher, K. M., & Woldorff, M. G. (2006) · Nature Neuroscience · doi:10.1038/nn1727 · Cited by 1,566
Feature-based attention influences motion processing gain in macaque visual cortex
Treue, S., & Trujillo, J. C. M. (1999) · Nature · doi:10.1038/21176 · Cited by 1,465
Maunsell, J. H. R., & Essen, D. C. V. (1983) · Journal of Neurophysiology · doi:10.1152/jn.1983.49.5.1127 · Cited by 1,462
Self-citationThe Normalization Model of Attention
Reynolds, J. H., & Heeger, D. J. (2009) · Neuron · doi:10.1016/j.neuron.2009.01.002 · Cited by 1,457
Competitive Mechanisms Subserve Attention in Macaque Areas V2 and V4
Reynolds, J. H., Chelazzi, L., & Desimone, R. (1999) · The Journal of Neuroscience · doi:10.1523/jneurosci.19-05-01736.1999 · Cited by 1,236
Effects of Attention on Orientation-Tuning Functions of Single Neurons in Macaque Cortical Area V4
McAdams, C. J., & Maunsell, J. H. R. (1999) · Journal of Neuroscience · doi:10.1523/jneurosci.19-01-00431.1999 · Cited by 1,218
Self-citationAttentional modulation of visual processing
Reynolds, J. H., & Chelazzi, L. (2004) · Annual Review of Neuroscience · doi:10.1146/annurev.neuro.26.041002.131039 · Cited by 1,158
Attention Increases Sensitivity of V4 Neurons
Reynolds, J. H., Pasternak, T., & Desimone, R. (2000) · Neuron · doi:10.1016/s0896-6273(00)81206-4 · Cited by 1,034
Attentional modulation of visual motion processing in cortical areas MT and MST
Treue, S., & Maunsell, J. H. R. (1996) · Nature · doi:10.1038/382539a0 · Cited by 1,025
Self-citationGain Modulation from Background Synaptic Input
Chance, F. S., Abbott, L. F., & Reyes, A. D. (2002) · Neuron · doi:10.1016/s0896-6273(02)00820-6 · Cited by 1,012
Mechanisms of Directed Attention in the Human Extrastriate Cortex as Revealed by Functional MRI
Kästner, S., Weerd, P. D., Desimone, R., & Ungerleider, L. G. (1998) · Science · doi:10.1126/science.282.5386.108 · Cited by 976
Feature-based attention in visual cortex
Maunsell, J. H. R., & Treue, S. (2006) · Trends in Neurosciences · doi:10.1016/j.tins.2006.04.001 · Cited by 960
Self-citationStriate cortex of monkey and cat: contrast response function.
Albrecht, D. G., & Hamilton, D. B. (1982) · Journal of Neurophysiology · doi:10.1152/jn.1982.48.1.217 · Cited by 953
A model of neuronal responses in visual area MT
Simoncelli, E. P., & Heeger, D. J. (1998) · Vision Research · doi:10.1016/s0042-6989(97)00183-1 · Cited by 941
Linearity and Normalization in Simple Cells of the Macaque Primary Visual Cortex
Carandini, M., Heeger, D. J., & Movshon, J. A. (1997) · Journal of Neuroscience · doi:10.1523/jneurosci.17-21-08621.1997 · Cited by 926
Natural signal statistics and sensory gain control
Schwartz, O., & Simoncelli, E. P. (2001) · Nature Neuroscience · doi:10.1038/90526 · Cited by 835
Object-based auditory and visual attention
Shinn‐Cunningham, B. G. (2008) · Trends in Cognitive Sciences · doi:10.1016/j.tics.2008.02.003 · Cited by 761
On the actions that one nerve cell can have on another: distinguishing “drivers” from “modulators”
Sherman, S. M., & Guillery, R. W. (1998) · Proceedings of the National Academy of Sciences · doi:10.1073/pnas.95.12.7121 · Cited by 746 · cited 1×
“Given that normalization is mediated by a pooled inhibitory mechanism, it may depend on inhibitory interneurons [45], which mainly acts as ‘‘modulator’’ [46].”
BackgroundResponses of Neurons in Inferior Temporal Cortex During Memory-Guided Visual Search
Chelazzi, L., Duncan, J., Miller, E. K., & Desimone, R. (1998) · Journal of Neurophysiology · doi:10.1152/jn.1998.80.6.2918 · Cited by 726
Feature-Based Attention Increases the Selectivity of Population Responses in Primate Visual Cortex
Martinez-Trujillo, J. C., & Treue, S. (2004) · Current Biology · doi:10.1016/j.cub.2004.04.028 · Cited by 697
Differential attention-dependent response modulation across cell classes in macaque visual area V4
Mitchell, J. F., Sundberg, K. A., & Reynolds, J. H. (2007) · Neuron · doi:10.1016/j.neuron.2007.06.018 · Cited by 665
Summation and Division by Neurons in Primate Visual Cortex
Carandini, M., & Heeger, D. J. (1994) · Science · doi:10.1126/science.8191289 · Cited by 649 · cited 1×
“simple cells, such as the sigmoidal shape of their contrast response functions (CRFs) and the inhibitory effect of adding a second stimulus to the receptive field at a non-preferred orientation [4–7].”
BackgroundShunting Inhibition Modulates Neuronal Gain during Synaptic Excitation
Mitchell, S. J., & Silver, R. A. (2003) · Neuron · doi:10.1016/s0896-6273(03)00200-9 · Cited by 602
How MT cells analyze the motion of visual patterns
Rust, N. C., Mante, V., Simoncelli, E. P., & Movshon, J. A. (2006) · Nature Neuroscience · doi:10.1038/nn1786 · Cited by 516
The neural basis of biased competition in human visual cortex
Kästner, S., & Ungerleider, L. G. (2001) · Neuropsychologia · doi:10.1016/s0028-3932(01)00116-6 · Cited by 470
Attention activates winner-take-all competition among visual filters
Lee, D. K., Itti, L., Koch, C., & Braun, J. (1999) · Nature Neuroscience · doi:10.1038/7286 · Cited by 465
Neural correlates of attention in primate visual cortex
Treue, S. (2001) · Trends in Neurosciences · doi:10.1016/s0166-2236(00)01814-2 · Cited by 433
Morrone, M. C., Burr, D. C., & Maffei, L. (1982) · Proceedings of the Royal Society B Biological Sciences · doi:10.1098/rspb.1982.0078 · Cited by 421
Effects of Spatial Attention on Contrast Response Functions in Macaque Area V4
Williford, T., & Maunsell, J. H. R. (2006) · Journal of Neurophysiology · doi:10.1152/jn.01207.2005 · Cited by 353
Self-citationResponses of Neurons in Macaque Area V4 During Memory-guided Visual Search
Chelazzi, L., Miller, E. K., Duncan, J., & Desimone, R. (2001) · Cerebral Cortex · doi:10.1093/cercor/11.8.761 · Cited by 321
Orientation tuning curves: empirical description and estimation of parameters
Swindale, N. V. (1998) · Biological Cybernetics · doi:10.1007/s004220050411 · Cited by 287
Computational models of cortical visual processing.
Heeger, D. J., Simoncelli, E. P., & Movshon, J. A. (1996) · Proceedings of the National Academy of Sciences · doi:10.1073/pnas.93.2.623 · Cited by 274
Multiple Object Response Normalization in Monkey Inferotemporal Cortex
Zoccolan, D., Cox, D., & DiCarlo, J. J. (2005) · Journal of Neuroscience · doi:10.1523/jneurosci.2058-05.2005 · Cited by 227
The role of attention in visual processing.
Maunsell, J., & Cook, E. (2002) · Philosophical transactions of the Royal Society of London. Series B, Biological sciences · doi:10.1098/rstb.2002.1107 · Cited by 227
Self-citationGain control of firing rate by shunting inhibition: Roles of synaptic noise and dendritic saturation
Prescott, S. A., & De Koninck, Y. (2003) · Proceedings of the National Academy of Sciences · doi:10.1073/pnas.0337591100 · Cited by 226
Figure-ground mechanisms provide structure for selective attention
Qiu, F. T., Sugihara, T., & von der Heydt, R. (2007) · Nature Neuroscience · doi:10.1038/nn1989 · Cited by 221
Spatial Summation in the Receptive Fields of MT Neurons
Britten, K. H., & Heuer, H. W. (1999) · Journal of Neuroscience · doi:10.1523/jneurosci.19-12-05074.1999 · Cited by 200
Attention Facilitates Multiple Stimulus Features in Parallel in Human Visual Cortex
Andersen, . K., Hillyard, S. A., & Müller, M. M. (2008) · Current Biology · doi:10.1016/j.cub.2008.06.030 · Cited by 164
Attention and visual perception
Boynton, G. M. (2005) · Current Opinion in Neurobiology · doi:10.1016/j.conb.2005.06.009 · Cited by 147
Contrast Dependence of Response Normalization in Area MT of the Rhesus Macaque
Heuer, H. W., & Britten, K. H. (2002) · Journal of Neurophysiology · doi:10.1152/jn.00255.2002 · Cited by 136
Cardin, J. A., Palmer, L. A., & Contreras, D. (2008) · Neuron · doi:10.1016/j.neuron.2008.05.002 · Cited by 90
Ghose, G. M., & Maunsell, J. H. R. (2008) · Journal of Neuroscience · doi:10.1523/jneurosci.0138-08.2008 · Cited by 85
Self-citationRole of Interneuron Diversity in the Cortical Microcircuit for Attention
Buia, C., & Tiesinga, P. H. E. (2008) · Journal of Neurophysiology · doi:10.1152/jn.01004.2007 · Cited by 64
Gaze and smooth pursuit signals interact in parietal area 7m of the behaving monkey
Raffi, M., Squatrito, S., & Maioli, M. G. (2007) · Experimental Brain Research · doi:10.1007/s00221-007-0967-3 · Cited by 15
Cited by
Sorted by citations
Visual attention: The past 25 years
Carrasco, M. (2011) · Vision Research · doi:10.1016/j.visres.2011.04.012 · Cited by 2,660
Top-down influences on visual processing
Gilbert, C. D., & Li, W. (2013) · Nature Reviews Neuroscience · doi:10.1038/nrn3476 · Cited by 1,224
Attention improves performance primarily by reducing interneuronal correlations
Cohen, M. R., & Maunsell, J. H. R. (2009) · Nature Neuroscience · doi:10.1038/nn.2439 · Cited by 1,163
Self-citationSpatial attention decorrelates intrinsic activity fluctuations in macaque area V4
Mitchell, J. F., Sundberg, K. A., & Reynolds, J. H. (2009) · Neuron · doi:10.1016/j.neuron.2009.09.013 · Cited by 710
Divisive Normalization in Olfactory Population Codes
Olsen, S. R., Bhandawat, V., & Wilson, R. I. (2010) · Neuron · doi:10.1016/j.neuron.2010.04.009 · Cited by 500
Metadata
- Authors
- Lee, J., & Maunsell, J. H. R.
- Affiliations
- Baylor College of Medicine (US)
- Howard Hughes Medical Institute (US)
- Corresponding author
- Maunsell, John H. R.
- Venue
- PLoS ONE
- Publisher
- Public Library of Science (PLoS)
- Published
- 2009-02-27
- Volume
- 4
- Issue
- 2
- Pages
- e4651
- ISSN
- 1932-6203 (ISSN-L)
- PMC
- PMC2645695
- OpenAlex
- W2163588736
- Cited by
- 257
- References
- 51
- Citations by year
- 2026: 3 · 2025: 10 · 2024: 6 · 2023: 27 · 2022: 10 · 2021: 14 · 2020: 11 · 2019: 18 · 2018: 13 · 2017: 13 · 2016: 18 · 2015: 18 · 2014: 20 · 2013: 18 · 2012: 17
- FWCI
- 9.09
- Type
- journal article
- Language
- en
- Open access
- gold
- doi.org
- Locations
- PLoS ONE (publishedVersion, cc-by)
- PubMed Central (publishedVersion, cc-by)
- PubMed (publishedVersion)
- Digital Access to Scholarship at Harvard (DASH) (Harvard University) (submittedVersion, cc-by)
- RePEc: Research Papers in Economics (submittedVersion)
- DOAJ (DOAJ: Directory of Open Access Journals) (submittedVersion)
- Funders
- Howard Hughes Medical Institute
- National Institutes of Health
- National Eye Institute (R01EY005911)
- Topics
- Life Sciences › Neuroscience › Cognitive Neuroscience › Visual perception and processing mechanisms
- Physical Sciences › Computer Science › Computer Vision and Pattern Recognition › Visual Attention and Saliency Detection
- Life Sciences › Neuroscience › Cognitive Neuroscience › Neural dynamics and brain function
- Keywords
- attentional modulation, single-unit responses, gain modulation, multiple stimuli, receptive fields, area MT, visual cortex, computational model of attention, neuronal gain
- MeSH terms
- Attention, Cerebral Cortex, Humans, Models, Theoretical
About these checks
Registry, retraction, Cites and statistics results are computed, not judged, with one exception: a printed reference that no index lists is read once by a model before it counts as a citation error. Claims are extracted by a model and kept only when their quote appears verbatim in the text; each cited source is then checked, with a model’s help, for whether it says what the claim relies on. Those verdicts can be wrong — read the claim’s quote and the cited source before relying on one.
Statistics and arithmetic are recomputed, not judged.
Confidence bands are shown only for fields calibrated on our annotated test set. None is calibrated yet, so no band is shown.
What counts as a claim ›How we measure confidence ›How we check this ›
Are you an author, or do you see a problem with this page? Request a review
