

The DOI matches its Crossref record; 5 of the 5 references it cites were found in a registry or an index.
Reduced Mature MicroRNA Levels in Association with Dicer Loss in Human Temporal Lobe Epilepsy with Hippocampal Sclerosis
Overview
The claims and statistics of this paper haven’t been checked yet.
Run the check — free, no account needed. It reads the open-access text and checks the sources it cites.
Integrity signals
Registry
Cites
Statistics
Figures
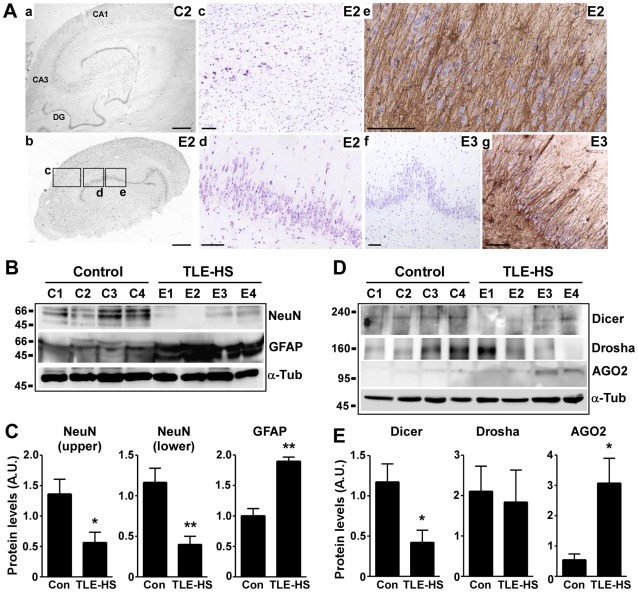
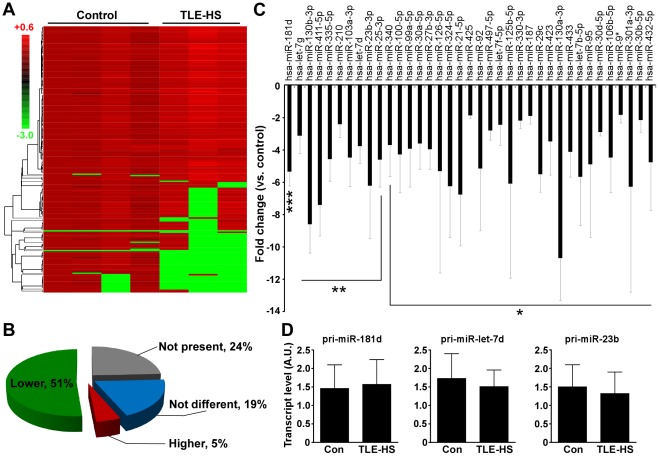
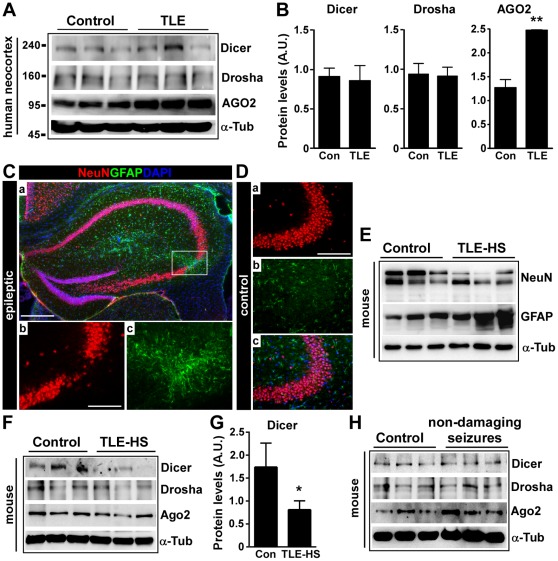
Verification
Claims the paper makes
The claims and statistics of this paper haven’t been checked yet.
Run the check — free, no account needed. It reads the open-access text and checks the sources it cites.
Claims other papers make about this one
Each is checked against this paper’s own text: does it say what the citing paper says it does?
The cited source says what the claim attributes to it.
In the citing paper
“Also, while AGO2 levels have been found to be elevated in human TLE, expression of Ago2 is unchanged in the present model (Mckiernan et al., 2012).”
From Brain cell-specific origin of circulating microRNA biomarkers in experimental temporal lobe epilepsy (2023) · cites this paper as Mckiernan et al., 2012
Self-check
Percentages, sums and reported differences re-computed from the paper’s own numbers.
The self-check needs the paper’s full text.
Citations
Cites
The widespread regulation of microRNA biogenesis, function and decay
Krol, J., Loedige, I., & Filipowicz, W. (2010) · Nature Reviews Genetics · doi:10.1038/nrg2843 · Cited by 4,672
Sempere, L. F., Freemantle, S., Pitha-Rowe, I., Moss, E., Dmitrovsky, E., & Ambros, V. (2004) · Genome Biology · doi:10.1186/gb-2004-5-3-r13 · Cited by 1,578
Packer, A. N., Xing, Y., Harper, S. Q., Jones, L., & Davidson, B. L. (2008) · The Journal of Neuroscience · doi:10.1523/jneurosci.2390-08.2008 · Cited by 679
Alterations of the microRNA network cause neurodegenerative disease
Hébert, S. S., & De Strooper, B. (2009) · Trends in Neurosciences · doi:10.1016/j.tins.2008.12.003 · Cited by 452
MicroRNA regulation of Alzheimer's Amyloid precursor protein expression
Hébert, S. S., Horré, K., Nicolaï, L., Bergmans, B., Papadopoulou, A. S., Delacourte, A., & De Strooper, B. (2009) · Neurobiology of Disease · doi:10.1016/j.nbd.2008.11.009 · Cited by 436
Research works printed but not linked: 49
- DP Bartel, 2004, MicroRNAs: genomics, biogenesis, mechanism, and function., Cell, 116, 281, 10.1016/S0092-8674(04)00045-5 · DOI
- Y Lee, 2003, The nuclear RNase III Drosha initiates microRNA processing., Nature, 425, 415, 10.1038/nature01957 · DOI
- VN Kim, 2009, Biogenesis of small RNAs in animals., Nat Rev Mol Cell Biol, 10, 126, 10.1038/nrm2632 · DOI · Paper page
- M Coolen, 2009, MicroRNAs in brain development and physiology., Curr Opin Neurobiol, 19, 461, 10.1016/j.conb.2009.09.006 · DOI
- A Schaefer, 2007, Cerebellar neurodegeneration in the absence of microRNAs., J Exp Med, 204, 1553, 10.1084/jem.20070823 · DOI · Paper page
- TH Davis, 2008, Conditional loss of Dicer disrupts cellular and tissue morphogenesis in the cortex and hippocampus., J Neurosci, 28, 4322, 10.1523/JNEUROSCI.4815-07.2008 · DOI · Paper page
- W Konopka, 2010, MicroRNA loss enhances learning and memory in mice., J Neurosci, 30, 14835, 10.1523/JNEUROSCI.3030-10.2010 · DOI · Paper page
- J Tao, 2011, Deletion of astroglial dicer causes non-cell-autonomous neuronal dysfunction and degeneration., J Neurosci, 31, 8306, 10.1523/JNEUROSCI.0567-11.2011 · DOI
- J Bilen, 2006, MicroRNA pathways modulate polyglutamine-induced neurodegeneration., Mol Cell, 24, 157, 10.1016/j.molcel.2006.07.030 · DOI
- S Haramati, 2010, miRNA malfunction causes spinal motor neuron disease., Proc Natl Acad Sci USA, 107, 13111, 10.1073/pnas.1006151107 · DOI
- SS Hebert, 2010, Genetic ablation of Dicer in adult forebrain neurons results in abnormal tau hyperphosphorylation and neurodegeneration., Hum Mol Genet, 19, 3959, 10.1093/hmg/ddq311 · DOI
- BS Chang, 2003, Epilepsy., N Engl J Med, 349, 1257, 10.1056/NEJMra022308 · DOI
- M Thom, 2009, Hippocampal sclerosis: progress since Sommer., Brain Pathol, 19, 565, 10.1111/j.1750-3639.2008.00201.x · DOI
- S Bothwell, 2001, Neuronal hypertrophy in the neocortex of patients with temporal lobe epilepsy., J Neurosci, 21, 4789, 10.1523/JNEUROSCI.21-13-04789.2001 · DOI
- S Dawodu, 2005, Quantitative neuropathology of the entorhinal cortex region in patients with hippocampal sclerosis and temporal lobe epilepsy., Epilepsia, 46, 23, 10.1111/j.0013-9580.2005.21804.x · DOI
- A Pitkanen, 2011, Mechanisms of epileptogenesis and potential treatment targets., Lancet Neurol, 10, 173, 10.1016/S1474-4422(10)70310-0 · DOI
- A Vezzani, 2011, The role of inflammation in epilepsy., Nat Rev Neurol, 7, 31, 10.1038/nrneurol.2010.178 · DOI · Paper page
- Y Bozzi, 2011, Cell signaling underlying epileptic behavior., Front Behav Neurosci, 5, 45, 10.3389/fnbeh.2011.00045 · DOI
- EM Jimenez-Mateos, 2011, MicroRNA expression profile after status epilepticus and hippocampal neuroprotection by targeting miR-132., Am J Pathol, 179, 2519, 10.1016/j.ajpath.2011.07.036 · DOI
- G Mouri, 2008, Unilateral hippocampal CA3-predominant damage and short latency epileptogenesis after intra-amygdala microinjection of kainic acid in mice., Brain Res, 1213, 140, 10.1016/j.brainres.2008.03.061 · DOI · Paper page
- EM Jimenez-Mateos, 2010, Epileptic tolerance is associated with enduring neuroprotection and uncoupling of the relationship between CA3 damage, neuropeptide Y rearrangement and spontaneous seizures following intra-amygdala kainic acid-induced status epilepticus in mice., Neuroscience, 171, 556, 10.1016/j.neuroscience.2010.09.003 · DOI
- H Kaneko, 2011, DICER1 deficit induces Alu RNA toxicity in age-related macular degeneration., Nature, 471, 325, 10.1038/nature09830 · DOI · Paper page
- E Aronica, 2010, Expression pattern of miR-146a, an inflammation-associated microRNA, in experimental and human temporal lobe epilepsy., Eur J Neurosci, 31, 1100, 10.1111/j.1460-9568.2010.07122.x · DOI · Paper page
- AS Nudelman, 2010, Neuronal activity rapidly induces transcription of the CREB-regulated microRNA-132, in vivo., Hippocampus, 20, 492
- YJ Song, 2011, Temporal lobe epilepsy induces differential expression of hippocampal miRNAs including let-7e and miR-23a/b., Brain Res, 1387, 134, 10.1016/j.brainres.2011.02.073 · DOI · Paper page
- ST Lee, 2011, Altered microRNA regulation in Huntington’s disease models., Exp Neurol, 227, 172, 10.1016/j.expneurol.2010.10.012 · DOI · Paper page
- G Lugli, 2005, Dicer and eIF2c are enriched at postsynaptic densities in adult mouse brain and are modified by neuronal activity in a calpain-dependent manner., J Neurochem, 94, 896, 10.1111/j.1471-4159.2005.03224.x · DOI · Paper page
- MM Ghodgaonkar, 2009, Abrogation of DNA vector-based RNAi during apoptosis in mammalian cells due to caspase-mediated cleavage and inactivation of Dicer-1., Cell Death Differ, 16, 858, 10.1038/cdd.2009.15 · DOI
- A Nakagawa, 2010, Caspase-dependent conversion of Dicer ribonuclease into a death-promoting deoxyribonuclease., Science, 328, 327, 10.1126/science.1182374 · DOI
- DC Henshall, 2000, Alterations in bcl-2 and caspase gene family protein expression in human temporal lobe epilepsy., Neurology, 55, 250, 10.1212/WNL.55.2.250 · DOI
- DC Henshall, 2004, Death-associated protein kinase expression in human temporal lobe epilepsy., Ann Neurol, 55, 485, 10.1002/ana.20001 · DOI
- S Cheloufi, 2010, A dicer-independent miRNA biogenesis pathway that requires Ago catalysis., Nature, 465, 584, 10.1038/nature09092 · DOI · Paper page
- D Cifuentes, 2010, A novel miRNA processing pathway independent of Dicer requires Argonaute2 catalytic activity., Science, 328, 1694, 10.1126/science.1190809 · DOI
- NY Shao, 2010, Comprehensive survey of human brain microRNA by deep sequencing., BMC Genomics, 11, 409, 10.1186/1471-2164-11-409 · DOI · Paper page
- E Mor, 2011, Species-specific microRNA roles elucidated following astrocyte activation., Nucleic Acids Res, 39, 3710, 10.1093/nar/gkq1325 · DOI
- TP Chendrimada, 2005, TRBP recruits the Dicer complex to Ago2 for microRNA processing and gene silencing., Nature, 436, 740, 10.1038/nature03868 · DOI
- D Shin, 2009, Dicer ablation in oligodendrocytes provokes neuronal impairment in mice., Ann Neurol, 66, 843, 10.1002/ana.21927 · DOI
- RI Gregory, 2004, The Microprocessor complex mediates the genesis of microRNAs., Nature, 432, 235, 10.1038/nature03120 · DOI
- KL Stark, 2008, Altered brain microRNA biogenesis contributes to phenotypic deficits in a 22q11-deletion mouse model., Nat Genet, 40, 751, 10.1038/ng.138 · DOI · Paper page
- E Koscianska, 2011, The role of Dicer protein partners in the processing of microRNA precursors., PLoS One, 6, e28548, 10.1371/journal.pone.0028548 · DOI
- R Fiore, 2009, Mef2-mediated transcription of the miR379–410 cluster regulates activity-dependent dendritogenesis by fine-tuning Pumilio2 protein levels., EMBO J, 28, 697, 10.1038/emboj.2009.10 · DOI · Paper page
- J Wetherington, 2008, Astrocytes in the epileptic brain., Neuron, 58, 168, 10.1016/j.neuron.2008.04.002 · DOI
- A Yamamoto, 2006, Endoplasmic reticulum stress and apoptosis signaling in human temporal lobe epilepsy., J Neuropathol Exp Neurol, 65, 217, 10.1097/01.jnen.0000202886.22082.2a · DOI
- TZ Baram, 2011, Does acquired epileptogenesis in the immature brain require neuronal death., Epilepsy Curr, 11, 21, 10.5698/1535-7511-11.1.21 · DOI
- RD Morin, 2008, Application of massively parallel sequencing to microRNA profiling and discovery in human embryonic stem cells., Genome Res, 18, 610, 10.1101/gr.7179508 · DOI · Paper page
- JE Babiarz, 2011, A role for noncanonical microRNAs in the mammalian brain revealed by phenotypic differences in Dgcr8 versus Dicer1 knockouts and small RNA sequencing., RNA, 17, 1489, 10.1261/rna.2442211 · DOI
- I Bray, 2009, Widespread dysregulation of MiRNAs by MYCN amplification and chromosomal imbalances in neuroblastoma: association of miRNA expression with survival., PLoS One, 4, e7850, 10.1371/journal.pone.0007850 · DOI
- SS Hebert, 2008, Loss of microRNA cluster miR-29a/b-1 in sporadic Alzheimer’s disease correlates with increased BACE1/beta-secretase expression., Proc Natl Acad Sci USA, 105, 6415, 10.1073/pnas.0710263105 · DOI · Paper page
- DM Garcia, 2011, Weak seed-pairing stability and high target-site abundance decrease the proficiency of lsy-6 and other microRNAs., Nat Struct Mol Biol, 18, 1139, 10.1038/nsmb.2115 · DOI
Cited by
Sorted by citations
MicroRNAs and neurodegeneration: role and impact
Abe, M., & Bonini, N. M. (2013) · Trends in Cell Biology · doi:10.1016/j.tcb.2012.08.013 · Cited by 190
Brain cell-specific origin of circulating microRNA biomarkers in experimental temporal lobe epilepsy
Brindley, E., Heiland, M., Mooney, C., Diviney, M., Mamad, O., Hill, T. D. M., Yan, Y., Venø, M. T., Reschke, C. R., Batool, A., et al. (2023) · Frontiers in Molecular Neuroscience · doi:10.3389/fnmol.2023.1230942 · Cited by 21
Self-citationMurphy, R., Villegas-Salmerón, J., Sanz-Rodriguez, A., Engel, T., Mooney, C., Henshall, D. C., & Jimenez-Mateos, E. M. (2025) · PLOS One · doi:10.1371/journal.pone.0326401 · Cited by 3
Self-citation
Metadata
- Authors
- McKiernan, R. C., Jimenez-Mateos, E. M., Bray, I., Engel, T., Brennan, G. P., Sano, T., Michalak, Z., Moran, C., Delanty, N., Farrell, M., O’Brien, D., Meller, R., Simon, R. P., Stallings, R. L., & Henshall, D. C.
- Venue
- PLoS ONE
- Publisher
- Public Library of Science (PLoS)
- Published
- 2012-05-15
- Volume
- 7
- Issue
- 5
- Pages
- e35921
- ISSN
- 1932-6203
- PMC
- PMC3352899
- Cited by
- 115
- References
- 5
- Language
- en
About these checks
Registry, retraction, Cites and statistics results are computed, not judged, with one exception: a printed reference that no index lists is read once by a model before it counts as a citation error. Claims are extracted by a model and kept only when their quote appears verbatim in the text; each cited source is then checked, with a model’s help, for whether it says what the claim relies on. Those verdicts can be wrong — read the claim’s quote and the cited source before relying on one.
Statistics and arithmetic are recomputed, not judged.
Confidence bands are shown only for fields calibrated on our annotated test set. None is calibrated yet, so no band is shown.
What counts as a claim ›How we measure confidence ›How we check this ›
Are you an author, or do you see a problem with this page? Request a review
