

The DOI matches its Crossref record; 17 of the 17 references it cites were found in a registry or an index.
Parkinson's Disease-Linked LRRK2-G2019S Mutation Alters Synaptic Plasticity and Promotes Resilience to Chronic Social Stress in Young Adulthood
Abstract
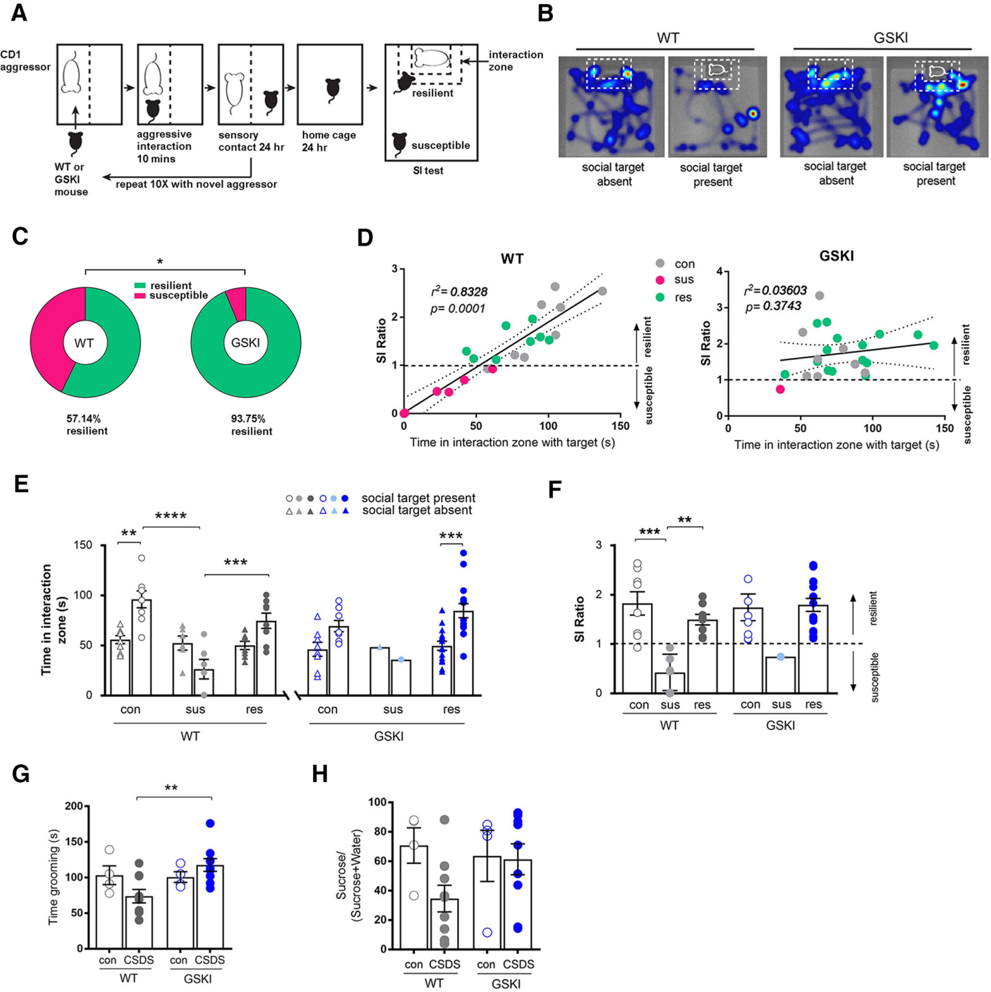
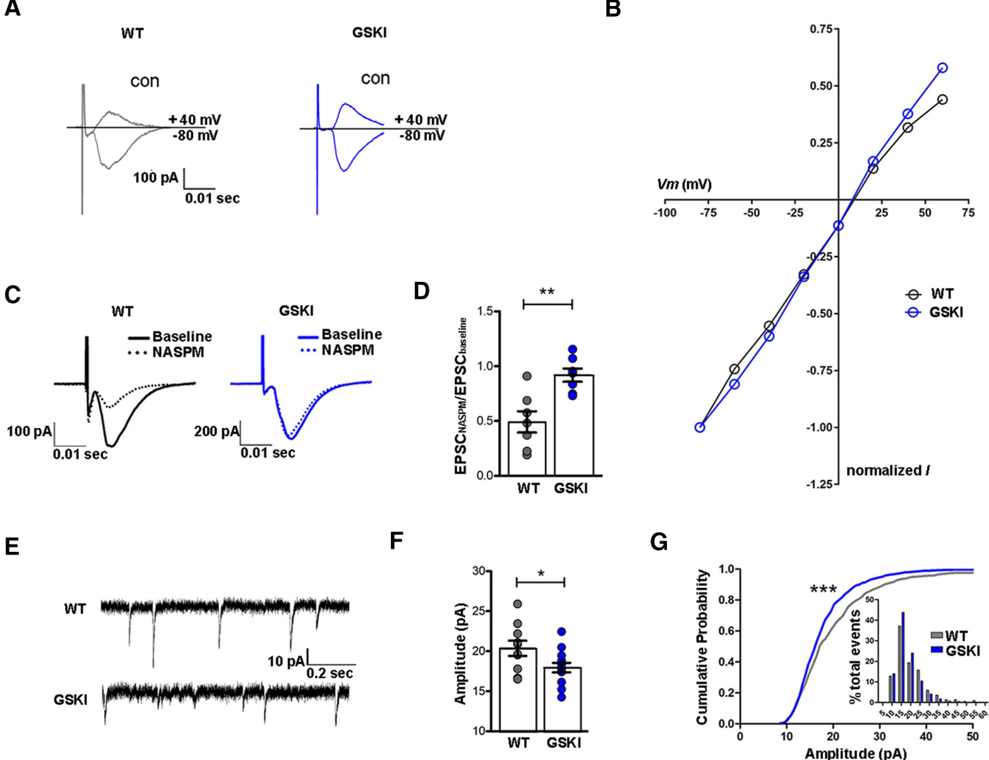
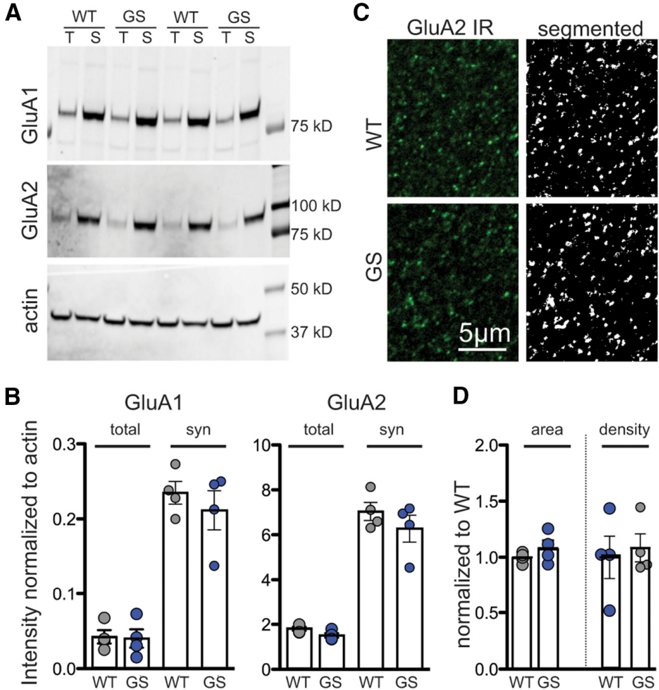
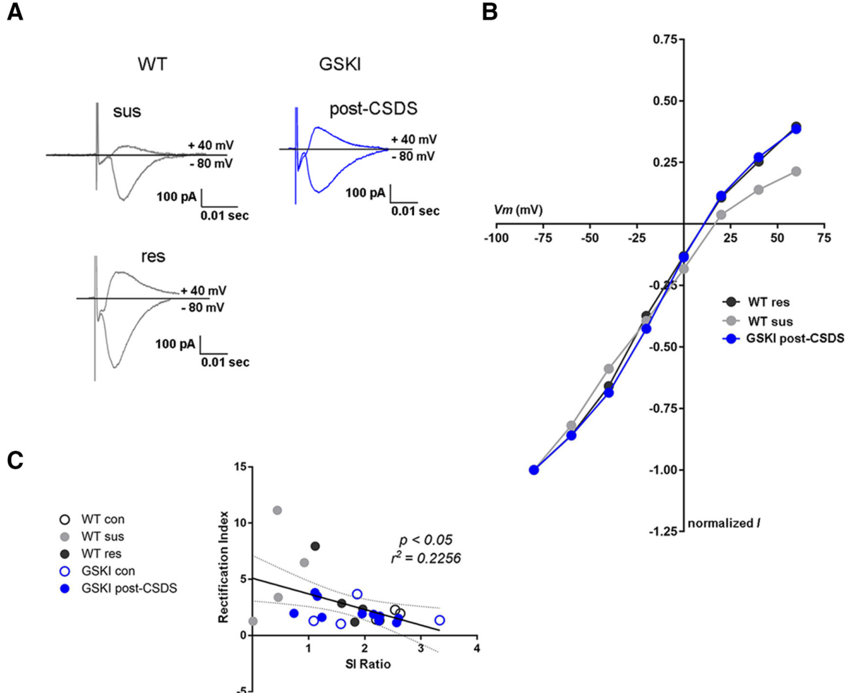
The G2019S mutation in leucine-rich repeat kinase 2 (LRRK2) is a prevalent cause of late-onset Parkinson's disease, producing psychiatric and motor symptoms, including depression, that are indistinguishable from sporadic cases. Here we tested how this mutation impacts depression-related behaviors and associated synaptic responses and plasticity in mice expressing a Lrrk2-G2019S knock-in mutation. Young adult male G2019S knock-in and wild-type mice were subjected to chronic social defeat stress (CSDS), a validated depression model, and other tests of anhedonia, anxiety, and motor learning. We found that G2019S mice were highly resilient to CSDS, failing to exhibit social avoidance compared to wild-type mice, many of which exhibited prominent social avoidance and were thus susceptible to CSDS. In the absence of CSDS, no behavioral differences between genotypes were found. Whole-cell recordings of spiny projection neurons (SPNs) in the nucleus accumbens revealed that glutamatergic synapses in G2019S mice lacked functional calcium-permeable AMPARs, and following CSDS, failed to accumulate inwardly rectifying AMPAR responses characteristic of susceptible mice. Based on this abnormal AMPAR response profile, we asked whether long-term potentiation (LTP) of corticostriatal synaptic strength was affected. We found that both D 1 receptor (D 1 R)- and D 2 R-SPNs in G2019S mutants were unable to express LTP, with D 2 R-SPNs abnormally expressing long-term depression following an LTP-induction protocol. Thus, G2019S promotes resilience to chronic social stress in young adulthood, likely reflecting synapses constrained in their ability to undergo experience-dependent plasticity. These unexpected findings may indicate early adaptive coping mechanisms imparted by the G2019S mutation. SIGNIFICANCE STATEMENT The G2019S mutation in LRRK2 causes late-onset Parkinson's disease (PD).LRRK2 is highly expressed in striatal neurons throughout life, but it is unclear how mutant LRRK2 affects striatal neuron function and behaviors in young adulthood. We addressed this question using Lrrk2-G2019S knock-in mice. The data show that young adult G2019S mice were unusually resilient to a depression-like syndrome resulting from chronic social stress. Further, mutant striatal synapses were incapable of forms of synaptic plasticity normally accompanying depression-like behavior and important for supporting the full range of cognitive function. These data suggest that in humans,LRRK2 mutation may affect striatal circuit function in ways that alter normal responses to stress and could be relevant for treatment strategies for non-motor PD symptoms.
Overview
The claims and statistics of this paper haven’t been checked yet.
Run the check — free, no account needed. It reads the open-access text and checks the sources it cites.
Integrity signals
Registry
Cites
Statistics
Figures
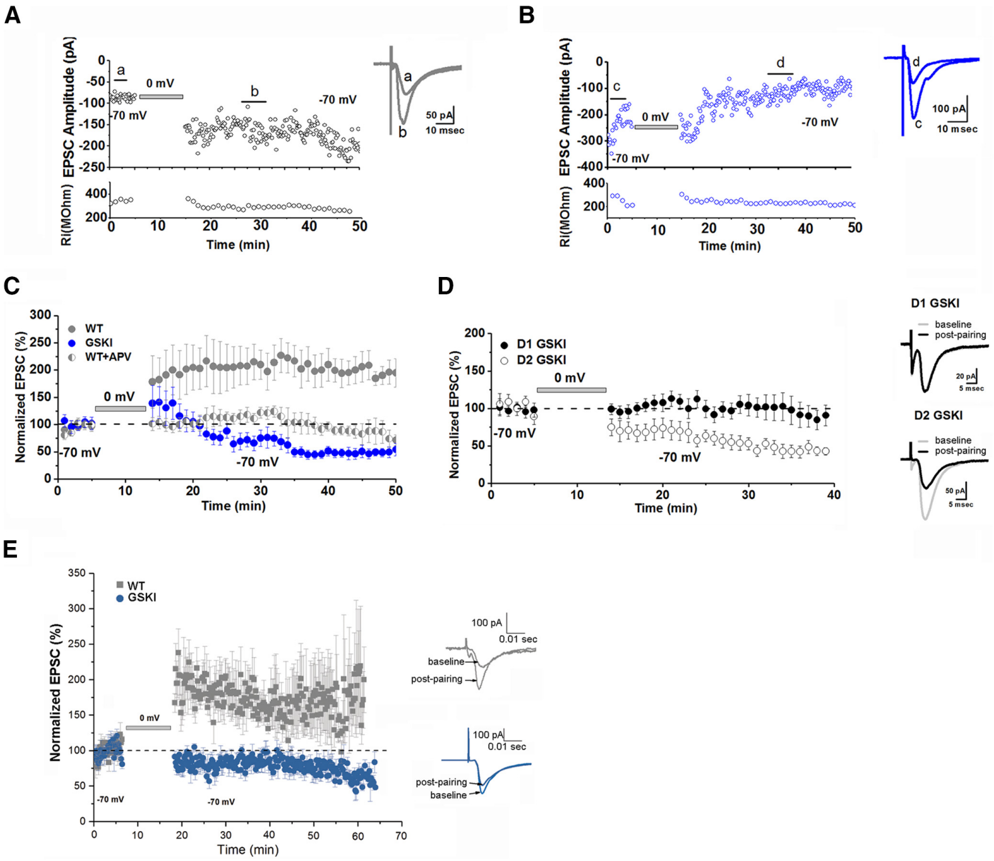
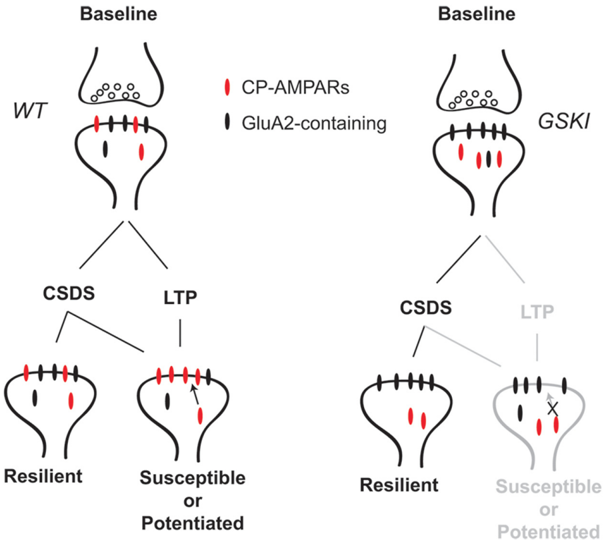
Verification
Claims the paper makes
The claims and statistics of this paper haven’t been checked yet.
Run the check — free, no account needed. It reads the open-access text and checks the sources it cites.
Claims other papers make about this one
Each is checked against this paper’s own text: does it say what the citing paper says it does?
The check wasn’t confident either way, so it gives no verdict — never disputed.
In the citing paper
“LRRK2 localizes to and plays a role in synaptic vesicle trafficking [2, 10, 13, 49].”
From Cellular and subcellular localization of Rab10 and phospho-T73 Rab10 in the mouse and human brain (2023) · cites this paper as [49]
Experimental — accuracy not yet measured
Self-check
Percentages, sums and reported differences re-computed from the paper’s own numbers.
The self-check needs the paper’s full text.
Citations
Cites
Essential role of BDNF in the mesolimbic dopamine pathway in social defeat stress
Berton, O., McClung, C. A., DiLeone, R. J., Krishnan, V., Renthal, W., Russo, S. J., Graham, D., Tsankova, N. M., Bolanos, C. A., Rios, M., et al. (2006) · Science · doi:10.1126/science.1120972 · Cited by 2,129
Self-citationSustained hippocampal chromatin regulation in a mouse model of depression and antidepressant action
Tsankova, N. M., Berton, O., Renthal, W., Kumar, A., Neve, R. L., & Nestler, E. J. (2006) · Nature Neuroscience · doi:10.1038/nn1659 · Cited by 1,780
A standardized protocol for repeated social defeat stress in mice
Golden, S. A., Covington, H. E., Berton, O., & Russo, S. J. (2011) · Nature Protocols · doi:10.1038/nprot.2011.361 · Cited by 1,581
Self-citationRusso, S. J., Murrough, J. W., Han, M.-H., Charney, D. S., & Nestler, E. J. (2012) · Nature Neuroscience · doi:10.1038/nn.3234 · Cited by 1,206
Self-citationSocial stress induces neurovascular pathology promoting depression
Menard, C., Pfau, M. L., Hodes, G. E., Kana, V., Wang, V. X., Bouchard, S., Takahashi, A., Flanigan, M. E., Aleyasin, H., LeClair, K. B., et al. (2017) · Nature Neuroscience · doi:10.1038/s41593-017-0010-3 · Cited by 1,028
Self-citationEndocannabinoid-mediated rescue of striatal LTD and motor deficits in Parkinson's disease models
Kreitzer, A. C., & Malenka, R. C. (2007) · Nature · doi:10.1038/nature05506 · Cited by 735
Ventral hippocampal afferents to the nucleus accumbens regulate susceptibility to depression
Bagot, R. C., Parise, E. M., Peña, C. J., Zhang, H.-X., Maze, I., Chaudhury, D., Persaud, B., Cachope, R., Bolaños-Guzmán, C. A., Cheer, J. F., et al. (2015) · Nature Communications · doi:10.1038/ncomms8062 · Cited by 491
Neurotransmitter roles in synaptic modulation, plasticity and learning in the dorsal striatum
Lovinger, D. M. (2010) · Neuropharmacology · doi:10.1016/j.neuropharm.2010.01.008 · Cited by 488 · cited 1×
“Our observation in the mutants that LTD resulted when LTP failed is consistent with the idea that postsynaptic LTP and presynaptic LTD could be elicited at SPN synapses contemporaneously, with LTP dominating unless blocked (Lovinger, 2010; Augustin et al., 2014; Ma et al., 2018).”
ResultRamonet, D., Daher, J. P. L., Lin, B. M., Stafa, K., Kim, J., Banerjee, R., Westerlund, M., Pletnikova, O., Glauser, L., Yang, L., et al. (2011) · PLoS ONE · doi:10.1371/journal.pone.0018568 · Cited by 405
Francis, T. C., Chandra, R., Friend, D. M., Finkel, E., Dayrit, G., Miranda, J., Brooks, J. M., Iñiguez, S. D., O’Donnell, P., Kravitz, A., et al. (2015) · Biological Psychiatry · doi:10.1016/j.biopsych.2014.07.021 · Cited by 379
Anhedonia requires MC4R-mediated synaptic adaptations in nucleus accumbens
Lim, B. K., Huang, K. W., Grueter, B. A., Rothwell, P. E., & Malenka, R. C. (2012) · Nature · doi:10.1038/nature11160 · Cited by 368
Structural and synaptic plasticity in stress-related disorders
Christoffel, D. J., Golden, S. A., & Russo, S. J. (2011) · Reviews in the Neurosciences · doi:10.1515/rns.2011.044 · Cited by 334
Self-citationIκB Kinase Regulates Social Defeat Stress-Induced Synaptic and Behavioral Plasticity
Christoffel, D. J., Golden, S. A., Dumitriu, D., Robison, A. J., Janssen, W. G., Ahn, H. F., Krishnan, V., Reyes, C. M., Han, M.-H., Ables, J. L., et al. (2011) · The Journal of Neuroscience · doi:10.1523/jneurosci.4763-10.2011 · Cited by 267
Self-citationExcitatory transmission at thalamo-striatal synapses mediates susceptibility to social stress
Christoffel, D. J., Golden, S. A., Walsh, J. J., Guise, K. G., Heshmati, M., Friedman, A. K., Dey, A., Smith, M., Rebusi, N., Pfau, M., et al. (2015) · Nature Neuroscience · doi:10.1038/nn.4034 · Cited by 101
Self-citationBosch-Bouju, C., Larrieu, T., Linders, L., Manzoni, O. J., & Layé, S. (2016) · Cell Reports · doi:10.1016/j.celrep.2016.06.082 · Cited by 100
Specific functional connectivity alterations of the dorsal striatum in young people with depression
Kerestes, R., Harrison, B. J., Dandash, O., Stephanou, K., Whittle, S., Pujol, J., & Davey, C. G. (2015) · NeuroImage: Clinical · doi:10.1016/j.nicl.2014.12.017 · Cited by 75
Research works printed but not linked: 68
- 10.1523/JNEUROSCI.3906-13.2014 · DOI
- 10.1155/2016/9869712 · DOI
- 10.1186/s13024-015-0066-z · DOI · Paper page
- 10.1016/0896-6273(95)90049-7 · DOI
- 10.1016/j.neuron.2012.09.040 · DOI · Paper page
- 10.1523/JNEUROSCI.4258-07.2007 · DOI · Paper page
- 10.1016/j.tins.2005.06.005 · DOI
- 10.1038/s41598-017-09106-3 · DOI
- 10.1016/S0896-6273(00)00008-8 · DOI
- 10.1113/jphysiol.2007.144501 · DOI
- 10.1016/j.biopsych.2016.09.007 · DOI · Paper page
- 10.1186/2045-5380-1-11 · DOI · Paper page
- 10.1016/j.jaac.2013.04.003 · DOI · Paper page
- 10.1371/journal.pone.0108982 · DOI
- 10.1074/jbc.M404982200 · DOI
- 10.1371/journal.pone.0063778 · DOI
- 10.1523/JNEUROSCI.2454-13.2013 · DOI
- 10.1016/j.cell.2007.09.012 · DOI
- 10.1042/BST20160396 · DOI
- 10.1212/WNL.0000000000001684 · DOI
- 10.1007/s13311-017-0527-x · DOI
- 10.1002/mds.22242 · DOI
- 10.1016/j.parkreldis.2009.08.007 · DOI · Paper page
- 10.1016/S1474-4422(08)70117-0 · DOI · Paper page
- 10.1111/j.1471-4159.2006.04246.x · DOI
- 10.1523/JNEUROSCI.1392-15.2015 · DOI · Paper page
- 10.1126/science.1653450 · DOI
- 10.1016/j.neuron.2007.06.001 · DOI · Paper page
- 10.1111/j.1600-0404.2006.00579.x · DOI
- 10.1042/BJ20070209 · DOI · Paper page
- 10.1113/jphysiol.1995.sp020812 · DOI
- 10.1016/j.biopsych.2015.05.022 · DOI · Paper page
- 10.1016/j.neuron.2008.11.005 · DOI
- 10.1176/appi.ajp.2008.08071076 · DOI
- 10.1016/0091-3057(91)90284-9 · DOI · Paper page
- 10.1016/j.expneurol.2010.05.004 · DOI
- 10.1016/j.neuron.2011.11.015 · DOI
- 10.1523/JNEUROSCI.4051-15.2017 · DOI
- 10.1038/35013064 · DOI
- 10.1016/j.nbd.2014.07.013 · DOI
- 10.1038/s41593-018-0081-9 · DOI
- 10.1016/j.neuron.2014.08.023 · DOI · Paper page
- 10.1016/j.neuron.2018.03.038 · DOI
- 10.1016/j.tins.2006.03.006 · DOI
- 10.1523/JNEUROSCI.3314-15.2016 · DOI · Paper page
- 10.1002/hipo.22282 · DOI
- 10.1016/S0896-6273(00)80517-6 · DOI
- 10.3233/JPD-130192 · DOI
- 10.1523/JNEUROSCI.0964-17.2017 · DOI · Paper page
- 10.1038/nn.3636 · DOI
- 10.1002/mds.26077 · DOI · Paper page
- 10.1016/j.brainres.2010.10.016 · DOI
- 10.1126/science.1160575 · DOI · Paper page
- 10.1016/j.neuron.2015.10.039 · DOI
- 10.1523/JNEUROSCI.2712-13.2014 · DOI
- 10.1016/S0031-9384(02)00939-3 · DOI
- 10.7554/eLife.12813 · DOI · Paper page
- 10.1111/j.1471-4159.2006.03919.x · DOI
- 10.1159/000017308 · DOI
- 10.1038/nature11466 · DOI · Paper page
- 10.1016/j.celrep.2015.10.009 · DOI
- 10.1126/science.1710829 · DOI
- 10.1038/nn.2551 · DOI · Paper page
- 10.1016/j.parkreldis.2015.07.025 · DOI
- 10.7554/eLife.28377 · DOI · Paper page
- 10.1073/pnas.0507360102 · DOI · Paper page
- 10.1073/pnas.1712648115 · DOI
- 10.1016/j.nbd.2015.02.031 · DOI · Paper page
Cited by
Sorted by citations
The molecular and cellular mechanisms of depression: a focus on reward circuitry
Fox, M. E., & Lobo, M. K. (2019) · Molecular Psychiatry · doi:10.1038/s41380-019-0415-3 · Cited by 232
Cellular and subcellular localization of Rab10 and phospho-T73 Rab10 in the mouse and human brain
Singh, V., Menard, M. A., Serrano, G. E., Beach, T. G., Zhao, H. T., Riley-DiPaolo, A., Subrahmanian, N., LaVoie, M. J., & Volpicelli-Daley, L. A. (2023) · Acta Neuropathologica Communications · doi:10.1186/s40478-023-01704-9 · Cited by 9
Metadata
- Authors
- Matikainen-Ankney, B. A., Kezunovic, N., Menard, C., Flanigan, M. E., Zhong, Y., Russo, S. J., Benson, D. L., & Huntley, G. W.
- Venue
- The Journal of Neuroscience
- Publisher
- Society for Neuroscience
- Published
- 2018-09-24
- Volume
- 38
- Issue
- 45
- Pages
- 9700-9711
- ISSN
- 0270-6474
- 1529-2401
- Cited by
- 69
- References
- 17
- Language
- en
About these checks
Registry, retraction, Cites and statistics results are computed, not judged, with one exception: a printed reference that no index lists is read once by a model before it counts as a citation error. Claims are extracted by a model and kept only when their quote appears verbatim in the text; each cited source is then checked, with a model’s help, for whether it says what the claim relies on. Those verdicts can be wrong — read the claim’s quote and the cited source before relying on one.
Statistics and arithmetic are recomputed, not judged.
Confidence bands are shown only for fields calibrated on our annotated test set. None is calibrated yet, so no band is shown.
What counts as a claim ›How we measure confidence ›How we check this ›
Are you an author, or do you see a problem with this page? Request a review
