

The DOI matches its Crossref record; 46 of the 46 references it cites were found in a registry or an index.
Reduced Adipose Tissue Oxygenation in Human Obesity
Open accessAbstract
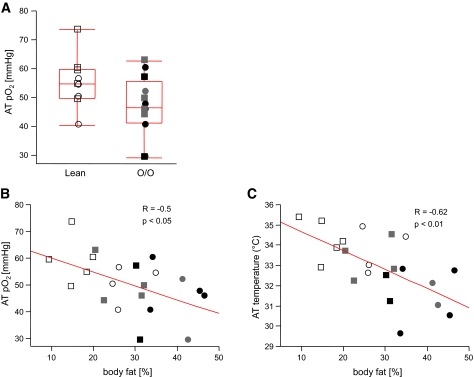
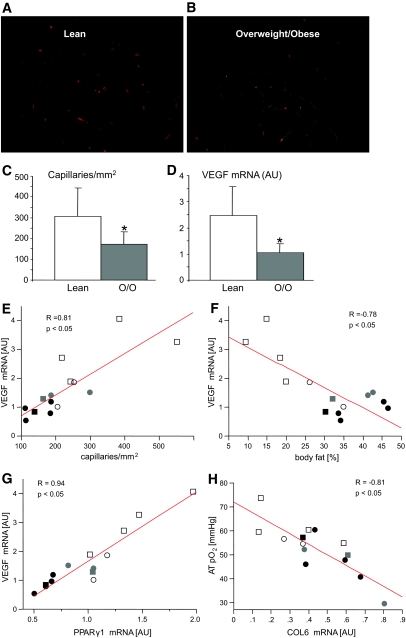
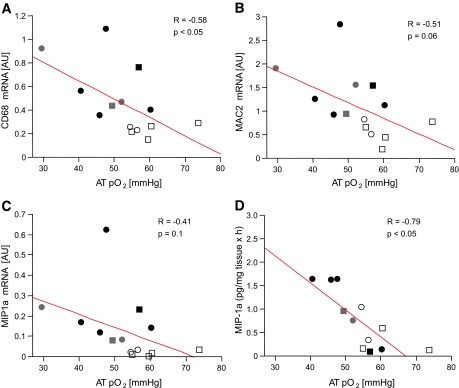
OBJECTIVE— Based on rodent studies, we examined the hypothesis that increased adipose tissue (AT) mass in obesity without an adequate support of vascularization might lead to hypoxia, macrophage infiltration, and inflammation. RESEARCH DESIGN AND METHODS— Oxygen partial pressure (AT pO2) and AT temperature in abdominal AT (9 lean and 12 overweight/obese men and women) was measured by direct insertion of a polarographic Clark electrode. Body composition was measured by dual-energy X-ray absorptiometry, and insulin sensitivity was measured by hyperinsulinemic-euglycemic clamp. Abdominal subcutaneous tissue was used for staining, quantitative RT-PCR, and chemokine secretion assay. RESULTS— AT pO2 was lower in overweight/obese subjects than lean subjects (47 ± 10.6 vs. 55 ± 9.1 mmHg); however, this level of pO2 did not activate the classic hypoxia targets (pyruvate dehydrogenase kinase and vascular endothelial growth factor [VEGF]). AT pO2 was negatively correlated with percent body fat (R = −0.50, P < 0.05). Compared with lean subjects, overweight/obese subjects had 44% lower capillary density and 58% lower VEGF, suggesting AT rarefaction (capillary drop out). This might be due to lower peroxisome proliferator–activated receptor γ1 and higher collagen VI mRNA expression, which correlated with AT pO2 (P < 0.05). Of clinical importance, AT pO2 negatively correlated with CD68 mRNA and macrophage inflammatory protein 1α secretion (R = −0.58, R = −0.79, P < 0.05), suggesting that lower AT pO2 could drive AT inflammation in obesity. CONCLUSIONS— Adipose tissue rarefaction might lie upstream of both low AT pO2 and inflammation in obesity. These results suggest novel approaches to treat the dysfunctional AT found in obesity.
Overview
The claims and statistics of this paper haven’t been checked yet.
Run the check — free, no account needed. It reads the open-access text and checks the sources it cites.
Integrity signals
Registry
Cites
Statistics
Figures
Verification
Claims the paper makes
The claims and statistics of this paper haven’t been checked yet.
Run the check — free, no account needed. It reads the open-access text and checks the sources it cites.
Claims other papers make about this one
Each is checked against this paper’s own text: does it say what the citing paper says it does?
The source backs part of the claim, not all of it — or backs it for a different population, condition or comparison.
In the citing paper
“Long-term HFF results in abnormal regulation of VEGF-A expression; not only do the VEGF-A levels decrease in the AT of obese mice and humans (13), but there is also evidence that the presence of VEGF in obese mice can block the regulation of neovascularization and vessel normalization (83).”
From The ominous triad of adipose tissue dysfunction: inflammation, fibrosis, and impaired angiogenesis. (2017) · cites this paper as [13]
Experimental — accuracy not yet measuredThe cited source says what the claim attributes to it.
In the citing paper
“We observed a marked decrease in the proportion of capillary endothelial cells in eWAT specifically during HFD feeding, consistent with the previously documented capillary rarefaction and elevated hypoxia associated with adipose tissue expansion (Rosen and Spiegelman, 2014; Pasarica et al., 2009).”
From Robust single-nucleus RNA sequencing reveals depot-specific cell population dynamics in adipose tissue remodeling during obesity (2025) · cites this paper as Pasarica et al., 2009
In the citing paper
“For example, VEGF is upregulated in AT of mice fed a HFD for three days, but there are reports of both enhanced and reduced VEGF expression in chronic obesity (3,13,43,44), suggesting that sprouting angiogenesis is activated early and may or may not persist.”
From The ominous triad of adipose tissue dysfunction: inflammation, fibrosis, and impaired angiogenesis. (2017) · cites this paper as [13]
In the citing paper
“Immune cells, particularly monocytes, migrate to areas of hypoxia, where they differentiate into proinflammatory macrophages (13,14).”
From The ominous triad of adipose tissue dysfunction: inflammation, fibrosis, and impaired angiogenesis. (2017) · cites this paper as [13]
In the citing paper
“Similar to findings in mice, human studies have reported that VEGF expression is reduced in obese humans (13).”
From The ominous triad of adipose tissue dysfunction: inflammation, fibrosis, and impaired angiogenesis. (2017) · cites this paper as [13]
Self-check
Percentages, sums and reported differences re-computed from the paper’s own numbers.
The self-check needs the paper’s full text.
Citations
Cites
Obesity is associated with macrophage accumulation in adipose tissue
Weisberg, S. P., McCann, D., Desai, M., Rosenbaum, M., Leibel, R. L., & Ferrante, A. W. (2003) · Journal of Clinical Investigation · doi:10.1172/jci200319246 · Cited by 10,041
Glucose clamp technique: a method for quantifying insulin secretion and resistance.
DeFronzo, R. A., Tobin, J. D., & Andres, R. (1979) · American Journal of Physiology-Endocrinology and Metabolism · doi:10.1152/ajpendo.1979.237.3.e214 · Cited by 7,425
Xu, H., Barnes, G. T., Yang, Q., Tan, G., Yang, D., Chou, C. J., Sole, J., Nichols, A., Ross, J. S., Tartaglia, L. A., et al. (2003) · Journal of Clinical Investigation · doi:10.1172/jci200319451 · Cited by 6,760
Inflammation and insulin resistance
Shoelson, S. E. (2006) · Journal of Clinical Investigation · doi:10.1172/jci29069 · Cited by 4,769
Bustin, S. A. (2000) · Journal of Molecular Endocrinology · doi:10.1677/jme.0.0250169 · Cited by 3,844
Adipokines: inflammation and the pleiotropic role of white adipose tissue
Trayhurn, P., & Wood, I. S. (2004) · British Journal of Nutrition · doi:10.1079/bjn20041213 · Cited by 2,210
Oxygen sensing by HIF hydroxylases
Schofield, C. J., & Ratcliffe, P. J. (2004) · Nature Reviews Molecular Cell Biology · doi:10.1038/nrm1366 · Cited by 2,068
Adipose Tissue Hypoxia in Obesity and Its Impact on Adipocytokine Dysregulation
Hosogai, N., Fukuhara, A., Oshima, K., Miyata, Y., Tanaka, S., Segawa, K., Furukawa, S., Tochino, Y., Komuro, R., Matsuda, M., et al. (2007) · Diabetes · doi:10.2337/db06-0911 · Cited by 1,257 · cited 3×
“PDK1 are upregulated in adipocytes cultured in 1% oxygen (a hypoxic environment) (6,9,11).”
BackgroundMurdoch, C., Giannoudis, A., & Lewis, C. E. (2004) · Blood · doi:10.1182/blood-2004-03-1109 · Cited by 943
Adipose tissue mass can be regulated through the vasculature
Rupnick, M. A., Panigrahy, D., Zhang, C.-Y., Dallabrida, S. M., Lowell, B. B., Langer, R., & Folkman, M. J. (2002) · Proceedings of the National Academy of Sciences · doi:10.1073/pnas.162349799 · Cited by 845
Research works printed but not linked: 1
- Smith SR, Ravussin E: Role of Adipocyte in Metabolism and Endocrine Function. DeGroot, Jameson, Endocrinology, Philadelphia, Elsevier Saunders, 2006
Cited by
Sorted by citations
The metabolic phenotype in obesity: Fat mass, body fat distribution, and adipose tissue function
Goossens, G. H. (2017) · Obesity Facts · doi:10.1159/000471488 · Cited by 8,481
Adipokines in inflammation and metabolic disease
Ouchi, N., Parker, J. L., Lugus, J. J., & Walsh, K. (2011) · Nature Reviews Immunology · doi:10.1038/nri2921 · Cited by 4,625
Type 2 diabetes as an inflammatory disease
Donath, M. Y., & Shoelson, S. E. (2011) · Nature Reviews Immunology · doi:10.1038/nri2925 · Cited by 3,737
Inflammation in obesity, diabetes, and related disorders
Rohm, T. V., Meier, D. T., Olefsky, J. M., & Donath, M. Y. (2022) · Immunity · doi:10.1016/j.immuni.2021.12.013 · Cited by 2,066
Adipose tissue inflammation and metabolic dysfunction in obesity
Kawai, T., Autieri, M. V., & Scalia, R. (2021) · American Journal of Physiology-Cell Physiology · doi:10.1152/ajpcell.00379.2020 · Cited by 1,947
Adipose tissue dysfunction as determinant of obesity-associated metabolic complications
Longo, M., Zatterale, F., Naderi, J., Parrillo, L., Formisano, P., Raciti, G. A., Beguinot, F., & Miele, C. (2019) · International Journal of Molecular Sciences · doi:10.3390/ijms20092358 · Cited by 1,575
Oxygen in Stem Cell Biology: A Critical Component of the Stem Cell Niche
Mohyeldin, A., Garzón-Muvdi, T., & Quiñones‐Hinojosa, A. (2010) · Cell stem cell · doi:10.1016/j.stem.2010.07.007 · Cited by 1,601
Chronic Inflammation in Obesity and the Metabolic Syndrome
Monteiro, R., & Azevedo, I. (2010) · Mediators of Inflammation · doi:10.1155/2010/289645 · Cited by 1,186
Overview of Epidemiology and Contribution of Obesity to Cardiovascular Disease
Bastien, M., Poirier, P., Lemieux, I., & Després, J.-P. (2014) · Progress in Cardiovascular Diseases · doi:10.1016/j.pcad.2013.10.016 · Cited by 1,125
The intestinal microbiota fuelling metabolic inflammation
Tilg, H., Zmora, N., Adolph, T. E., & Elinav, E. (2020) · Nature Reviews Immunology · doi:10.1038/s41577-019-0198-4 · Cited by 1,089
Adipokine dysregulation, adipose tissue inflammation and metabolic syndrome
Maury, E., & Brichard, S. M. (2010) · Molecular and Cellular Endocrinology · doi:10.1016/j.mce.2009.07.031 · Cited by 1,026
Hypoxia and Adipose Tissue Function and Dysfunction in Obesity
Trayhurn, P. (2013) · Physiological Reviews · doi:10.1152/physrev.00017.2012 · Cited by 932
Klöting, N., Fasshauer, M., Dietrich, A., Kovacs, P., Schön, M. R., Kern, M., Stumvoll, M., & Blüher, M. (2010) · American Journal of Physiology-Endocrinology and Metabolism · doi:10.1152/ajpendo.00586.2009 · Cited by 856
Lee, M., Wu, Y., & Fried, S. K. (2012) · Molecular Aspects of Medicine · doi:10.1016/j.mam.2012.10.001 · Cited by 861
Ramos, J. S., Dalleck, L. C., Tjonna, A. E., Beetham, K. S., & Coombes, J. S. (2015) · Sports Medicine · doi:10.1007/s40279-015-0321-z · Cited by 715
The ominous triad of adipose tissue dysfunction: inflammation, fibrosis, and impaired angiogenesis.
Crewe, C., An, Y. A., & Scherer, P. E. (2017) · Journal of Clinical Investigation · doi:10.1172/jci88883 · Cited by 732
Obesity and cardiovascular disease: revisiting an old relationship
Koliaki, C. C., Liatis, S., & Kokkinos, A. D. (2018) · Metabolism · doi:10.1016/j.metabol.2018.10.011 · Cited by 771
Fuster, J. J., Ouchi, N., Gokce, N., & Walsh, K. X. (2016) · Circulation Research · doi:10.1161/circresaha.115.306885 · Cited by 691
Metabolically healthy obesity: facts and fantasies
Smith, G. I., Mittendorfer, B., & Klein, S. (2019) · Journal of Clinical Investigation · doi:10.1172/jci129186 · Cited by 677
Lee, Y. S., Kim, J.-W., Osborne, O., Oh, D. Y., Sasik, R., Schenk, S., Chen, A., Chung, H., Murphy, A., Watkins, S. M., et al. (2014) · Cell · doi:10.1016/j.cell.2014.05.012 · Cited by 598
Adipokines: A link between obesity and cardiovascular disease
Nakamura, K., Fuster, J. J., & Walsh, K. X. (2013) · Journal of Cardiology · doi:10.1016/j.jjcc.2013.11.006 · Cited by 597
The cell biology of fat expansion
Rutkowski, J. M., Stern, J. H., & Scherer, P. E. (2015) · Journal of Cell Biology · doi:10.1083/jcb.201409063 · Cited by 541
Diabetic Microvascular Disease: An Endocrine Society Scientific Statement
Barrett, E. J., Liu, Z., Khamaisi, M., King, G. L., Klein, R., Klein, R., Hughes, T. M., Craft, S., Freedman, B. I., Bowden, D. W., et al. (2017) · The Journal of Clinical Endocrinology & Metabolism · doi:10.1210/jc.2017-01922 · Cited by 537
The role of adipose tissue in cardiovascular health and disease
Oikonomou, E. K., & Antoniades, C. A. (2018) · Nature Reviews Cardiology · doi:10.1038/s41569-018-0097-6 · Cited by 531
The Impact of Obesity on the Cardiovascular System
Csige, I., Ujvárosy, D., Szabó, Z., Lőrincz, I., Paragh, G., Harangi, M., & Somodi, S. (2018) · Journal of Diabetes Research · doi:10.1155/2018/3407306 · Cited by 559
Immune Regulation of Metabolic Homeostasis in Health and Disease
Brestoff, J. R., & Artis, D. (2015) · Cell · doi:10.1016/j.cell.2015.02.022 · Cited by 510
Impaired adipogenesis and dysfunctional adipose tissue in human hypertrophic obesity
Hammarstedt, A., Gogg, S., Hedjazifar, S., Nerstedt, A., & Smith, U. (2018) · Physiological Reviews · doi:10.1152/physrev.00034.2017 · Cited by 462
Hypoxemia in patients with COPD: cause, effects, and disease progression
McNicholas, W. T., Kent, & Mitchell (2011) · International Journal of COPD · doi:10.2147/copd.s10611 · Cited by 479
Obesity and the risk of cardiometabolic diseases
Valenzuela, P. L., Carrera-Bastos, P., Castillo-García, A., Lieberman, D. E., Santos-Lozano, A., & Lucia, A. (2023) · Nature Reviews Cardiology · doi:10.1038/s41569-023-00847-5 · Cited by 452
Spencer, M., Yao-Borengasser, A., Unal, R., Rasouli, N., Gurley, C. M., Zhu, B., Peterson, C. A., & Kern, P. A. (2010) · American Journal of Physiology-Endocrinology and Metabolism · doi:10.1152/ajpendo.00329.2010 · Cited by 439
Adipose tissue macrophages: going off track during obesity
Boutens, L., & Stienstra, R. (2016) · Diabetologia · doi:10.1007/s00125-016-3904-9 · Cited by 454
Vascular rarefaction mediates whitening of brown fat in obesity
Shimizu, I., Aprahamian, T. R., Kikuchi, R., Shimizu, A., Papanicolaou, K. N., MacLauchlan, S., Maruyama, S., & Walsh, K. X. (2014) · Journal of Clinical Investigation · doi:10.1172/jci71643 · Cited by 435
Adaptive immunity in obesity and insulin resistance
Sell, H., Habich, C., & Eckel, J. (2012) · Nature Reviews Endocrinology · doi:10.1038/nrendo.2012.114 · Cited by 486
Leeners, B., Geary, N., Tobler, P. N., & Asarian, L. (2017) · Human Reproduction Update · doi:10.1093/humupd/dmw045 · Cited by 407
Adipose tissue dysfunction contributes to obesity related metabolic diseases
Blüher, M. (2013) · Best Practice & Research Clinical Endocrinology & Metabolism · doi:10.1016/j.beem.2013.02.005 · Cited by 430
The role of hypoxia-inducible factors in metabolic diseases
Gonzalez, F. J., Xie, C., & Jiang, C. (2018) · Nature Reviews Endocrinology · doi:10.1038/s41574-018-0096-z · Cited by 418
Aging, obesity, and inflammatory age-related diseases
Frasca, D., Blomberg, B. B., & Paganelli, R. (2017) · Frontiers in Immunology · doi:10.3389/fimmu.2017.01745 · Cited by 371
The role of adipokines in chronic inflammation
Mancuso, P. (2016) · ImmunoTargets and Therapy · doi:10.2147/itt.s73223 · Cited by 405
Contribution of Adipose Tissue Inflammation to the Development of Type 2 Diabetes Mellitus
Burhans, M. S., Hagman, D. K., Kuzma, J. N., Schmidt, K. A., & Kratz, M. (2018) · Comprehensive physiology · doi:10.1002/cphy.c170040 · Cited by 461
Endotrophin triggers adipose tissue fibrosis and metabolic dysfunction
Sun, K., Park, J., Gupta, O. T., Holland, W. L., Auerbach, P., Zhang, N., Goncalves Marangoni, R., Nicoloro, S. M., Czech, M. P., Varga, J., et al. (2014) · Nature Communications · doi:10.1038/ncomms4485 · Cited by 364
Abraham, T. M., Pedley, A., Massaro, J. M., Hoffmann, U., & Fox, C. S. (2015) · Circulation · doi:10.1161/circulationaha.114.015000 · Cited by 353
Gealekman, O., Guseva, N., Hartigan, C., Apotheker, S., Gorgoglione, M., Gurav, K., Tran, K.-V., Straubhaar, J., Nicoloro, S., Czech, M. P., et al. (2011) · Circulation · doi:10.1161/circulationaha.110.970145 · Cited by 346
Chronic tissue inflammation and metabolic diseasePreprint
Lee, Y. S., & Olefsky, J. M. (2021) · Genes & Development · doi:10.1101/gad.346312.120 · Cited by 356
Adipose Tissue Collagen VI in Obesity
Pasarica, M., Gawrońska‐Kozak, B., Burk, D. H., Remedios, I., Hymel, D., Gimble, J., Ravussin, É., Bray, G. A., & Smith, S. R. (2009) · The Journal of Clinical Endocrinology & Metabolism · doi:10.1210/jc.2009-0947 · Cited by 351
Self-citationKeeley, T. P., & Mann, G. E. (2019) · Physiological Reviews · doi:10.1152/physrev.00041.2017 · Cited by 329
Goossens, G. H., Bizzarri, A., Venteclef, N., Essers, Y., Cleutjens, J. P., Konings, E., Jocken, J. W. E., Čajlaković, M., Ribitsch, V., Clément, K., et al. (2011) · Circulation · doi:10.1161/circulationaha.111.027813 · Cited by 324
Elias, I., Franckhauser, S., Ferré, T., Vilà, L., Tafuro, S., MUÑOZ, S. A., Roca, C., Ramos, D., Pujol, A., Riu, E., et al. (2012) · Diabetes · doi:10.2337/db11-0832 · Cited by 332
Macrophage functions in lean and obese adipose tissue
Thomas, D. D., & Apovian, C. M. (2017) · Metabolism · doi:10.1016/j.metabol.2017.04.005 · Cited by 333
Adipose Vascular Endothelial Growth Factor Regulates Metabolic Homeostasis through Angiogenesis
Sung, H., Doh, K., Son, J. E., Park, J. G., Bae, Y., Choi, S., Nelson, S. M. L., Cowling, R. A., Nagy, K. V., Michael, I. P., et al. (2013) · Cell Metabolism · doi:10.1016/j.cmet.2012.12.010 · Cited by 317
(n-3) Fatty Acids Alleviate Adipose Tissue Inflammation and Insulin Resistance: Mechanistic Insights
Kalupahana, N. S., Claycombe, K. J., & Moustaid-Moussa, N. (2011) · Advances in Nutrition · doi:10.3945/an.111.000505 · Cited by 305
Tissue Immune Cells Fuel Obesity-Associated Inflammation in Adipose Tissue and Beyond
Liu, R., & Nikolajczyk, B. S. (2019) · Frontiers in Immunology · doi:10.3389/fimmu.2019.01587 · Cited by 318
Extracellular Matrix Remodeling of Adipose Tissue in Obesity and Metabolic Diseases
Ruiz‐Ojeda, F. J., Méndez-Gutiérrez, A., Aguilera, C. M., & Plaza‐Díaz, J. (2019) · International Journal of Molecular Sciences · doi:10.3390/ijms20194888 · Cited by 334
Cellular hypoxia and adipose tissue dysfunction in obesity
Wood, I. S., de Heredia, F. P., Wang, B., & Trayhurn, P. (2009) · Proceedings of The Nutrition Society · doi:10.1017/s0029665109990206 · Cited by 302
Adipose Tissue Extracellular Matrix and Vascular Abnormalities in Obesity and Insulin Resistance
Spencer, M. L., Ünal, R., Zhu, B., Rasouli, N., McGehee, R. E., Peterson, C. A., & Kern, P. A. (2011) · The Journal of Clinical Endocrinology & Metabolism · doi:10.1210/jc.2011-1567 · Cited by 309
The Pathogenesis of Obesity-Associated Adipose Tissue Inflammation
Engin, A. (2017) · Advances in experimental medicine and biology · doi:10.1007/978-3-319-48382-5_9 · Cited by 299
Effects of Exercise Training on Chronic Inflammation in Obesity
You, T., Arsenis, N. C., DiSanzo, B., & LaMonte, M. J. (2013) · Sports Medicine · doi:10.1007/s40279-013-0023-3 · Cited by 303
Standard of care for lipedema in the United States
Herbst, K. L., Kahn, L. A., Iker, E., Ehrlich, C., Wright, T. F., McHutchison, L., Schwartz, J. S., Sleigh, M., Donahue, P. M. C., Lisson, K. H., et al. (2021) · Phlebology The Journal of Venous Disease · doi:10.1177/02683555211015887 · Cited by 282
Mechanistic Links Between Obesity, Diabetes, and Blood Pressure: Role of Perivascular Adipose Tissue
Saxton, S. N., Clark, B., Withers, S., Eringa, E. C., & Heagerty, A. M. (2019) · Physiological Reviews · doi:10.1152/physrev.00034.2018 · Cited by 290
The vicious circle between oxidative stress and inflammation in atherosclerosis
Hulsmans, M., & Holvoet, P. (2009) · Journal of Cellular and Molecular Medicine · doi:10.1111/j.1582-4934.2009.00978.x · Cited by 275
Adipocyte-Macrophage Cross-Talk in Obesity
Engin, A. B. (2017) · Advances in experimental medicine and biology · doi:10.1007/978-3-319-48382-5_14 · Cited by 275
Suga, H., Eto, H., Aoi, N., D, H. K. M., Araki, J., Doi, K., Higashino, T., & Yoshimura, K. (2010) · Plastic & Reconstructive Surgery · doi:10.1097/prs.0b013e3181f4468b · Cited by 271
Aron-Wisnewsky, J., Minville, C., Tordjman, J., Lévy, P., Bouillot, J.-L., Basdevant, A., Bedossa, P., Clément, K., & Pépin, J.-L. (2012) · Journal of Hepatology · doi:10.1016/j.jhep.2011.04.022 · Cited by 255
Vascular Inflammation in Obesity and Sleep Apnea
Jelić, S., Lederer, D. J., Adams, T., Padeletti, M., Colombo, P. C., Factor, P. H., & Jemtel, T. H. L. (2010) · Circulation · doi:10.1161/circulationaha.109.900357 · Cited by 255
Immunity as a link between obesity and insulin resistance
Kalupahana, N. S., Moustaïd‐Moussa, N., & Claycombe, K. (2011) · Molecular Aspects of Medicine · doi:10.1016/j.mam.2011.10.011 · Cited by 264
He, Q., Gao, Z., Yin, J., Zhang, J., Yun, Z., & Ye, J. (2011) · American Journal of Physiology-Endocrinology and Metabolism · doi:10.1152/ajpendo.00626.2010 · Cited by 260
Defining macrophage phenotype and function in adipose tissue
Dalmas, É., Clément, K., & Guerre-Millo, M. (2011) · Trends in Immunology · doi:10.1016/j.it.2011.04.008 · Cited by 267
Fujisaka, S., Usui, I., Ikutani, M., Aminuddin, A., Takikawa, A., Tsuneyama, K., Mahmood, A., Goda, N., Nagai, Y., Takatsu, K., et al. (2013) · Diabetologia · doi:10.1007/s00125-013-2885-1 · Cited by 239
Selective Inhibition of Hypoxia-Inducible Factor 1α Ameliorates Adipose Tissue Dysfunction
Sun, K., Halberg, N., Khan, M., Magalang, U. J., & Scherer, P. E. (2013) · Molecular and Cellular Biology · doi:10.1128/mcb.00951-12 · Cited by 231
Hypoxic Culture Conditions as a Solution for Mesenchymal Stem Cell Based Regenerative Therapy
Haque, N., Rahman, M. T., Kasim, N. H. A., & Alabsi, A. M. (2013) · The Scientific World JOURNAL · doi:10.1155/2013/632972 · Cited by 239
Blondin, D. P., Labbé, S. M., Noll, C., Kunach, M., Phoenix, S., Guérin, B., Turcotte, É. E., Haman, F., Richard, D., & Carpentier, A. C. (2015) · Diabetes · doi:10.2337/db14-1651 · Cited by 229
Daulatzai, M. A. (2015) · Journal of Neuroscience Research · doi:10.1002/jnr.23634 · Cited by 222
Visceral and Subcutaneous Fat Quality and Cardiometabolic Risk
Rosenquist, K. J., Pedley, A., Massaro, J. M., Therkelsen, K. E., Murabito, J. M., Hoffmann, U., & Fox, C. S. (2013) · JACC. Cardiovascular imaging · doi:10.1016/j.jcmg.2012.11.021 · Cited by 223
Relevance of Oxygen Concentration in Stem Cell Culture for Regenerative Medicine
Mas‐Bargues, C., Sanz‐Ros, J., Román-Domínguez, A., Inglés, M., Gimeno-Mallench, L., Alami, M. E., Viña‐Almunia, J., Gambini, J., Viña, J., & Borrás, C. (2019) · International Journal of Molecular Sciences · doi:10.3390/ijms20051195 · Cited by 221
Adipocytokines in relation to cardiovascular disease
de Voorde, J. V., Pauwels, B., Boydens, C., & Decaluwé, K. (2013) · Metabolism · doi:10.1016/j.metabol.2013.06.004 · Cited by 215
Adipose tissue angiogenesis: Impact on obesity and type-2 diabetes
Corvera, S., & Gealekman, O. (2013) · Biochimica et Biophysica Acta (BBA) - Molecular Basis of Disease · doi:10.1016/j.bbadis.2013.06.003 · Cited by 222
Adipose tissue remodeling in pathophysiology of obesity
Lee, M., Wu, Y., & Fried, S. K. (2010) · Current Opinion in Clinical Nutrition & Metabolic Care · doi:10.1097/mco.0b013e32833aabef · Cited by 217
Adipose tissue and adipocyte dysregulation
Lafontan, M. (2013) · Diabetes & Metabolism · doi:10.1016/j.diabet.2013.08.002 · Cited by 218
The role of perivascular adipose tissue in obesity‐induced vascular dysfunction
Xia, N., & Li, H. (2016) · British Journal of Pharmacology · doi:10.1111/bph.13650 · Cited by 206
Architecture and the extracellular matrix: the still unappreciated components of the adipose tissue
Divoux, A., & Clément, K. (2011) · Obesity Reviews · doi:10.1111/j.1467-789x.2010.00811.x · Cited by 227
Mechanisms of weight regain after weight loss — the role of adipose tissue
van Baak, M. A., & Mariman, E. C. M. (2019) · Nature Reviews Endocrinology · doi:10.1038/s41574-018-0148-4 · Cited by 203
Polyphenols and their effects on diabetes management: A review
Aryaeian, N., Sedehi, S. K., & Arablou, T. (2017) · Medical Journal of the Islamic Republic of Iran · doi:10.14196/mjiri.31.134 · Cited by 213
Zhou, W., Lin, J., Zhao, K., Jin, K., He, Q., Hu, Y., Feng, G., Cai, Y., Xia, C., Liu, H., et al. (2019) · The American Journal of Sports Medicine · doi:10.1177/0363546519848678 · Cited by 202
An integrated single cell and spatial transcriptomic map of human white adipose tissue
Massier, L., Jalkanen, J., Elmastas, M., Zhong, J., Wang, T., Nono Nankam, P. A., Frendo-Cumbo, S., Bäckdahl, J., Subramanian, N., Sekine, T., et al. (2023) · Nature Communications · doi:10.1038/s41467-023-36983-2 · Cited by 195
Murphy, A. M., Thomas, A., Crinion, S. J., Kent, B. D., Tambuwala, M. M., Fabre, A., Pépin, J., Roche, H. M., Arnaud, C., & Ryan, S. (2017) · European Respiratory Journal · doi:10.1183/13993003.01731-2016 · Cited by 201
Hypoxia and Adipocyte Physiology: Implications for Adipose Tissue Dysfunction in Obesity
Trayhurn, P. (2014) · Annual Review of Nutrition · doi:10.1146/annurev-nutr-071812-161156 · Cited by 194
SPARC: a key player in the pathologies associated with obesity and diabetes
Kos, K., & Wilding, J. P. H. (2010) · Nature Reviews Endocrinology · doi:10.1038/nrendo.2010.18 · Cited by 197
Endothelial Dysfunction, Obesity and Insulin Resistance
Prieto, D., Contreras, C., & Sánchez, A. (2014) · Current Vascular Pharmacology · doi:10.2174/1570161112666140423221008 · Cited by 191
Adipose Tissue Fibrosis in Obesity: Etiology and Challenges
Marcelin, G., Gautier, E. L., & Clément, K. (2021) · Annual Review of Physiology · doi:10.1146/annurev-physiol-060721-092930 · Cited by 201
The Adipokine Hypothesis of Heart Failure With a Preserved Ejection Fraction
Packer, M. (2025) · Journal of the American College of Cardiology · doi:10.1016/j.jacc.2025.06.055 · Cited by 213
Omega-3 Fatty Acids Reduce Adipose Tissue Macrophages in Human Subjects With Insulin Resistance
Spencer, M. L., Finlin, B. S., Ünal, R., Zhu, B., Morris, A. J., Shipp, L. R., Lee, J. D., Walton, R. G., Adu, A. K., Erfani, R. A., et al. (2013) · Diabetes · doi:10.2337/db12-1042 · Cited by 186
de Heredia, F. P., Wood, I. S., & Trayhurn, P. (2009) · Pflügers Archiv - European Journal of Physiology · doi:10.1007/s00424-009-0750-3 · Cited by 190
Hypoxia-induced inflammatory cytokine secretion in human adipose tissue stromovascular cells
O’Rourke, R. W., White, A. E., Metcalf, M. D., Olivas, A., Mitra, P., Larison, W. G., Cheang, E. C., Varlamov, O., Corless, C. L., Roberts, C. T., et al. (2011) · Diabetologia · doi:10.1007/s00125-011-2103-y · Cited by 177
Chronic intermittent hypoxia induces atherosclerosis via activation of adipose angiopoietin-like 4
Drager, L. F., Yao, Q., Hernandez, K. L., Shin, M.-K., Bevans-Fonti, S., Gay, J., Sussan, T. E., Jun, J. C., Myers, A. C., Olivecrona, G., et al. (2013) · American Journal of Respiratory and Critical Care Medicine · doi:10.1164/rccm.201209-1688oc · Cited by 175
Effects of different acute hypoxic regimens on tissue oxygen profiles and metabolic outcomes
Reinke, C., Bevans‐Fonti, S., Drager, L. F., Shin, M., & Polotsky, V. Y. (2011) · Journal of Applied Physiology · doi:10.1152/japplphysiol.00492.2011 · Cited by 179
Inflammation during obesity is not all bad: evidence from animal and human studies
Ye, J., & McGuinness, O. P. (2012) · American Journal of Physiology-Endocrinology and Metabolism · doi:10.1152/ajpendo.00266.2012 · Cited by 178
Effects of Bariatric Surgery on Human Small Artery Function
Aghamohammadzadeh, R., Greenstein, A. S., Yadav, R., Jeziorska, M., Hama, S., Soltani, F., Pemberton, P., Ammori, B. J., Malik, R. A., Soran, H., et al. (2013) · Journal of the American College of Cardiology · doi:10.1016/j.jacc.2013.04.027 · Cited by 170
Lawler, H. M., Underkofler, C., Kern, P. A., Erickson, C. B., Bredbeck, B. C., & Rasouli, N. (2016) · The Journal of Clinical Endocrinology & Metabolism · doi:10.1210/jc.2015-4125 · Cited by 183
Parallels in Immunometabolic Adipose Tissue Dysfunction with Ageing and Obesity
Trim, W. V., Turner, J. E., & Thompson, D. (2018) · Frontiers in Immunology · doi:10.3389/fimmu.2018.00169 · Cited by 178
Phytochemicals and their impact on adipose tissue inflammation and diabetes
Leiherer, A., Muendlein, A., & Drexel, H. (2012) · Vascular Pharmacology · doi:10.1016/j.vph.2012.09.002 · Cited by 172
Famulla, S., Lamers, D., Hartwig, S., Paßlack, W., Horrighs, A., Cramer, A., Lehr, S., Sell, H., & Eckel, J. (2010) · International Journal of Obesity · doi:10.1038/ijo.2010.212 · Cited by 158
Metadata
- Authors
- Pasarica, M., Sereda, O. R., Redman, L. M., Albarado, D. C., Hymel, D. T., Roan, L. E., Rood, J. C., Burk, D. H., & Smith, S. R.
- Affiliations
- Pennington Biomedical Research Center (US)
- Venue
- Diabetes
- Publisher
- American Diabetes Association
- Published
- 2009-03-01
- Volume
- 58
- Issue
- 3
- Pages
- 718-725
- ISSN
- 0012-1797 (ISSN-L)
- 1939-327X
- PMC
- PMC2646071
- OpenAlex
- W2171965603
- Cited by
- 786
- References
- 46
- Citations by year
- 2026: 27 · 2025: 25 · 2024: 40 · 2023: 32 · 2022: 47 · 2021: 41 · 2020: 48 · 2019: 58 · 2018: 54 · 2017: 56 · 2016: 39 · 2015: 53 · 2014: 53 · 2013: 66 · 2012: 46
- FWCI
- 25.07
- Type
- journal article
- Language
- en
- Open access
- hybrid
- doi.org
- Licence
- cc-by-nc-nd
- Locations
- Diabetes (publishedVersion, cc-by-nc-nd)
- PubMed Central (publishedVersion, cc-by-nc-nd)
- PubMed (publishedVersion)
- Civil War Book Review (submittedVersion)
- Funders
- National Institute of Diabetes and Digestive and Kidney Diseases (DK072476, P30DK072476)
- Topics
- Health Sciences › Medicine › Endocrinology, Diabetes and Metabolism › Adipokines, Inflammation, and Metabolic Diseases
- Health Sciences › Medicine › Physiology (medical) › Adipose Tissue and Metabolism
- Health Sciences › Medicine › Cardiology and Cardiovascular Medicine › Cardiovascular Disease and Adiposity
- Keywords
- adipose tissue hypoxia, obesity, adipose tissue inflammation, macrophage infiltration, capillary density, vascular endothelial growth factor, PPARγ, collagen VI, CD68, macrophage inflammatory protein-1alpha, insulin sensitivity, adipose tissue vascularization
- MeSH terms
- Abdomen, Adipose Tissue, Hypoxia, Blood Pressure, Body Composition, Body Temperature, Female, Humans, Hyperinsulinism, Inflammation, Male, Obesity, Organ Size, Oxygen, Partial Pressure, Reference Values, Glucose Clamp Technique, Absorptiometry, Photon, Patient Selection, Reverse Transcriptase Polymerase Chain Reaction, Overweight
About these checks
Registry, retraction, Cites and statistics results are computed, not judged, with one exception: a printed reference that no index lists is read once by a model before it counts as a citation error. Claims are extracted by a model and kept only when their quote appears verbatim in the text; each cited source is then checked, with a model’s help, for whether it says what the claim relies on. Those verdicts can be wrong — read the claim’s quote and the cited source before relying on one.
Statistics and arithmetic are recomputed, not judged.
Confidence bands are shown only for fields calibrated on our annotated test set. None is calibrated yet, so no band is shown.
What counts as a claim ›How we measure confidence ›How we check this ›
Are you an author, or do you see a problem with this page? Request a review
