

The DOI matches its Crossref record; 66 of the 66 references it cites were found in a registry or an index.
Cortical iron reflects severity of Alzheimer's disease
Open accessAbstract
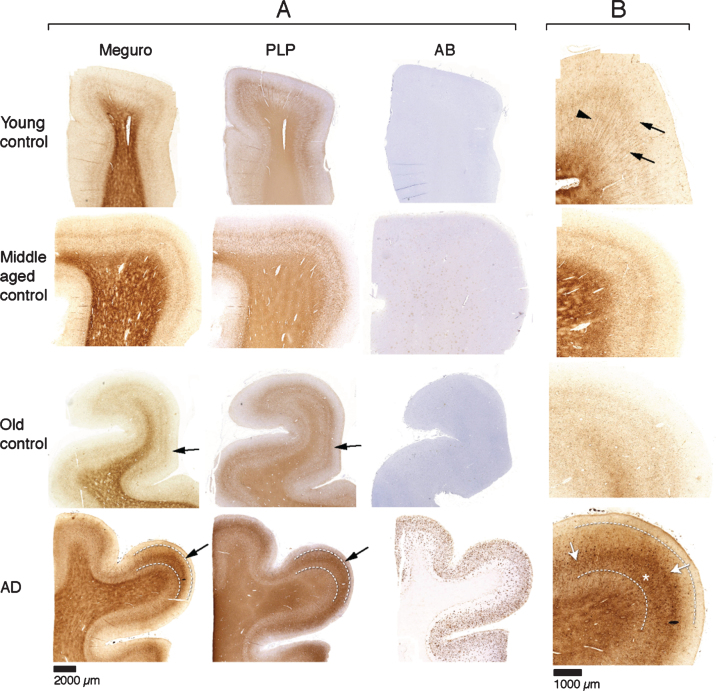
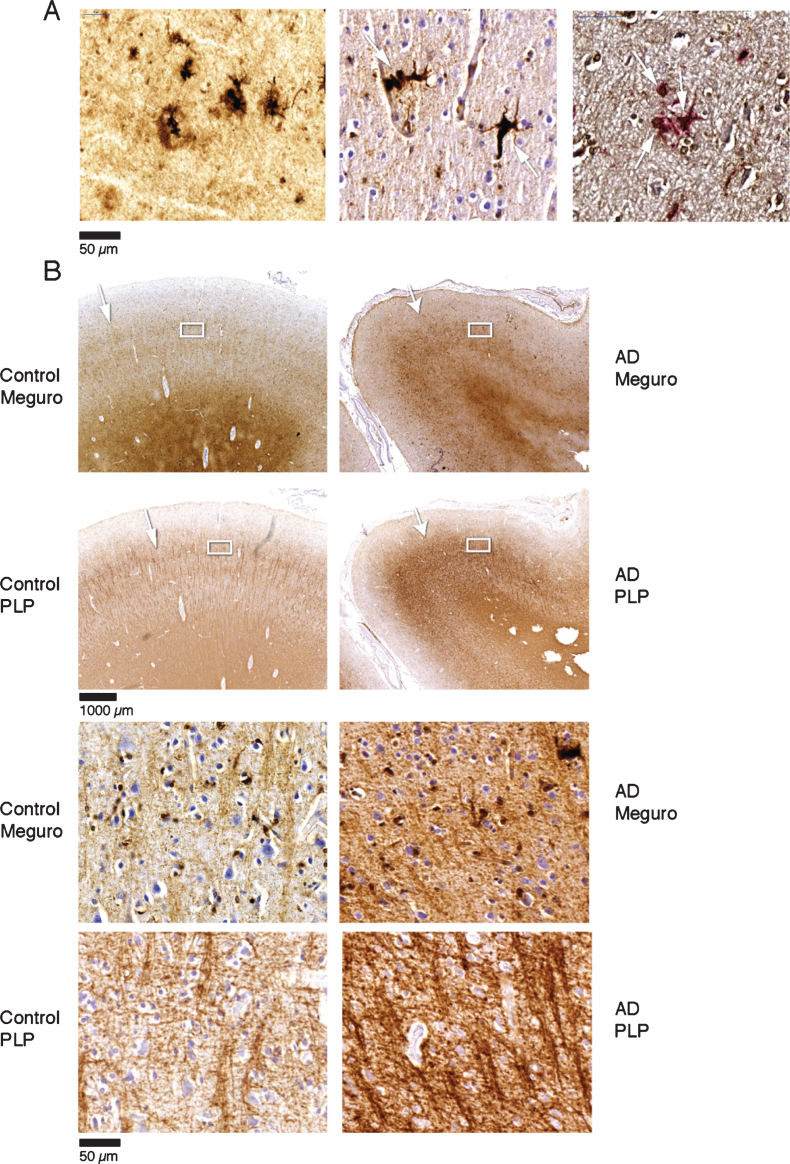
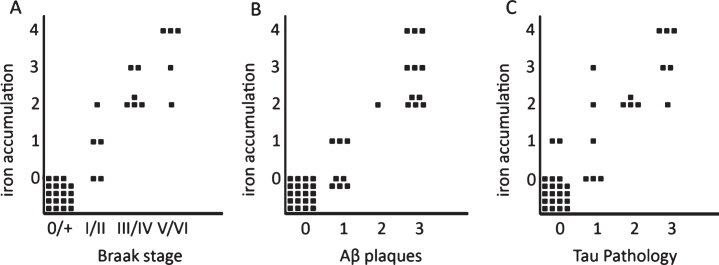
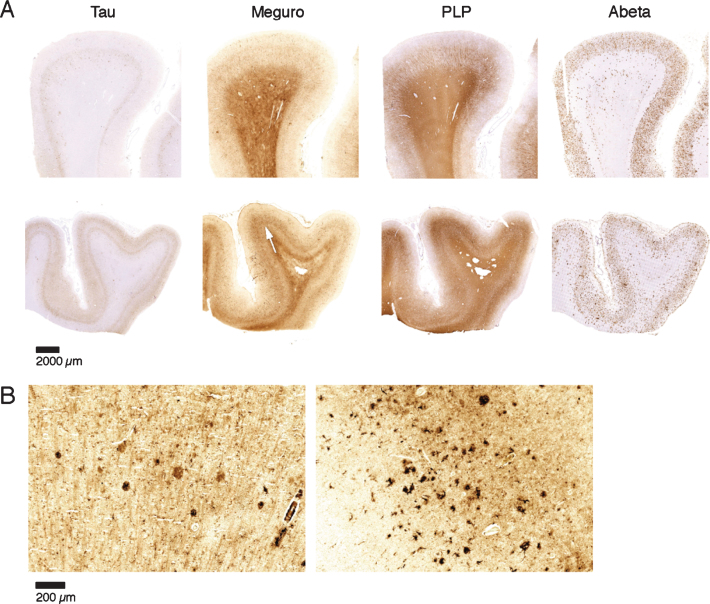
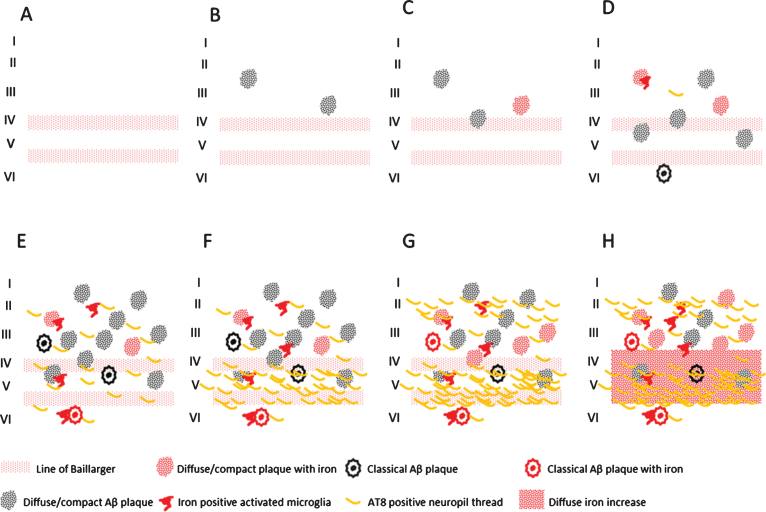
Abnormal iron distribution in the isocortex is increasingly recognized as an in vivo marker for Alzheimer's disease (AD). However, the contribution of iron accumulation to the AD pathology is still poorly understood. In this study, we investigated: 1) frontal cortical iron distribution in AD and normal aging and 2) the relation between iron distribution and degree of AD pathology. We used formalin fixed paraffin embedded frontal cortex from 10 AD patients, 10 elder, 10 middle aged, and 10 young controls and visualized iron with a modified Perl's histochemical procedure. AD and elderly subjects were not different with respect to age and sex distribution. Iron distribution in the frontal cortex was not affected by normal aging but was clearly different between AD and controls. AD showed accumulation of iron in plaques, activated microglia, and, in the most severe cases, in the mid-cortical layers along myelinated fibers. The degree of altered iron accumulations was correlated to the amount of amyloid-β plaques and tau pathology in the same block, as well as to Braak stage (p < 0.001). AD and normal aging show different iron and myelin distribution in frontal cortex. These changes appear to occur after the development of the AD pathological hallmarks. These findings may help the interpretation of high resolution in vivo MRI and suggest the potential of using changes in iron-based MRI contrast to indirectly determine the degree of AD pathology in the frontal cortex.
Overview
The claims and statistics of this paper haven’t been checked yet.
Run the check — free, no account needed. It reads the open-access text and checks the sources it cites.
Integrity signals
Registry
Cites
Statistics
Figures
Verification
Claims the paper makes
The claims and statistics of this paper haven’t been checked yet.
Run the check — free, no account needed. It reads the open-access text and checks the sources it cites.
Claims other papers make about this one
Each is checked against this paper’s own text: does it say what the citing paper says it does?
The source backs part of the claim, not all of it — or backs it for a different population, condition or comparison.
In the citing paper
“generating detectable local magnetic susceptibility variations.”
From Diffusion MRI reveals amyloid plaque–associated cellular signatures through spatial transcriptomic integration (2026) · cites this paper as [31]
Experimental — accuracy not yet measured
Self-check
Percentages, sums and reported differences re-computed from the paper’s own numbers.
The self-check needs the paper’s full text.
Citations
Cites
Hypothetical model of dynamic biomarkers of the Alzheimer's pathological cascade
Jack, C. R., Knopman, D. S., Jagust, W. J., Shaw, L. M., Aisen, P. S., Weiner, M. W., Petersen, R. C., & Trojanowski, J. Q. (2010) · The Lancet Neurology · doi:10.1016/s1474-4422(09)70299-6 · Cited by 4,806 · cited 2×
“A promising approach is in vivo detection of amyloid β (Aβ) plaques, neuropil threads (NT) and neurofibrillary tangles (NFT), since these histological hallmarks of AD occur 10-20 years before cognitive decline [1, 2].”
BackgroundResultImaging brain amyloid in Alzheimer's disease with Pittsburgh Compound‐B
Klunk, W. E., Engler, H., Nordberg, A., Wang, Y., Blomqvist, G., Holt, D. P., Bergström, M., Savitcheva, I., Huang, G., Estrada, S., et al. (2004) · Annals of Neurology · doi:10.1002/ana.20009 · Cited by 4,496
Microglia: a sensor for pathological events in the CNS
Kreutzberg, G. W. (1996) · Trends in Neurosciences · doi:10.1016/0166-2236(96)10049-7 · Cited by 4,396 · cited 1×
“This is in line with earlier studies showing iron in human Aβ plaques [17, 19, 20], and in activated microglia [14, 17, 30-33].”
ResultThe Alzheimer’s disease neuroimaging initiative (ADNI): MRI methods
Jack, C. R., Bernstein, M. A., Fox, N. C., Thompson, P., Alexander, G., Harvey, D., Borowski, B., Britson, P. J., L. Whitwell, J., Ward, C., et al. (2008) · Journal of Magnetic Resonance Imaging · doi:10.1002/jmri.21049 · Cited by 4,347
Copper, iron and zinc in Alzheimer's disease senile plaques
Lovell, M. A., Robertson, J. D., Teesdale, W. J., Campbell, J. L., & Markesbery, W. R. (1998) · Journal of the Neurological Sciences · doi:10.1016/s0022-510x(98)00092-6 · Cited by 2,120 · cited 2×
“Aβ plaques show iron accumulation [14-20] and it has been suggested that this iron causes the high T2* susceptibility effects [11, 21-23].”
BackgroundThe role of iron in brain ageing and neurodegenerative disorders
Ward, R. J., Zucca, F. A., Duyn, J. H., Crichton, R. R., & Zecca, L. (2014) · The Lancet Neurology · doi:10.1016/s1474-4422(14)70117-6 · Cited by 1,819 · cited 1×
“As such, locally high iron concentrations in AD are likely the result of an intricate disbalance of iron uptake, mediated by furin and iron-regulating elements and iron clearance through microglial lysosomal degradation and ApoEmediated transport [36, 59], see also further reviews on this topic.”
BackgroundIron, brain ageing and neurodegenerative disorders
Zecca, L., Youdim, M. B. H., Riederer, P., Connor, J. R., & Crichton, R. R. (2004) · Nature Reviews Neuroscience · doi:10.1038/nrn1537 · Cited by 1,801 · cited 1×
“Production of reactive oxygen species leading to DNA damage and cell death is a well-known consequence of iron overload and a common feature in many neurodegenerative diseases [56].”
BackgroundNeuroinflammation and M2 Microglia: The Good, the Bad, and the Inflamed
Cherry, J. D., Olschowka, J. A., & O’Banion, M. K. (2014) · Journal of Neuroinflammation · doi:10.1186/1742-2094-11-98 · Cited by 1,748 · cited 1×
“The polarization of microglia, as in macrophages, plays an important role in the neuroinflammatory response [51].”
BackgroundRemyelination in the CNS: from biology to therapy
Franklin, R. J. M., & ffrench-Constant, C. (2008) · Nature Reviews Neuroscience · doi:10.1038/nrn2480 · Cited by 1,544 · cited 1×
“Re-myelination is an almost default reaction of the brain to demyelination caused by myelin damage and/or death of oligodendrocytes [41-44].”
BackgroundImplementing a Class of Permutation Tests: The coin Package
Hothorn, T., Hornik, K., van de Wiel, M. A., & Zeileis, A. (2008) · Journal of Statistical Software · doi:10.18637/jss.v028.i08 · Cited by 1,497 · cited 1×
“Semiquantitative iron score was correlated to Braak stage, and semiquantitative scores for Aβ plaques and tau pathology by a linear by linear association test for ordinal variables [29].”
MethodThe effect of age on the non-haemin iron in the human brain
Hallgren, B., & Sourander, P. (1958) · Journal of Neurochemistry · doi:10.1111/j.1471-4159.1958.tb12607.x · Cited by 1,427 · cited 2×
“Aging itself leads to increased iron and ferritin concentrations of the cortex [26, 27], but the microscopically distribution of this age-related increase is unknown.”
BackgroundIron accumulation in Alzheimer disease is a source of redox-generated free radicals
Smith, M. A., Harris, P. L. R., Sayre, L. M., & Perry, G. L. (1997) · Proceedings of the National Academy of Sciences · doi:10.1073/pnas.94.18.9866 · Cited by 1,365 · cited 5×
“Aβ plaques show iron accumulation [14-20] and it has been suggested that this iron causes the high T2* susceptibility effects [11, 21-23].”
BackgroundMethodResultInfluentialImaging β-amyloid burden in aging and dementia
Rowe, C. C., Ng, S., Ackermann, U., Gong, S. J., Pike, K., Savage, G., Cowie, T. F., Dickinson, K. L., Maruff, P., Darby, D., et al. (2007) · Neurology · doi:10.1212/01.wnl.0000261919.22630.ea · Cited by 1,104
Magnetite pollution nanoparticles in the human brain
Maher, B. A., Ahmed, I. A. M., Karloukovski, V. V., MacLaren, D. A., Foulds, P. G., Allsop, D., Mann, D. M. A., Torres‐Jardón, R., & Calderón‐Garcidueñas, L. (2016) · Proceedings of the National Academy of Sciences · doi:10.1073/pnas.1605941113 · Cited by 1,056 · cited 1×
“raised the intriguing concept that iron deposition as an initiator of AD pathogenesis may not only be the result of iron-regulation gone haywire, but may also be caused by environmental factors such as airborne iron-bearing nanoparticles entering the brain through the olfactory bulb [60].”
BackgroundKroner, A., Greenhalgh, A. D., Zarruk, J. G., Passos dos Santos, R., Gaestel, M., & David, S. (2014) · Neuron · doi:10.1016/j.neuron.2014.07.027 · Cited by 655 · cited 1×
“However, recent evidence shows that increased intracellular iron can alter microglia polarization to a pro-inflammatory M1 phenotype [53].”
BackgroundMyelination and the trophic support of long axons
Nave, K.-A. (2010) · Nature Reviews Neuroscience · doi:10.1038/nrn2797 · Cited by 648 · cited 1×
“Re-myelination is an almost default reaction of the brain to demyelination caused by myelin damage and/or death of oligodendrocytes [41-44].”
BackgroundNeuropathology and Cognitive Impairment in Alzheimer Disease: A Complex but Coherent Relationship
Nelson, P. T., Braak, H., & Markesbery, W. R. (2009) · Journal of Neuropathology & Experimental Neurology · doi:10.1097/nen.0b013e3181919a48 · Cited by 643 · cited 1×
“A promising approach is in vivo detection of amyloid- (A ) plaques, neuropil threads (NT), and neurofibrillary tangles (NFT), since these histological hallmarks of AD occur 10–20 years before cognitive decline [1, 2].”
BackgroundOligodendrocytes and myelination: The role of iron
Todorich, B., Pasquini, J. M., Garcia, C. I., Paez, P. M., & Connor, J. R. (2008) · Glia · doi:10.1002/glia.20784 · Cited by 615 · cited 2×
“Moreover, it is thought that microglia provide the high iron concentrations needed for myelinization and oligodendrocyte differentiation [47, 49, 50].”
BackgroundResultTwo-year follow-up of amyloid deposition in patients with Alzheimer's disease
Engler, H., Forsberg, A., Almkvist, O., Blomquist, G., Larsson, E., Savitcheva, I., Wall, A. E., Ringheim, A., Långström, B., & Nordberg, A. K. (2006) · Brain · doi:10.1093/brain/awl178 · Cited by 614
Miller, L. M., Wang, Q., Telivala, T. P., Smith, R., Lanzirotti, A., & Judith Miklossy, A. (2005) · Journal of Structural Biology · doi:10.1016/j.jsb.2005.09.004 · Cited by 588 · cited 1×
“In addition to iron, other metals like copper, zinc, magnesium and aluminium have been shown in plaques and have also been implicated in AD and plaque pathogenesis [18, 35-37].”
BackgroundA histochemical study of iron, transferrin, and ferritin in Alzheimer's diseased brains
Connor, J. R., Menzies, S. L., Martin, S. M. S., & Mufson, E. J. (1992) · Journal of Neuroscience Research · doi:10.1002/jnr.490310111 · Cited by 468 · cited 2×
“We did not identify iron accumulation in NFT or NT, and this is in line with most [14, 17, 19], but not all [20], previous reports.”
BackgroundResultAlafuzoff, I., Arzberger, T., Al‐Sarraj, S., Bodi, I., Bogdanovic, N., Braak, H., Bugiani, O., Del‐Tredici, K., Ferrer, I., Gelpi, E., et al. (2008) · Brain Pathology · doi:10.1111/j.1750-3639.2008.00147.x · Cited by 467 · cited 1×
“For all patients and controls, Braak stage was determined by two experienced neuropathologists (SGvD and RN) according to Alafuzoff [28] investigating the relevant brain areas.”
MethodLayer-specific variation of iron content in cerebral cortex as a source of MRI contrast
Fukunaga, M., Li, T.-Q., van Gelderen, P., de Zwart, J. A., Shmueli, K., Yao, B., Lee, J., Maric, D., Aronova, M. A., Zhang, G., et al. (2010) · Proceedings of the National Academy of Sciences · doi:10.1073/pnas.0911177107 · Cited by 408 · cited 1×
“Ex vivo MRI has shown iron related hypo-intensities in iron rich cortical myelin tracts and iron accumulation in microglia and A plaques [13, 64, 65], suggesting the potential to detect these iron rich cortical areas with in vivo MRI.”
BackgroundGlial response during cuprizone-induced de- and remyelination in the CNS: lessons learned
Gudi, V., Gingele, S., Skripuletz, T., & Stangel, M. (2014) · Frontiers in Cellular Neuroscience · doi:10.3389/fncel.2014.00073 · Cited by 375 · cited 1×
“For example, activated microglia have been described to drive the recruitment and proliferation of OPC and their differentiation to oligodendrocytes, as well as the formation of a myelin sheath around available axons [41, 42, 48].”
BackgroundAyton, S., Faux, N. G., Bush, A. I., Initiative, A. D. N., Weiner, M. W., Aisen, P. S. S., Petersen, R. C., Jack, C. R., Jagust, W., Trojanowki, J. Q., et al. (2015) · Nature Communications · doi:10.1038/ncomms7760 · Cited by 359
Connor, J. R., Snyder, B. S., Arosio, P., Loeffler, D. A., & LeWitt, P. (1995) · Journal of Neurochemistry · doi:10.1046/j.1471-4159.1995.65020717.x · Cited by 317 · cited 1×
“Some [27, 62] but not all [26] quantitative studies show increased frontal cortical iron concentrations with aging.”
BackgroundFurin-mediated release of soluble hemojuvelin: a new link between hypoxia and iron homeostasis
Silvestri, L., Pagani, A., & Camaschella, C. (2008) · Blood · doi:10.1182/blood-2007-07-100677 · Cited by 311
Polarization dictates iron handling by inflammatory and alternatively activated macrophages
Corna, G., Campana, L., Pignatti, E., Castiglioni, A., Tagliafico, E., Bosurgi, L., Campanella, A., Brunelli, S., Manfredi, A. A., Apostoli, P., et al. (2010) · Haematologica · doi:10.3324/haematol.2010.023879 · Cited by 304 · cited 1×
“Conversely, M2-polarized cells are thought to be involved in iron recycling by expressing molecules involved in iron uptake and export [52].”
BackgroundRowe, C. C., & Villemagne, V. L. (2011) · Journal of Nuclear Medicine · doi:10.2967/jnumed.110.076315 · Cited by 279 · cited 4×
“In vivo visualization of Aβ plaque burden is already possible using positron emission tomography (PET) [3-6], but this technique requires the use of a radioactive tracer and a highly-specialized infrastructure.”
BackgroundInfluentialMeguro, R., Asano, Y., Odagiri, S., Li, C., Iwatsuki, H., & Shoumura, K. (2007) · Archivum histologicum japonicum · doi:10.1679/aohc.70.1 · Cited by 261 · cited 10×
“DAB (0.05”
BackgroundMethodInfluentialIron deposits in multiple sclerosis and Alzheimer's disease brains
LeVine, S. M. (1997) · Brain Research · doi:10.1016/s0006-8993(97)00470-8 · Cited by 258 · cited 3×
“We did not identify iron accumulation in NFT or NT, and this is in line with most [14, 17, 19], but not all [20], previous reports.”
MethodResultFerritin is a component of the neuritic (senile) plaque in Alzheimer dementia
Grundke, I., Fleming, J. T., Tung, Y. C., Lassmann, H., Iqbal, K., & Joshi, J. G. (1990) · Acta Neuropathologica · doi:10.1007/bf00334497 · Cited by 253 · cited 1×
“A subset of histological studies report iron accumulation in microglia in the cortex and hippocampus of AD patients [14, 16, 19].”
BackgroundDetection of neuritic plaques in Alzheimer’s disease by magnetic resonance microscopy
Benveniste, H., Einstein, G., Kim, K. R., Hulette, C., & Johnson, G. A. (1999) · Proceedings of the National Academy of Sciences · doi:10.1073/pnas.96.24.14079 · Cited by 235 · cited 1×
“Other MRI studies show susceptibility induced changes in vivo in AD transgenic mice [9–11] and in post mortem human AD brain tissue [12, 13] that”
BackgroundIdentification of the Endodermal Vacuole as the Iron Storage Compartment in the Arabidopsis Embryo
Roschzttardtz, H., Conéjéro, G., Curie, C., & Mari, S. (2009) · PLANT PHYSIOLOGY · doi:10.1104/pp.109.144444 · Cited by 231 · cited 2×
“Indeed, ferrocyanide, in combination with DAB, detects iron with much higher sensitivity than copper, magnesium, zinc, or calcium [34].”
BackgroundMethodRamos, P., Santos, A., Pinto, N. R., Mendes, R., Magalhães, T., & Almeida, A. (2014) · Journal of Trace Elements in Medicine and Biology · doi:10.1016/j.jtemb.2013.08.001 · Cited by 221
Behrendt, G., Baer, K., Buffo, A., Curtis, M. A., Faull, R. L., Rees, M. I., Götz, M., & Dimou, L. (2013) · Glia · doi:10.1002/glia.22432 · Cited by 219 · cited 1×
“Indeed, myelin damage and restoration with increased oligodendrocyte proliferating cells (OPC) has been shown in an AD mouse model, although in the same study a decrease of OPC was found in human AD [45].”
Macrophages and CNS remyelination
Miron, V. E., & Franklin, R. J. M. (2014) · Journal of Neurochemistry · doi:10.1111/jnc.12705 · Cited by 206 · cited 1×
“For example, activated microglia have been described to drive the recruitment and proliferation of OPC and their differentiation to oligodendrocytes, as well as the formation of a myelin sheath around available axons [41, 42, 48].”
BackgroundOgg, R. J., Langston, J. W., Haacke, E. M., Steen, R. G., & Taylor, J. S. (1999) · Magnetic Resonance Imaging · doi:10.1016/s0730-725x(99)00017-x · Cited by 205 · cited 1×
“Recently, high field (7T) Magnetic Resonance Imaging (MRI) has been reported to discriminate AD from control neocortex by changes in phase shift, which is a reliable indication of iron content in the brain [7, 8].”
BackgroundJack, C. R., Garwood, M., Wengenack, T. M., Borowski, B., Curran, G. L., Lin, J., Adriany, G., Gröhn, O. H. J., Grimm, R. C., & Poduslo, J. F. (2004) · Magnetic Resonance in Medicine · doi:10.1002/mrm.20266 · Cited by 196 · cited 1×
“Other MRI studies show susceptibility induced changes in vivo in AD transgenic mice [9-11] and in postmortem human AD brain tissue [12, 13] that correlate to Aβ plaques histologically.”
BackgroundColocalization of cerebral iron with Amyloid beta in Mild Cognitive Impairment
Bergen, J. M. G. V., Li, X., Hua, J., Schreiner, S. J., Steininger, S. C., Quevenco, F. C., Wyss, M. T., Gietl, A. F., Treyer, V., Leh, S. E., et al. (2016) · Scientific Reports · doi:10.1038/srep35514 · Cited by 186 · cited 13×
“(2016) demonstrated that magnetic susceptibility, as measured with MRI, was significantly higher in APOE 4 carriers with mild cognitive impairment (MCI) compared to MCI patients with other APOE variants [55].”
BackgroundResultInfluentialMeadowcroft, M. D., Connor, J. R., Smith, M. B., & Yang, Q. X. (2009) · Journal of Magnetic Resonance Imaging · doi:10.1002/jmri.21731 · Cited by 176 · cited 2×
“Other MRI studies show susceptibility induced changes in vivo in AD transgenic mice [9–11] and in post mortem human AD brain tissue [12, 13] that”
BackgroundMicroglia Activation and Anti-inflammatory Regulation in Alzheimer’s Disease
Lue, L., Kuo, Y., Beach, T. G., & Walker, D. G. (2010) · Molecular Neurobiology · doi:10.1007/s12035-010-8106-8 · Cited by 173 · cited 1×
“2A), morphologically identified as activated microglia [30, 31].”
Zeineh, M. M., Chen, Y., Kitzler, H. H., Hammond, R., Vogel, H., & Rutt, B. K. (2015) · Neurobiology of Aging · doi:10.1016/j.neurobiolaging.2015.05.022 · Cited by 151
In Vivo Magnetic Resonance Microimaging of Individual Amyloid Plaques in Alzheimer's Transgenic Mice
Jack, C. R., Wengenack, T. M., Reyes, D. A., Garwood, M., Curran, G. L., Borowski, B. J., Lin, J., Preboske, G. M., Holasek, S. S., Adriany, G., et al. (2005) · The Journal of Neuroscience · doi:10.1523/jneurosci.2588-05.2005 · Cited by 148
Vanhoutte, G., Dewachter, I., Borghgraef, P., Leuven, F. V., & der Linden, A. V. (2005) · Magnetic Resonance in Medicine · doi:10.1002/mrm.20385 · Cited by 137
Tao, Y., Wang, Y., Rogers, J. T., & Wang, F. (2014) · Journal of Alzheimer s Disease · doi:10.3233/jad-140396 · Cited by 135 · cited 1×
“[39] and a recent laser-ablation inductively coupled plasma-mass spectrometry imaging study [40], both showing increased iron levels in the cortex of AD patients compared to controls.”
Amyloid plaques in PSAPP mice bind less metal than plaques in human Alzheimer's disease
Leskovjan, A. C., Lanzirotti, A., & Miller, L. M. (2009) · NeuroImage · doi:10.1016/j.neuroimage.2009.05.063 · Cited by 129 · cited 1×
“In addition to iron, other metals like copper, zinc, magnesium and aluminium have been shown in plaques and have also been implicated in AD and plaque pathogenesis [18, 35-37].”
BackgroundHistological Co-Localization of Iron in A� Plaques of PS/APP Transgenic Mice
Falangola, M. F., Lee, P., Nixon, R. A., Duff, K., & Helpern, J. A. (2005) · Neurochemical Research · doi:10.1007/s11064-004-2442-x · Cited by 122 · cited 1×
“Aβ plaques show iron accumulation [14-20] and it has been suggested that this iron causes the high T2* susceptibility effects [11, 21-23].”
BackgroundMicroglia: The constant gardeners
HUGHES, V. A. (2012) · Nature · doi:10.1038/485570a · Cited by 114 · cited 1×
“2A), morphologically identified as activated microglia [30, 31].”
House, M. J., Pierre, T. G. S., Kowdley, K. V., Montine, T. J., Connor, J. R., Beard, J., Berger, J., Siddaiah, N. B., Shankland, E. G., & Jin, L. (2006) · Magnetic Resonance in Medicine · doi:10.1002/mrm.21118 · Cited by 103 · cited 1×
“Aβ plaques show iron accumulation [14-20] and it has been suggested that this iron causes the high T2* susceptibility effects [11, 21-23].”
BackgroundRemyelination: The True Regeneration of the Central Nervous System
Crawford, A. H., Chambers, C., & Franklin, R. J. M. (2013) · Journal of Comparative Pathology · doi:10.1016/j.jcpa.2013.05.004 · Cited by 101 · cited 1×
“For example, activated microglia have been described to drive the recruitment and proliferation of OPC and their differentiation to oligodendrocytes, as well as the formation of a myelin sheath around available axons [41, 42, 48].”
BackgroundMorphometric Analysis of Microglia in Alzheimerʼs Disease
CARPENTER, A. F., CARPENTER, P. W., & MARKESBERY, W. R. (1993) · Journal of Neuropathology and Experimental Neurology · doi:10.1097/00005072-199311000-00007 · Cited by 94
Schonberg, D., Goldstein, E. Z., Sahinkaya, F. R., Wei, P., Popovich, P., & McTigue, D. (2012) · Journal of Neuroscience · doi:10.1523/jneurosci.3517-11.2012 · Cited by 86 · cited 1×
“Moreover, it is thought that microglia provide the high iron concentrations needed for myelinization and oligodendrocyte differentiation [47, 49, 50].”
BackgroundTayara, N. E. T. E., Delatour, B., Cudennec, C. L., Guégan, M., Volk, A., & Dhénain, M. (2005) · Neurobiology of Disease · doi:10.1016/j.nbd.2005.10.013 · Cited by 85 · cited 1×
“Aβ plaques show iron accumulation [14-20] and it has been suggested that this iron causes the high T2* susceptibility effects [11, 21-23].”
BackgroundHare, D. J., Raven, E. P., Roberts, B. R., Bogeski, M., Portbury, S. D., McLean, C., Masters, C. L., Connor, J. R., Bush, A. I., Crouch, P. J., et al. (2016) · NeuroImage · doi:10.1016/j.neuroimage.2016.05.057 · Cited by 70
Iron is essential for oligodendrocyte genesis following intraspinal macrophage activation
Schonberg, D. L., & McTigue, D. M. (2009) · Experimental Neurology · doi:10.1016/j.expneurol.2009.04.005 · Cited by 66 · cited 1×
“Moreover, it is thought that microglia provide the high iron concentrations needed for myelinization and oligodendrocyte differentiation [47, 49, 50].”
Backgroundvan Duijn, S., Nabuurs, R. J. A., van Duinen, S. G., & Natté, R. (2013) · Journal of Histochemistry & Cytochemistry · doi:10.1369/0022155413501325 · Cited by 61 · cited 4×
“Moreover, we found a diffusely increased iron labelling in layer III-V of the frontal cortex of AD patients in a study comparing different histological iron stains [25].”
BackgroundMethodResultInfluentialCortical phase changes in Alzheimer's disease at 7T MRI: A novel imaging marker
van Rooden, S., Versluis, M. J., Liem, M. K., Milles, J., Maier, A. B., Oleksik, A. M., WEBB, A. G., van Buchem, M. A., & van der Grond, J. (2013) · Alzheimer s & Dementia · doi:10.1016/j.jalz.2013.02.002 · Cited by 57 · cited 3×
“Our previous finding of increased cortical phase shift changes as a possible non-invasive clinical biomarker for AD [7] led us to investigate the following questions: 1) Is the pathological substrate of iron based MRI changes in AD cortex limited to iron accumulation in A plaques or is iron also accumulating in other…”
BackgroundResultHare, D. J., George, J. L., Bray, L., Volitakis, I., Vais, A., Ryan, T. M., Cherny, R. A., Bush, A. I., Masters, C. L., Adlard, P. A., et al. (2013) · Journal of Analytical Atomic Spectrometry · doi:10.1039/c3ja50281c · Cited by 54 · cited 1×
“Fixation and storage of tissue in formalin could lead to leakage of iron [38].”
BackgroundTeller, S., Tahirbegi, I. B., Mir, M., Samitier, J., & Soriano, J. (2015) · Scientific Reports · doi:10.1038/srep17261 · Cited by 54
Meadowcroft, M. D., Connor, J. R., & Yang, Q. X. (2015) · Frontiers in Neuroscience · doi:10.3389/fnins.2015.00255 · Cited by 51 · cited 2×
“In addition to iron, other metals like copper, zinc, magnesium and aluminium have been shown in plaques and have also been implicated in AD and plaque pathogenesis [18, 35-37].”
BackgroundCerebral Amyloidosis: Postmortem Detection with Human 7.0-T MR Imaging System
van Rooden, S., Maat–Schieman, M. L. C., Nabuurs, R. J. A., van der Weerd, L., van Duijn, S., van Duinen, S. G., Natté, R., van Buchem, M. A., & van der Grond, J. (2009) · Radiology · doi:10.1148/radiol.2533090490 · Cited by 49
HFE gene variants, iron, and lipids: a novel connection in Alzheimer’s disease
Ali-Rahmani, F. G., Schengrund, C., & Connor, J. R. (2014) · Frontiers in Pharmacology · doi:10.3389/fphar.2014.00165 · Cited by 43 · cited 1×
“Lastly, besides APOE status, mutations in some iron-regulating genes, such as HFE (hemochromatosis), are also known to associate with age of onset in AD [63].”
BackgroundA novel approach to quantify different iron forms in ex-vivo human brain tissue
Kumar, P., Bulk, M., WEBB, A. G., van der Weerd, L., Oosterkamp, T. H., Huber, M., & Bossoni, L. (2016) · Scientific Reports · doi:10.1038/srep38916 · Cited by 40
Nabuurs, R. J. A., Hegeman, I., Natté, R., van Duinen, S. G., van Buchem, M. A., van der Weerd, L., & Webb, A. G. (2011) · NMR in Biomedicine · doi:10.1002/nbm.1598 · Cited by 39 · cited 5×
“AD-related iron accumulation in other tissue compartments than Aβ plaques is also suggested by the presence of diffuse MRI hypointensities in postmortem AD cortex [19, 24], but the pathologic substrate of these diffuse MRI hypointensities is not known.”
BackgroundResultInfluentialSelf-citation
Research works printed but not linked: 1
- Torsten, 2008, Implementing aClass of Permutation Tests: The coin Package, J Stat Softw, 28, 1
Cited by
Sorted by citations
Metal Toxicity Links to Alzheimer's Disease and Neuroinflammation
Huat, T. J., Camats‐Perna, J., Newcombe, E. A., Valmas, N., Kitazawa, M., & Medeiros, R. (2019) · Journal of Molecular Biology · doi:10.1016/j.jmb.2019.01.018 · Cited by 501
Current understanding of metal ions in the pathogenesis of Alzheimer’s disease
Wang, L., Yin, Y.-L., Liu, X.-Z., Shen, P., Zheng, Y.-G., Lan, X.-R., Lu, C.-B., & Wang, J.-Z. (2020) · Translational Neurodegeneration · doi:10.1186/s40035-020-00189-z · Cited by 454
“An increased iron level is correlated with the amount of Aβ plaques and tau pathologies, and iron increases Aβ toxicity by impeding the ordered aggregation of Aβ [31].”
BackgroundBrain iron is associated with accelerated cognitive decline in people with Alzheimer pathology
Ayton, S., Wang, Y., Diouf, I., Schneider, J. A., Brockman, J. D., Morris, M. C., & Bush, A. I. (2019) · Molecular Psychiatry · doi:10.1038/s41380-019-0375-7 · Cited by 372
The essential elements of Alzheimer’s disease
Lei, P., Ayton, S., & Bush, A. I. (2020) · Journal of Biological Chemistry · doi:10.1074/jbc.rev120.008207 · Cited by 344
Iron and Alzheimer’s Disease: From Pathogenesis to Therapeutic Implications
Liu, J., Fan, Y., Yang, Z., Wang, Z., & Guo, C. (2018) · Frontiers in Neuroscience · doi:10.3389/fnins.2018.00632 · Cited by 289
Metadata
- Authors
- van Duijn, S., Bulk, M., van Duinen, S. G., Nabuurs, R. J. A., van Buchem, M. A., van der Weerd, L., & Natté, R.
- Affiliations
- Department of Pathology, Leiden University Medical Centre, Leiden, The Netherlands
- Leiden University Medical Center (NL)
- Department of Radiology, Leiden University Medical Centre, Leiden, The Netherlands
- Corresponding author
- Natté, Remco
- Venue
- Journal of Alzheimer s Disease
- Publisher
- SAGE Publications
- Published
- 2017-11-07
- Volume
- 60
- Issue
- 4
- Pages
- 1533-1545
- ISSN
- 1387-2877 (ISSN-L)
- 1875-8908
- PMC
- PMC5676973
- OpenAlex
- W2765714249
- Cited by
- 172
- References
- 66
- Citations by year
- 2026: 18 · 2025: 14 · 2024: 24 · 2023: 17 · 2022: 28 · 2021: 22 · 2020: 15 · 2019: 20 · 2018: 13 · 2017: 1
- FWCI
- 9.91
- Type
- journal article
- Language
- en
- Open access
- hybrid
- doi.org
- Licence
- Locations
- Journal of Alzheimer s Disease (publishedVersion, cc-by-nc)
- Europe PMC (PubMed Central) (publishedVersion, cc-by-nc)
- PubMed Central (publishedVersion, cc-by-nc)
- PubMed (publishedVersion)
- Leiden Repository (Leiden University) (submittedVersion)
- Data Archiving and Networked Services (DANS) (submittedVersion, other-oa)
- Funders
- FP7 People: Marie-Curie Actions (612360, FP7-PEOPLE-2013-IAPP, FP7-PEOPLE-2013)
- Topics
- Life Sciences › Neuroscience › Cellular and Molecular Neuroscience › Alzheimer's disease research and treatments
- Health Sciences › Medicine › Psychiatry and Mental health › Dementia and Cognitive Impairment Research
- Life Sciences › Neuroscience › Neurology › Neurological diseases and metabolism
- Keywords
- Alzheimer's disease
- MeSH terms
- Adolescent, Adult, Aged, Aged, 80 and over, Aging, Alzheimer Disease, Female, Frontal Lobe, Humans, Immunohistochemistry, Iron, Male, Middle Aged, Myelin Sheath, Severity of Illness Index, tau Proteins, Young Adult, Plaque, Amyloid
About these checks
Registry, retraction, Cites and statistics results are computed, not judged, with one exception: a printed reference that no index lists is read once by a model before it counts as a citation error. Claims are extracted by a model and kept only when their quote appears verbatim in the text; each cited source is then checked, with a model’s help, for whether it says what the claim relies on. Those verdicts can be wrong — read the claim’s quote and the cited source before relying on one.
Statistics and arithmetic are recomputed, not judged.
Confidence bands are shown only for fields calibrated on our annotated test set. None is calibrated yet, so no band is shown.
What counts as a claim ›How we measure confidence ›How we check this ›
Are you an author, or do you see a problem with this page? Request a review
