

The DOI matches its Crossref record; 91 of the 91 references it cites were found in a registry or an index; 1 of the 41 sources its claims cite were checked for support.
A scalable in vitro cell competition model identifies preleukemic super competitor clones
Open accessAbstract
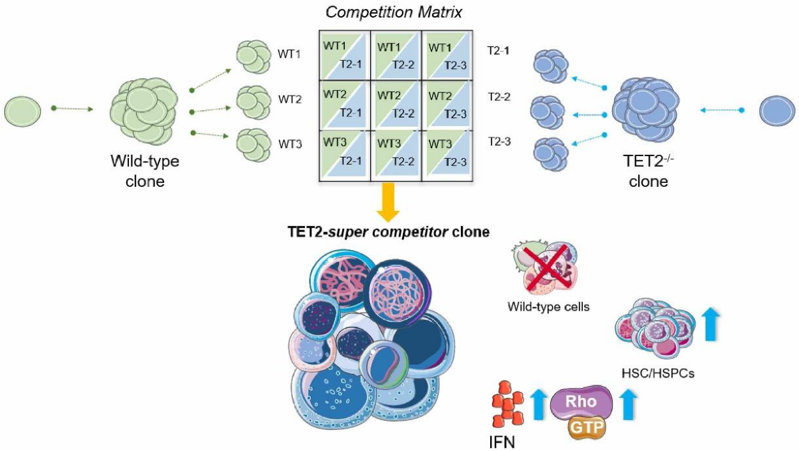
Preleukemic and leukemic conditions are frequently characterized by the acquisition of recurrent genetic mutations in hematopoietic stem cells (HSCs). One of the most frequently mutated genes in both clonal hematopoiesis and myeloid malignancies is the ten-eleven translocation 2 (TET2) gene, which encodes an epigenetic enzyme with a critical role in the regulation of gene transcription. While substantial work has shown that TET2 loss-of-function mutations lead to a clonal advantage, the underpinning cellular mechanism remains unclear, especially with respect to the early interactions with other cells. To study these early cell interactions of mutant and non-mutant cells, we developed an in vitro clonal competition platform where single-cell derived cultures are split into subclonal fractions which can be simultaneously cross-competed against multiple different clones of an opposing genotype. We identify a novel preleukemic cell phenotype that parallels the developmental biology phenomenon of super-competition, whereby ∼10% of TET2-mutant clones actively and selectively suppress wild type (WT) cell expansion and, in some cases, completely eliminate WT clones. Molecular profiling and functional assays point to RAC1-GEF signalling inhibition as a specific WT cell vulnerability that is promoted, and tolerated, by neighbouring TET2-mutated clones. In addition to pinpointing selective drivers of non-mutant cell suppression, this clonal competition platform offers a broadly applicable new approach to study cell competition dynamics at an unprecedented scale. Abstract Figure: Key points: Split clonal culture system allows for the modelling of clonal competition in vitro between a single clone against multiple clones of an opposing genotype A subset of TET2-mutant HSCs are “super competitors”, actively suppressing wild-type cells. TET2-super competitors increase phenotypic HSCs and tolerate Rac1-GEF signalling disruption.
Overview
CoChat Summary
Written by AI from the paper’s full text.
TL;DR
The paper develops a scalable split-clone in vitro competition assay and uses it to identify a subset of TET2-mutant HSCs as “super competitors” that actively suppress wild-type cells. Molecular profiling implicates inflammatory/cell-adhesion programs and Rac1/GEF signaling, with Rac1 inhibition selectively impairing WT while TET2-mutant cells tolerate it.
Key findings
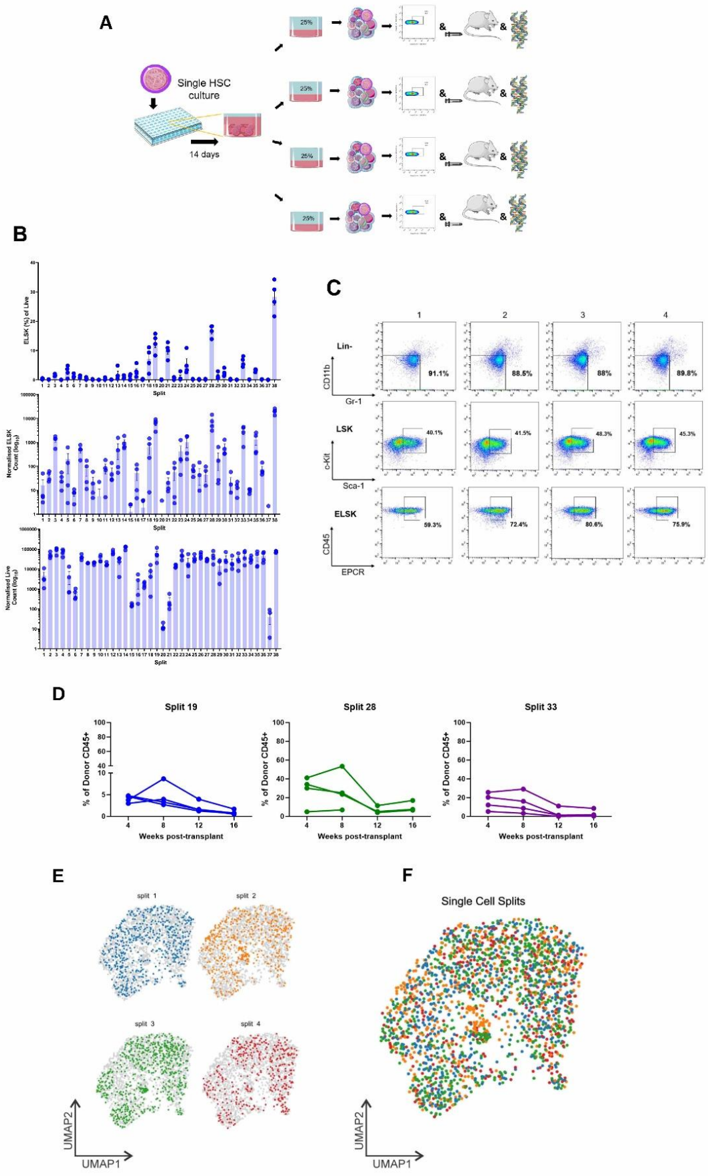
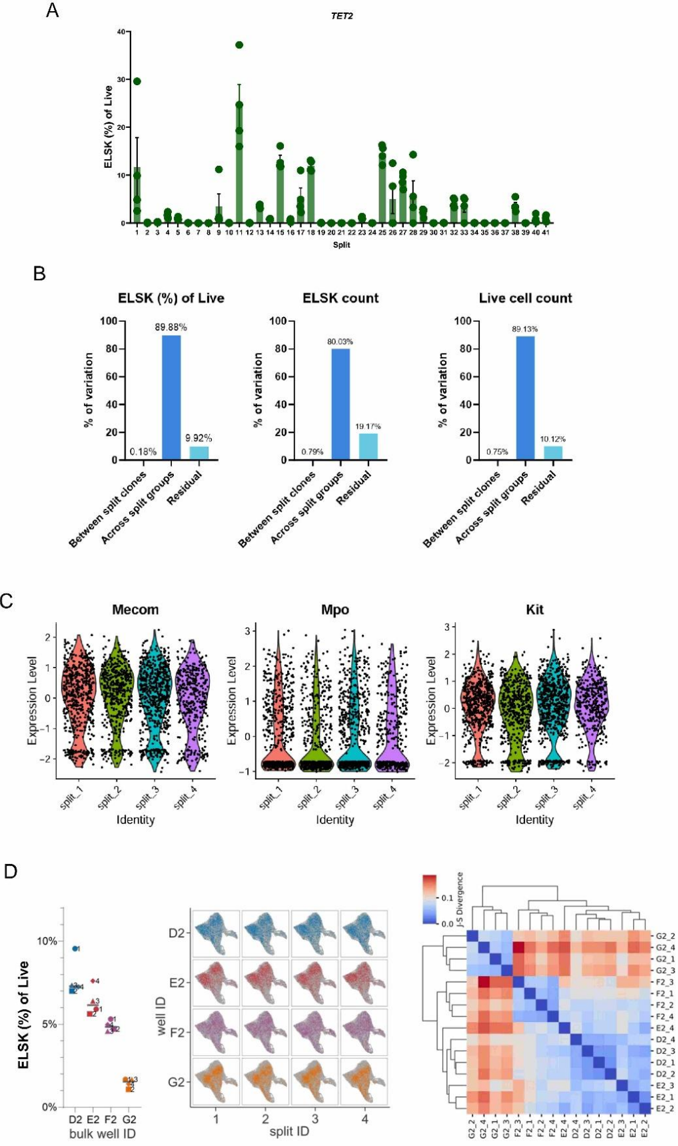
- Split HSC clones into four sister wells were phenotypically, functionally, and molecularly equivalent: ICC for ELSK frequencies was 0.90, ELSK counts 0.80, and viable cell counts 0.89 across 38 parent HSC clones; ANOVA attributed 89.88%, 80.03%, and 89.13% of variation, respectively, to between-culture differences.
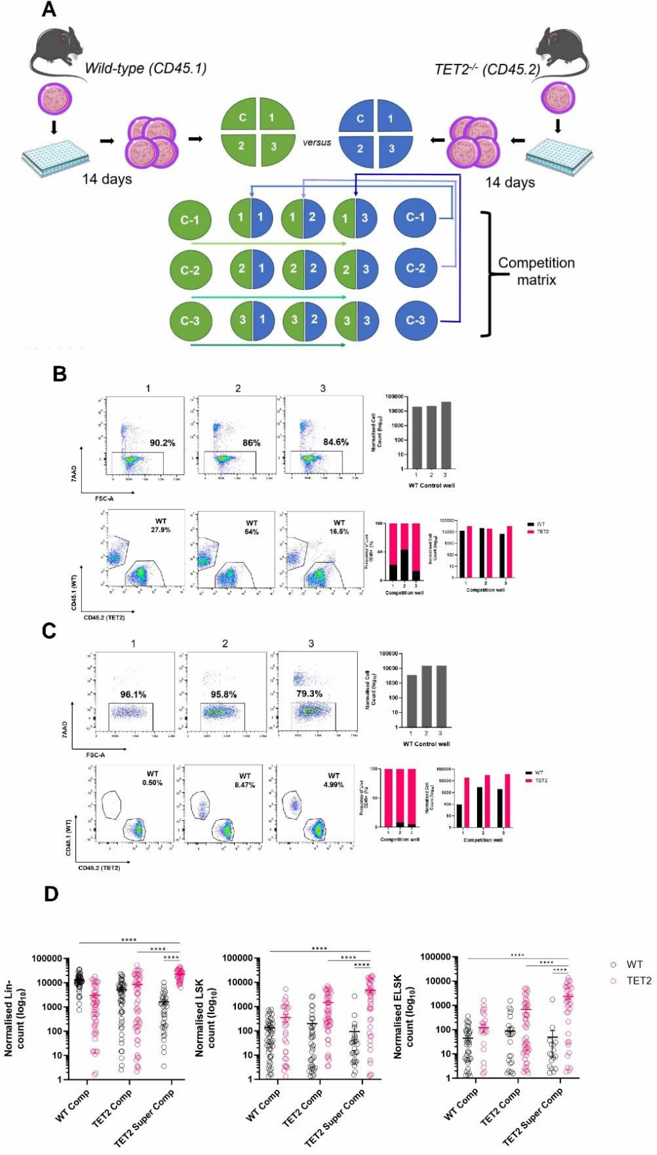
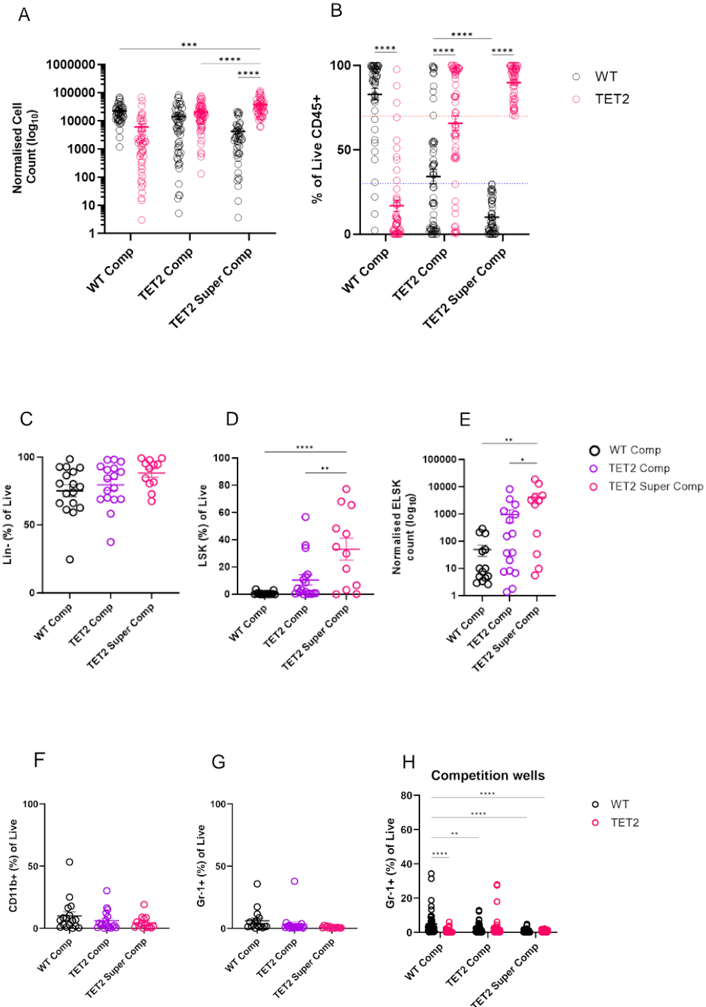
- In 140 competition matrices comprising 420 WT and 420 TET2 individual HSC-initiated clones over 1,260 competition wells, 68.67% of TET2-/- clones preferentially outcompeted WT clones. About 10% of clones (83 of 840) outcompeted all three opposing-genotype wells; most were TET2-/- (~70%), and a subset (n=27) outgrew all three competitors by >70:30.
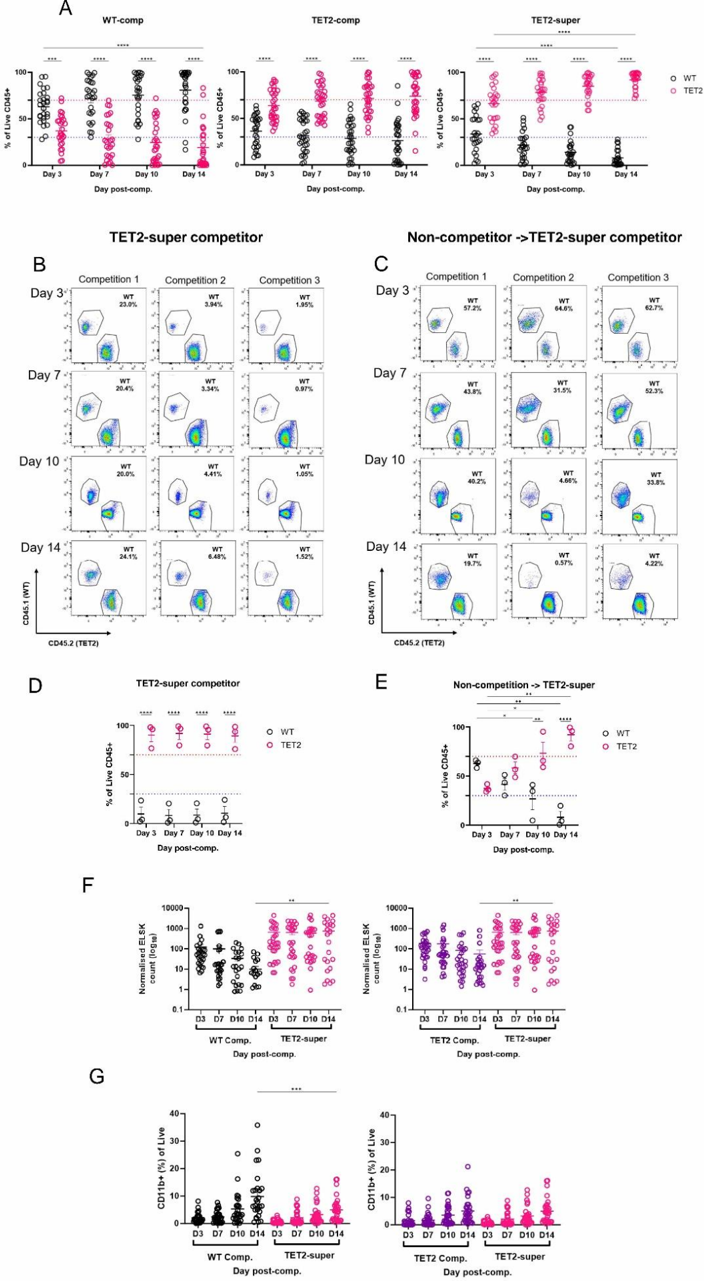
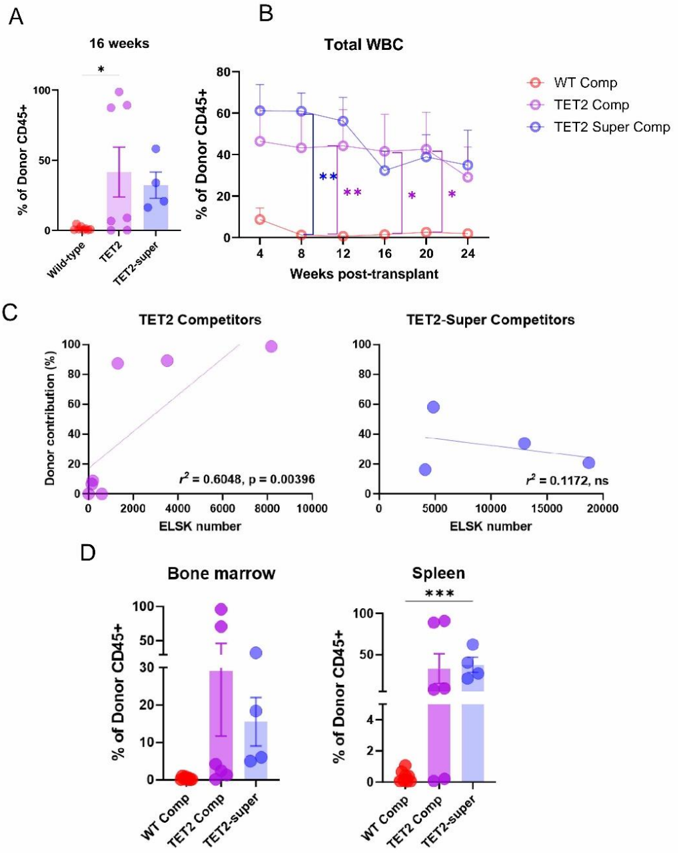
- TET2-super competitor clones actively suppressed WT cells: WT sister-well cell production was >20-fold reduced versus a standard competition well, and WT cell number was approximately 10-fold lower when co-cultured with a TET2-super competitor. ELSK numbers showed WT cells outnumbered ~20-fold by TET2 competitors and ~80-fold by TET2-super competitors.
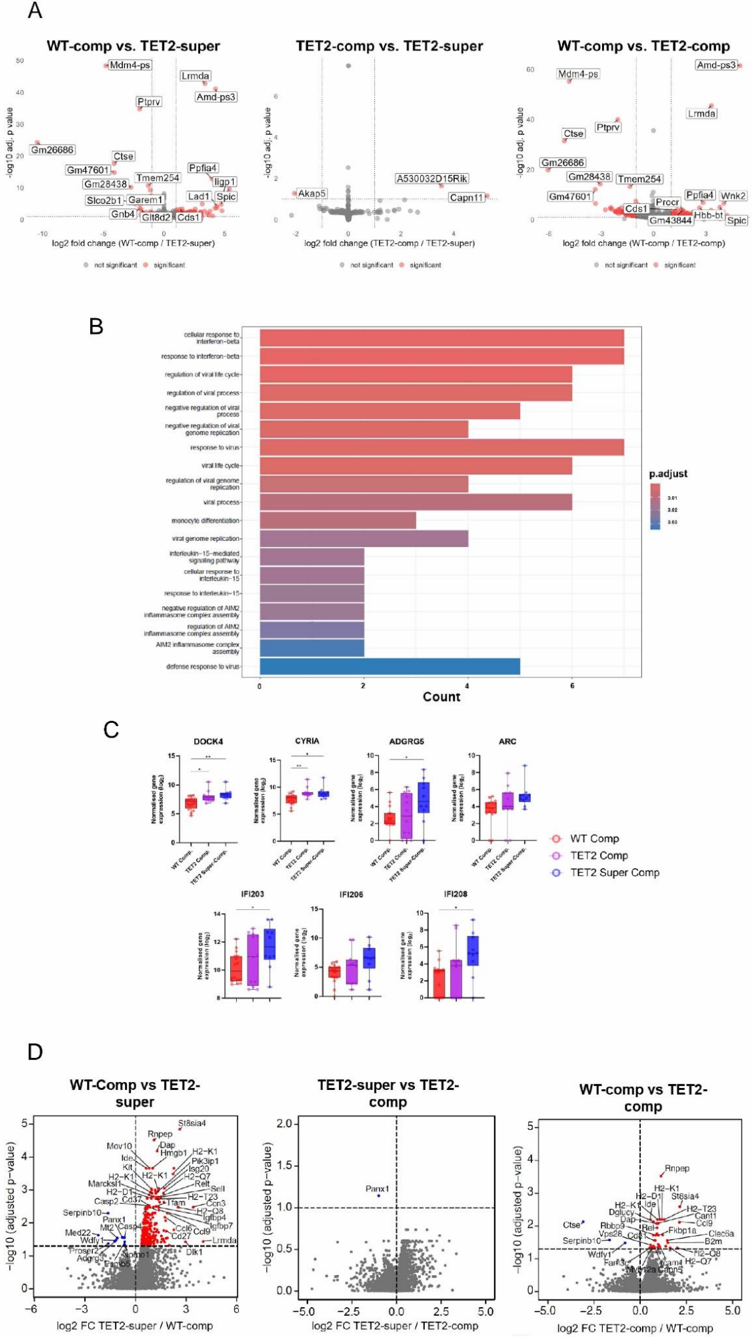
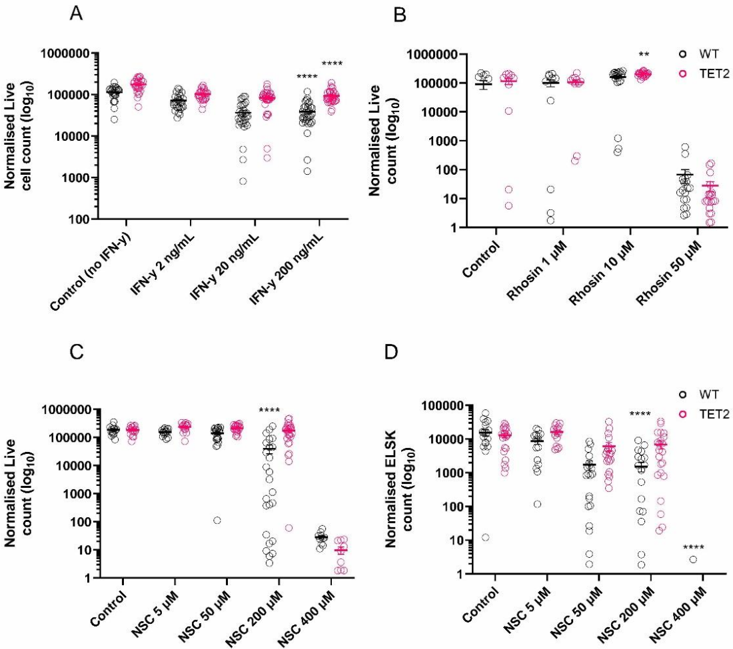
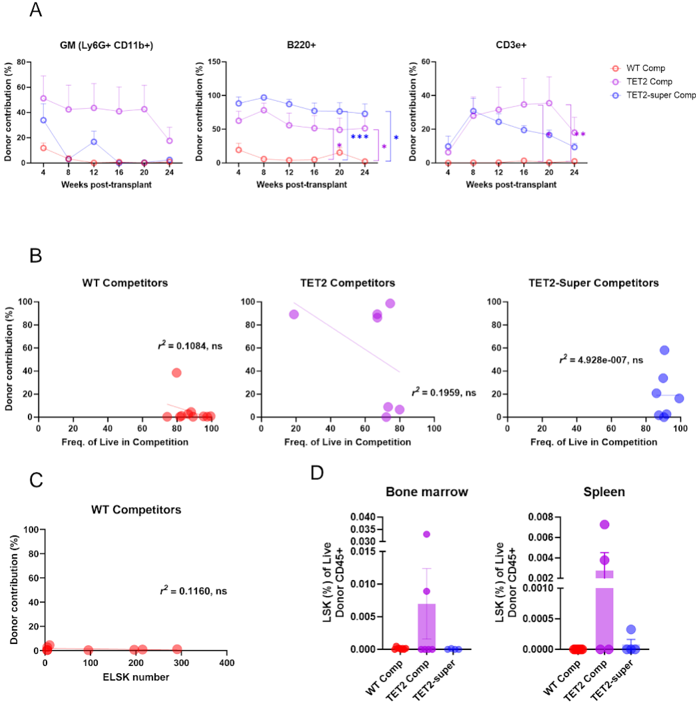
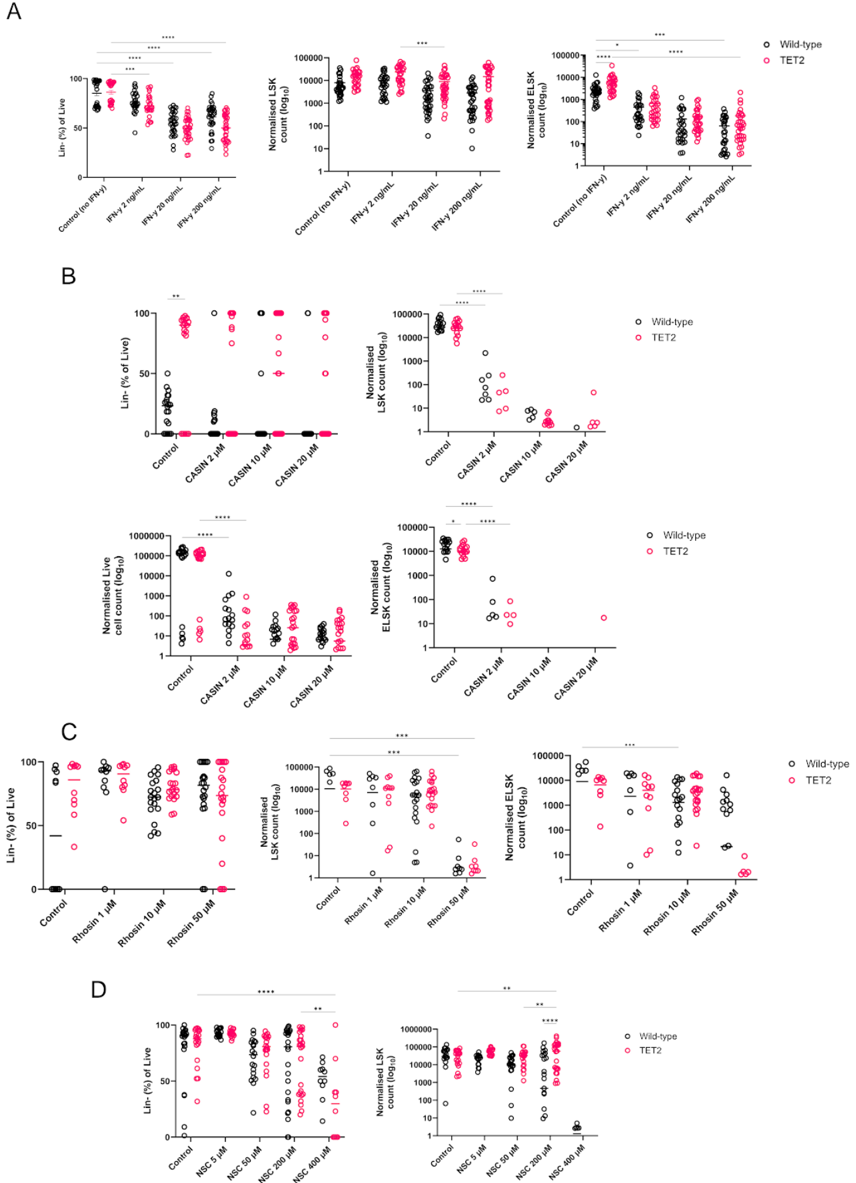
- In vivo, only TET2-super competitor recipients had 100% repopulation at 16 weeks, versus 62.5% for WT competitors and 71.42% for TET2 competitors. TET2-super competitors also showed elevated inflammatory/cell-adhesion molecules, and the Rac1/GEF inhibitor NSC-23766 at 200 μM produced 4.42-fold fewer WT cells than TET2-/- cultures and reduced phenotypic HSCs 4.45-fold.
Methods
- Single ESLAM HSCs (CD45+EPCR+CD150+CD48−) from WT (CD45.1) or TET2−/− (CD45.2) mice were expanded for 14 days, split into four sister wells, and expanded for a further 14 days. One sister well remained a control; three were co-cultured 1:1 with sister wells from the opposing genotype in a 3×3 competition matrix.
- Readouts included flow cytometry, single-cell RNA-sequencing, bulk RNA-sequencing, data-independent acquisition mass spectrometry of supernatants, in vivo HSC transplantation, and in vitro validation with Rho-GTPase inhibitors or recombinant proteins.
- Analyses included intraclass correlation coefficients, one-way/two-way ANOVA, DESeq2 differential expression, KEGG/GO enrichment, DeepLoc protein localization, and linear regression.
Limitations
- Paper-stated: IFN-γ treatment was toxic to both WT and TET2−/− cells and therefore not selective enough to drive the supercompetitor phenotype; functional studies did not reveal genotype-specific differences in expansion cultures, which the authors say warrants further testing. The authors also note that NSC-23766 has reported off-target effects on platelets in a Rac1−/− setting, which might affect interpretation.
- Evident from the text: the model is mouse TET2−/− HSC culture, not human clonal hematopoiesis; in vivo supercompetitor validation used a small recipient number (n=4 for TET2-super), and the supercompetitor phenotype was heterogeneous, with six of eight clones changing phenotype over time and classification depending on >70:30 dominance plus active suppression.
Model-written summary. Check it against the paper before relying on it.
Integrity signals
Registry
Cites
Statistics
Figures
Verification
Claims the paper makes
76 Own result · 19 Own interpretation · 11 Check pending · 5 Not checked yet · 2 No full text of the sources · 2 Own method · 1 Partly supported · 1 Sources not found · accuracy not yet measured
The cited sources support only part of this claim — read each source’s verdict below.
In the paper
“The intraclass correlation coefficient (ICC) of ELSK frequencies was 0.90, demonstrating strong consistency across split fractions of 38 parent HSC clones”
§ A scalable in vitro cell competition model identifies preleukemic super competitor clones > Split clones are phenotypically, functionally and molecularly equivalent
What the sources say
- Partly supportedcites Koo & Li, 2016 sourceExperimental — accuracy not yet measured
The ICC Interpretation passage supports treating an ICC of 0.90 as indicating good reliability under the authors’ suggested conditions. The Conclusion cautions that reliability should be evaluated using the ICC’s 95% confidence interval. Neither passage reports ELSK frequencies, split fractions, 38 parent HSC clones, or an ICC calculated from those data. (LLM, conf=0.88)
boostedstates an association- Asserted: passes — The authors put it forward as true.
- Checkable: passes — It can be checked against evidence.
- Load-bearing: passes — The paper’s conclusions depend on it.
- Based: passes — The paper gives a reason why it holds.
- Partly supported
In the paper
“We next evaluated expression levels of genes commonly detected in ex vivo-expanded HSCs (Supplementary Figure 1C) where, again, sister wells had equivalent expression associated with HSC functionality and myeloid differentiation, such as Mecom (Voit et al, 2023), Mpo (Nauseef et al, 1988), and Kit.”
§ A scalable in vitro cell competition model identifies preleukemic super competitor clones > Split clones are phenotypically, functionally and molecularly equivalent
What the sources say
- Not matchedcites Voit et al, 2023
Couldn’t be matched to a paper in Crossref, so it can’t be checked.
- Check pendingcites Nauseef et al, 1988 source
plainSingle case- Asserted: passes — The authors put it forward as true.
- Checkable: passes — It can be checked against evidence.
- Load-bearing: passes — The paper’s conclusions depend on it.
- Based: passes — The paper gives a reason why it holds.
- Not matched
A result the paper reports from its own data — it cites no other source for it, so there is none to check. The quote shows it is in the paper.
In the paper
“Particularly striking were a set of TET2 -/-clones which we term “super competitors” where, despite WT sister control wells having normal cell proliferation capacity and starting cell numbers, the TET2-super competitor clone actively suppressed all three WT sister wells when cultured alongside them”
§ A scalable in vitro cell competition model identifies preleukemic super competitor clones > TET2 clones can exhibit a super-competitor phenotype characterized by active elimination of WT cells
plainstates a causen = 27- Asserted: passes — The authors put it forward as true.
- Checkable: passes — It can be checked against evidence.
- Load-bearing: passes — The paper’s conclusions depend on it.
- Based: passes — The paper gives a reason why it holds.
A result the paper reports from its own data — it cites no other source for it, so there is none to check. The quote shows it is in the paper.
In the paper
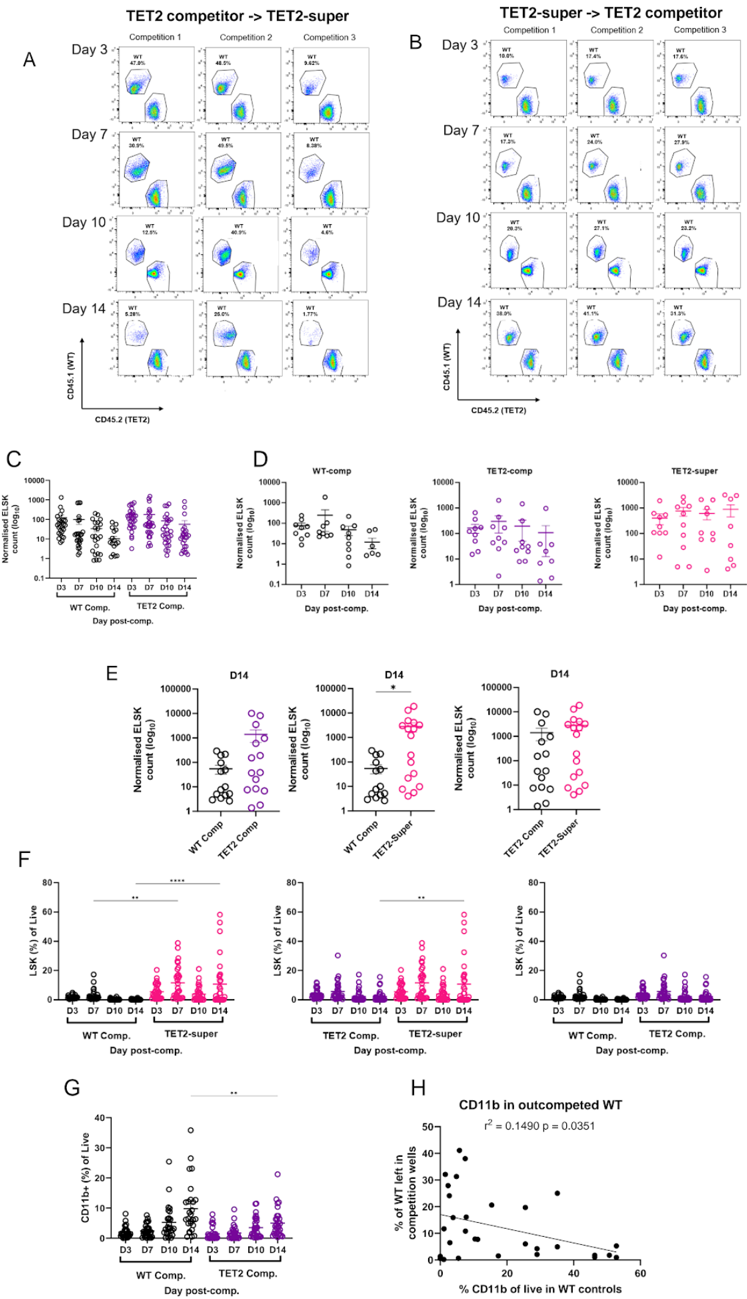
“In contrast, WT competitors contained a higher proportion of CD11b + cells”
§ A scalable in vitro cell competition model identifies preleukemic super competitor clones > Kinetics of acquiring the super competitor phenotype
plainstates an association- Asserted: passes — The authors put it forward as true.
- Checkable: passes — It can be checked against evidence.
- Load-bearing: unclear — It is unclear whether the paper’s conclusions depend on it.
- Based: passes — The paper gives a reason why it holds.
A result the paper reports from its own data — it cites no other source for it, so there is none to check. The quote shows it is in the paper.
In the paper
“We also compared mature cells in the sister WT controls of suppressed clones (i.e., WT clones that “lost” to the TET2-super competitor clones) and found that higher numbers of CD11b + cells in the control sister wells correlated with poor performance of the sister well against TET2 super-competitor cells”
§ A scalable in vitro cell competition model identifies preleukemic super competitor clones > Kinetics of acquiring the super competitor phenotype
plainstates an association- Asserted: passes — The authors put it forward as true.
- Checkable: passes — It can be checked against evidence.
- Load-bearing: unclear — It is unclear whether the paper’s conclusions depend on it.
- Based: passes — The paper gives a reason why it holds.
- It may state two separate claims as one. 28
- Probably not a substantial claim. 11
- The quote only partly states this claim. 1
Create a free account to see these claims.
Create a free account to see these assumptions.
76 more claims
Create a free account to see all 117 claims and to verify the 21 references still open.
Self-check
Percentages, sums and reported differences re-computed from the paper’s own numbers.
Each contradiction between two passages listed here was confirmed by an independent check.
Rated minor: it would not touch a result — a value no result rests on, a p-value that stays on the same side of the significance level, or a conflict that is clerical, resolved elsewhere in the paper, or outside its own findings.
In the paper
“A total of 30 clones (17 WT, 13 TET2, and 10 TET2-super competitor clones) were analysed”
§ A scalable in vitro cell competition model identifies preleukemic super competitor clones > Figure 5 -TET2-super competitors have elevated inflammatory and cell adhesion-related molecules. A)
Reported 30 · recomputed 40
Rated minor: it would not touch a result — a value no result rests on, a p-value that stays on the same side of the significance level, or a conflict that is clerical, resolved elsewhere in the paper, or outside its own findings.
In the paper
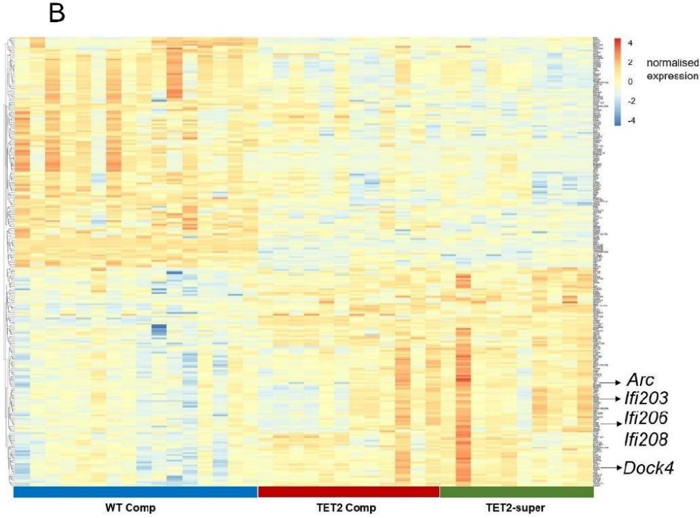
§ A scalable in vitro cell competition model identifies preleukemic super competitor clones > Upregulation of inflammatory pathways and cell adhesion molecules in TET2-super competitors
“we filtered the globally top 250 expressed genes across all competitor clones (Supplementary Figure 5B and Supplementary Table 1)”
§ A scalable in vitro cell competition model identifies preleukemic super competitor clones > Discussion
“B) Heatmap of the top 200 expressed genes across competitor types.”
Citations
Cites
Moderated estimation of fold change and dispersion for RNA-seq data with DESeq2
Love, M. I., Huber, W., & Anders, S. (2014) · Genome Biology · doi:10.1186/s13059-014-0550-8 · Cited by 95,106
Cutadapt removes adapter sequences from high-throughput sequencing reads
Martin, M. (2011) · EMBnet.journal · doi:10.14806/ej.17.1.200 · Cited by 33,889
A guideline of selecting and reporting intraclass correlation coefficients for reliability research
Koo, T. K., & Li, M. Y. (2016) · Journal of Chiropractic Medicine · doi:10.1016/j.jcm.2016.02.012 · Cited by 31,709
HTSeq—a Python framework to work with high-throughput sequencing data
Anders, S., Pyl, P. T., & Huber, W. (2015) · Bioinformatics · doi:10.1093/bioinformatics/btu638 · Cited by 21,464
SCANPY: large-scale single-cell gene expression data analysis
Wolf, F. A., Angerer, P., & Theis, F. J. (2018) · Genome Biology · doi:10.1186/s13059-017-1382-0 · Cited by 8,881
From Louvain to Leiden: guaranteeing well-connected communities
Traag, V. A., Waltman, L., & van Eck, N. J. (2019) · Scientific Reports · doi:10.1038/s41598-019-41695-z · Cited by 5,635
Age-related clonal hematopoiesis associated with adverse outcomes
Jaiswal, S., Fontanillas, P., Flannick, J., Manning, A., Grauman, P. V., Mar, B. G., Lindsley, R. C., Mermel, C. H., Burtt, N., Chavez, A., et al. (2014) · New England Journal of Medicine · doi:10.1056/nejmoa1408617 · Cited by 4,841
Genomic classification and prognosis in acute myeloid leukemia
Papaemmanuil, E., Gerstung, M., Bullinger, L., Gaidzik, V. I., Paschka, P., Roberts, N. D., Potter, N. E., Heuser, M., Thol, F., Bolli, N., et al. (2016) · New England Journal of Medicine · doi:10.1056/nejmoa1516192 · Cited by 4,350
Scrublet: computational identification of cell doublets in single-cell transcriptomic data
Wolock, S. L., Lopez, R., & Klein, A. M. (2019) · Cell Systems · doi:10.1016/j.cels.2018.11.005 · Cited by 2,758
Clinical and biological implications of driver mutations in myelodysplastic syndromes
Papaemmanuil, E., Gerstung, M., Malcovati, L., Tauro, S., Gundem, G., Van Loo, P., Yoon, C. J., Ellis, P., Wedge, D. C., Pellagatti, A., et al. (2013) · Blood · doi:10.1182/blood-2013-08-518886 · Cited by 1,832
Mutation in TET2 in Myeloid Cancers
Delhommeau, F., Dupont, S., Valle, V. D., James, C., Trannoy, S., Massé, A., Kosmider, O., Le Couedic, J.-P., Robert, F., Alberdi, A., et al. (2009) · New England Journal of Medicine · doi:10.1056/nejmoa0810069 · Cited by 1,776
Tet2 loss leads to increased hematopoietic stem cell self-renewal and myeloid transformation
Moran-Crusio, K., Reavie, L., Shih, A., Abdel-Wahab, O., Ndiaye-Lobry, D., Lobry, C., Figueroa, M. E., Vasanthakumar, A., Patel, J., Zhao, X., et al. (2011) · Cancer Cell · doi:10.1016/j.ccr.2011.06.001 · Cited by 1,339
Dnmt3a is essential for hematopoietic stem cell differentiation
Challen, G. A., Sun, D., Jeong, M., Luo, M., Jelinek, J., Berg, J. S., Bock, C., Vasanthakumar, A., Gu, H., Xi, Y., et al. (2012) · Nature Genetics · doi:10.1038/ng.1009 · Cited by 1,122
Lun, A. T. L., Riesenfeld, S. J., Andrews, T. S., Dao, T. P., Gomes, T., Jamboree, P. I. T. 1. H. C. A., & Marioni, J. C. (2019) · Genome biology · doi:10.1186/s13059-019-1662-y · Cited by 1,108
Lineage tracing on transcriptional landscapes links state to fate during differentiation
Weinreb, C., Rodriguez-Fraticelli, A., Camargo, F. D., & Klein, A. M. (2020) · Science · doi:10.1126/science.aaw3381 · Cited by 759
Ko, M., Bandukwala, H. S., An, J., Lamperti, E. D., Thompson, E. C., Hastie, R., Tsangaratou, A., Rajewsky, K., Koralov, S. B., & Rao, A. (2011) · Proceedings of the National Academy of Sciences · doi:10.1073/pnas.1112317108 · Cited by 616
Cdc42 activity regulates hematopoietic stem cell aging and rejuvenation
Florian, M. C., Dörr, K., Niebel, A., Daria, D., Schrezenmeier, H., Rojewski, M., Filippi, M.-D., Hasenberg, A., Gunzer, M., Scharffetter-Kochanek, K., et al. (2012) · Cell Stem Cell · doi:10.1016/j.stem.2012.04.007 · Cited by 564
Effect of Mutation Order on Myeloproliferative Neoplasms
Ortmann, C. A., Kent, D. G., Nangalia, J., Silber, Y., Wedge, D. C., Grinfeld, J., Baxter, E. J., Massie, C. E., Papaemmanuil, E., Menon, S., et al. (2015) · New England Journal of Medicine · doi:10.1056/nejmoa1412098 · Cited by 562
Self-citationLeukemia-associated somatic mutations drive distinct patterns of age-related clonal hemopoiesis
McKerrell, T., Park, N., Moreno, T., Grove, C. S., Ponstingl, H., Stephens, J., Crawley, C., Craig, J., Scott, M. A., Hodkinson, C., et al. (2015) · Cell Reports · doi:10.1016/j.celrep.2015.02.005 · Cited by 534
Wilson, N. K., Kent, D. G., Buettner, F., Shehata, M., Macaulay, I. C., Calero-Nieto, F. J., Sánchez Castillo, M., Oedekoven, C. A., Diamanti, E., Schulte, R., et al. (2015) · Cell Stem Cell · doi:10.1016/j.stem.2015.04.004 · Cited by 466
Self-citationClonal Hematopoiesis and Evolution to Hematopoietic Malignancies
Bowman, R. L., Busque, L., & Levine, R. L. (2018) · Cell stem cell · doi:10.1016/j.stem.2018.01.011 · Cited by 448
The evolutionary dynamics and fitness landscape of clonal hematopoiesis
Watson, C. J., Papula, A. L., Poon, G. Y. P., Wong, W. H., Young, A. L., Druley, T. E., Fisher, D. S., & Blundell, J. R. (2020) · Science · doi:10.1126/science.aay9333 · Cited by 444
Long-term ex vivo haematopoietic-stem-cell expansion allows nonconditioned transplantation
Wilkinson, A. C., Ishida, R., Kikuchi, M., Sudo, K., Morita, M., Crisostomo, R. V., Yamamoto, R., Loh, K. M., Nakamura, Y., Watanabe, M., et al. (2019) · Nature · doi:10.1038/s41586-019-1244-x · Cited by 411
Diverse and heritable lineage imprinting of early haematopoietic progenitors
Naik, S. H., Perié, L., Swart, E., Gerlach, C., van Rooij, N., de Boer, R. J., & Schumacher, T. N. (2013) · Nature · doi:10.1038/nature12013 · Cited by 408
The longitudinal dynamics and natural history of clonal haematopoiesis
Fabre, M. A., de Almeida, J. G., Fiorillo, E., Mitchell, E., Damaskou, A., Rak, J., Orrù, V., Marongiu, M., Chapman, M. S., Vijayabaskar, M. S., et al. (2022) · Nature · doi:10.1038/s41586-022-04785-z · Cited by 374
Self-citationKent, D. G., Copley, M. R., Benz, C., Wöhrer, S., Dykstra, B. J., Ma, E., Cheyne, J., Zhao, Y., Bowie, M. B., Zhao, Y. S., et al. (2009) · Blood · doi:10.1182/blood-2008-12-192054 · Cited by 354
Self-citationp53-Mediated Hematopoietic Stem and Progenitor Cell Competition
Bondar, T., & Medzhitov, R. (2010) · Cell Stem Cell · doi:10.1016/j.stem.2010.03.002 · Cited by 342
Intrinsic and extrinsic control of haematopoietic stem-cell self-renewal
Zon, L. I. (2008) · Nature · doi:10.1038/nature07038 · Cited by 301
DeepLoc 2.1: multi-label membrane protein type prediction using protein language models
Ødum, M. T., Teufel, F., Thumuluri, V., Almagro Armenteros, J. J., Johansen, A. R., Winther, O., & Nielsen, H. (2024) · Nucleic Acids Research · doi:10.1093/nar/gkae237 · Cited by 285
Loss of Dnmt3a Immortalizes Hematopoietic Stem Cells In Vivo
Jeong, M., Park, H. J., Celik, H., Ostrander, E. L., Reyes, J. M., Guzman, A., Rodriguez, B., Lei, Y., Lee, Y., Ding, L., et al. (2018) · Cell Reports · doi:10.1016/j.celrep.2018.03.025 · Cited by 243
Disparate differentiation in mouse hemopoietic colonies derived from paired progenitors.
Suda, T., Suda, J., & Ogawa, M. (1984) · Proceedings of the National Academy of Sciences · doi:10.1073/pnas.81.8.2520 · Cited by 231
ABCA Transporter Gene Expression and Poor Outcome in Epithelial Ovarian Cancer
Hedditch, E. L., Gao, B., Russell, A. J., Lu, Y., Emmanuel, C., Beesley, J., Johnatty, S. E., Chen, X., Harnett, P. R., George, J., et al. (2014) · JNCI Journal of the National Cancer Institute · doi:10.1093/jnci/dju149 · Cited by 224
Allorecognition by T Lymphocytes and Allograft Rejection
Marino, J., Paster, J., & Benichou, G. (2016) · Frontiers in Immunology · doi:10.3389/fimmu.2016.00582 · Cited by 221
Intermediate-Term Hematopoietic Stem Cells with Extended but Time-Limited Reconstitution Potential
Benveniste, P., Frelin, C., Janmohamed, S., Barbara, M., Herrington, R., Hyam, D., & Iscove, N. N. (2010) · Cell Stem Cell · doi:10.1016/j.stem.2009.11.014 · Cited by 216
Discovery of the Philadelphia chromosome: a personal perspective
Nowell̀, P. C. (2007) · Journal of Clinical Investigation · doi:10.1172/jci31771 · Cited by 213
Cell Competition and Its Role in the Regulation of Cell Fitness from Development to Cancer
Gregorio, A. D., Bowling, S., & Rodríguez, T. A. (2016) · Developmental Cell · doi:10.1016/j.devcel.2016.08.012 · Cited by 186
Clonal evolution in hematological malignancies and therapeutic implications
Landau, D. A., Carter, S. L., Getz, G. A., & Wu, C. J. (2013) · Leukemia · doi:10.1038/leu.2013.248 · Cited by 173
Irradiation selects for p53-deficient hematopoietic progenitors.
Marusyk, A., Porter, C. C., Zaberezhnyy, V., & DeGregori, J. (2010) · PLoS Biology · doi:10.1371/journal.pbio.1000324 · Cited by 151
de la Cova, C., Senoo‐Matsuda, N., Ziosi, M., Wu, D. C., Bellosta, P., Quinzii, C. M., & Johnston, L. A. (2014) · Cell Metabolism · doi:10.1016/j.cmet.2014.01.012 · Cited by 140
Intrinsic and extrinsic control of hemopoietic stem cell numbers: mapping of a stem cell gene
Haan, G. D., & Zant, G. V. (1997) · The Journal of Experimental Medicine · doi:10.1084/jem.186.4.529 · Cited by 134
The constitutive activity of the adhesion GPCR GPR114/ADGRG5 is mediated by its tethered agonist
Wilde, C., Fischer, L., Lede, V., Kirchberger, J., Rothemund, S., Schöneberg, T., & Liebscher, I. (2015) · The FASEB Journal · doi:10.1096/fj.15-276220 · Cited by 130
Suda, J., Suda, T., & Ogawa, M. (1984) · Blood · doi:10.1182/blood.v64.2.393.393 · Cited by 128
Long-term ex vivo expansion of mouse hematopoietic stem cells
Wilkinson, A. C., Ishida, R., Nakauchi, H., & Yamazaki, S. (2020) · Nature Protocols · doi:10.1038/s41596-019-0263-2 · Cited by 125
Ferrando, A. A., & López-Otín, C. (2017) · Nature Medicine · doi:10.1038/nm.4410 · Cited by 120
Fam49/CYRI interacts with Rac1 and locally suppresses protrusions
Fort, L., Batista, J. M., Thomason, P. A., Spence, H. J., Whitelaw, J. A., Tweedy, L., Greaves, J., Martin, K. J., Anderson, K. I., Brown, P., et al. (2018) · Nature Cell Biology · doi:10.1038/s41556-018-0198-9 · Cited by 98
Dock4 is regulated by RhoG and promotes Rac-dependent cell migration
Hiramoto, K., Negishi, M., & Katoh, H. (2006) · Experimental Cell Research · doi:10.1016/j.yexcr.2006.09.006 · Cited by 96
McClatchy, J., Strogantsev, R., Wolfe, E., Lin, H. Y., Mohammadhosseini, M., Davis, B. A., Eden, C., Goldman, D., Fleming, W. H., Conley, P., et al. (2023) · Nature Communications · doi:10.1038/s41467-023-43697-y · Cited by 95
Quiescence regulators for hematopoietic stem cell
Li, J. (2011) · Experimental Hematology · doi:10.1016/j.exphem.2011.01.008 · Cited by 93
Clonality in context: hematopoietic clones in their marrow environment
Cooper, J. N., & Young, N. S. (2017) · Blood · doi:10.1182/blood-2017-07-794362 · Cited by 87
Biosynthesis and processing of myeloperoxidase — A marker for myeloid cell differentiation
Nauseef, W. M., Olsson, I., & Arnljots, K. (1988) · European Journal of Haematology · doi:10.1111/j.1600-0609.1988.tb00805.x · Cited by 85
Dütting, S., Heidenreich, J., Cherpokova, D., Amin, E., Zhang, S. ‐., Ahmadian, M. R., Brakebusch, C., & Nieswandt, B. (2015) · Journal of Thrombosis and Haemostasis · doi:10.1111/jth.12861 · Cited by 81
A genetic disorder reveals a hematopoietic stem cell regulatory network co-opted in leukemia
Voit, R. A., Tao, L., Yu, F., Cato, L. D., Cohen, B., Fleming, T. J., Antoszewski, M., Liao, X., Fiorini, C., Nandakumar, S. K., et al. (2022) · Nature Immunology · doi:10.1038/s41590-022-01370-4 · Cited by 75
Kent, D. G., Dykstra, B. J., Cheyne, J., Ma, E., & Eaves, C. J. (2008) · Blood · doi:10.1182/blood-2007-10-117820 · Cited by 67
Self-citationDisparate differentiation in hemopoietic colonies derived from human paired progenitors
Leary, A., Strauss, L., Civin, C., & Ogawa, M. (1985) · Blood · doi:10.1182/blood.v66.2.327.327 · Cited by 65
High-precision targeting workflow for volume electron microscopy
Ronchi, P., Mizzon, G., Machado, P., D’Imprima, E., Best, B. T., Cassella, L., Schnorrenberg, S., Montero, M. G., Jechlinger, M., Ephrussi, A., et al. (2021) · The Journal of Cell Biology · doi:10.1083/jcb.202104069 · Cited by 62
Identification and characterization of in vitro expanded hematopoietic stem cells
James, L. C., Bode, D., Kuciński, I., Cull, A. H., Bain, F. M., Becker, H., Jassinskaja, M., Barile, M., Boyd, G., Belmonte, M., et al. (2022) · EMBO Reports · doi:10.15252/embr.202255502 · Cited by 49
Self-citationChampliaud, M.-F., Burgeson, R. E., Jin, W. W., Baden, H. P., & Olson, P. F. (1998) · Journal of Biological Chemistry · doi:10.1074/jbc.273.47.31547 · Cited by 47
Rac GEF Dock4 interacts with cortactin to regulate dendritic spine formation.
Ueda, S., Negishi, M., & Katoh, H. (2013) · Molecular Biology of the Cell · doi:10.1091/mbc.e12-11-0782 · Cited by 47
Lin, D. S. Y., Kan, A., Gao, J., Crampin, E. J., Hodgkin, P. D., & Naik, S. H. (2018) · Cell Reports · doi:10.1016/j.celrep.2018.02.046 · Cited by 44
Kennedy, E., Coulter, E., Halliwell, E., Profitós-Pelejà, N., Walsby, E. J., Clark, B. E., Phillips, E. H., Burley, T. A., Mitchell, S., Devereux, S., et al. (2021) · Blood · doi:10.1182/blood.2020005964 · Cited by 44
Xie, J., Sheng, M., Rong, S., Zhou, D., Wang, C., Wu, W., Huang, J., Sun, Y., Wang, Y., Chen, P., et al. (2023) · Leukemia · doi:10.1038/s41375-023-02055-z · Cited by 41
Clonal multi-omics reveals Bcor as a negative regulator of emergency dendritic cell development
Tian, L., Tomei, S., Schreuder, J., Weber, T., Amann‐Zalcenstein, D., Lin, D. S. Y., Tran, J., Audiger, C., Chu, M., Jarratt, A., et al. (2021) · Immunity · doi:10.1016/j.immuni.2021.03.012 · Cited by 39
Morinishi, L. S., Kochanowski, K., Levine, R. L., Wu, L. F., & Altschuler, S. J. (2020) · Cell Systems · doi:10.1016/j.cels.2020.06.003 · Cited by 36
Shepherd, M. S., Li, J., Wilson, N. K., Oedekoven, C. A., Li, J., Belmonte, M., Fink, J., Prick, J. C. M., Pask, D. C., Hamilton, T. L., et al. (2018) · Blood · doi:10.1182/blood-2017-12-821066 · Cited by 33
Self-citationControlling genetic heterogeneity in gene-edited hematopoietic stem cells by single-cell expansion
Becker, H. J., Ishida, R., Wilkinson, A. C., Kimura, T., Lee, M. S. J., Coban, C., Ota, Y., Tanaka, Y., Roskamp, M., Sano, T., et al. (2023) · Cell Stem Cell · doi:10.1016/j.stem.2023.06.002 · Cited by 32
Self-citationCell competition and cancer from Drosophila to mammals
Cong, B., & Cagan, R. L. (2024) · Oncogenesis · doi:10.1038/s41389-023-00505-y · Cited by 31
Prummel, K. D., Woods, K., Kholmatov, M. M., Schmitt, E. C., Vlachou, E. P., Labyadh, M., Wehner, R., Poschmann, G., Stühler, K., Winter, S., et al. (2025) · Nature Communications · doi:10.1038/s41467-025-65803-y · Cited by 31
Herbrich, S., Chaib, M., Anandhan, S., Andrewes, S. W., Nagarajan, A., Guan, B., Gandhi, N., Gilliam, J., Radovich, M., & Sharma, P. (2026) · Cancer Cell · doi:10.1016/j.ccell.2025.09.011 · Cited by 30
Xu, H., Eleswarapu, S., Geiger, H., Szczur, K., Daria, D., Zheng, Y., Settleman, J. E., Srour, E. F., Williams, D. A., & Filippi, M. (2009) · Blood · doi:10.1182/blood-2009-02-205815 · Cited by 29
Combining single-cell tracking and omics improves blood stem cell fate regulator identification
Wehling, A., Loeffler, D., Zhang, Y., Kull, T., Donato, C., Szczerba, B. M., Ortega, G. C., Lee, M., Moor, A. E., Göttgens, B., et al. (2022) · Blood · doi:10.1182/blood.2022016880 · Cited by 27
Tracking hematopoietic stem cells and their progeny using whole-genome sequencing
Lee-Six, H., & Kent, D. G. (2020) · Experimental Hematology · doi:10.1016/j.exphem.2020.01.004 · Cited by 26
Self-citationTo portray clonal evolution in blood cancer, count your stem cells
Lyne, A.-M., Laplane, L., & Perié, L. (2020) · Blood · doi:10.1182/blood.2020008407 · Cited by 26
Convergent somatic evolution commences in utero in a germline ribosomopathy
Machado, H. E., Øbro, N. F., Williams, N., Tan, S., Boukerrou, A. Z., Davies, M., Belmonte, M., Mitchell, E., Baxter, E. J., Mende, N., et al. (2023) · Nature Communications · doi:10.1038/s41467-023-40896-5 · Cited by 26
Self-citationSingh, I., Fernandez-Perez, D., Sanchez, P. S., & Rodriguez-Fraticelli, A. E. (2025) · Cell Stem Cell · doi:10.1016/j.stem.2025.01.012 · Cited by 25
Targeting adhesion G protein-coupled receptors. Current status and future perspectives
Ließmann, F., von Bredow, L., Meiler, J., & Liebscher, I. (2024) · Structure · doi:10.1016/j.str.2024.10.022 · Cited by 21
Extrinsic regulation of hematopoietic stem cells in development, homeostasis and diseases
Lee, Y., Decker, M., Lee, H. J., & Ding, L. (2017) · Wiley Interdisciplinary Reviews Developmental Biology · doi:10.1002/wdev.279 · Cited by 20
Zhang, Q., Olofzon, R., Konturek-Cieśla, A., Yuan, O., & Bryder, D. (2023) · eLife · doi:10.7554/elife.91826 · Cited by 18
TET2 promotes tumor antigen presentation and T cell IFN-γ, which is enhanced by vitamin C
Cheng, M., Chu, A. K. Y., Li, Z., Yang, S., Smith, M. D., Zhang, Q., Brown, N. G., Marzluff, W. F., Bardeesy, N., Milner, J. J., et al. (2024) · JCI Insight · doi:10.1172/jci.insight.175098 · Cited by 17
Encabo, H. H., D’Agostino, G. A., Sturgess, K., Lord, A. E., Jong, E. D., Ferrelli, A., Sharma, A., Mian, S. A., Habel, K., Llorian, M., et al. (2025) · Blood Cancer Discovery · doi:10.1158/2643-3230.bcd-25-0070 · Cited by 16
Yang, Y., Cathelin, S., Liu, A. C. H., Subedi, A., Maher, A., Hosseini, M., Manikoth Ayyathan, D., Vanner, R., & Chan, S. M. (2025) · Nature Communications · doi:10.1038/s41467-025-57614-y · Cited by 14
To not love thy neighbor: mechanisms of cell competition in stem cells and beyond
Yusupova, M., & Fuchs, Y. (2023) · Cell Death and Differentiation · doi:10.1038/s41418-023-01114-3 · Cited by 13
Evolutionary dynamics in the decades preceding acute myeloid leukaemiaPreprint
Watson, C. J., Poon, G. Y. P., MacGregor, H. A. J., Fonseca, A. V. A., Apostolidou, S., Gentry‐Maharaj, A., Menon, U., & Blundell, J. R. (2024) · bioRxiv (Cold Spring Harbor Laboratory) · doi:10.1101/2024.07.05.602251 · Cited by 12
Isolation of Murine Hematopoietic Stem Cells and Progenitor Cells
Ema, H., Morita, Y., Nakauchi, H., & Matsuzaki, Y. (2005) · Current Protocols in Immunology · doi:10.1002/0471142735.im22b01s67 · Cited by 11
Hu, L., Liu, Y., Fu, C., Zhao, J., Cui, Q., Sun, Q., Wang, H., Lu, L., Dai, H., Xu, X., et al. (2023) · Molecules · doi:10.3390/molecules28031103 · Cited by 11
Inflammation perturbs hematopoiesis by remodeling specific compartments of the bone marrow niche
Swann, J. W., Zhang, R., Verovskaya, E. V., Calero‐Nieto, F. J., Wang, X., Proven, M. A., Hirakawa, H., Heubel, B. P., Shyu, P. T., Guo, X.-D. E., et al. (2025) · Blood · doi:10.1182/blood.2025029513 · Cited by 9
Mutant p53 promotes clonal hematopoiesis by generating a chronic inflammatory microenvironment
Chen, S., Barajas, S., Vemula, S., Yang, Y., Simpson, E. R., Gao, H., Li, R., Behzadnia, F., Nabinger, S. C., Schmitz, D. A., et al. (2025) · Journal of Clinical Investigation · doi:10.1172/jci184285 · Cited by 9
Jenkins, M. T., Chu, Y. E., Franceski, A. M., Potts, C. R., Dubin, R., Dickerson, K. M., Lee, S. C.-W., Lu, R., Welner, R. S., & Ferrell, P. B. (2025) · Experimental Hematology · doi:10.1016/j.exphem.2025.104727 · Cited by 5
Jassinskaja, M., Bode, D., Gońka, M., Roumeliotis, T. I., Hogg, A. J., Rubio-Lara, J. A., Bennett, E., Milek, J., Elberfeld, S., Theeuwes, B., et al. (2025) · Cell Reports · doi:10.1016/j.celrep.2025.116770 · Cited by 4
Self-citationHematopoietic stem cells depend on HIM and HER
Kent, D. G. (2022) · Experimental Hematology · doi:10.1016/j.exphem.2022.10.004 · Cited by 3
Self-citationCui, D., Wang, H., Wang, Z., Wu, Z., Ding, M., Bian, L., Chi, J., & Zhai, B. (2024) · Aging · doi:10.18632/aging.206073 · Cited by 2
Heavican, T. B., Li, Y., Lone, W., Bouska, A. C., Zhang, J., Yang, R., Liu, X., Shah, A. R., Mir, A. R., Rohr, J. M., et al. (2026) · The Journal of Experimental Medicine · doi:10.1084/jem.20250194 · Cited by 1
Cited by
Still being checked.
Metadata
- Authors
- Cabrera-Cosme, L., Rubio-Lara, J. A., Bennett, E., Miłek, J., Baldreki, C., Dowle, A., Vijayabaskar, M. S., Davies, S. J., Taylor-Smith, E., Bain, F. M., MacDonald, S., James, S., Hogg, K., Jassinskaja, M., Gottgens, B., Wilson, N. K., & Kent, D. G.
- Affiliations
- University of York (GB)
- Wellcome/MRC Cambridge Stem Cell Institute (GB)
- Centre for Blood Research, York Biomedical Research Institute, Department of Biology, University of York, York, UK YO10 5DD
- Metabolomics and Proteomics, Biosciences Technology Facility, Department of Biology, University of York, York, UK YO10 5DD
- Lund University (SE)
- Cambridge Stem Cell Institute & Department of Haematology, University of Cambridge, Cambridge, UK CB2 0AW
- Corresponding author
- Kent, David G.
- ORCID
- Venue
- bioRxiv (Cold Spring Harbor Laboratory)
- Publisher
- openRxiv
- Published
- 2026-10-22
- OpenAlex
- W7223228908
- Cited by
- 0
- References
- 91
- Type
- posted content
- Language
- en
- Open access
- green
- doi.org
- Licence
- Locations
- bioRxiv (Cold Spring Harbor Laboratory) (submittedVersion, cc-by)
- Funders
- Japan Agency for Medical Research and Development
- Yorkshire Forward (EP/K039660/1, EP/M028127/1)
- Cancer Research UK (DCRPGF∖100008, MC_PC_21043, A21762, 18002, C1163/A21762, NIHR203331)
- University of Cambridge
- Vetenskapsrådet (2021-00185)
- Blood Cancer UK (24014, 18002, C1163/A21762)
- Centre for Blood Research, University of British Columbia
- Medical Research Council (MR/Y011945/1, 206328/Z/17/Z, MR/V005502/1, MC_PC_21043)
- Engineering and Physical Sciences Research Council (EP/M028127/1, EP/K039660/1)
- Leeds Biomedical Research Centre (NIHR203331)
- Topics
- Health Sciences › Medicine › Hematology › Acute Myeloid Leukemia Research
- Health Sciences › Medicine › Hematology › Hematopoietic Stem Cell Transplantation
- Life Sciences › Biochemistry, Genetics and Molecular Biology › Cancer Research › Cancer Genomics and Diagnostics
- Keywords
- clonal competition, TET2 mutation, preleukemia, clonal hematopoiesis, hematopoietic stem cells, myeloid neoplasms, epigenetic regulation
About these checks
Registry, retraction, Cites and statistics results are computed, not judged, with one exception: a printed reference that no index lists is read once by a model before it counts as a citation error. Claims are extracted by a model and kept only when their quote appears verbatim in the text; each cited source is then checked, with a model’s help, for whether it says what the claim relies on. Those verdicts can be wrong — read the claim’s quote and the cited source before relying on one.
A language model drew the claims from the paper on 2026-11-12, under version 3 of the claim definition (model deepseek-v4.1-flash, prompt extract-v3).
A second model labelled each claim on 2026-11-12 (model jev-1.13-20260917, definition revision gold-guideline-v0.2).
Cited sources are checked with a language model’s help (gpt-6-sol).
Statistics and arithmetic are recomputed, not judged.
Confidence bands are shown only for fields calibrated on our annotated test set. None is calibrated yet, so no band is shown.
What counts as a claim ›How we measure confidence ›How we check this ›
Are you an author, or do you see a problem with this page? Request a review
