

The DOI matches its Crossref record; 57 of the 57 references it cites were found in a registry or an index.
Maintenance of age in human neurons generated by microRNA-based neuronal conversion of fibroblasts
Open accessAbstract
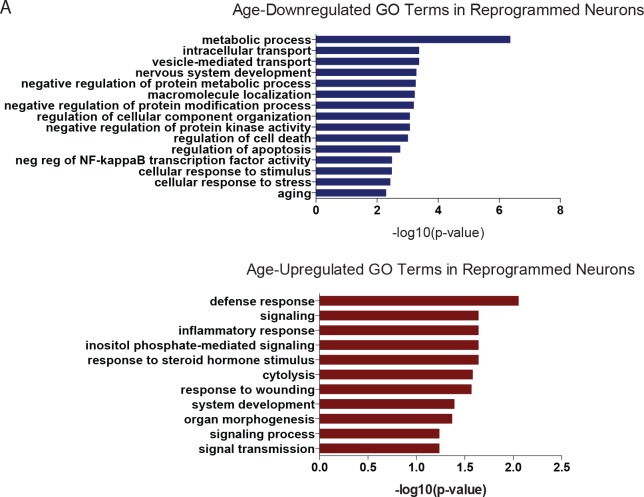
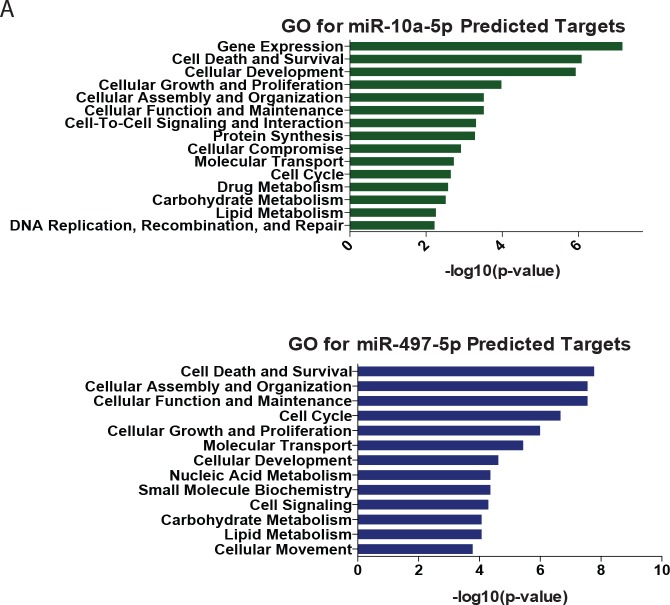
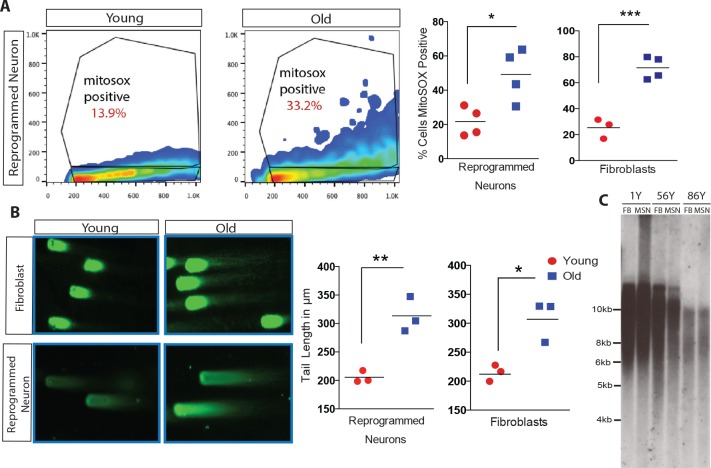
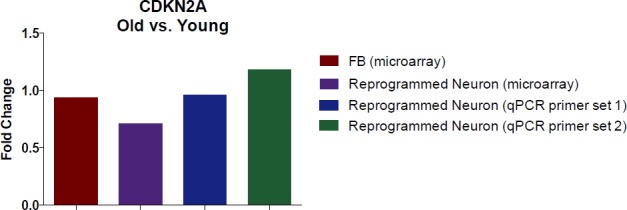
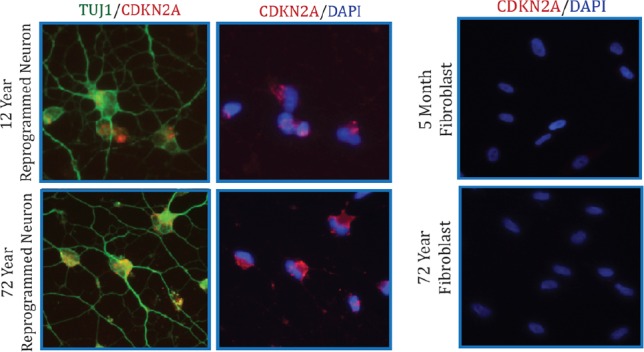
Aging is a major risk factor in many forms of late-onset neurodegenerative disorders. The ability to recapitulate age-related characteristics of human neurons in culture will offer unprecedented opportunities to study the biological processes underlying neuronal aging. Here, we show that using a recently demonstrated microRNA-based cellular reprogramming approach, human fibroblasts from postnatal to near centenarian donors can be efficiently converted into neurons that maintain multiple age-associated signatures. Application of an epigenetic biomarker of aging (referred to as epigenetic clock) to DNA methylation data revealed that the epigenetic ages of fibroblasts were highly correlated with corresponding age estimates of reprogrammed neurons. Transcriptome and microRNA profiles reveal genes differentially expressed between young and old neurons. Further analyses of oxidative stress, DNA damage and telomere length exhibit the retention of age-associated cellular properties in converted neurons from corresponding fibroblasts. Our results collectively demonstrate the maintenance of age after neuronal conversion.
Overview
The claims and statistics of this paper haven’t been checked yet.
Run the check — free, no account needed. It reads the open-access text and checks the sources it cites.
Integrity signals
Registry
Cites
Statistics
Figures
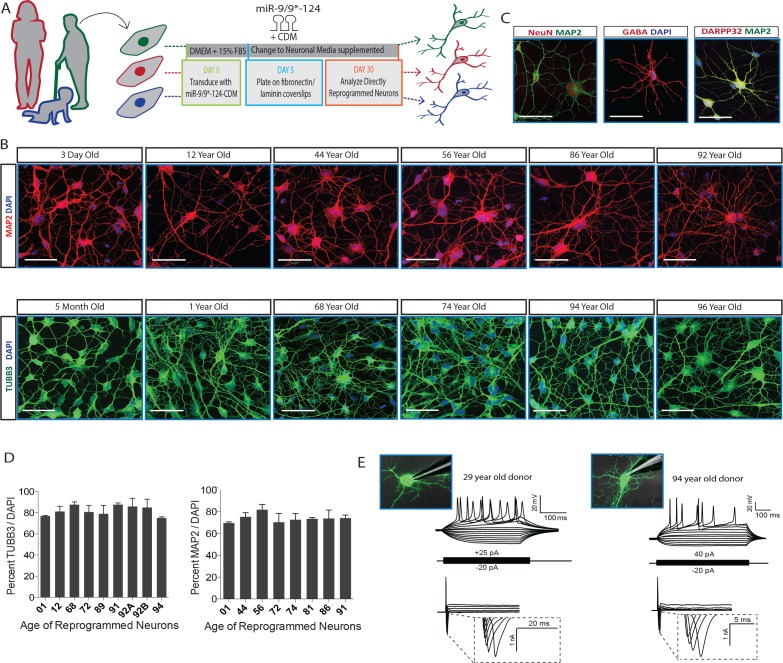
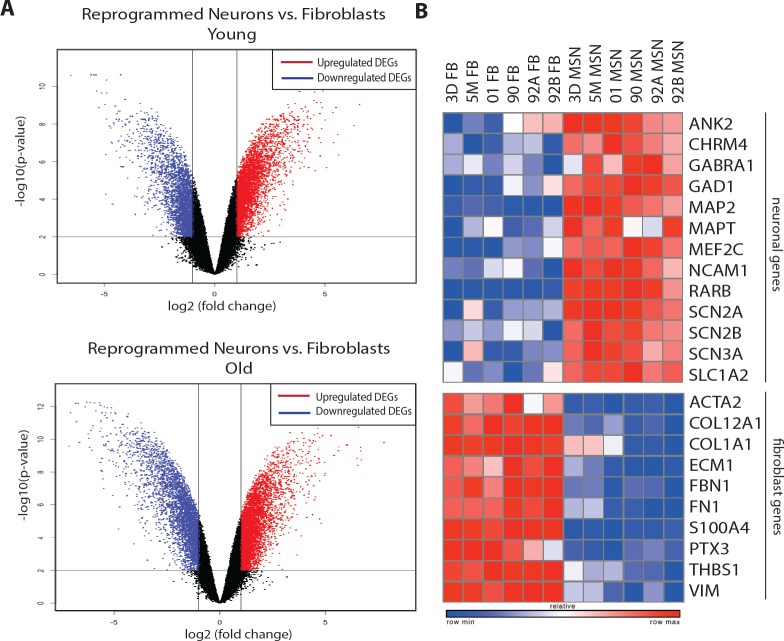
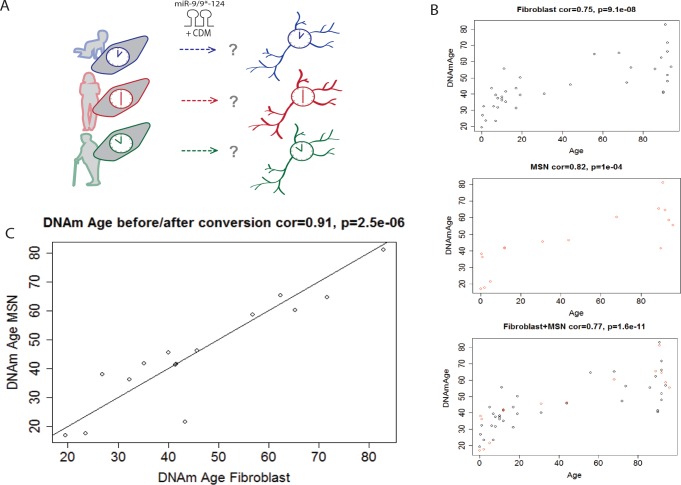
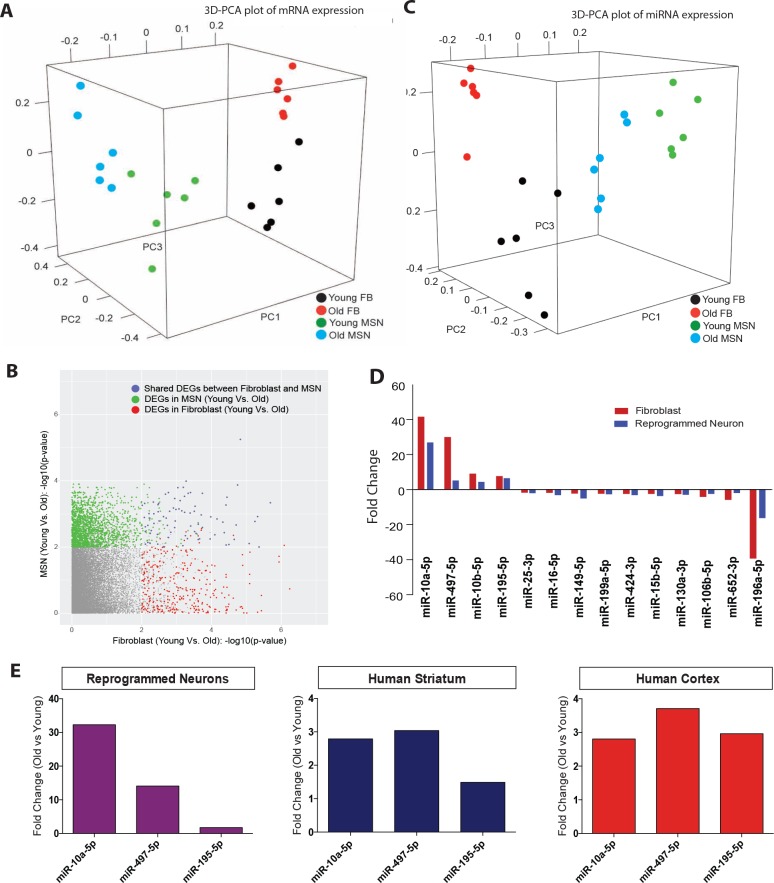
Verification
Claims the paper makes
The claims and statistics of this paper haven’t been checked yet.
Run the check — free, no account needed. It reads the open-access text and checks the sources it cites.
Claims other papers make about this one
Each is checked against this paper’s own text: does it say what the citing paper says it does?
The source backs part of the claim, not all of it — or backs it for a different population, condition or comparison.
In the citing paper
“emphasizing the necessity of partial de-differentiation for rejuvenation (Box 1) to occur [22][23][24][25] .”
From Mechanisms, pathways and strategies for rejuvenation through epigenetic reprogramming (2023) · cites this paper as [23]
Experimental — accuracy not yet measuredThe cited source says what the claim attributes to it.
In the citing paper
“Direct cellular reprogramming retains age-related signatures stored in pre-reprogrammed non-neural somatic cells such as fibroblasts, including the epigenetic age, telomere length, and gene expression changes (22, 23).”
From Modeling late-onset Alzheimer’s disease neuropathology via direct neuronal reprogramming (2024) · cites this paper as [22]
The cited source says what the claim attributes to it.
In the citing paper
“Conversely, other works have shown that aging-associated DNA methylation patterns and biomarkers persisted when cells were transdifferentiated (Box 1) to different cell types, emphasizing the necessity of partial de-differentiation for rejuvenation (Box 1) to occur [22][23][24][25] .”
From Mechanisms, pathways and strategies for rejuvenation through epigenetic reprogramming (2023) · cites this paper as [23]
In the citing paper
“Fibroblast-derived iNs preserve substantial signatures of human aging, including transcriptomic, nuclear pore, mitochondrial, epigenetic, and other aspects of aging (Herdy et al., 2019; Huh et al., 2016; Kim et al., 2018; Mertens et al., 2015a; Traxler et al., 2019).”
From Age-dependent instability of mature neuronal fate in induced neurons from Alzheimer’s patients (2021) · cites this paper as Huh et al., 2016
In the citing paper
“Clearly, iN DNAm ages reflect the adult and old chronological ages of their donors, whereas pluripotent stem cells and their derivatives reflect pre-natal DNAm ages (Figure 7H; Huh et al., 2016; Kim et al., 2014; Lo Sardo et al., 2017).”
From Age-dependent instability of mature neuronal fate in induced neurons from Alzheimer’s patients (2021) · cites this paper as Huh et al., 2016
In the citing paper
“Clearly, iN DNAm ages reflect the adult and old chronological ages of their donors, whereas pluripotent stem cells and their derivatives reflect pre-natal DNAm ages (Figure 7H; Huh et al., 2016; Kim et al., 2014; Lo Sardo et al., 2017).”
From Age-dependent instability of mature neuronal fate in induced neurons from Alzheimer’s patients (2021) · cites this paper as Huh et al., 2016
In the citing paper
“AD iNs did not display signs of accelerated epigenetic aging over control iNs (Figures 7I and 7J; Figure S6; Horvath, 2013; Huh et al., 2016).”
From Age-dependent instability of mature neuronal fate in induced neurons from Alzheimer’s patients (2021) · cites this paper as Huh et al., 2016
In the citing paper
“Cellular aging features (Huh et al., 2016; Mertens et al., 2015a, 2018; Tang et al., 2017; Victor et al., 2014) and adult-like neuronal identity of iNs (Luo et al., 2019) are likely critical for the emergence of such phenotypes in sporadic AD neurons, because erasure of aging signatures and re-gaining of fetal identity represents a potent rescue in this study (Miller et al., 2013; Ocampo et al., 2”
From Age-dependent instability of mature neuronal fate in induced neurons from Alzheimer’s patients (2021) · cites this paper as Huh et al., 2016
Self-check
Percentages, sums and reported differences re-computed from the paper’s own numbers.
The self-check needs the paper’s full text.
Citations
Cites
Takahashi, K., & Yamanaka, S. (2006) · Cell · doi:10.1016/j.cell.2006.07.024 · Cited by 26,673 · cited 1×
“…including vesicle-mediated transport (Wilmot et al., 2008), nervous system development (Lu et al., 2004) NF-kappaB transcription factor activity (Tilstra et al., 2011), regula- tion of apoptosis and inflammatory response (de Magalhães et al., 2009), and for genes previously identified to be…”
BackgroundInduction of Pluripotent Stem Cells from Adult Human Fibroblasts by Defined Factors
Takahashi, K., Tanabe, K., Ohnuki, M., Narita, M., Ichisaka, T., Tomoda, K., & Yamanaka, S. (2007) · Cell · doi:10.1016/j.cell.2007.11.019 · Cited by 20,221
López-Otín, C., Blasco, M. A., Partridge, L., Serrano, M., & Kroemer, G. (2013) · Cell · doi:10.1016/j.cell.2013.05.039 · Cited by 14,982
Lewis, B. P., Burge, C. B., & Bartel, D. P. (2005) · Cell · doi:10.1016/j.cell.2004.12.035 · Cited by 11,855 · cited 2×
“…of Medicine, Washington University School of Medicine, St. Louis, United States; 6Department of Human Genetics, David Geffen School of Medicine, University of California, Los Angeles, Los Angeles, United States; 7Department of Biostatistics, Fielding School of Public Health, University of”
BackgroundMicroRNAs: small RNAs with a big role in gene regulation
He, L., & Hannon, G. J. (2004) · Nature Reviews Genetics · doi:10.1038/nrg1379 · Cited by 7,118
DNA methylation age of human tissues and cell types
Horvath, S. (2013) · Genome Biology · doi:10.1186/gb-2013-14-10-r115 · Cited by 7,075 · cited 7×
“Epigenetic age was estimated using the published software tools (Horvath, 2013).”
BackgroundMethodInfluentialSelf-citationCellular senescence: when bad things happen to good cells
Campisi, J., & d'Adda di Fagagna, F. (2007) · Nature Reviews Molecular Cell Biology · doi:10.1038/nrm2233 · Cited by 4,441
Gene regulation and DNA damage in the ageing human brain
Lu, T., Pan, Y., Kao, S.-Y., Li, C., Kohane, I., Chan, J., & Yankner, B. A. (2004) · Nature · doi:10.1038/nature02661 · Cited by 1,874 · cited 4×
“…and microRNAs in reprogrammed neurons Given the broad variability in gene expression with age in multiple cell types (Berchtold et al., 2008; Lu et al., 2004; Fraser et al., 2005; Glass et al., 2013) and a recent demonstration of main- tenance of age-associated transcriptomic changes in…”
BackgroundInfluentialMicroRNAs and their targets: recognition, regulation and an emerging reciprocal relationship
Pasquinelli, A. E. (2012) · Nature Reviews Genetics · doi:10.1038/nrg3162 · Cited by 1,642 · cited 2×
“…of Medicine, Washington University School of Medicine, St. Louis, United States; 6Department of Human Genetics, David Geffen School of Medicine, University of California, Los Angeles, Los Angeles, United States; 7Department of Biostatistics, Fielding School of Public Health, University of”
BackgroundDNA methylation age of blood predicts all-cause mortality in later life
Marioni, R. E., Shah, S., McRae, A. F., Chen, B. H., Colicino, E., Harris, S. E., Gibson, J., Henders, A. K., Redmond, P., Cox, S. R., et al. (2015) · Genome Biology · doi:10.1186/s13059-015-0584-6 · Cited by 1,261
Cited by
Sorted by citations
DNA methylation-based biomarkers and the epigenetic clock theory of ageing
Horvath, S., & Raj, K. (2018) · Nature Reviews Genetics · doi:10.1038/s41576-018-0004-3 · Cited by 3,095
The ageing epigenome and its rejuvenation
Zhang, W., Qu, J., Liu, G.-H., & Belmonte, J. C. I. (2020) · Nature Reviews Molecular Cell Biology · doi:10.1038/s41580-019-0204-5 · Cited by 458
Modeling Alzheimer’s disease with iPSC-derived brain cells
Penney, J., Ralvenius, W. T., & Tsai, L.-H. (2020) · Molecular Psychiatry · doi:10.1038/s41380-019-0468-3 · Cited by 471
Building Models of Brain Disorders with Three-Dimensional Organoids
Amin, N. D., & Paşca, S. P. (2018) · Neuron · doi:10.1016/j.neuron.2018.10.007 · Cited by 312
Chen, X., & Mobley, W. C. (2019) · Frontiers in Neuroscience · doi:10.3389/fnins.2019.00659 · Cited by 296
Mertens, J., Reid, D. A., Lau, S., Kim, Y., & Gage, F. H. (2018) · Annual Review of Genetics · doi:10.1146/annurev-genet-120417-031534 · Cited by 263
“➌ Additionally, DNA lesions can accumulate via errors in transcription or in the removal of epigenetic methylation markers, and persistent lesions fundamentally alter metabolism due to bioenergetic stress; ➍ this leads to changes at the mitochondrial level, which in turn increase the amount of reactive oxygen species…”
BackgroundResultInfluentialVictor, M. B., Richner, M., Olsen, H. E., Lee, S. W., Monteys, A. M., Ma, C., Huh, C. J., Zhang, B., Davidson, B. L., Yang, X. W., et al. (2018) · Nature Neuroscience · doi:10.1038/s41593-018-0075-7 · Cited by 246
Age-dependent instability of mature neuronal fate in induced neurons from Alzheimer’s patients
Mertens, J., Herdy, J. R., Traxler, L., Schafer, S. T., Schlachetzki, J. C. M., Böhnke, L., Reid, D. A., Lee, H., Zangwill, D., Fernandes, D. P., et al. (2021) · Cell Stem Cell · doi:10.1016/j.stem.2021.04.004 · Cited by 240
Self-citationHerdy, J. R., Traxler, L., Agarwal, R. K., Karbacher, L., Schlachetzki, J. C. M., Boehnke, L., Zangwill, D., Galasko, D., Glass, C. K., Mertens, J., et al. (2022) · Cell Stem Cell · doi:10.1016/j.stem.2022.11.010 · Cited by 208
Simpson, D. J., & Chandra, T. (2021) · Aging Cell · doi:10.1111/acel.13452 · Cited by 192
Traxler, L., Herdy, J. R., Stefanoni, D., Eichhorner, S., Pelucchi, S., Szücs, A., Santagostino, A., Kim, Y., Agarwal, R. K., Schlachetzki, J. C. M., et al. (2022) · Cell Metabolism · doi:10.1016/j.cmet.2022.07.014 · Cited by 179
“, 2018) and observed increased DNA damage repair in old and AD iNs (Huh et al., 2016; Mertens et al., 2021), AD iNs showed a higher demand for NAD that was”
BackgroundTang, Y., Liu, M.-L., Zang, T., & Zhang, C. (2017) · Frontiers in Molecular Neuroscience · doi:10.3389/fnmol.2017.00359 · Cited by 169
“Our results on spinal cord FibiMNs are in general agreement with previous studies showing that aging features are retained in directly reprogrammed brain neurons (Mertens et al., 2015; Huh et al., 2016).”
ResultAbernathy, D. G., Kim, W. K., McCoy, M. J., Lake, A. M., Ouwenga, R., Lee, S. W., Xing, X., Li, D., Lee, H. J., Heuckeroth, R. O., et al. (2017) · Cell Stem Cell · doi:10.1016/j.stem.2017.08.002 · Cited by 145
“These direct conversion modalities may prove to be invaluable in the study of late-onset neurodegenerative diseases because the original age of human fibroblasts is maintained in converted neurons (Huh et al., 2016; Mertens et al., 2015) in contrast to the cellular rejuvenation observed in induced pluripotent stem cel…”
BackgroundSelf-citationDirect neuronal reprogramming: Fast forward from new concepts toward therapeutic approaches
Bocchi, R., Masserdotti, G., & Götz, M. (2021) · Neuron · doi:10.1016/j.neuron.2021.11.023 · Cited by 131
“Direct neuronal reprogramming of human cells maintains many hallmarks of aging, such as epigenetic marks, nuclear lamina, and mitochondrial dysfunction (Horvath, 2013; Huh et al., 2016; Kim et al., 2018; Mertens et al., 2015).”
Advancing models of neural development with biomaterials
Roth, J. G., Huang, M. S., Li, T. L., Feig, V. R., Jiang, Y., Cui, B., Greely, H. T., Bao, Z., Pașca, S. P., & Heilshorn, S. C. (2021) · Nature reviews. Neuroscience · doi:10.1038/s41583-021-00496-y · Cited by 122
A comprehensive resource for induced pluripotent stem cells from patients with primary tauopathies
Karch, C. M., Kao, A. W., Karydas, A., Onanuga, K., Martinez, R., Argouarch, A., Wang, C., Huang, C., Sohn, P. D., Bowles, K. R., et al. (2019) · Stem Cell Reports · doi:10.1016/j.stemcr.2019.09.006 · Cited by 119
“In contrast, fibroblasts directly reprogrammed into neurons retain their aging characteristics such as DNA methylation (Huh et al., 2016; Maherali et al., 2007; Mertens et al., 2015).”
BackgroundKim, Y., Zheng, X., Ansari, Z., Bunnell, M. C., Herdy, J. R., Traxler, L., Lee, H., Paquola, A. C. M., Blithikioti, C., Ku, M., et al. (2018) · Cell Reports · doi:10.1016/j.celrep.2018.04.105 · Cited by 117
“study of age-related neurodegenerative diseases (Huh et al., 2016; Mertens et al., 2015; Tang et al., 2017).”
BackgroundInfluentialDrouin‐Ouellet, J., Lau, S., Brattås, P. L., Rylander Ottosson, D., Pircs, K., Grassi, D. A., Collins, L. M., Vuono, R., Andersson Sjöland, A., Westergren‐Thorsson, G., et al. (2017) · EMBO Molecular Medicine · doi:10.15252/emmm.201607471 · Cited by 110
“In addition, recent studies have also demonstrated that the resulting iNs, unlike iPSCs, maintain the aging signature of the donor, making iNs ideal candidates for modeling neuronal pathology in late-onset diseases (Mertens et al , 2015; Huh et al , 2016).”
Barák, M., Fedorová, V., Pospíšilová, V., Raška, J., Vochyánová, S., Sedmík, J., Hříbková, H., Klímová, H., Váňová, T., & Bohačiaková, D. (2022) · Stem Cell Reviews and Reports · doi:10.1007/s12015-021-10254-3 · Cited by 102
“Importantly, avoiding the iPSCs stage, transdifferentiated iNs were shown to conserve the agerelated epigenetic landscape and other cellular properties from the cell of origin [138, 140].”
BackgroundOh, Y. M., Lee, S. W., Kim, W. K., Chen, S., Church, V. A., Cates, K., Li, T., Zhang, B., Dolle, R. E., Dahiya, S., et al. (2022) · Nature Neuroscience · doi:10.1038/s41593-022-01185-4 · Cited by 100
Self-citationLeigh Syndrome: A Tale of Two Genomes
Bakare, A. B., Lesnefsky, E. J., & Iyer, S. (2021) · Frontiers in Physiology · doi:10.3389/fphys.2021.693734 · Cited by 101
Proteostasis and lysosomal repair deficits in transdifferentiated neurons of Alzheimer’s disease
Chou, C.-C., Vest, R., Prado, M. A., Wilson-Grady, J., Paulo, J. A., Shibuya, Y., Moran-Losada, P., Lee, T.-T., Luo, J., Gygi, S. P., et al. (2025) · Nature Cell Biology · doi:10.1038/s41556-025-01623-y · Cited by 94
Traumatic Stress and Accelerated Cellular Aging: From Epigenetics to Cardiometabolic Disease
Wolf, E. J., & Morrison, F. G. (2017) · Current Psychiatry Reports · doi:10.1007/s11920-017-0823-5 · Cited by 97
Huntington’s Disease Pathogenesis Is Modified In Vivo by Alfy/Wdfy3 and Selective Macroautophagy
Fox, L. M., Kim, K., Johnson, C. W., Chen, S., Croce, K. R., Victor, M. B., Eenjes, E., Bosco, J. R., Randolph, L. K., Dragatsis, I., et al. (2020) · Neuron · doi:10.1016/j.neuron.2019.12.003 · Cited by 76
“Recently, an HD patient fibroblast model from which medium spiny neurons (MSNs) are generated through direct neuronal conversion (Huh et al., 2016; Mertens et al., 2015) was shown to demonstrate an aggregation phenotype of endogenous mHtt, in the absence of extreme polyQ expansions that are rarely observed in the pati…”
BackgroundModeling late-onset Alzheimer’s disease neuropathology via direct neuronal reprogramming
Sun, Z., Kwon, J.-S., Ren, Y., Chen, S., Walker, C. K., Lu, X., Cates, K., Karahan, H., Sviben, S., Fitzpatrick, J. A. J., et al. (2024) · Science · doi:10.1126/science.adl2992 · Cited by 77
“These results underscore the potential of 3D neuronal reprogramming to model age-dependent A β deposition in LOAD neurons.”
Long Non-Coding RNAs in Neuronal Aging
Fernandes, D. P., Bitar, M., Jacobs, F. M. J., & Barry, G. (2018) · Non-Coding RNA · doi:10.3390/ncrna4020012 · Cited by 75
“Upregulated in the hippocampus of old mice [167]; downregulated in old induced striatal medium spiny neurons [168].”
Lee, S. W., Oh, Y. M., Lu, Y.-L., Kim, W. K., & Yoo, A. S. (2018) · Developmental Cell · doi:10.1016/j.devcel.2018.06.007 · Cited by 77
The Link Between Epigenetic Clocks for Aging and Senescence
Wagner, W. (2019) · Frontiers in Genetics · doi:10.3389/fgene.2019.00303 · Cited by 71
“Additional commonalities of senescence and aging include alteration of cellular morphology, metabolic changes, loss of differentiation potential, activation of the p53/p21CIP1 and p16INK4A/pRb signaling pathways, increased senescenceassociated β-galactosidase activity (SA-β-gal), formation of senescence-associated het…”
BackgroundDeconstructing Stepwise Fate Conversion of Human Fibroblasts to Neurons by MicroRNAs
Cates, K., McCoy, M. J., Kwon, J.-S., Liu, Y., Abernathy, D. G., Zhang, B., Liu, S., Gontarz, P., Kim, W. K., Chen, S., et al. (2021) · Cell Stem Cell · doi:10.1016/j.stem.2020.08.015 · Cited by 67
Self-citationMechanisms, pathways and strategies for rejuvenation through epigenetic reprogramming
Cipriano, A., Moqri, M., Maybury-Lewis, S. Y., Rogers-Hammond, R., de Jong, T. A., Parker, A., Rasouli, S., Schöler, H. R., Sinclair, D. A., & Sebastiano, V. (2023) · Nature Aging · doi:10.1038/s43587-023-00539-2 · Cited by 66
Capano, L. S., Sato, C., Ficulle, E., Yu, A., Horie, K., Kwon, J.-S., Burbach, K. F., Barthélemy, N. R., Fox, S. G., Karch, C. M., et al. (2022) · Cell Stem Cell · doi:10.1016/j.stem.2022.04.018 · Cited by 65
Self-citationHerdy, J., Schafer, S., Kim, Y., Ansari, Z., Zangwill, D., Ku, M., Paquola, A., Lee, H., Mertens, J., & Gage, F. H. (2019) · eLife · doi:10.7554/elife.41356 · Cited by 64
Sheng, C., Jungverdorben, J., Wiethoff, H., Lin, Q., Flitsch, L. J., Eckert, D., Hebisch, M., Fischer, J., Kesavan, J., Weykopf, B., et al. (2018) · Nature Communications · doi:10.1038/s41467-018-06398-5 · Cited by 58
Gatto, N., Dos Santos Souza, C., Shaw, A. C., Bell, S. M., Myszczynska, M. A., Powers, S., Meyer, K., Castelli, L. M., Karyka, E., Mortiboys, H., et al. (2021) · Aging Cell · doi:10.1111/acel.13281 · Cited by 58
“…recent studies have shown that neurons directly reprogrammed from fibroblasts without the use of pluripotency factors retain ageing signatures compared to induced pluripotent stem cells (iPSC)-derived neurons (Huh et al., 2016; Mertens et al., 2015; Tang et al., 2017; Victor et al., 2018).”
BackgroundDirect Neuronal Reprogramming: Bridging the Gap Between Basic Science and Clinical Application
Vasan, L., Park, E., David, L. A., Fleming, T., & Schuurmans, C. (2021) · Frontiers in Cell and Developmental Biology · doi:10.3389/fcell.2021.681087 · Cited by 61
“…cells DMEM/F12 BDNF, GDNF, heparin, IGF1, RA, SHH, N2 cAMP, purmorphamine Li et al., 2008 Human adipose tissue derived stem cells DMEM FGF2 Forskolin Jang et al., 2010 #71 Human mesenchymal stem cells NSA- basal medium Br-cAMP, dorsomorphin, RG108, rolipram TSA Funk and Alexanian, 2013 Human…”
BackgroundTranscriptional dynamics of murine motor neuron maturation in vivo and in vitro
Patel, T., Hammelman, J., Aziz, S., Jang, S., Closser, M., Michaels, T. L., Blum, J. A., Gifford, D. K., & Wichterle, H. (2022) · Nature Communications · doi:10.1038/s41467-022-33022-4 · Cited by 57
Next‐generation disease modeling with direct conversion: a new path to old neurons
Traxler, L., Edenhofer, F., & Mertens, J. (2019) · FEBS Letters · doi:10.1002/1873-3468.13678 · Cited by 57
Dissecting Alzheimer's disease pathogenesis in human 2D and 3D models
Cenini, G., Hebisch, M., Iefremova, V., Flitsch, L. J., Breitkreuz, Y., Tanzi, R. E., Kim, D. Y., Peitz, M., & Brüstle, O. (2020) · Molecular and Cellular Neuroscience · doi:10.1016/j.mcn.2020.103568 · Cited by 60
hiPSCs for predictive modelling of neurodegenerative diseases: dreaming the possible
Cervo, P. R. D. V., Besusso, D., Conforti, P., & Cattaneo, E. F. (2021) · Nature Reviews Neurology · doi:10.1038/s41582-021-00465-0 · Cited by 57
Transcription Factor-Based Fate Specification and Forward Programming for Neural Regeneration
Flitsch, L. J., Laupman, K. E., & Brüstle, O. (2020) · Frontiers in Cellular Neuroscience · doi:10.3389/fncel.2020.00121 · Cited by 58
Drouin‐Ouellet, J., Pircs, K., Barker, R. A., Jakobsson, J., & Parmar, M. (2017) · Frontiers in Neuroscience · doi:10.3389/fnins.2017.00530 · Cited by 56
“Moreover, they show that the aging signature is maintained through their microRNA expression profile and increased oxidative stress levels (Huh et al., 2016).”
BackgroundInfluentialPircs, K., Drouin‐Ouellet, J., Horváth, V., Gil, J., Rezeli, M., Garza, R., Grassi, D. A., Sharma, Y., St‐Amour, I., Harris, K. L., et al. (2021) · Brain · doi:10.1093/brain/awab473 · Cited by 53
Cellular reprogramming as a tool to model human aging in a dish
Pitrez, P. R., Monteiro, L. M., Borgogno, O., Nissan, X., Mertens, J., & Ferreira, L. (2024) · Nature Communications · doi:10.1038/s41467-024-46004-5 · Cited by 51
Berry, B. J., Smith, A. S. T., Young, J. E., & Mack, D. L. (2018) · Cells Tissues Organs · doi:10.1159/000493018 · Cited by 47
“Such methods of direct conversion have been shown to maintain multiple epigenetic age-associated signatures when converted from fibroblast to neuron [Huh et al., 2016].”
MethodTargeting Adult Neurogenesis to Optimize Hippocampal Circuits in Aging
McAvoy, K. M., & Sahay, A. (2017) · Neurotherapeutics · doi:10.1007/s13311-017-0539-6 · Cited by 45
“The generation of human hippocampal neurons through direct reprogramming of fibroblasts, or directed differentiation of induced pluripotent stem cells, holds promise to delineate the neurobiological changes in aging at a cellular level [224, 225].”
BackgroundGómez-Verján, J. C., Vázquez-Martínez, E. R., Rivero-Segura, N. A., & Medina-Campos, R. H. (2018) · Human Genetics · doi:10.1007/s00439-018-1955-3 · Cited by 46
Human in vitro models for understanding mechanisms of autism spectrum disorder
Gordon, A., & Geschwind, D. H. (2020) · Molecular Autism · doi:10.1186/s13229-020-00332-7 · Cited by 45
“These iNs retain many of the epigenetic marks of the source tissue [44, 45] which can capture the epigenetic signature of aging.”
BackgroundMethodDrouin‐Ouellet, J., Legault, E. M., Nilsson, F., Pircs, K., Bouquety, J., Petit, F., Shrigley, S., Birtele, M., Pereira, M., Storm, P., et al. (2022) · Stem Cell Reports · doi:10.1016/j.stemcr.2022.08.010 · Cited by 49
“Stem Cell Repor This is an open access article under the C chondrial defects (Huh et al., 2016; Kim et al., 2018; Mertens et al., 2015, 2021; Tang et al., 2017).”
BackgroundYang, G., & Shcheglovitov, A. (2019) · Developmental Dynamics · doi:10.1002/dvdy.100 · Cited by 46
“Importantly, neurons produced from fibroblasts maintain age-related epigenetic marks, which makes them particularly suited for modeling later-onset neurodegenerative disorders.(104,105) In general, TF-based reprogramming of stem cells involves two simple steps: first, infection of stem cells with a combination of TFs…”
BackgroundMechanistic Insights Into MicroRNA-Induced Neuronal Reprogramming of Human Adult Fibroblasts
Lu, Y.-L., & Yoo, A. S. J. (2018) · Frontiers in Neuroscience · doi:10.3389/fnins.2018.00522 · Cited by 41
“, 2013), thereby retaining the age signatures of starting fibroblasts including the epigenetic clock (Horvath, 2013), ageassociated changes in transcriptome and microRNAs, reactive oxygen species (ROS) levels, DNA damage and telomere lengths (Mertens et al., 2015; Huh et al., 2016; Tang et al., 2017).”
BackgroundStem Cell Therapies in Alzheimer’s Disease: Applications for Disease Modeling
Si, Z., & Wang, X. (2021) · Journal of Pharmacology and Experimental Therapeutics · doi:10.1124/jpet.120.000324 · Cited by 42
“The “bioreactors” used in culture may also improve the health of the cells (Marion et al., 2009; Corti et al., 2012; Baxter et al., 2015; Huh et al., 2016; Mertens et al., 2018).”
BackgroundChanoumidou, K., Hernández-Rodríguez, B., Windener, F., Thomas, C., Stehling, M., Mozafari, S., Albrecht, S., Ottoboni, L., Antel, J., Kim, K.-P., et al. (2021) · Stem Cell Reports · doi:10.1016/j.stemcr.2021.03.001 · Cited by 39
“, 2008), directly converted cells maintainmany features of aging (Huh et al., 2016;Mertens et al., 2015).”
BackgroundHuman fibroblast and stem cell resource from the Dominantly Inherited Alzheimer Network
the Dominantly Inherited Alzheimer Network (DIAN), Karch, C. M. M., Hernández, D., Wang, J., Marsh, J. A., Hewitt, A. W., Hsu, S., Norton, J. B., Levitch, D., Donahue, T. A., et al. (2018) · Alzheimer s Research & Therapy · doi:10.1186/s13195-018-0400-0 · Cited by 39
The application of in vitro ‐derived human neurons in neurodegenerative disease modeling
D’Souza, G. X., Rose, S. E., Knupp, A., Nicholson, D. A., Keene, C. D., & Young, J. E. (2020) · Journal of Neuroscience Research · doi:10.1002/jnr.24615 · Cited by 36
“Indeed, several studies have shown that iNs appear to retain transcriptomic and epigenetic characteristics similar to the aged donor somatic cells (Huh et al., 2016; Mertens et al., 2015).”
BackgroundTelomere shortening induces aging-associated phenotypes in hiPSC-derived neurons and astrocytes
Harley, J., Santosa, M. M., Ng, C. Y., Grinchuk, O. V., Hor, J., Liang, Y., Lim, V. J. W., Tee, W., Ong, D. S. T., & Ng, S. (2023) · Biogerontology · doi:10.1007/s10522-023-10076-5 · Cited by 37
“Fibroblast-derived iNs preserve features of human aging including transcriptomic, epigenetic, mitochondrial and nuclear pore changes (Herdy et al. 2019; Huh et al. 2016; Kim et al. 2018; Mertens et al. 2015).”
BackgroundGhaffari, L., Starr, A., Nelson, A. T., & Sattler, R. (2018) · Frontiers in Neuroscience · doi:10.3389/fnins.2018.00056 · Cited by 35
“also showed that direct conversion using this protocol preserves age-related epigenetic and cellular signatures from the donor, similar to established transcription factor-only methods (Huh et al., 2016).”
BackgroundResultInfluentialAversano, S., Caiazza, C., & Caiazzo, M. (2022) · Frontiers in Aging Neuroscience · doi:10.3389/fnagi.2022.1069482 · Cited by 33
Nwanaji‐Enwerem, J. C., Weisskopf, M. G., & Baccarelli, A. (2018) · Ageing Research Reviews · doi:10.1016/j.arr.2018.04.005 · Cited by 29
Precision Medicine in Rare Diseases
Villalón-García, I., Álvarez-Córdoba, M., Suarez-Rivero, J. M., Povea-Cabello, S., Talaverón-Rey, M., Suárez-Carrillo, A., Munuera-Cabeza, M., & Sánchez-Alcázar, J. A. (2020) · Diseases · doi:10.3390/diseases8040042 · Cited by 33
“In addition, iNs, unlike iPSCs, maintain the ageing [30] and the epigenetic marks of the donor [31,32], making them excellent candidates for modelling neuronal pathophysiology in age-related disorders.”
BackgroundRose, S. E., Frankowski, H., Knupp, A., Berry, B. J., Martinez, R. A., Dinh, S. Q., Bruner, L. T., Willis, S. L., Crane, P. K., Larson, E. B., et al. (2018) · Journal of Neuropathology & Experimental Neurology · doi:10.1093/jnen/nly013 · Cited by 29
“Finally, because reprogramming of somatic cells to hiPSCs erases epigenetic marks (12) we tested whether leptomeningeal cells are a viable starting cell source for direct neuron conversion.”
BackgroundInduced pluripotent stem cell‐based modeling of mutant LRRK 2‐associated Parkinson's disease
Weykopf, B., Haupt, S., Jungverdorben, J., Flitsch, L. J., Hebisch, M., Liu, G., Suzuki, K., Belmonte, J. C. I., Peitz, M., Blaess, S., et al. (2019) · European Journal of Neuroscience · doi:10.1111/ejn.14345 · Cited by 29
“Besides transcriptomic signatures, iN preserve the donor cell's age‐associated epigenetic memory and other aging hallmarks such as shortened telomere lengths, elevated ROS levels and accumulated DNA damage (Huh et al., 2016).”
BackgroundMicroRNA Roles in Cell Reprogramming Mechanisms
Pascale, E., Caiazza, C., Paladino, M., Parisi, S., Passaro, F., & Caiazzo, M. (2022) · Cells · doi:10.3390/cells11060940 · Cited by 30
Sato, M., Takizawa, H., Nakamura, A., Turner, B. J., Shabanpoor, F., & Aoki, Y. (2019) · Frontiers in Molecular Neuroscience · doi:10.3389/fnmol.2019.00297 · Cited by 29
The Importance of Non-neuronal Cell Types in hiPSC-Based Disease Modeling and Drug Screening
Gonzalez, D. M., Gregory, J. K., & Brennand, K. (2017) · Frontiers in Cell and Developmental Biology · doi:10.3389/fcell.2017.00117 · Cited by 26
“…is an essential part of the cellular reprogramming process; while important epigenetic markers associated with complex genetic diseases may be lost during hiPSC reprogramming, this does not seem to occur to the same extent during neuronal induction (Huh et al., 2016; Mertens et al., 2016).”
BackgroundSimple Generation of a High Yield Culture of Induced Neurons from Human Adult Skin Fibroblasts
Shrigley, S., Pircs, K., Barker, R. A., Parmar, M., & Drouin‐Ouellet, J. (2018) · Journal of Visualized Experiments · doi:10.3791/56904 · Cited by 26
Impact of traumatic brain injury on amyotrophic lateral sclerosis: from bedside to bench
Franz, C. K., Joshi, D., Daley, E. L., Grant, R. A., Dalamagkas, K., Leung, A., Finan, J. D., & Kiskinis, E. (2019) · Journal of Neurophysiology · doi:10.1152/jn.00572.2018 · Cited by 26
“Recent developments in direct neuronal transdifferentiation from adult somatic cell types appear to preserve aspects of cellular age (Abernathy et al. 2017; Huh et al. 2016; Victor et al. 2018; Yoo et al. 2011) and may facilitate the development of more accurate in vitro models of TBI pathogenesis.”
BackgroundCell reprogramming: Therapeutic potential and the promise of rejuvenation for the aging brain
López-León, M., Outeiro, T. F., & Goya, R. G. (2017) · Ageing Research Reviews · doi:10.1016/j.arr.2017.09.002 · Cited by 27
“Using a miRNAbased cellular reprogramming approach, human fibroblasts obtained from donors ranging from neonates to near centenarians could be efficiently converted into neurons that retain multiple age-associated signatures (Huh et al., 2016).”
Aging-relevant human basal forebrain cholinergic neurons as a cell model for Alzheimer’s disease
Ma, S., Zang, T., Liu, M.-L., & Zhang, C. (2020) · Molecular Neurodegeneration · doi:10.1186/s13024-020-00411-6 · Cited by 24
Lee, S. W., Oh, Y. M., Victor, M. B., Yang, Y., Chen, S., Strunilin, I., Dahiya, S. M., Dolle, R. E., Pak, S. C., Silverman, G. A., et al. (2023) · Nature Aging · doi:10.1038/s43587-023-00538-3 · Cited by 25
“…whether it would be feasible to reduce the RCAN1 adult fibroblasts to neurons has been shown to propagate chronological age-related characteristics such as epigenetic cellular age stored in starting fibroblasts, thereby generating neurons that mimic the epigenetic age of fibroblast donors 6 .”
InfluentialGeneration of Human Neurons by microRNA-Mediated Direct Conversion of Dermal Fibroblasts
Church, V. A., Cates, K. L., Capano, L. S., Aryal, S., Kim, W. K., & Yoo, A. S. J. (2020) · Methods in molecular biology · doi:10.1007/978-1-0716-1084-8_6 · Cited by 24
Screening Platforms for Genetic Epilepsies—Zebrafish, iPSC-Derived Neurons, and Organoids
Shcheglovitov, A., & Peterson, R. T. (2021) · Neurotherapeutics · doi:10.1007/s13311-021-01115-5 · Cited by 23
Neuroprotective Effects of Cryptotanshinone in a Direct Reprogramming Model of Parkinson’s Disease
Lee, J., Sim, H., Yoo, H. M., Lee, M., Baek, A., Jeon, Y., Seo, K.-S., Son, M., Yoon, J. S., & Kim, J. (2020) · Molecules · doi:10.3390/molecules25163602 · Cited by 24
The iNs and Outs of Direct Reprogramming to Induced Neurons
Carter, J., Halmai, J. A. N. M., & Fink, K. D. (2020) · Frontiers in Genome Editing · doi:10.3389/fgeed.2020.00007 · Cited by 21
Gropman, A. L., Uittenbogaard, M. N., & Chiaramello, A. (2024) · Neurotherapeutics · doi:10.1016/j.neurot.2023.e00311 · Cited by 23
“…the differentiation process [103]; and 6) reprogramming into iPSCs can reset cellular age of lineage-speci fi c derived cells, such as neurons [104], and/or induces mitochondrial rejuvenation [105], thereby no longer exhibiting the original pathophysiological characteristics of a PMD.…”
BackgroundMcCaughey‐Chapman, A., & Connor, B. (2023) · Journal of Neuroscience Research · doi:10.1002/jnr.25173 · Cited by 21
Hicks, E. M., Seah, C., Cote, A. C., Marchese, S., Brennand, K., Nestler, E. J., Girgenti, M. J., & Huckins, L. M. (2023) · Translational Psychiatry · doi:10.1038/s41398-023-02412-7 · Cited by 21
“It is hypothesized that the conservation of epigenetic markers may be achieved through direct reprogramming strategies [43] if donor-specific epigenetic profiles, such as with aging [44, 45], are of interest.”
BackgroundPrecision medicine in pantothenate kinase-associated neurodegeneration
Álvarez-Córdoba, M., Paz, M. V., Villalón-García, I., Povea-Cabello, S., Suarez-Rivero, J. M., Talaverón-Rey, M., Abril-Jaramillo, J., Vintimilla-Tosi, A. B., & Sánchez-Alcázar, J. A. (2019) · Neural Regeneration Research · doi:10.4103/1673-5374.251203 · Cited by 21
“In addition, iNs, unlike iPSCs, maintain the ageing (Mertens et al., 2015) and the epigenetic marks of the donor (Horvath, 2013; Huh et al., 2016), making them excellent candidates for modelling neuronal pathophysiology in age-related disorders.”
Koh, Y. H., Tan, L. Y., & Ng, S. (2018) · Frontiers in Cellular Neuroscience · doi:10.3389/fncel.2018.00413 · Cited by 20
Human neurons to model aging: A dish best served old
Böhnke, L., Traxler, L., Herdy, J. R., & Mertens, J. (2018) · Drug Discovery Today Disease Models · doi:10.1016/j.ddmod.2019.01.001 · Cited by 23
“A recent study found that the epigenetic age (or more precisely termed ‘DNA methylation (DNAm) age’), a distinctive pattern of DNA methylation marks from which a donor’s age can be predicted, was the same between iNs and their parental fibroblast [30].”
BackgroundPrytkova, I., & Brennand, K. (2017) · Frontiers in Cellular Neuroscience · doi:10.3389/fncel.2017.00360 · Cited by 20
“While reprogramming of fibroblasts into hiPSCs erases age-related epigenetic marks and gene expression profiles, these can be at least partially maintained by inducing patient somatic cells directly into neurons (Mertens et al., 2015; Huh et al., 2016).”
BackgroundDirect Conversion of Human Fibroblasts to Induced Neurons
Zhou-Yang, L., Eichhorner, S., Karbacher, L., Böhnke, L., Traxler, L., & Mertens, J. (2021) · Methods in molecular biology · doi:10.1007/978-1-0716-1601-7_6 · Cited by 20
Monk, R., Lee, K. C., Jones, K. S., & Connor, B. J. (2021) · Stem Cells · doi:10.1002/stem.3420 · Cited by 17
“The lack of cellular rejuvenation, shorter reprogramming durations and reduced labor required for iN generation are attractive for disease modeling.(14,15) However, iNs do not follow successive stages of neurodevelopment.”
BackgroundSchlachetzki, J. C. M., Toda, T., & Mertens, J. (2020) · Experimental Gerontology · doi:10.1016/j.exger.2020.110876 · Cited by 18
“Unlike iPSC-derived neurons, iNs show mature neuronal 5-hmC methylation and show transcriptomic aging signatures and preservation of their donors’ DNAm clock ages (Table 1)(Herdy et al., 2019; Huh et al., 2016).”
BackgroundCell reprogramming: methods, mechanisms and applications
Zhu, F., & Nie, G. (2025) · Cell Regeneration · doi:10.1186/s13619-025-00229-x · Cited by 26
“…(MET) (Li et al. 2010; Samavarchi-Tehrani et al. 2010), (4) a metabolic remodeling from oxidative phosphorylation to glyco-lysis-based metabolism (Zhang et al. 2016; Zhu et al. 2024), (5) the activation of early pluripotency-associ-ated genes (such as alkaline phosphatase and SSEA-1 in mouse;…”
Kajtez, J., Nilsson, F., Laurin, K., Bruzelius, A., Cepeda-Prado, E., Birtele, M., Barker, R. A., Herborg, F., Ottosson, D. R., Storm, P., et al. (2025) · Science Advances · doi:10.1126/sciadv.adq7855 · Cited by 16
“Besides being an invaluable tool to create patient and disease-specific neurons for modeling of age-associated neurological disorders ( 11 – 15 ), direct reprogramming offers a promising nonpluripotent cell source for personalized transplantation-based therapies for neurodegenerative diseases.”
Wheeler, H. B., Madrigal, A. A., & Chaim, I. A. (2024) · Proceedings of the National Academy of Sciences · doi:10.1073/pnas.2317860121 · Cited by 17
“Excitingly, a recent technological advancement that can help overcome this limitation is the direct differentia - tion of fibroblasts to desired neuronal populations (143, 144).”
A cellular identity crisis? Plasticity changes during aging and rejuvenationPreprint
Gorelov, R. A., & Hochedlinger, K. (2024) · Genes & Development · doi:10.1101/gad.351728.124 · Cited by 18
“2; Horvath 2013; Huh et al. 2016; Sheng et al. 2018).”
Szabo, L., Lejri, I., Grimm, A., & Eckert, A. (2024) · Antioxidants · doi:10.3390/antiox13121482 · Cited by 18
“Specifically, common findings in humans, animals, and reprogrammed neurons have demonstrated an age-related decrease in the antioxidative defense system [42,54,55] together with heightened ROS levels [56,57], leading to an augmentation in oxidative stress [58,59].”
Flitsch, L. J., & Brüstle, O. (2019) · F1000Research · doi:10.12688/f1000research.18926.1 · Cited by 16
Neurodegeneration in a dish: advancing human stem-cell-based models of Alzheimer’s disease
Klimmt, J., Dannert, A., & Paquet, D. (2020) · Current Opinion in Neurobiology · doi:10.1016/j.conb.2020.01.008 · Cited by 16
Habekost, M., Qvist, P., Denham, M., Holm, I. E., & Jørgensen, A. L. (2021) · Molecular Neurobiology · doi:10.1007/s12035-020-02258-w · Cited by 14
“In contrast, direct conversion of fibroblasts into induced neurons (iNs) circumvents the pluripotent intermediate state, and it has been demonstrated that iNs retain the transcriptomic and epigenetic age of the starting cells [29, 35].”
BackgroundDirect Reprogramming of Somatic Cells to Neurons: Pros and Cons of Chemical Approach
Mollinari, C., & Merlo, D. (2021) · Neurochemical Research · doi:10.1007/s11064-021-03282-5 · Cited by 15
Human iPSC-Derived Neurons as A Platform for Deciphering the Mechanisms behind Brain Aging
Chao, C., Shen, P.-W., Tzeng, T., Kung, H., Tsai, T., & Wong, Y. (2021) · Biomedicines · doi:10.3390/biomedicines9111635 · Cited by 13
Gudenschwager, C., Chavez, I., Cárdenas, C., & González-Billault, C. E. (2021) · Oxidative Medicine and Cellular Longevity · doi:10.1155/2021/5586052 · Cited by 12
“Moreover, in iMSNs, the length of telomeres is unaltered, and it corresponds to the telomere length of the starting fibroblasts, which is related to the donor’s age [4].”
BackgroundInfluentialGenetic and Epigenetic Interplay Define Disease Onset and Severity in Repeat Diseases
Barbé, L., & Finkbeiner, S. M. (2022) · Frontiers in Aging Neuroscience · doi:10.3389/fnagi.2022.750629 · Cited by 15
“…Junien, 1993; Sabouri et al., 1993; Shaw et al., 1993; Jansen et al., 1996; Benders et al., 1997; Berul et al., 1999; Eriksson et al., 2000, 2001; Inukai et al., 2000; Klesert et al., 2000; Mounsey et al., 2000; Sarkar et al., 2000; Depardon et al., 2001; Coffee et al., 2002) YES (Tabolacci et…”
BackgroundAdvances in mt-tRNA Mutation-Caused Mitochondrial Disease Modeling: Patients’ Brain in a Dish
Povea-Cabello, S., Paz, M. V., Suarez-Rivero, J. M., Álvarez-Córdoba, M., Villalón-García, I., Talaverón-Rey, M., Suárez-Carrillo, A., Munuera-Cabeza, M., & Sánchez-Alcázar, J. A. (2021) · Frontiers in Genetics · doi:10.3389/fgene.2020.610764 · Cited by 14
Applications of Functional Genomics for Drug Discovery
Kabadi, A. M., McDonnell, E., Frank, C. L., & Drowley, L. (2020) · SLAS DISCOVERY · doi:10.1177/2472555220902092 · Cited by 15
Research models to study lewy body dementia
Boschen, S. L., Mukerjee, A. A., Faroqi, A. H., Rabichow, B. E., & Fryer, J. D. (2025) · Molecular Neurodegeneration · doi:10.1186/s13024-025-00837-w · Cited by 16
“Direct neuronal reprogramming, by which a neuron is formed via direct conversion from a somatic cell without going through a pluripotent intermediate stage, allows the possibility to generate patient-derived neurons that maintain the aging and epigenetic signatures of the donor [128, 129].”
Stem Cell Models for Context-Specific Modeling in Psychiatric Disorders
Seah, C., Huckins, L. M., & Brennand, K. (2022) · Biological Psychiatry · doi:10.1016/j.biopsych.2022.09.033 · Cited by 12
Transcriptomic reprogramming for neuronal age reversal
Pleşa, A. M., Shadpour, M., Boyden, E. S., & Church, G. M. (2023) · Human Genetics · doi:10.1007/s00439-023-02529-1 · Cited by 13
Metadata
- Authors
- Huh, C. J., Zhang, B., Victor, M. B., Dahiya, S., Batista, L. F., Horvath, S., & Yoo, A. S.
- Affiliations
- Washington University in St. Louis (US)
- Department of Developmental Biology, Washington University School of Medicine, St. Louis, United States
- University of California, Los Angeles (US)
- Corresponding author
- Yoo, Andrew S
- Venue
- eLife
- Publisher
- eLife Sciences Publications, Ltd
- Published
- 2016-09-20
- Volume
- 5
- ISSN
- 2050-084X (ISSN-L)
- PMC
- PMC5067114
- OpenAlex
- W2521543069
- Cited by
- 213
- References
- 57
- Citations by year
- 2026: 16 · 2025: 18 · 2024: 23 · 2023: 22 · 2022: 17 · 2021: 33 · 2020: 29 · 2019: 17 · 2018: 26 · 2017: 11
- FWCI
- 9.35
- Type
- journal article
- Language
- en
- Open access
- gold
- doi.org
- Licence
- Locations
- eLife (publishedVersion, cc-by)
- PubMed Central (publishedVersion, cc-by)
- PubMed (publishedVersion)
- Digital Commons@Becker (Washington University School of Medicine) (submittedVersion)
- DOAJ (DOAJ: Directory of Open Access Journals) (submittedVersion, cc-by-sa)
- Funders
- National Institute on Drug Abuse (R25 DA027995)
- National Institutes of Health (K99/R00, 4R00HL114732-03, 1U34AG051425-01, 5R01, AG042511-02, DP2NS083372-01)
- Washington University in St. Louis (DDRCC, NIDDK P30 DK052574)
- Ellison Medical Foundation (AG-NS-0878-12)
- Cure Alzheimer's Fund
- Topics
- Life Sciences › Biochemistry, Genetics and Molecular Biology › Molecular Biology › Pluripotent Stem Cells Research
- Life Sciences › Biochemistry, Genetics and Molecular Biology › Aging › Genetics, Aging, and Longevity in Model Organisms
- Life Sciences › Biochemistry, Genetics and Molecular Biology › Cell Biology › Telomeres, Telomerase, and Senescence
- Keywords
- neuronal aging, fibroblast-to-neuron conversion, epigenetic clocks, DNA methylation, age-related gene expression, oxidative stress, DNA damage, telomere length, neurodegenerative diseases, human neurons
- MeSH terms
- Aging, Cytological Techniques, DNA Damage, Fibroblasts, Humans, Neurons, Telomere, Oxidative Stress, Gene Expression Profiling, MicroRNAs, Epigenesis, Genetic, Cell Transdifferentiation
About these checks
Registry, retraction, Cites and statistics results are computed, not judged, with one exception: a printed reference that no index lists is read once by a model before it counts as a citation error. Claims are extracted by a model and kept only when their quote appears verbatim in the text; each cited source is then checked, with a model’s help, for whether it says what the claim relies on. Those verdicts can be wrong — read the claim’s quote and the cited source before relying on one.
Statistics and arithmetic are recomputed, not judged.
Confidence bands are shown only for fields calibrated on our annotated test set. None is calibrated yet, so no band is shown.
What counts as a claim ›How we measure confidence ›How we check this ›
Are you an author, or do you see a problem with this page? Request a review
