

The DOI matches its Crossref record; 70 of the 73 references it cites were found in a registry or an index.
Acetyl-CoA Synthetase 2 Promotes Acetate Utilization and Maintains Cancer Cell Growth under Metabolic Stress
Open accessAbstract
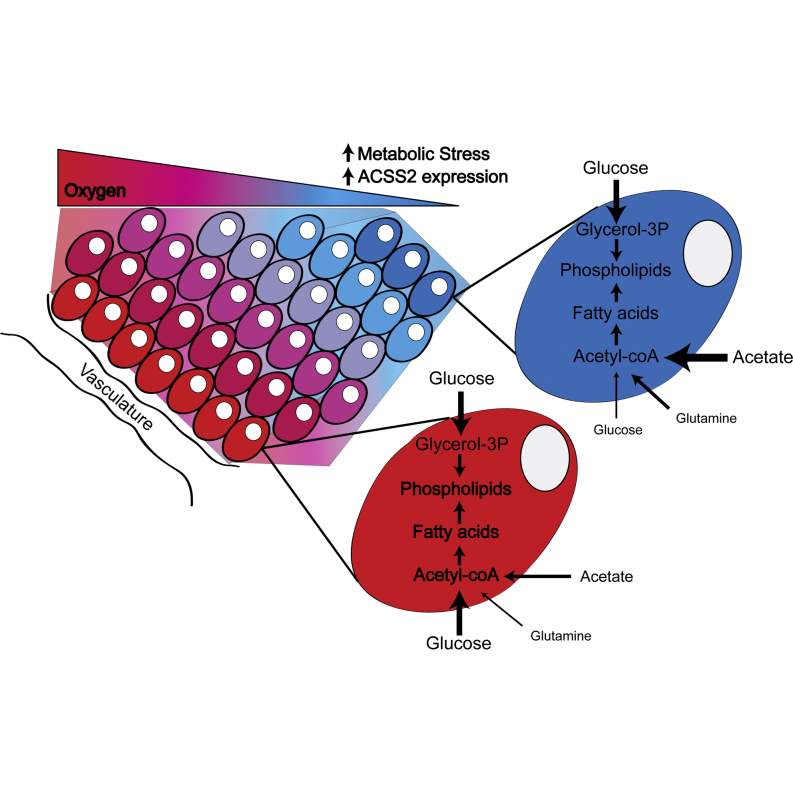
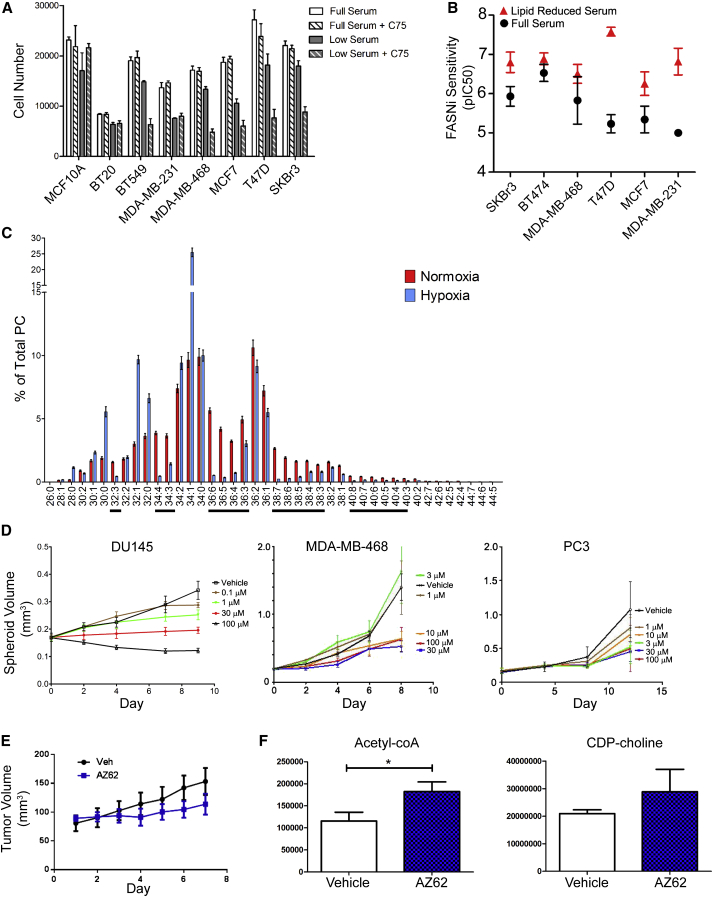
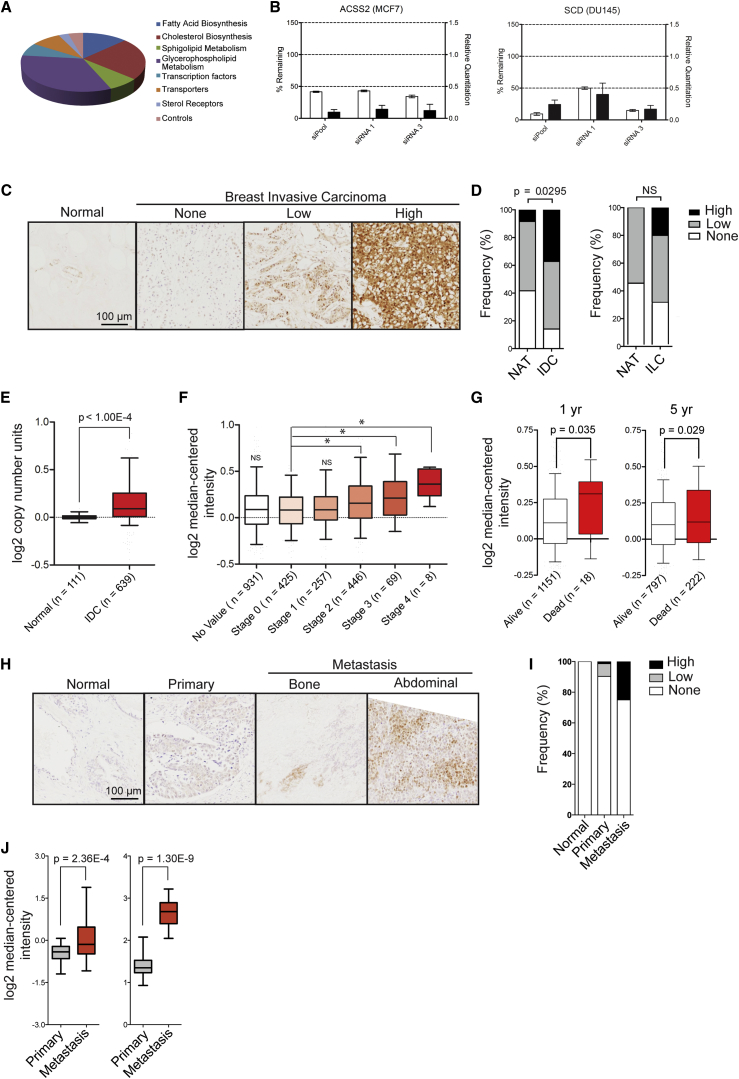
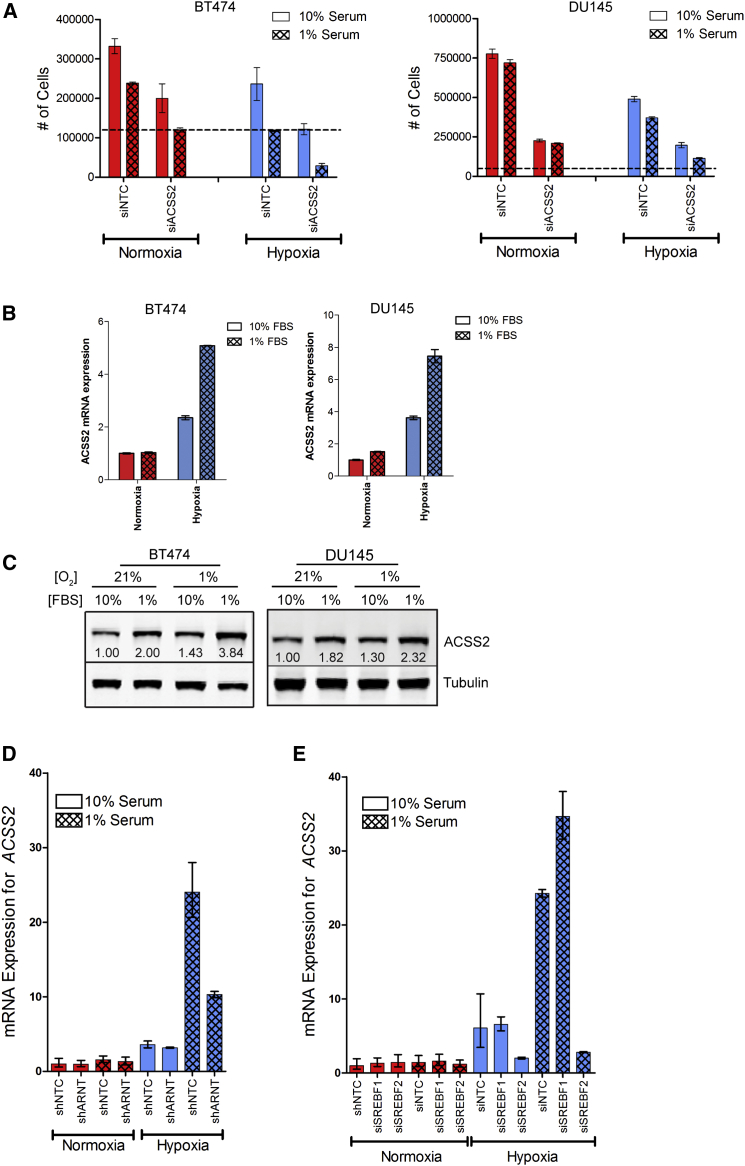
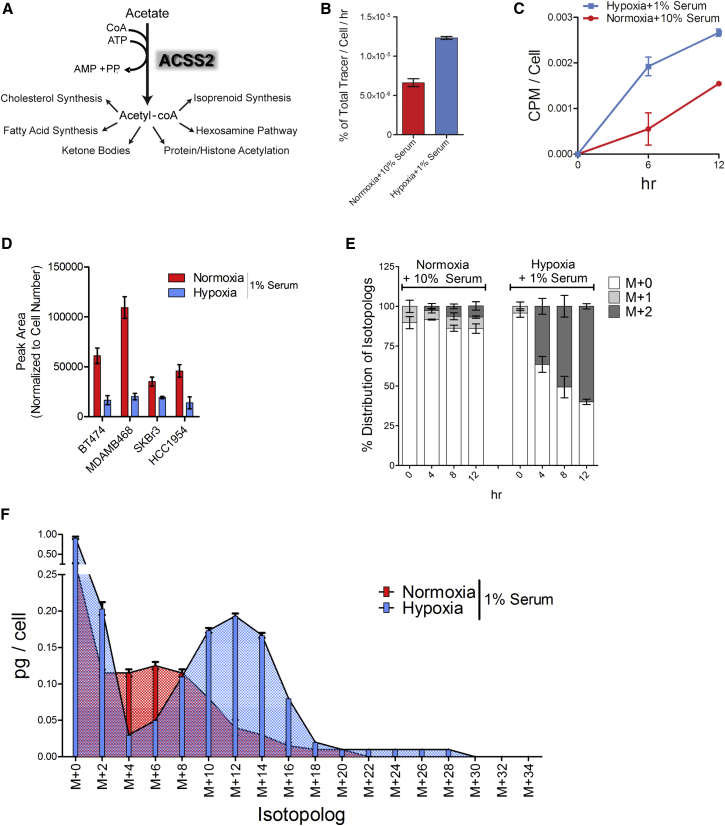
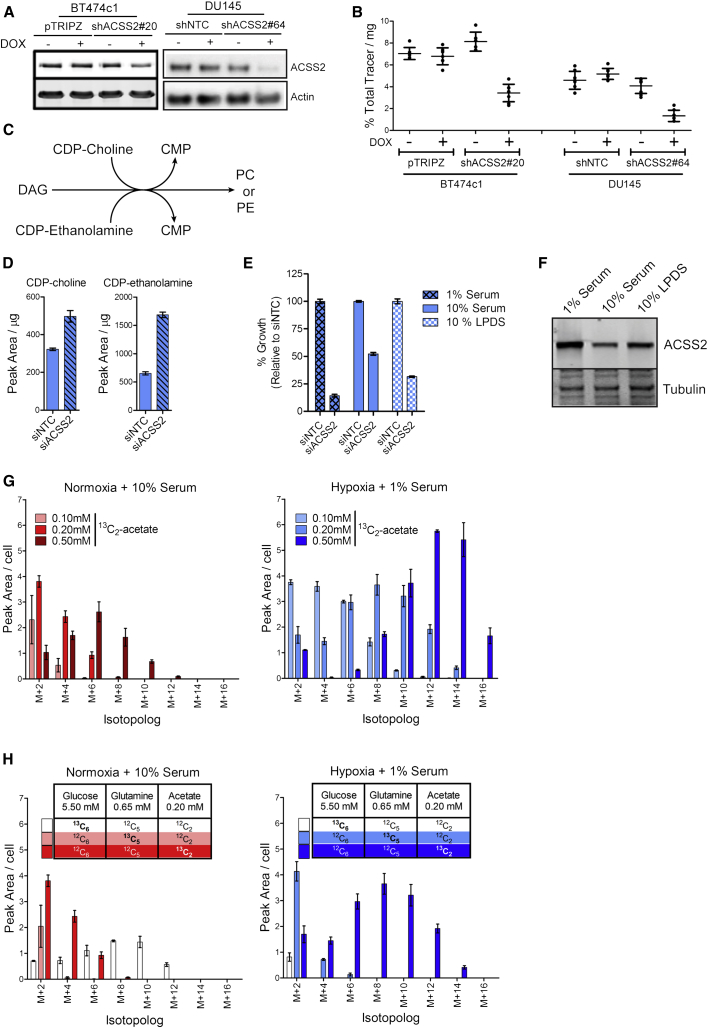
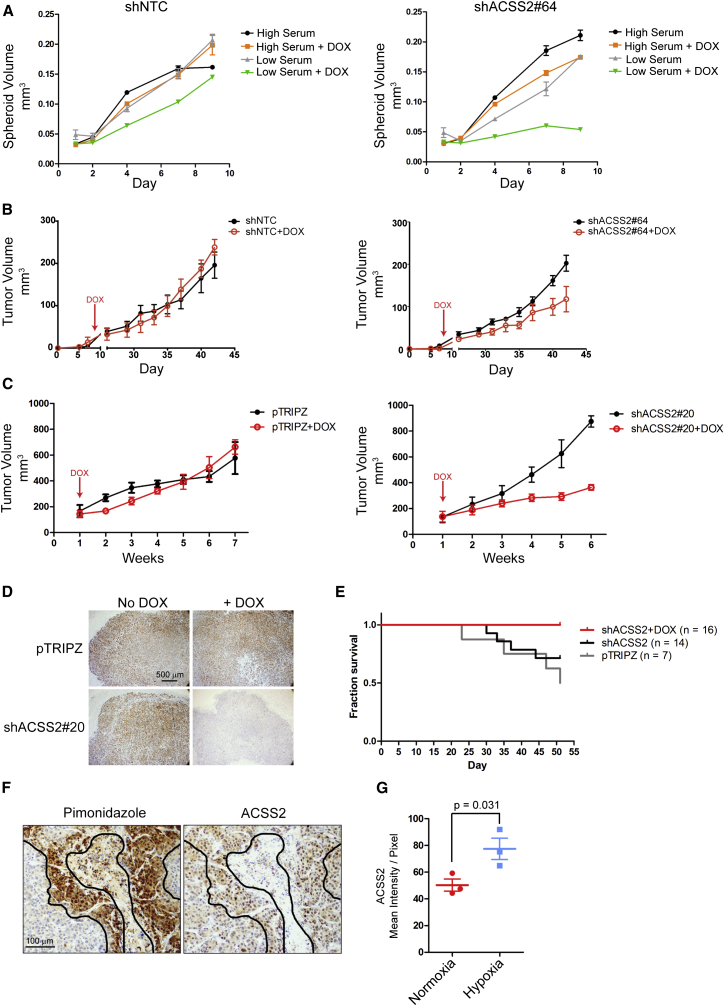
A functional genomics study revealed that the activity of acetyl-CoA synthetase 2 (ACSS2) contributes to cancer cell growth under low-oxygen and lipid-depleted conditions. Comparative metabolomics and lipidomics demonstrated that acetate is used as a nutritional source by cancer cells in an ACSS2-dependent manner, and supplied a significant fraction of the carbon within the fatty acid and phospholipid pools. ACSS2 expression is upregulated under metabolically stressed conditions and ACSS2 silencing reduced the growth of tumor xenografts. ACSS2 exhibits copy-number gain in human breast tumors, and ACSS2 expression correlates with disease progression. These results signify a critical role for acetate consumption in the production of lipid biomass within the harsh tumor microenvironment.
Overview
The claims and statistics of this paper haven’t been checked yet.
Run the check — free, no account needed. It reads the open-access text and checks the sources it cites.
Integrity signals
Registry
Cites
Statistics
Figures
Verification
Claims the paper makes
The claims and statistics of this paper haven’t been checked yet.
Run the check — free, no account needed. It reads the open-access text and checks the sources it cites.
Claims other papers make about this one
Each is checked against this paper’s own text: does it say what the citing paper says it does?
In the citing paper
“Some cancers are nevertheless dependent on expression of acetyl-CoA synthetase 2 (ACSS2), the cytosolic enzyme that allows cells to synthesize acetyl-CoA from acetate, making this represents a potential therapeutic target (Comerford et al., 2014; Schug et al., 2015).”
From Targeting Metabolism for Cancer Therapy (2017) · cites this paper as Schug et al., 2015
In the citing paper
“In cancer cells, citrate becomes labeled following supplementation of cells with isotopically labeled acetate ([13C]acetate), indicating that acetate can undergo oxidation in the TCA cycle in cultured cell lines (69).”
From Regulation and function of the mammalian tricarboxylic acid cycle (2023) · cites this paper as [69]
In the citing paper
“Finally, extracellular acetate has recently been shown to be utilized by some cancers as a source of acetyl-CoA for biosynthesis.”
From The emerging hallmarks of cancer metabolism (2016) · cites this paper as Schug et al., 2015
In the citing paper
“Specifically, a variety of tumor types localized to the brain, including primary glioblastomas as well as brain metastases that originated from other tissues, have been shown to assimilate exogenous acetate and incorporate acetate-derived carbons into de novo synthesized fatty acids (Comerford et al., 2014; Mashimo et al., 2014; Schug et al., 2015).”
From The emerging hallmarks of cancer metabolism (2016) · cites this paper as Schug et al., 2015
Self-check
Percentages, sums and reported differences re-computed from the paper’s own numbers.
The self-check needs the paper’s full text.
Citations
Cites
The Cancer Cell Line Encyclopedia enables predictive modelling of anticancer drug sensitivity
Barretina, J., Caponigro, G., Stransky, N., Venkatesan, K., Margolin, A. A., Kim, S., Wilson, C. J., Lehár, J., Kryukov, G. V., Sonkin, D., et al. (2012) · Nature · doi:10.1038/nature11003 · Cited by 7,950
The genomic and transcriptomic architecture of 2,000 breast tumours reveals novel subgroups
METABRIC Group, Curtis, C., Shah, S. P., Chin, S.-F., Turashvili, G., Rueda, O. M., Dunning, M. J., Speed, D., Lynch, A. G., Samarajiwa, S., et al. (2012) · Nature · doi:10.1038/nature10983 · Cited by 6,097
Kim, J.-W., Tchernyshyov, I., Semenza, G. L., & Dang, C. V. (2006) · Cell Metabolism · doi:10.1016/j.cmet.2006.02.002 · Cited by 3,905
Fatty acid synthase and the lipogenic phenotype in cancer pathogenesis
Menendez, J. A., & Lupu, R. (2007) · Nature Reviews Cancer · doi:10.1038/nrc2222 · Cited by 2,941
COSMIC: mining complete cancer genomes in the Catalogue of Somatic Mutations in Cancer
Forbes, S. A., Bindal, N., Bamford, S., Cole, C., Kok, C. Y., Beare, D., Jia, M., Shepherd, R., Leung, K., Menzies, A., et al. (2011) · Nucleic Acids Research · doi:10.1093/nar/gkq929 · Cited by 2,278
HIF-1 mediates adaptation to hypoxia by actively downregulating mitochondrial oxygen consumption
Papandreou, I., Cairns, R. A., Fontana, L., Lim, A. L., & Denko, N. C. (2006) · Cell Metabolism · doi:10.1016/j.cmet.2006.01.012 · Cited by 2,267
Pinkel, D., Segraves, R., Sudar, D., Clark, S. M., Poole, I., Kowbel, D., Collins, C. C., Kuo, W.-L., Chen, C., Zhai, Y., et al. (1998) · Nature Genetics · doi:10.1038/2524 · Cited by 2,238
Reductive glutamine metabolism by IDH1 mediates lipogenesis under hypoxia
Metallo, C. M., Gameiro, P. A., Bell, E. L., Mattaini, K. R., Yang, J., Hiller, K., Jewell, C. M., Johnson, Z. R., Irvine, D. J., Guarente, L., et al. (2012) · Nature · doi:10.1038/nature10602 · Cited by 1,791
Kimura, I., Ozawa, K., Inoue, D., Imamura, T., Kimura, K., Maeda, T., Terasawa, K., Kashihara, D., Hirano, K., Tani, T., et al. (2013) · Nature Communications · doi:10.1038/ncomms2852 · Cited by 1,512
SREBP activity is regulated by mTORC1 and contributes to Akt-dependent cell growth
Porstmann, T., Santos, C. R., Griffiths, B., Cully, M., Wu, M., Leevers, S., Griffiths, J. R., Chung, Y.-L., & Schulze, A. (2008) · Cell Metabolism · doi:10.1016/j.cmet.2008.07.007 · Cited by 1,413
Self-citation
Cited by
Sorted by citations
The emerging hallmarks of cancer metabolism
Pavlova, N. N., & Thompson, C. B. (2016) · Cell Metabolism · doi:10.1016/j.cmet.2015.12.006 · Cited by 5,926
Fundamentals of Cancer Metabolism
DeBerardinis, R. J., & Chandel, N. S. (2016) · Science Advances · doi:10.1126/sciadv.1600200 · Cited by 3,013
Mitochondrial TCA cycle metabolites control physiology and disease
Martínez-Reyes, I., & Chandel, N. S. (2020) · Nature Communications · doi:10.1038/s41467-019-13668-3 · Cited by 2,813
The multifaceted roles of fatty acid synthesis in cancer
Röhrig, F., & Schulze, A. (2016) · Nature Reviews Cancer · doi:10.1038/nrc.2016.89 · Cited by 1,651
Self-citationReprogramming of fatty acid metabolism in cancer
Koundouros, N., & Poulogiannis, G. (2019) · British Journal of Cancer · doi:10.1038/s41416-019-0650-z · Cited by 1,669
Cancer metabolism: a therapeutic perspective
Martinez-Outschoorn, U. E., Peiris-Pagés, M., Pestell, R. G., Sotgia, F., & Lisanti, M. P. (2017) · Nature Reviews Clinical Oncology · doi:10.1038/nrclinonc.2016.60 · Cited by 1,505
Metabolic pathways promoting cancer cell survival and growth
Boroughs, L. K., & DeBerardinis, R. J. (2015) · Nature Cell Biology · doi:10.1038/ncb3124 · Cited by 1,499
Acetyl coenzyme A: a central metabolite and second messenger
Pietrocola, F., Galluzzi, L., Bravo-San Pedro, J. M., Madeo, F., & Kroemer, G. (2015) · Cell Metabolism · doi:10.1016/j.cmet.2015.05.014 · Cited by 1,378
The cancer metabolic reprogramming and immune response
Xia, L., Oyang, L., Lin, J., Tan, S., Han, Y., Wu, N., Yi, P., Tang, L., Pan, Q., Rao, S., et al. (2021) · Molecular Cancer · doi:10.1186/s12943-021-01316-8 · Cited by 1,312
Targeting cancer metabolism in the era of precision oncology
Stine, Z. E., Schug, Z. T., Salvino, J. M., & Dang, C. V. (2022) · Nature Reviews Drug Discovery · doi:10.1038/s41573-021-00339-6 · Cited by 1,189
Self-citationTumour acidosis: from the passenger to the driver's seat
Corbet, C., & Féron, O. (2017) · Nature reviews. Cancer · doi:10.1038/nrc.2017.77 · Cited by 1,028
Bian, X., Liu, R. R., Meng, Y., Xing, D., Xu, D., & Lu, Z. (2020) · The Journal of Experimental Medicine · doi:10.1084/jem.20201606 · Cited by 1,037
Targeting Metabolism for Cancer Therapy
Luengo, A., Gui, D. Y., & Vander Heiden, M. G. (2017) · Cell Chemical Biology · doi:10.1016/j.chembiol.2017.08.028 · Cited by 971
The metabolism of cancer cells during metastasis
Bergers, G., & Fendt, S. (2021) · Nature reviews. Cancer · doi:10.1038/s41568-020-00320-2 · Cited by 974
Modulation of cellular processes by histone and non-histone protein acetylation
Shvedunova, M., & Akhtar, A. (2022) · Nature Reviews Molecular Cell Biology · doi:10.1038/s41580-021-00441-y · Cited by 1,007
Lipid metabolism reprogramming and its potential targets in cancer
Cheng, C., Geng, F., Cheng, X., & Guo, D. (2018) · 癌症:英文版 · doi:10.1186/s40880-018-0301-4 · Cited by 880
Metabolic reprogramming and epigenetic modifications on the path to cancer
Sun, L., Zhang, H., & Gao, P. (2021) · Protein & Cell · doi:10.1007/s13238-021-00846-7 · Cited by 818
Hypoxia and Metabolic Adaptation of Cancer Cells
Eales, K. L., Hollinshead, K. E. R., & Tennant, D. A. (2016) · Oncogenesis · doi:10.1038/oncsis.2015.50 · Cited by 724
The interplay between cell signalling and the mevalonate pathway in cancer
Mullen, P., Yu, R., Longo, J., Archer, M. C., & Penn, L. Z. (2016) · Nature reviews. Cancer · doi:10.1038/nrc.2016.76 · Cited by 714
Hosios, A. M., Hecht, V. C., Danai, L. V., Johnson, M. O., Rathmell, J. C., Steinhauser, M. L., Manalis, S. R., & Vander Heiden, M. G. (2016) · Developmental Cell · doi:10.1016/j.devcel.2016.02.012 · Cited by 641
Cantor, J. R., Abu-Remaileh, M., Kanarek, N., Freinkman, E., Gao, X., Louissaint, A., Lewis, C. A., & Sabatini, D. M. (2017) · Cell · doi:10.1016/j.cell.2017.03.023 · Cited by 638
Lipids and cancer: Emerging roles in pathogenesis, diagnosis and therapeutic intervention
Butler, L. M., Perone, Y., Dehairs, J., Lupien, L. E., de Laat, V., Talebi, A., Loda, M., Kinlaw, W. B., & Swinnen, J. V. (2020) · Advanced Drug Delivery Reviews · doi:10.1016/j.addr.2020.07.013 · Cited by 589
Sullivan, M. R., Danai, L. V., Lewis, C. A., Chan, S. H., Gui, D. Y., Kunchok, T., Dennstedt, E. A., Vander Heiden, M. G., & Muir, A. (2019) · eLife · doi:10.7554/elife.44235 · Cited by 588
Inhibition of Amino Acid Metabolism Selectively Targets Human Leukemia Stem Cells
Jones, C. L., Stevens, B. M., D'Alessandro, A., Reisz, J. A., Culp-Hill, R., Nemkov, T., Pei, S., Khan, N., Adane, B., Ye, H., et al. (2018) · Cancer Cell · doi:10.1016/j.ccell.2018.10.005 · Cited by 585
Reductive carboxylation supports redox homeostasis during anchorage-independent growth
Jiang, L., Shestov, A. A., Swain, P., Yang, C., Parker, S. J., Wang, Q. A., Terada, L. S., Adams, N. D., McCabe, M. T., Pietrak, B., et al. (2016) · Nature · doi:10.1038/nature17393 · Cited by 582
Williams, N. C., & O'Neill, L. A. J. (2018) · Frontiers in Immunology · doi:10.3389/fimmu.2018.00141 · Cited by 599
Anticancer effects of the microbiome and its products
Zitvogel, L., Daillère, R., Roberti, M. P., Routy, B., & Kroemer, G. (2017) · Nature Reviews Microbiology · doi:10.1038/nrmicro.2017.44 · Cited by 538
Regulation and function of the mammalian tricarboxylic acid cycle
Arnold, P. K., & Finley, L. W. S. (2023) · Journal of Biological Chemistry · doi:10.1016/j.jbc.2022.102838 · Cited by 535
“In cancer cells, citrate becomes labeled following supplementation of cells with isotopically labeled acetate ([(13)C] acetate), indicating that acetate can undergo oxidation in the TCA cycle in cultured cell lines (69).”
BackgroundThe gut microbiota influences anticancer immunosurveillance and general health
Routy, B., Gopalakrishnan, V., Daillère, R., Zitvogel, L., Wargo, J. A., & Kroemer, G. (2018) · Nature Reviews Clinical Oncology · doi:10.1038/s41571-018-0006-2 · Cited by 523
Acetate functions as an epigenetic metabolite to promote lipid synthesis under hypoxia
Gao, X. J., Lin, S., Ren, F., Li, J.-T., Chen, J.-J., Yao, C.-B., Yang, H., Jiang, S.-X., Yan, G.-Q., Wang, D., et al. (2016) · Nature Communications · doi:10.1038/ncomms11960 · Cited by 494
Liu, X., & Locasale, J. W. (2017) · Trends in Biochemical Sciences · doi:10.1016/j.tibs.2017.01.004 · Cited by 453
Oxygen availability and metabolic adaptations
Nakazawa, M. S., Keith, B., & Simon, M. C. (2016) · Nature reviews. Cancer · doi:10.1038/nrc.2016.84 · Cited by 446
Metabolic control of epigenetics in cancer
Kinnaird, A. S., Zhao, S., Wellen, K. E., & Michelakis, E. D. (2016) · Nature reviews. Cancer · doi:10.1038/nrc.2016.82 · Cited by 429
Acetate Production from Glucose and Coupling to Mitochondrial Metabolism in Mammals
Liu, X., Cooper, D. E., Cluntun, A. A., Warmoes, M. O., Zhao, S., Reid, M. A., Liu, J., Lund, P. J., Lopes, M. D. C., Garcia, B. A., et al. (2018) · Cell · doi:10.1016/j.cell.2018.08.040 · Cited by 421
Targeting hypoxic tumor microenvironment in pancreatic cancer
Tao, J., Yang, G., Zhou, W., Qiu, J., Chen, G., Luo, W., Zhao, F., You, L., Zheng, L., Zhang, T., et al. (2021) · Journal of Hematology & Oncology · doi:10.1186/s13045-020-01030-w · Cited by 431
The emerging link between cancer, metabolism, and circadian rhythms
Masri, S., & Sassone‐Corsi, P. (2018) · Nature Medicine · doi:10.1038/s41591-018-0271-8 · Cited by 418
Improving the metabolic fidelity of cancer models with a physiological cell culture medium
Voorde, J. V., Ackermann, T., Pfetzer, N., Sumpton, D. P., Mackay, G., Kalna, G., Nixon, C., Blyth, K., Gottlieb, E., & Tardito, S. (2019) · Science Advances · doi:10.1126/sciadv.aau7314 · Cited by 400
Self-citationATP-citrate lyase controls a glucose-to-acetate metabolic switch
Zhao, S., Torres, A., Henry, R. A., Trefely, S., Wallace, M., Lee, J. V., Carrer, A., Sengupta, A., Campbell, S. L., Kuo, Y.-M., et al. (2016) · Cell Reports · doi:10.1016/j.celrep.2016.09.069 · Cited by 394
Similarities and Distinctions of Cancer and Immune Metabolism in Inflammation and Tumors
Andrejeva, G., & Rathmell, J. C. (2017) · Cell Metabolism · doi:10.1016/j.cmet.2017.06.004 · Cited by 374
McBrayer, S. K., Mayers, J. R., DiNatale, G. J., Shi, D. D., Khanal, J., Chakraborty, A. A., Sarosiek, K. A., Briggs, K. J., Robbins, A. K., Sewastianik, T., et al. (2018) · Cell · doi:10.1016/j.cell.2018.08.038 · Cited by 368
Lipid metabolism in cancer cells under metabolic stress
Munir, R., Lisec, J., Swinnen, J. V., & Zaidi, N. (2019) · British Journal of Cancer · doi:10.1038/s41416-019-0451-4 · Cited by 382
Metabolic reprogramming for cancer cells and their microenvironment: Beyond the Warburg Effect
Sun, L., Suo, C., Li, S., Zhang, H., & Gao, P. (2018) · Biochimica et Biophysica Acta (BBA) - Reviews on Cancer · doi:10.1016/j.bbcan.2018.06.005 · Cited by 374
Balmer, M. L., Ma, E. H., Bantug, G. R., Grählert, J., Pfister, S., Glatter, T., Jauch, A., Dimeloe, S., Slack, E., Dehio, P., et al. (2016) · Immunity · doi:10.1016/j.immuni.2016.03.016 · Cited by 361
Nucleus-Translocated ACSS2 Promotes Gene Transcription for Lysosomal Biogenesis and Autophagy
Li, X., Yu, W., Qian, X., Xia, Y., Zheng, Y., Lee, J.-H., Li, W., Lyu, J., Rao, G., Zhang, X., et al. (2017) · Molecular Cell · doi:10.1016/j.molcel.2017.04.026 · Cited by 378
Spatiotemporal Control of Acetyl-CoA Metabolism in Chromatin Regulation
Sivanand, S., Viney, I. A., & Wellen, K. E. (2017) · Trends in Biochemical Sciences · doi:10.1016/j.tibs.2017.11.004 · Cited by 374
Acetate Promotes T Cell Effector Function during Glucose Restriction
Qiu, J., Villa, M., Sanin, D. E., Buck, M. D., O’Sullivan, D., Ching, R., Matsushita, M., Grzes, K. M., Winkler, F., Chang, C.-H., et al. (2019) · Cell Reports · doi:10.1016/j.celrep.2019.04.022 · Cited by 342
Corbet, C., Pinto, A., Martherus, R., de Jesus, J. T. C. L., Polet, F., & Féron, O. (2016) · Cell Metabolism · doi:10.1016/j.cmet.2016.07.003 · Cited by 340
The metabolic fate of acetate in cancer
Schug, Z. T., Vande Voorde, J., & Gottlieb, E. (2016) · Nature reviews. Cancer · doi:10.1038/nrc.2016.87 · Cited by 331
Self-citationFatty acid synthesis is required for breast cancer brain metastasis
Ferraro, G. B., Ali, A., Luengo, A., Kodack, D. P., Deik, A., Abbott, K. L., Bezwada, D., Blanc, L., Prideaux, B., Jin, X., et al. (2021) · Nature Cancer · doi:10.1038/s43018-021-00183-y · Cited by 328
Wilde, L. R., Roche, M. E., Domingo‐Vidal, M., Tanson, K., Philp, N. J., Curry, J., & Martinez‐Outschoorn, U. (2017) · Seminars in Oncology · doi:10.1053/j.seminoncol.2017.10.004 · Cited by 338
Metabolic signatures of cancer cells and stem cells
Intlekofer, A. M., & Finley, L. W. S. (2019) · Nature Metabolism · doi:10.1038/s42255-019-0032-0 · Cited by 322
Role of glutamine and interlinked asparagine metabolism in vessel formation
Huang, H., Vandekeere, S., Kalucka, J., Bierhansl, L., Zecchin, A., Brüning, U., Visnagri, A., Yuldasheva, N., Goveia, J., Cruys, B., et al. (2017) · The EMBO Journal · doi:10.15252/embj.201695518 · Cited by 320
Review: Synovial Cell Metabolism and Chronic Inflammation in Rheumatoid Arthritis
Falconer, J., Murphy, A. N., Young, S. P., Clark, A. R., Tiziani, S., Gumá, M., & Buckley, C. D. (2018) · Arthritis & Rheumatology · doi:10.1002/art.40504 · Cited by 324
Compensatory metabolic networks in pancreatic cancers upon perturbation of glutamine metabolism
Biancur, D. E., Paulo, J. A., Małachowska, B., Quiles Del Rey, M., Sousa, C. M., Wang, X., Sohn, A. S. W., Chu, G. C., Gygi, S. P., Harper, J. W., et al. (2017) · Nature Communications · doi:10.1038/ncomms15965 · Cited by 315
Tan, Y., Li, J., Zhao, G., Huang, K., Cárdenas, H., Wang, Y., Matei, D. E., & Cheng, J. (2022) · Nature Communications · doi:10.1038/s41467-022-32101-w · Cited by 322
Acetyl-CoA Metabolism Supports Multistep Pancreatic Tumorigenesis
Carrer, A., Trefely, S., Zhao, S., Campbell, S. L., Norgard, R. J., Schultz, K. C., Sidoli, S., Parris, J. L. D., Affronti, H. C., Sivanand, S., et al. (2019) · Cancer Discovery · doi:10.1158/2159-8290.cd-18-0567 · Cited by 313
Muir, A., Danai, L. V., Gui, D. Y., Waingarten, C. Y., Lewis, C. A., & Vander Heiden, M. G. (2017) · eLife · doi:10.7554/elife.27713 · Cited by 311
Acetyl-CoA metabolism in cancer
Guertin, D. A., & Wellen, K. E. (2023) · Nature Reviews Cancer · doi:10.1038/s41568-022-00543-5 · Cited by 303
Fatty acid synthase (FASN) as a therapeutic target in breast cancer
Menéndez, J. A., & Lupu, R. (2017) · Expert Opinion on Therapeutic Targets · doi:10.1080/14728222.2017.1381087 · Cited by 297
Luis, G., Godfroid, A., Nishiumi, S., Cimino, J., Blacher, S., Maquoi, E., Wéry, C., Collignon, A., Longuespée, R., Montero‐Ruiz, L., et al. (2021) · Redox Biology · doi:10.1016/j.redox.2021.102006 · Cited by 303
Courtney, K. D., Bezwada, D., Mashimo, T., Pichumani, K., Vemireddy, V., Funk, A. M., Wimberly, J., McNeil, S. S., Kapur, P., Lotan, Y., et al. (2018) · Cell Metabolism · doi:10.1016/j.cmet.2018.07.020 · Cited by 280
Lipid metabolism and lipophagy in cancer
Maan, M., Peters, J. M., Dutta, M., & Patterson, A. D. (2018) · Biochemical and Biophysical Research Communications · doi:10.1016/j.bbrc.2018.02.097 · Cited by 282
Bulusu, V., Tumanov, S., Michalopoulou, E., van den Broek, N. J. F., Mackay, G., Nixon, C., Dhayade, S., Schug, Z. T., Voorde, J. V., Blyth, K., et al. (2017) · Cell Reports · doi:10.1016/j.celrep.2016.12.055 · Cited by 263
Self-citationA Metabolic Basis for Endothelial-to-Mesenchymal Transition
Xiong, J., Kawagishi, H., Yan, Y., Liu, J., Wells, Q. S., Edmunds, L. R., Fergusson, M. M., Yu, Z., Rovira, I. I., Brittain, E. L., et al. (2018) · Molecular Cell · doi:10.1016/j.molcel.2018.01.010 · Cited by 266
A guide to 13C metabolic flux analysis for the cancer biologist
Antoniewicz, M. R. (2018) · Experimental & Molecular Medicine · doi:10.1038/s12276-018-0060-y · Cited by 278
Kong, C., Liang, L., Liu, G., Du, L., Yang, Y., Liu, J., Shi, D., Li, X., & Ma, Y. (2023) · Gut · doi:10.1136/gutjnl-2022-327156 · Cited by 254
Peck, B., Schug, Z. T., Zhang, Q., Dankworth, B., Jones, D. T., Smethurst, E. A., Patel, R., Mason, S. M., Jiang, M., Saunders, R. E., et al. (2016) · Cancer & Metabolism · doi:10.1186/s40170-016-0146-8 · Cited by 248
Self-citationAn Overview: The Diversified Role of Mitochondria in Cancer Metabolism
Liu, Y., Sun, Y., Guo, Y., Shi, X., Chen, X., Feng, W., Wu, L., Zhang, J., Yu, S., Wang, Y., et al. (2023) · International Journal of Biological Sciences · doi:10.7150/ijbs.81609 · Cited by 275
Metabolic Hallmarks of Metastasis Formation
Elia, I., Doglioni, G., & Fendt, S. (2018) · Trends in Cell Biology · doi:10.1016/j.tcb.2018.04.002 · Cited by 253
Protein acylation: mechanisms, biological functions and therapeutic targets
Shang, S., Liu, J., & Hua, F. (2022) · Signal Transduction and Targeted Therapy · doi:10.1038/s41392-022-01245-y · Cited by 261
DNA Damage, Repair, and Cancer Metabolism
Turgeon, M., Perry, N. J. S., & Poulogiannis, G. (2018) · Frontiers in Oncology · doi:10.3389/fonc.2018.00015 · Cited by 249
Heterogeneity in Cancer Metabolism: New Concepts in an Old Field
Gentric, G., Mieulet, V., & Mechta‐Grigoriou, F. (2016) · Antioxidants and Redox Signaling · doi:10.1089/ars.2016.6750 · Cited by 248
Liu, P.-S., Chen, Y.-T., Li, X., Hsueh, P., Tzeng, S., Chen, H., Shi, P.-Z., Xie, X., Parik, S., Planque, M., et al. (2023) · Nature Immunology · doi:10.1038/s41590-023-01430-3 · Cited by 243
Gluconeogenesis in cancer cells – Repurposing of a starvation-induced metabolic pathway?
Bluemel, G., Smolle, E., Olschewski, H., & Leithner, K. (2019) · Biochimica et Biophysica Acta (BBA) - Reviews on Cancer · doi:10.1016/j.bbcan.2019.05.006 · Cited by 248
Metabolic regulation of chromatin modifications and gene expression
Schvartzman, J. M., Thompson, C. B., & Finley, L. W. S. (2018) · Journal of Cell Biology · doi:10.1083/jcb.201803061 · Cited by 233
Acetate Metabolism in Physiology, Cancer, and Beyond
Bose, S., Ramesh, V., & Locasale, J. W. (2019) · Trends in Cell Biology · doi:10.1016/j.tcb.2019.05.005 · Cited by 236
Metabolic Reprogramming in Breast Cancer and Its Therapeutic Implications
Gandhi, N. S., & Das, G. M. (2019) · Cells · doi:10.3390/cells8020089 · Cited by 237
Vazquez, A., Kamphorst, J. J., Markert, E. K., Schug, Z. T., Tardito, S., & Gottlieb, E. (2016) · Journal of Cell Science · doi:10.1242/jcs.181016 · Cited by 225
Self-citationUnique pattern of neutrophil migration and function during tumor progression
Patel, S., Fu, S., Mastio, J., Dominguez, G. A., Purohit, A., Kossenkov, A. V., Lin, C., Alicea-Torres, K. M., Sehgal, M., Nefedova, Y., et al. (2018) · Nature Immunology · doi:10.1038/s41590-018-0229-5 · Cited by 222
Self-citationUndercover: gene control by metabolites and metabolic enzymesPreprint
van der Knaap, J. A., & Verrijzer, C. P. (2016) · Genes & Development · doi:10.1101/gad.289140.116 · Cited by 222
Koizume, S., & Miyagi, Y. (2016) · International Journal of Molecular Sciences · doi:10.3390/ijms17091430 · Cited by 213
Kondo, A., Yamamoto, S., Nakaki, R., Shimamura, T., Hamakubo, T., Sakai, J., Kodama, T., Yoshida, T., Aburatani, H., & Osawa, T. (2017) · Cell Reports · doi:10.1016/j.celrep.2017.02.006 · Cited by 205
Metabolic reprogramming in renal cancer: Events of a metabolic disease
Chakraborty, S., Balan, M., Sabarwal, A., Choueiri, T. K., & Pal, S. (2021) · Biochimica et Biophysica Acta (BBA) - Reviews on Cancer · doi:10.1016/j.bbcan.2021.188559 · Cited by 214
Oxygen availability and metabolic reprogramming in cancer
Xie, H. J., & Simon, M. C. (2017) · Journal of Biological Chemistry · doi:10.1074/jbc.r117.799973 · Cited by 207
Metabolite sensing and signaling in cell metabolism
Wang, Y.-P., & Lei, Q. (2018) · Signal Transduction and Targeted Therapy · doi:10.1038/s41392-018-0024-7 · Cited by 208
Emerging role of PI3K/AKT in tumor-related epigenetic regulation
Yang, Q., Jiang, W., & Hou, P. (2019) · Seminars in Cancer Biology · doi:10.1016/j.semcancer.2019.04.001 · Cited by 210
Ge, T., Gu, X., Jia, R., Ge, S., Chai, P., Zhuang, A., & Fan, X. (2022) · 癌症:英文版 · doi:10.1002/cac2.12374 · Cited by 220
Vasseur, S., & Guillaumond, F. (2022) · Oncogenesis · doi:10.1038/s41389-022-00420-8 · Cited by 203
Moonlighting functions of metabolic enzymes and metabolites in cancer
Pan, C., Li, B., & Simon, M. C. (2021) · Molecular Cell · doi:10.1016/j.molcel.2021.08.031 · Cited by 198
Fat and Furious: Lipid Metabolism in Antitumoral Therapy Response and Resistance
Bacci, M., Lorito, N., Smiriglia, A., & Morandi, A. (2020) · Trends in cancer · doi:10.1016/j.trecan.2020.10.004 · Cited by 192
Metabolic adaptation of cancer and immune cells mediated by hypoxia-inducible factors
Samanta, D., & Semenza, G. L. (2018) · Biochimica et Biophysica Acta (BBA) - Reviews on Cancer · doi:10.1016/j.bbcan.2018.07.002 · Cited by 190
Lipid desaturation – the next step in targeting lipogenesis in cancer?
Peck, B., & Schulze, A. (2016) · FEBS Journal · doi:10.1111/febs.13681 · Cited by 185
Self-citationFamine versus feast: understanding the metabolism of tumors in vivo
Mayers, J. R., & Heiden, M. G. V. (2015) · Trends in Biochemical Sciences · doi:10.1016/j.tibs.2015.01.004 · Cited by 190
Metabolic Signaling to the Nucleus in Cancer
Campbell, S. L., & Wellen, K. E. (2018) · Molecular Cell · doi:10.1016/j.molcel.2018.07.015 · Cited by 186
Acetyl-CoA Metabolism and Histone Acetylation in the Regulation of Aging and Lifespan
Bradshaw, P. C. (2021) · Antioxidants · doi:10.3390/antiox10040572 · Cited by 189
Metabolic Heterogeneity of Cancer Cells: An Interplay between HIF-1, GLUTs, and AMPK
Moldogazieva, N. T., Mokhosoev, I. M., & Terentiev, A. A. (2020) · Cancers · doi:10.3390/cancers12040862 · Cited by 181
Fatty acid metabolism reprogramming in ccRCC: mechanisms and potential targets
Tan, S. K., Hougen, H. Y., Merchan, J. R., Gonzalgo, M. L., & Welford, S. M. (2022) · Nature Reviews Urology · doi:10.1038/s41585-022-00654-6 · Cited by 181
Cancer cell metabolism and mitochondria: Nutrient plasticity for TCA cycle fueling
Corbet, C., & Féron, O. (2017) · Biochimica et Biophysica Acta (BBA) - Reviews on Cancer · doi:10.1016/j.bbcan.2017.01.002 · Cited by 174
Arginine starvation kills tumor cells through aspartate exhaustion and mitochondrial dysfunction
Cheng, C.-T., Qi, Y., Wang, Y.-C., Chi, K. K., Chung, Y., Ouyang, C., Chen, Y.-R., Oh, M. E., Sheng, X., Tang, Y., et al. (2018) · Communications Biology · doi:10.1038/s42003-018-0178-4 · Cited by 164
RORγ is a targetable master regulator of cholesterol biosynthesis in a cancer subtype
Cai, D., Wang, J., Gao, B., Li, J., Wu, F., Zou, J. X., Xu, J., Jiang, Y., Zou, H., Huang, Z., et al. (2019) · Nature Communications · doi:10.1038/s41467-019-12529-3 · Cited by 167
Metadata
- Authors
- Schug, Z. T., Peck, B., Jones, D. T., Zhang, Q., Grosskurth, S., Alam, I. S., Goodwin, L. M., Smethurst, E., Mason, S., Blyth, K., McGarry, L., James, D., Shanks, E., Kalna, G., Saunders, R. E., Jiang, M., Howell, M., Lassailly, F., Thin, M. Z., Spencer-Dene, B., Stamp, G., van den Broek, N. J. F., Mackay, G., Bulusu, V., Kamphorst, J. J., Tardito, S., Strachan, D., Harris, A. L., Aboagye, E. O., Critchlow, S. E., Wakelam, M. J. O., Schulze, A., & Gottlieb, E.
- Affiliations
- Cancer Research UK Scotland Institute (GB)
- Cancer Research UK (GB)
- John Radcliffe Hospital (GB)
- Babraham Institute (GB)
- AstraZeneca (United Kingdom) (GB)
- Hammersmith Hospital (GB)
- University of Glasgow (GB)
- Corresponding author
- Gottlieb, Eyal
- ORCID
- Schug, Zachary T.
- Peck, Barrie
- Smethurst, Elizabeth
- Mason, Susan
- Blyth, Karen
- McGarry, Lynn
- James, Daniel
- Shanks, Emma
- Jiang, Ming
- Howell, Michael
- Thin, May Zaw
- Stamp, Gordon
- Mackay, Gillian
- Bulusu, Vinay
- Kamphorst, Jurre J.
- Tardito, Saverio
- Strachan, David
- Harris, Adrian L.
- Aboagye, Eric O.
- Critchlow, Susan E.
- Wakelam, Michael J.O.
- Schulze, Almut
- Gottlieb, Eyal
- Venue
- Cancer Cell
- Publisher
- Elsevier BV
- Published
- 2015-01
- Volume
- 27
- Issue
- 1
- Pages
- 57-71
- ISSN
- 1535-6108 (ISSN-L)
- PMC
- PMC4297291
- OpenAlex
- W2044515618
- Cited by
- 820
- References
- 73
- Citations by year
- 2026: 64 · 2025: 76 · 2024: 96 · 2023: 72 · 2022: 88 · 2021: 75 · 2020: 63 · 2019: 67 · 2018: 68 · 2017: 57 · 2016: 63 · 2015: 28
- FWCI
- 23.79
- Type
- journal article
- Language
- en
- Open access
- hybrid
- doi.org
- Licence
- Locations
- Cancer Cell (publishedVersion, cc-by-nc-nd)
- PubMed Central (publishedVersion, cc-by-nc-nd)
- PubMed (publishedVersion)
- ENLIGHTEN (Jurnal Bimbingan dan Konseling Islam) (acceptedVersion)
- Funders
- AstraZeneca
- Francis Crick Institute (10009, 10008)
- Cancer Research UK (11359, 18278, 12011, 10337, 16466, 16584, 22311, 18974)
- National Institute for Health and Care Research (NIHR/CS/009/009, NF-SI-0611-10163, EME/13/122/01)
- Directorate for Biological Sciences
- Medical Research Council (MR/J007986/1)
- Biotechnology and Biological Sciences Research Council (BBS/E/B/000C0415, BBS/E/B/000C0413)
- Topics
- Life Sciences › Biochemistry, Genetics and Molecular Biology › Cancer Research › Cancer, Lipids, and Metabolism
- Life Sciences › Biochemistry, Genetics and Molecular Biology › Cancer Research › Cancer, Hypoxia, and Metabolism
- Life Sciences › Biochemistry, Genetics and Molecular Biology › Biochemistry › Lipid metabolism and biosynthesis
- Keywords
- acetyl-CoA synthetase 2, ACSS2, acetate utilization, cancer cell growth, metabolic stress, hypoxia, lipid depletion, tumor xenografts, fatty acid synthesis, phospholipid synthesis, tumor microenvironment, breast cancer, copy number gain, tumor progression
- MeSH terms
- Acetate-CoA Ligase, Animals, Hypoxia, Fatty Acids, Humans, Mice, Nude, Neoplasm Transplantation, Neoplasms, Stress, Physiological, Gene Expression Regulation, Neoplastic, Disease Progression, Gene Dosage, Cell Line, Tumor, Cell Proliferation, Mice, MCF-7 Cells
About these checks
Registry, retraction, Cites and statistics results are computed, not judged, with one exception: a printed reference that no index lists is read once by a model before it counts as a citation error. Claims are extracted by a model and kept only when their quote appears verbatim in the text; each cited source is then checked, with a model’s help, for whether it says what the claim relies on. Those verdicts can be wrong — read the claim’s quote and the cited source before relying on one.
Statistics and arithmetic are recomputed, not judged.
Confidence bands are shown only for fields calibrated on our annotated test set. None is calibrated yet, so no band is shown.
What counts as a claim ›How we measure confidence ›How we check this ›
Are you an author, or do you see a problem with this page? Request a review
