

The DOI matches its Crossref record; 73 of the 73 references it cites were found in a registry or an index; none of the 62 sources its claims cite is checked for support yet.
Dorsal Raphe Dopamine Neurons Represent the Experience of Social Isolation
Open accessAbstract
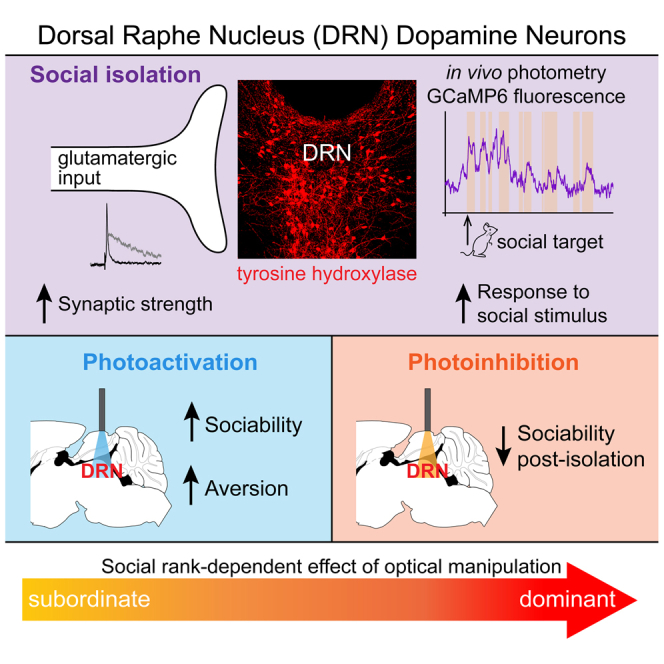
The motivation to seek social contact may arise from either positive or negative emotional states, as social interaction can be rewarding and social isolation can be aversive. While ventral tegmental area (VTA) dopamine (DA) neurons may mediate social reward, a cellular substrate for the negative affective state of loneliness has remained elusive. Here, we identify a functional role for DA neurons in the dorsal raphe nucleus (DRN), in which we observe synaptic changes following acute social isolation. DRN DA neurons show increased activity upon social contact following isolation, revealed by in vivo calcium imaging. Optogenetic activation of DRN DA neurons increases social preference but causes place avoidance. Furthermore, these neurons are necessary for promoting rebound sociability following an acute period of isolation. Finally, the degree to which these neurons modulate behavior is predicted by social rank, together supporting a role for DRN dopamine neurons in mediating a loneliness-like state. PAPERCLIP.
Overview
AI snapshot
Written from the paper’s full text.
TL;DR
Dorsal raphe nucleus (DRN) dopamine neurons undergo synaptic potentiation after 24 hr social isolation, increase activity upon first social contact, and are sufficient and necessary for isolation-induced sociability. Their activation promotes social preference but is aversive without a social target, suggesting they represent a loneliness-like state modulated by social rank.
Key findings
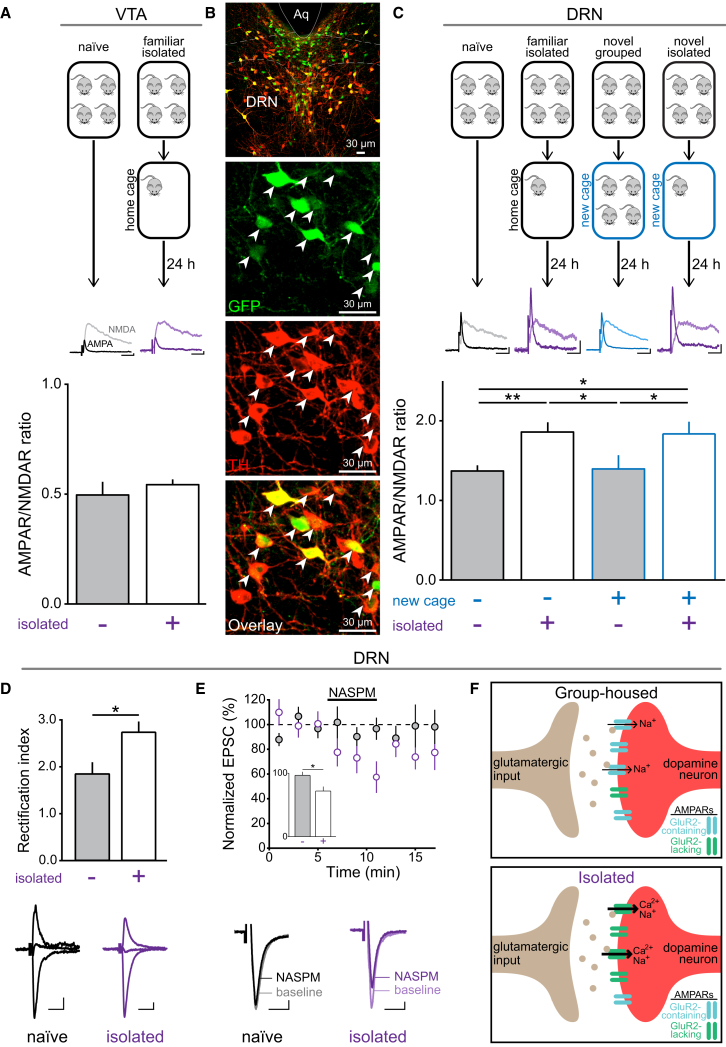
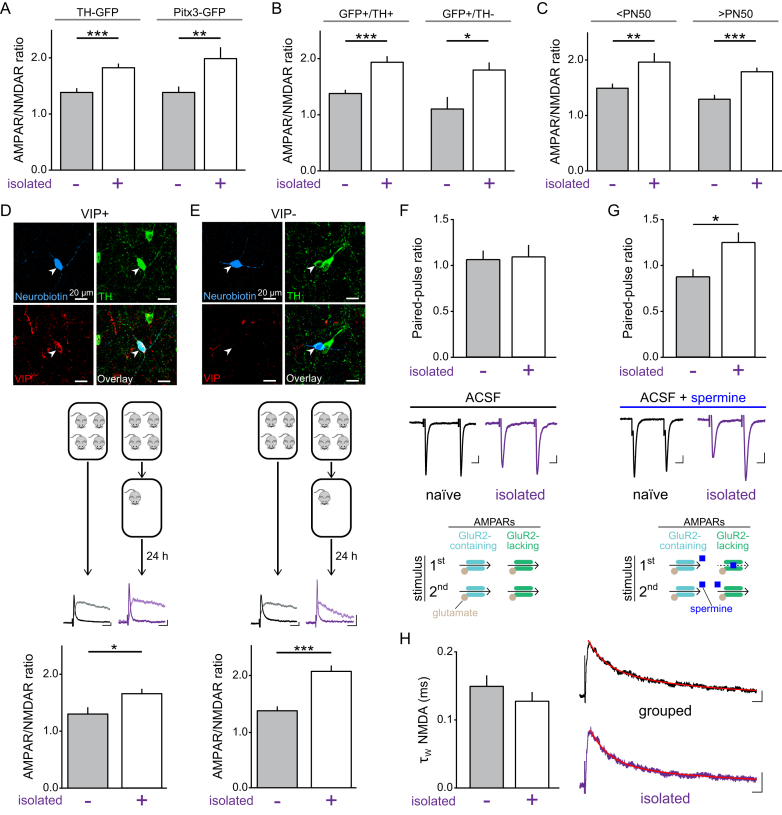
- 24 hr social isolation increased the AMPAR/NMDAR ratio in DRN DA neurons but not VTA DA neurons; isolated mice also showed a greater AMPAR rectification index and NASPM sensitivity, suggesting a relative increase in GluR2-lacking AMPARs.
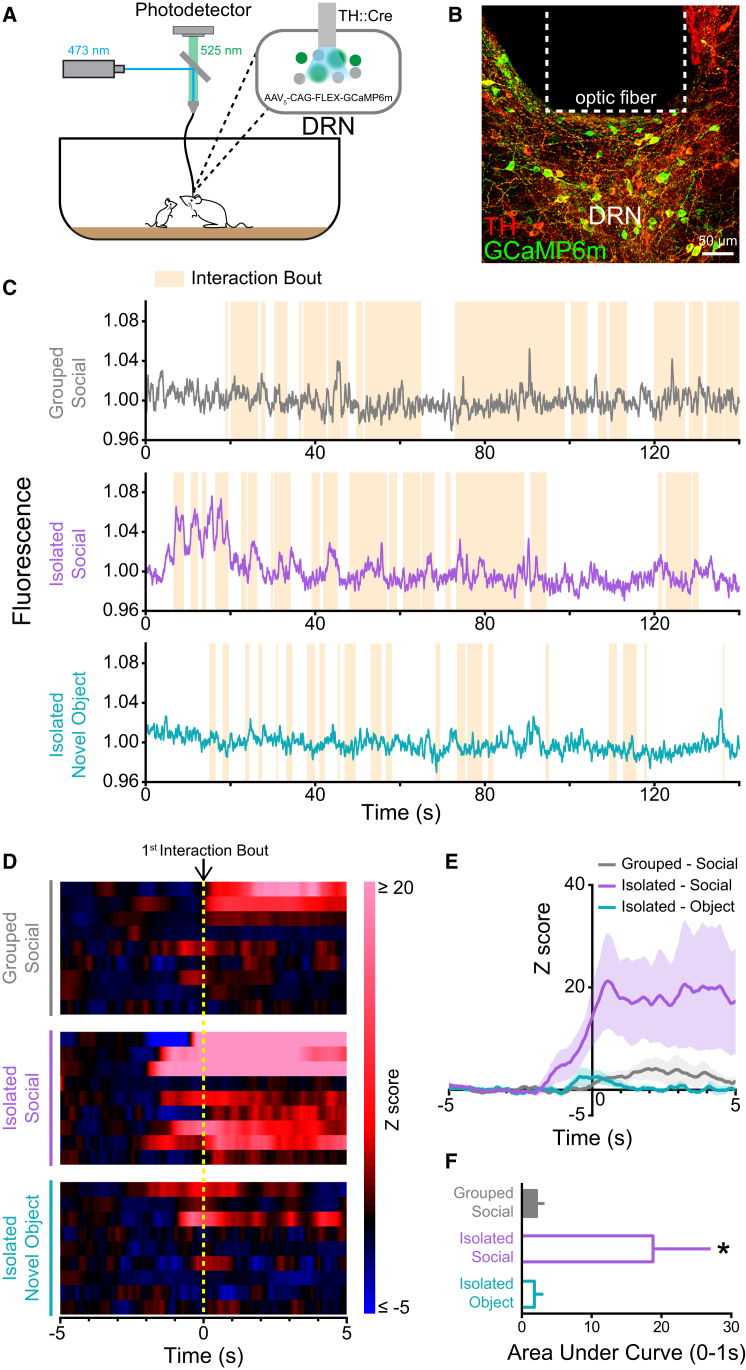
- In vivo fiber photometry showed that socially isolated mice had a significantly greater DRN DA calcium signal in response to first contact with a juvenile mouse than group-housed mice, and greater than to a novel object.
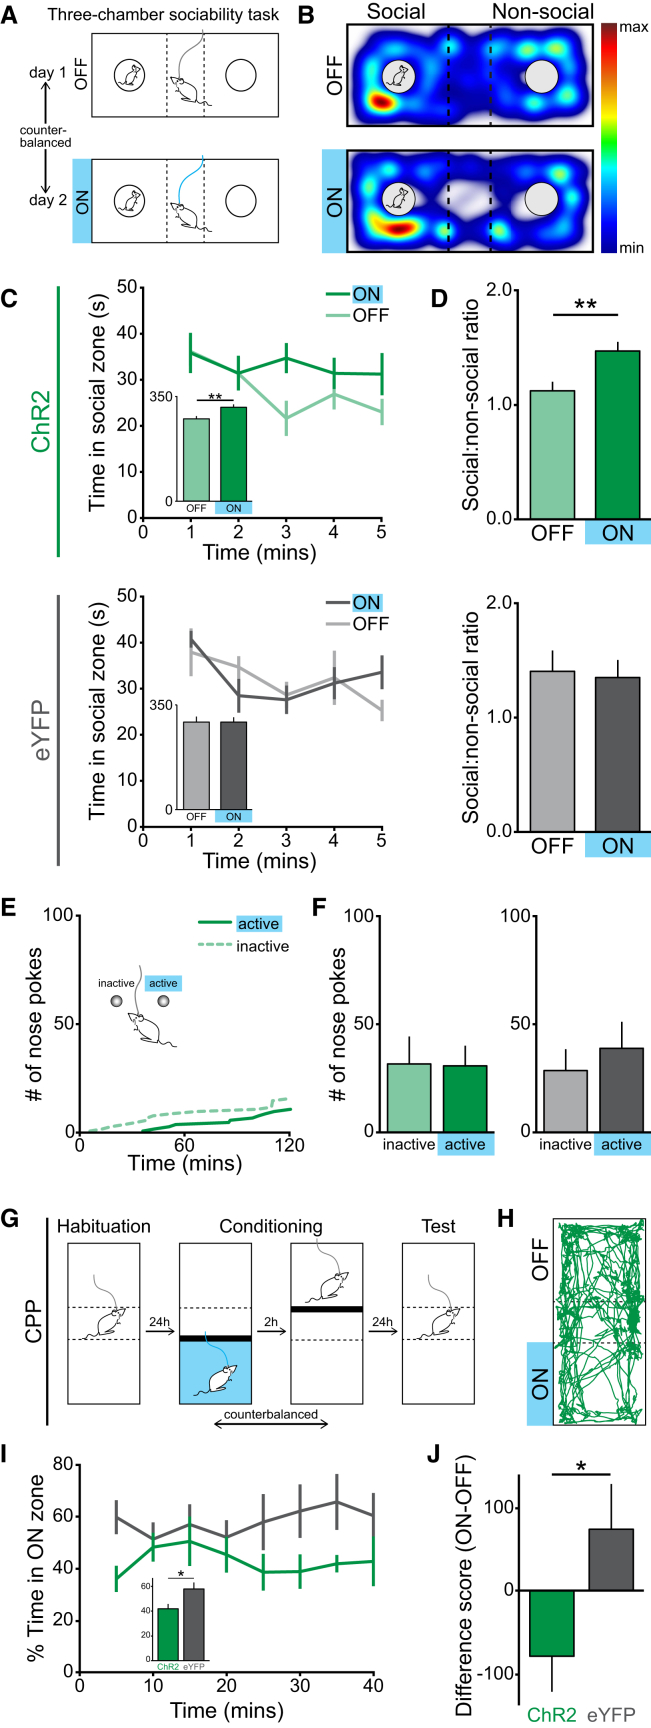
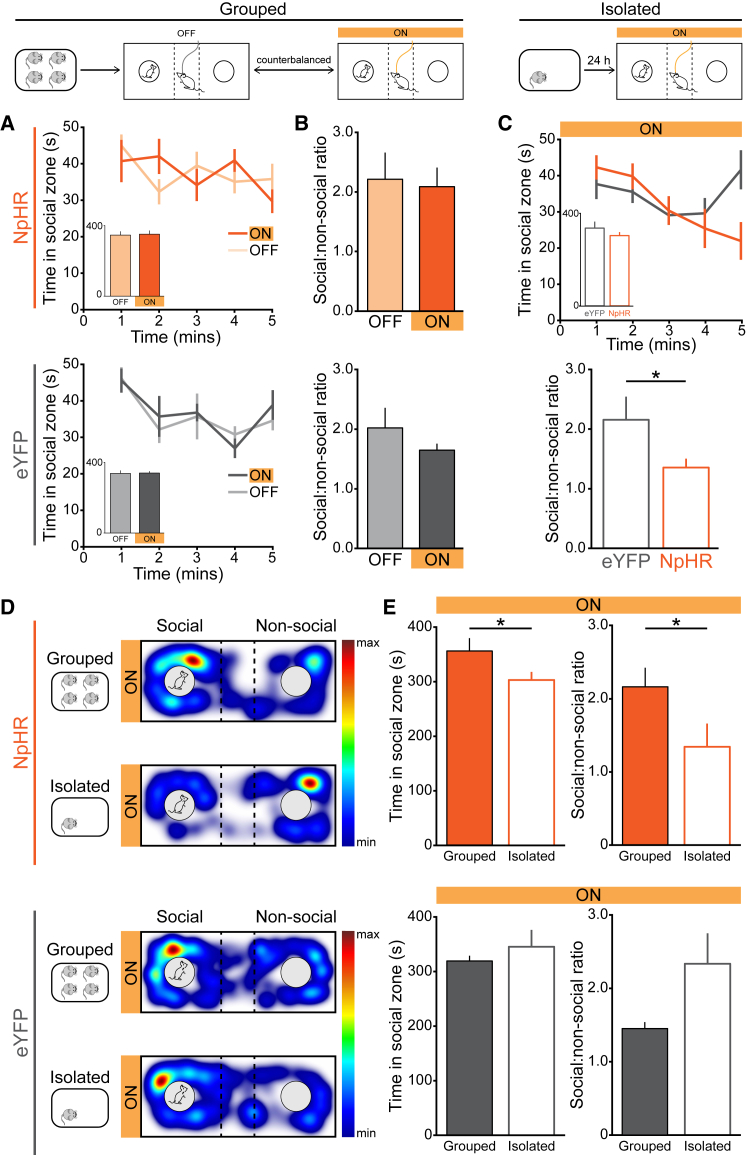
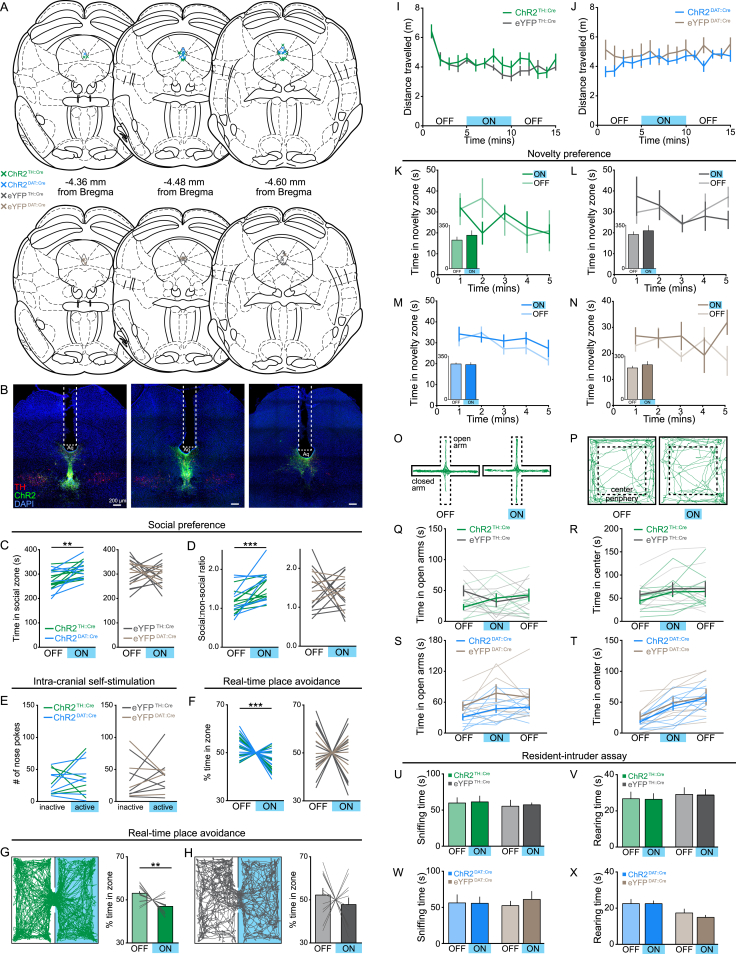
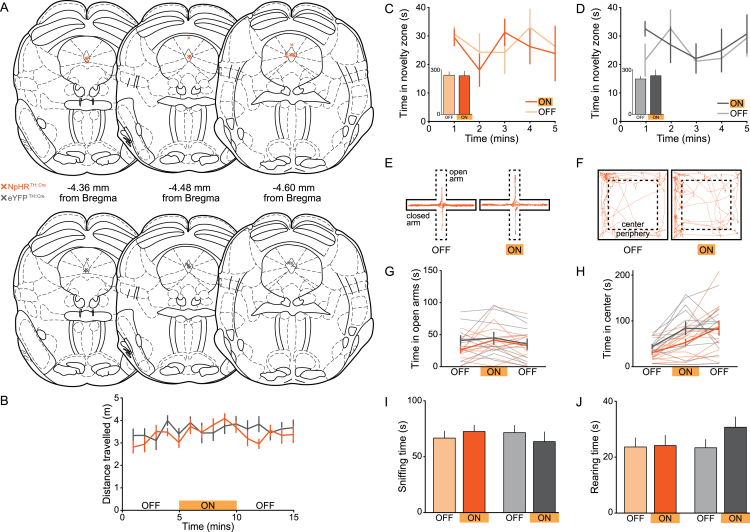
- Optogenetic activation of DRN DA neurons increased social preference in the three-chamber task but did not support ICSS and produced real-time place avoidance and conditioned place avoidance; photoinhibition reduced social preference after isolation but not in group-housed mice.
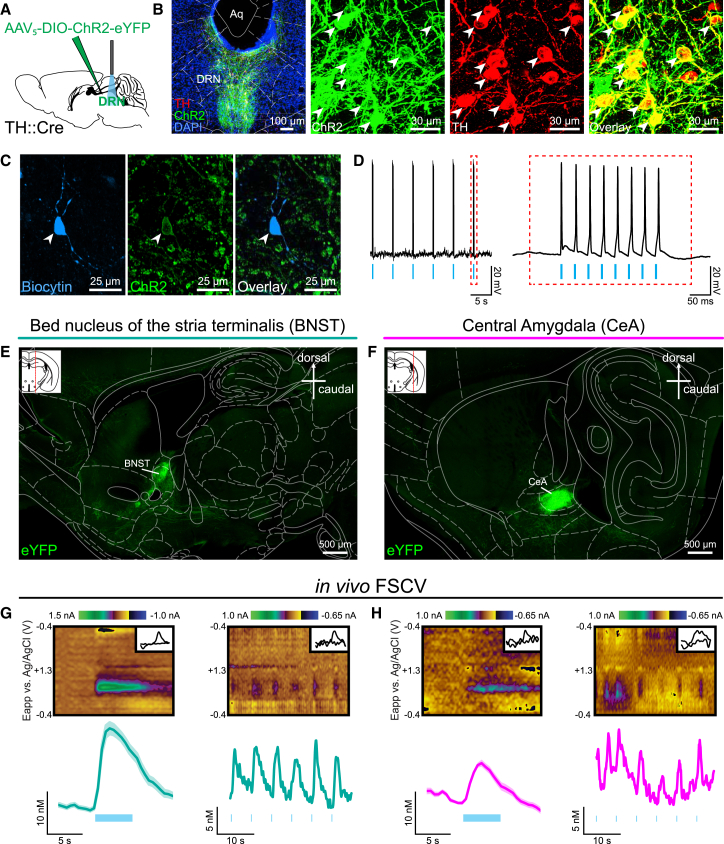
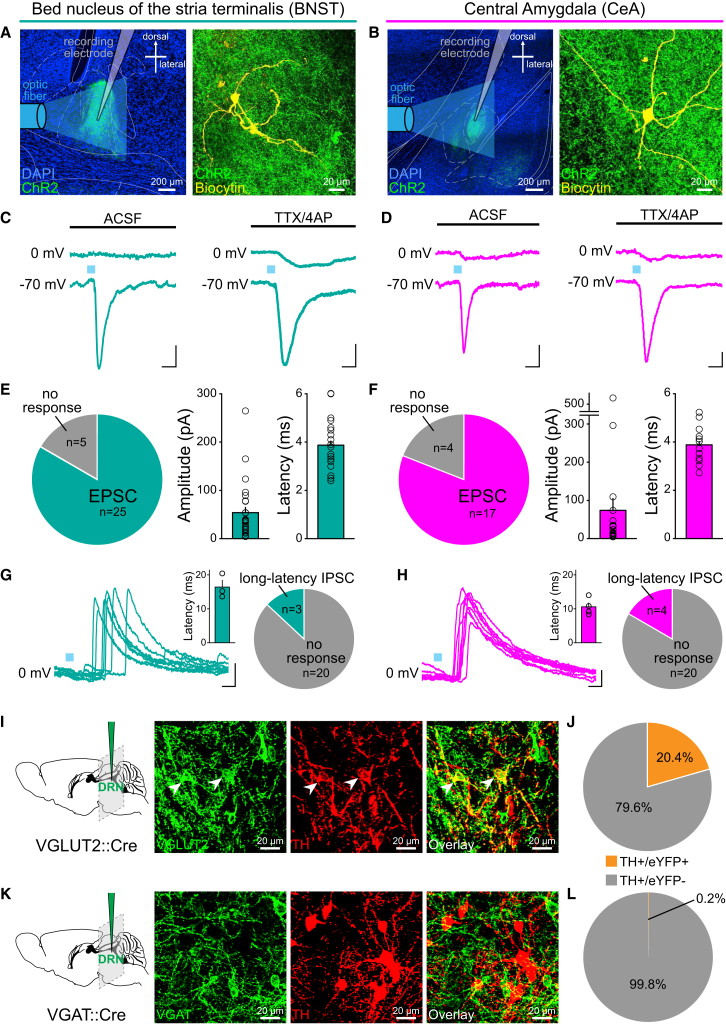
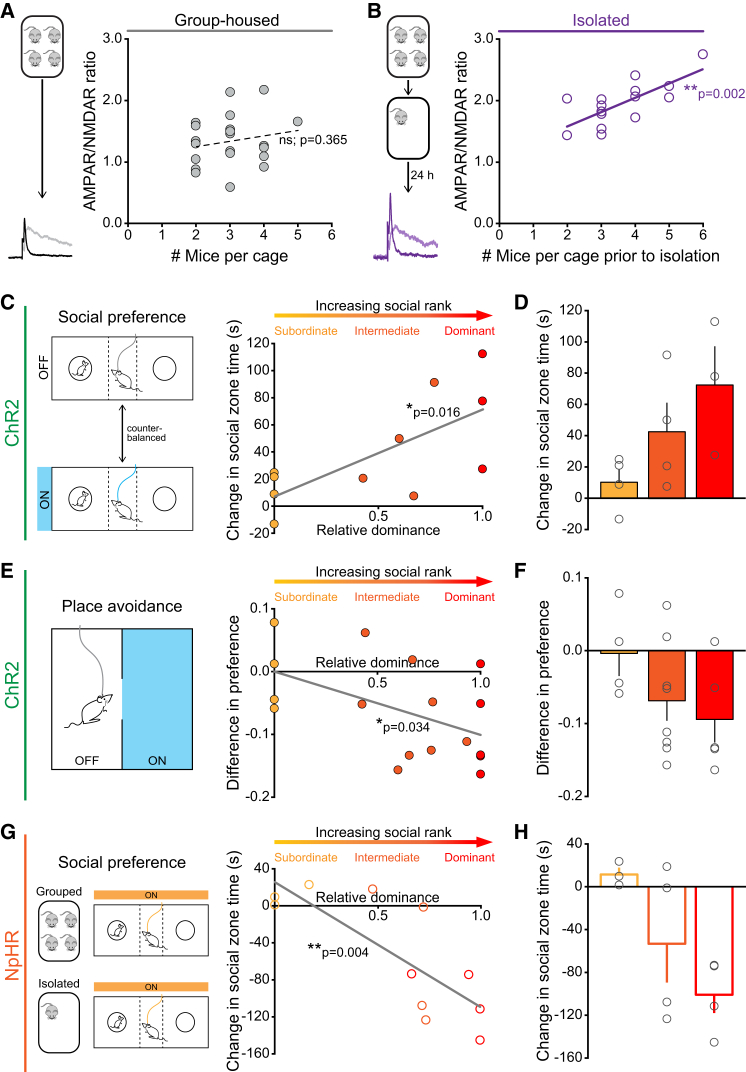
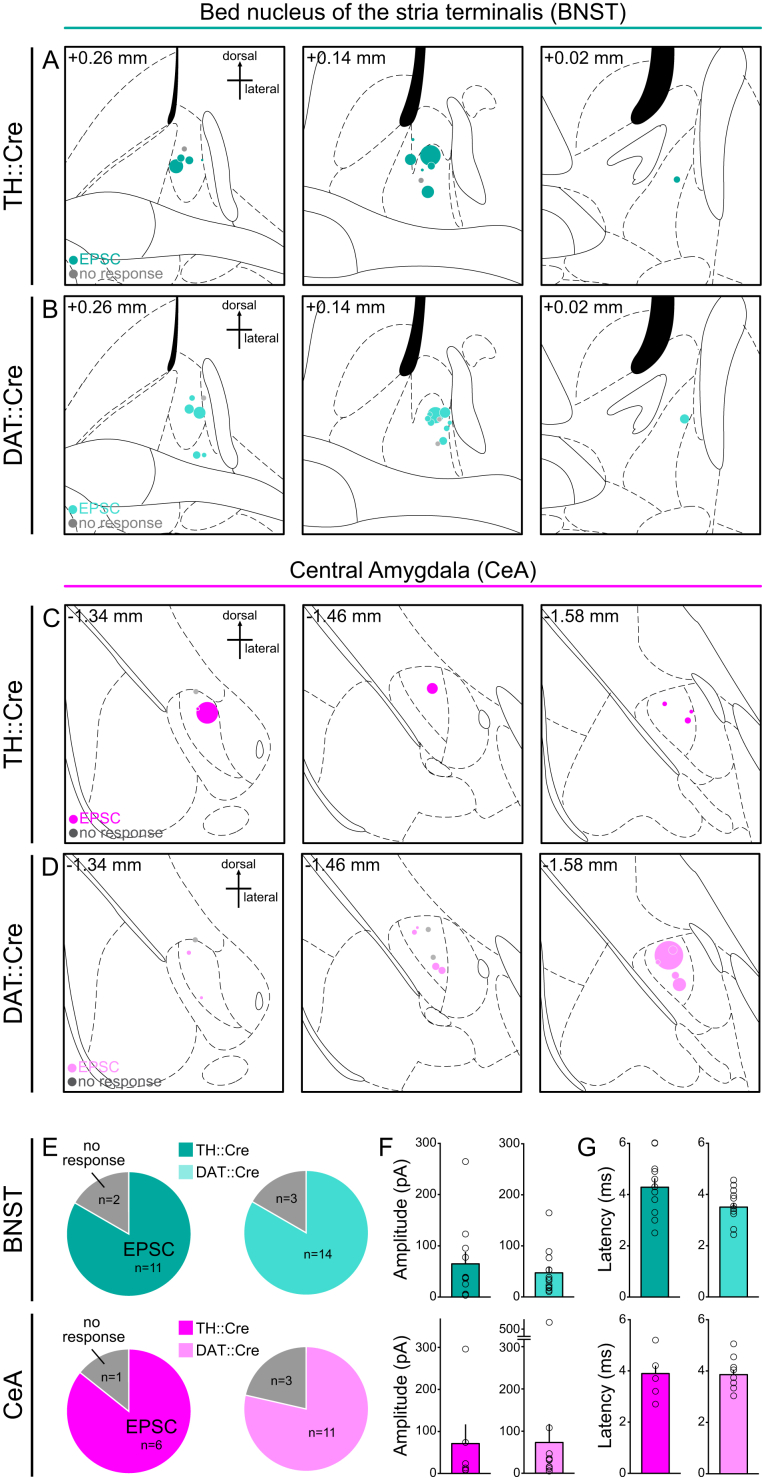
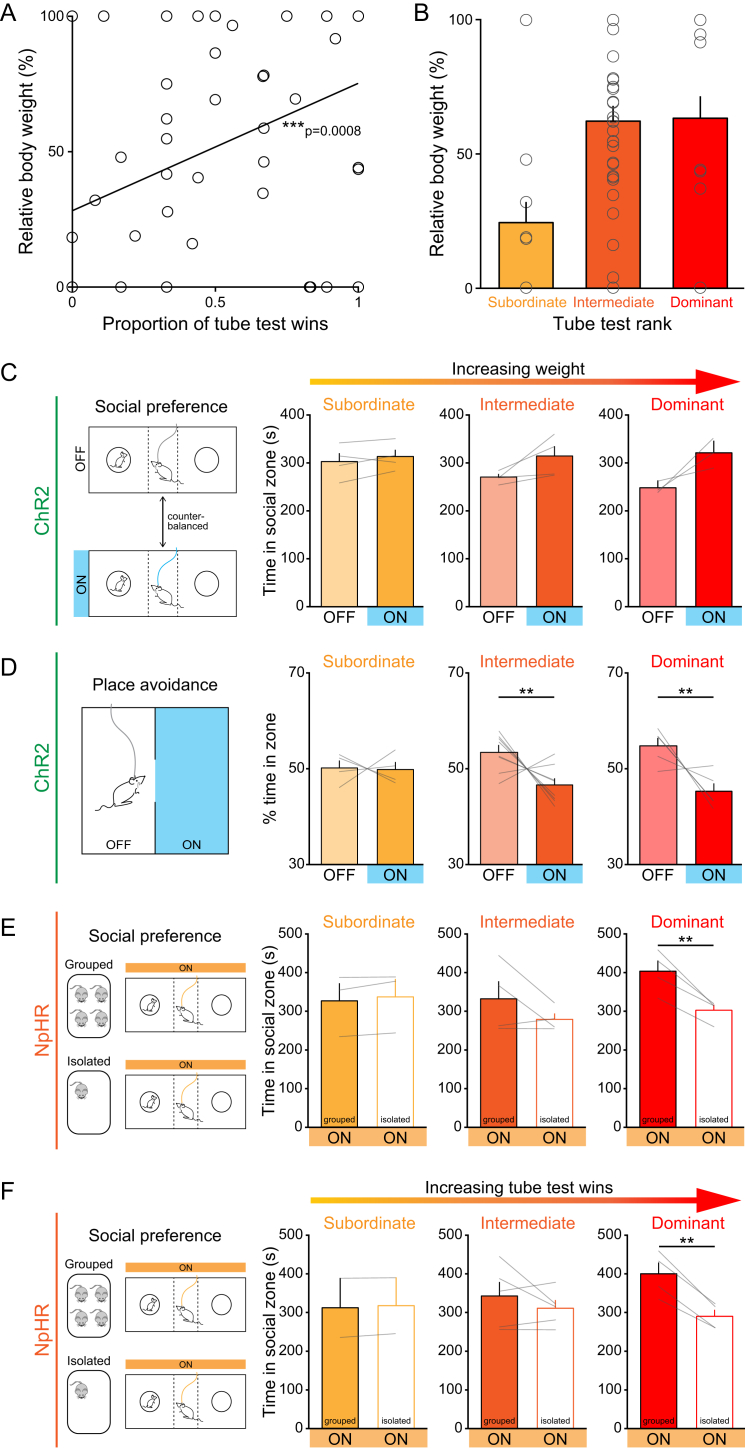
- Social rank predicted behavioral effects: dominance positively correlated with activation-induced social preference and negatively with stimulation-zone preference, while photoinhibition reduced social preference more in dominant mice after isolation. DRN DA neurons also released DA and glutamate in dlBNST and CeA; EPSCs were elicited in 25/30 dlBNST neurons and 17/21 CeA neurons, and 77.7% of eYFP+ DRN neurons in TH::Cre mice and 79.8% in DAT::IRES-Cre mice co-labeled with TH.
Methods
- Ex vivo whole-cell patch-clamp electrophysiology in brain slices (220 μm) from male TH-GFP or Pitx3-GFP mice, measuring AMPAR/NMDAR ratio, rectification index, paired-pulse ratio, and NASPM sensitivity after 24 hr social isolation versus group housing.
- Fiber photometry in TH::Cre mice with AAV5-CAG-FLEX-GCaMP6m targeted to DRN DA neurons; GCaMP6m fluorescence was recorded in the home cage before and after introduction of a juvenile mouse or novel object.
- Optogenetic and behavioral experiments in TH::Cre and DAT::Cre mice with AAV5-DIO-ChR2-eYFP, AAV5-DIO-NpHR3.0-eYFP, or AAV5-DIO-eYFP in DRN; assays included three-chamber sociability, ICSS, real-time place avoidance, conditioned place preference, in vivo fast-scan cyclic voltammetry, and immunohistochemistry.
Limitations
- The paper states that “loneliness” per se is difficult to directly test in mice; it also states that it remains undetermined whether underlying neural differences cause social rank and/or whether social rank itself changes neuronal properties, and that CeA DA transients were inconsistent and did not adequately resolve as DA.
- Evident from the text: ex vivo electrophysiology used male mice, and dominance measures are described for males, so sex differences are not addressed.
- Evident from the text: social-rank effects are correlational, and the “loneliness-like state” interpretation is inferred from mouse behavior rather than directly measured subjective experience.
Model-written summary. Check it against the paper before relying on it.
Integrity signals
Registry
Cites
Statistics
Figures
Verification
Claims the paper makes
54 Own result · 37 Not checked yet · 26 Own interpretation · 1 Own method · 1 No basis given
A result the paper reports from its own data — it cites no other source for it, so there is none to check. The quote shows it is in the paper.
In the paper
“Finally, the degree to which these neurons modulate behavior is predicted by social rank, together supporting a role for DRN dopamine neurons in mediating a loneliness-like state.”
§ Dorsal Raphe Dopamine Neurons Represent the Experience of Social Isolation > Abstract
plaincorrelational- Asserted: passes — The authors put it forward as true.
- Checkable: passes — It can be checked against evidence.
- Load-bearing: passes — The paper’s conclusions depend on it.
- Based: passes — The paper gives a reason why it holds.
A result the paper reports from its own data — it cites no other source for it, so there is none to check. The quote shows it is in the paper.
In the paper
“DRN DA neurons show increased activity upon social contact following isolation, revealed by in vivo calcium imaging.”
§ Dorsal Raphe Dopamine Neurons Represent the Experience of Social Isolation > Abstract
plaincorrelational- Asserted: passes — The authors put it forward as true.
- Checkable: passes — It can be checked against evidence.
- Load-bearing: passes — The paper’s conclusions depend on it.
- Based: passes — The paper gives a reason why it holds.
A result the paper reports from its own data — it cites no other source for it, so there is none to check. The quote shows it is in the paper.
In the paper
“Optogenetic activation of DRN DA neurons increases social preference but causes place avoidance.”
§ Dorsal Raphe Dopamine Neurons Represent the Experience of Social Isolation > Abstract
plaindirect- Asserted: passes — The authors put it forward as true.
- Checkable: passes — It can be checked against evidence.
- Load-bearing: passes — The paper’s conclusions depend on it.
- Based: passes — The paper gives a reason why it holds.
A result the paper reports from its own data — it cites no other source for it, so there is none to check. The quote shows it is in the paper.
In the paper
“Furthermore, these neurons are necessary for promoting rebound sociability following an acute period of isolation.”
§ Dorsal Raphe Dopamine Neurons Represent the Experience of Social Isolation > Abstract
plaindirect- Asserted: passes — The authors put it forward as true.
- Checkable: passes — It can be checked against evidence.
- Load-bearing: passes — The paper’s conclusions depend on it.
- Based: passes — The paper gives a reason why it holds.
A result the paper reports from its own data — it cites no other source for it, so there is none to check. The quote shows it is in the paper.
In the paper
“Here, we identify a functional role for DA neurons in the dorsal raphe nucleus (DRN), in which we observe synaptic changes following acute social isolation.”
§ Dorsal Raphe Dopamine Neurons Represent the Experience of Social Isolation > Abstract
plaindirect- Asserted: passes — The authors put it forward as true.
- Checkable: passes — It can be checked against evidence.
- Load-bearing: passes — The paper’s conclusions depend on it.
- Based: passes — The paper gives a reason why it holds.
A result the paper reports from its own data — it cites no other source for it, so there is none to check. The quote shows it is in the paper.
In the paper
“Optogenetic activation of DRN DA neurons increases social preference but causes place avoidance.”
§ Dorsal Raphe Dopamine Neurons Represent the Experience of Social Isolation > Abstract
plaindirect- Asserted: passes — The authors put it forward as true.
- Checkable: passes — It can be checked against evidence.
- Load-bearing: passes — The paper’s conclusions depend on it.
- Based: passes — The paper gives a reason why it holds.
A result the paper reports from its own data — it cites no other source for it, so there is none to check. The quote shows it is in the paper.
In the paper
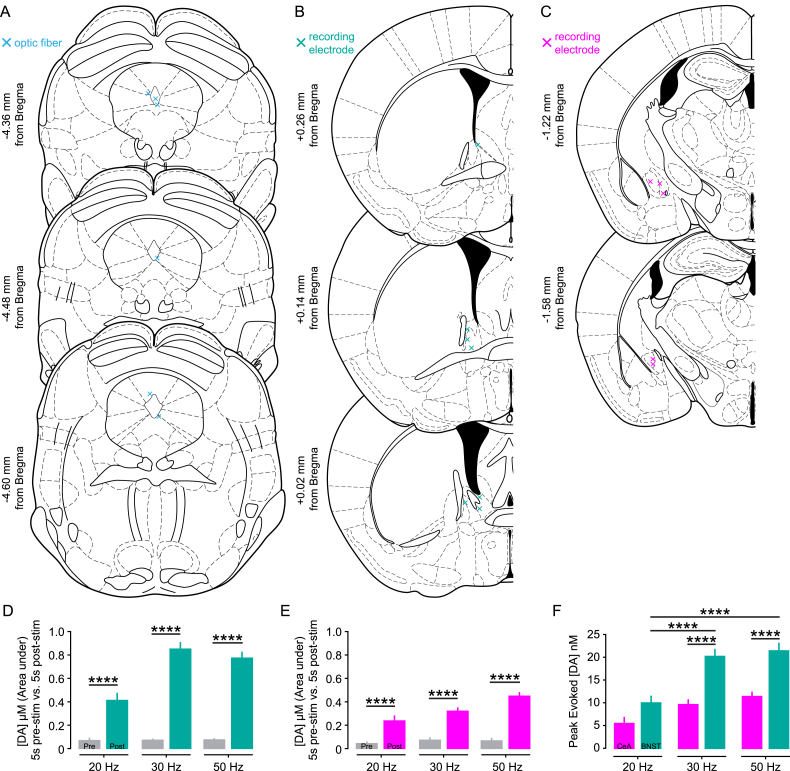
“We observed particularly dense terminal expression within the dorsolateral BNST (dlBNST) (Figure 3E) and the lateral part of the CeA (Figure 3F) and, therefore, tested the effects of optical activation of DRN DA neurons on these regions.”
§ Dorsal Raphe Dopamine Neurons Represent the Experience of Social Isolation > Results > DRN DA Neurons Release DA and Glutamate
plain- Asserted: passes — The authors put it forward as true.
- Checkable: passes — It can be checked against evidence.
- Load-bearing: passes — The paper’s conclusions depend on it.
- Based: passes — The paper gives a reason why it holds.
A result the paper reports from its own data — it cites no other source for it, so there is none to check. The quote shows it is in the paper.
In the paper
“However, in 3/23 dlBNST neurons and 4/24 CeA neurons we observed IPSC responses with a long and variable latency (Figures 4G and 4H), suggesting that terminal stimulation can activate GABAergic neurons to elicit a polysynaptic IPSC.”
§ Dorsal Raphe Dopamine Neurons Represent the Experience of Social Isolation > Results > DRN DA Neurons Release DA and Glutamate
hedged- Asserted: passes — The authors put it forward as true.
- Checkable: passes — It can be checked against evidence.
- Load-bearing: unclear — It is unclear whether the paper’s conclusions depend on it.
- Based: passes — The paper gives a reason why it holds.
A result the paper reports from its own data — it cites no other source for it, so there is none to check. The quote shows it is in the paper.
In the paper
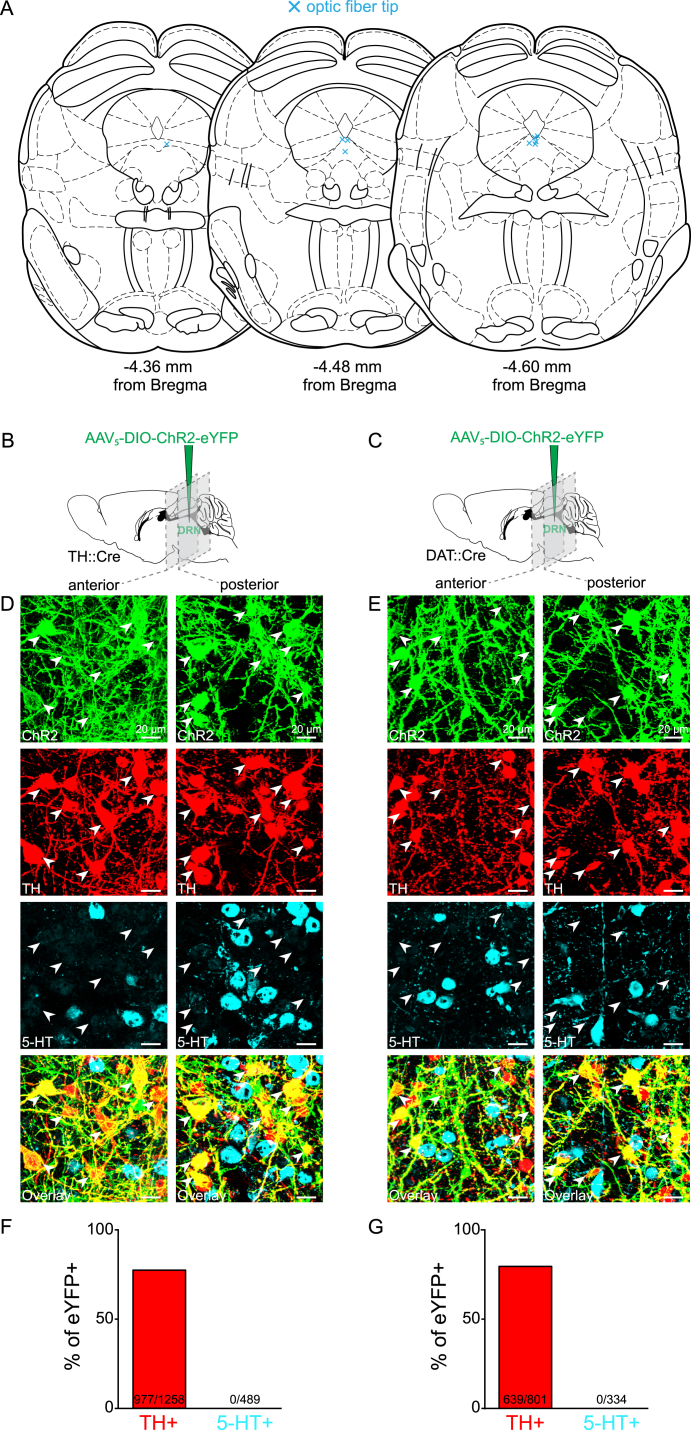
“In TH::Cre mice we found that 77.7% of eYFP+ neurons co-labeled with TH using immunohistochemistry (Figures S2B, S2D, and S2F).”
§ Dorsal Raphe Dopamine Neurons Represent the Experience of Social Isolation > Results > DRN DA Neurons Release DA and Glutamate
plain- Asserted: passes — The authors put it forward as true.
- Checkable: passes — It can be checked against evidence.
- Load-bearing: passes — The paper’s conclusions depend on it.
- Based: passes — The paper gives a reason why it holds.
A result the paper reports from its own data — it cites no other source for it, so there is none to check. The quote shows it is in the paper.
In the paper
“Optical stimulation of DRN DA neurons elicited DA release in both the dlBNST (Figure 3G) and the CeA (Figure 3H).”
§ Dorsal Raphe Dopamine Neurons Represent the Experience of Social Isolation > Results > DRN DA Neurons Release DA and Glutamate
plaindirect- Asserted: passes — The authors put it forward as true.
- Checkable: passes — It can be checked against evidence.
- Load-bearing: unclear — It is unclear whether the paper’s conclusions depend on it.
- Based: passes — The paper gives a reason why it holds.
- It may state two separate claims as one. 13
- Probably not a substantial claim. 20
- The quote only partly states this claim. 1
A result the paper reports from its own data — it cites no other source for it, so there is none to check. The quote shows it is in the paper.
In the paper
“Consistent with our recording results, neither NpHR- nor eYFP-expressing mice showed a significant difference in the proportion of time spent in the social zone with optical inhibition (Figure 6A and 6B).”
§ Dorsal Raphe Dopamine Neurons Represent the Experience of Social Isolation > Results > Photoinhibition of DRN DA Neurons Reduces Isolation-Induced Sociability
plain- Asserted: passes — The authors put it forward as true.
- Checkable: passes — It can be checked against evidence.
- Load-bearing: passes — The paper’s conclusions depend on it.
- Based: passes — The paper gives a reason why it holds.
It may state two separate claims as one.
A result the paper reports from its own data — it cites no other source for it, so there is none to check. The quote shows it is in the paper.
In the paper
“We compared data from mice that either remained group-housed or experienced social isolation and found that the magnitude of the AMPAR/NMDAR ratio was positively correlated with the number of previous cagemates in socially isolated, but not continually group-housed, mice (Figures 7A and 7B).”
§ Dorsal Raphe Dopamine Neurons Represent the Experience of Social Isolation > Results > Prior Social Experience Predicts Functional Role of DRN DA Neurons
plaincorrelational- Asserted: passes — The authors put it forward as true.
- Checkable: passes — It can be checked against evidence.
- Load-bearing: passes — The paper’s conclusions depend on it.
- Based: passes — The paper gives a reason why it holds.
It may state two separate claims as one.
A result the paper reports from its own data — it cites no other source for it, so there is none to check. The quote shows it is in the paper.
In the paper
“However, in the CeA, transients were inconsistent and signals did not adequately resolve as DA, perhaps suggesting DA release just below the FSCV detection threshold (Figures 3G and 3H).”
§ Dorsal Raphe Dopamine Neurons Represent the Experience of Social Isolation > Results > DRN DA Neurons Release DA and Glutamate
hedged- Asserted: passes — The authors put it forward as true.
- Checkable: passes — It can be checked against evidence.
- Load-bearing: unclear — It is unclear whether the paper’s conclusions depend on it.
- Based: passes — The paper gives a reason why it holds.
It may state two separate claims as one.
A result the paper reports from its own data — it cites no other source for it, so there is none to check. The quote shows it is in the paper.
In the paper
“Furthermore, using additional behavioral assays, we found that optical stimulation of DRN DA neurons had no detectable effect on locomotion, novelty preference, or anxiety-related behavior (Figures S5I–S5X).”
§ Dorsal Raphe Dopamine Neurons Represent the Experience of Social Isolation > Results > Optogenetic Activation of DRN DA Neurons Mimics a Loneliness-like State
plain- Asserted: passes — The authors put it forward as true.
- Checkable: passes — It can be checked against evidence.
- Load-bearing: passes — The paper’s conclusions depend on it.
- Based: passes — The paper gives a reason why it holds.
It may state two separate claims as one.
None of the sources cited for this claim have been checked yet.
In the paper
“Social interactions can be rewarding and thereby recruit components of the brain’s reward circuitry, including the ventral tegmental area (VTA) dopamine (DA) neurons and the nucleus accumbens (NAc) (Dölen et al., 2013, Gunaydin et al., 2014, Robinson et al., 2002).”
§ Dorsal Raphe Dopamine Neurons Represent the Experience of Social Isolation > Introduction
What the sources say
plaindirect- Asserted: passes — The authors put it forward as true.
- Checkable: passes — It can be checked against evidence.
- Load-bearing: fails — The paper’s conclusions may not depend on it.
- Based: passes — The paper gives a reason why it holds.
Probably not a substantial claim. The paper’s conclusions may not depend on it.
A conclusion the paper draws from its own results — it cites no other source for it, so there is none to check. The quote shows it is in the paper.
In the paper
“Taken together, we propose that DRN DA neurons represent a neural substrate for the subjective experience of social isolation and serve to promote a response to alleviate this aversive state.”
- Also stated in: § Abstract · hedged
“supporting a role for DRN dopamine neurons in mediating a loneliness-like state.”
§ Dorsal Raphe Dopamine Neurons Represent the Experience of Social Isolation > Introduction
hedgeddirect- Asserted: passes — The authors put it forward as true.
- Checkable: passes — It can be checked against evidence.
- Load-bearing: passes — The paper’s conclusions depend on it.
- Based: passes — The paper gives a reason why it holds.
It may state two separate claims as one.
- Rests on an assumption: The behavioral and neural state induced by acute social isolation in mice corresponds to the subjective experience of loneliness in humans.
- Also stated in: § Abstract · hedged
None of the sources cited for this claim have been checked yet.
In the paper
“The TH+ DRN neurons have been confirmed as DAergic as they express aromatic L-amino decarboxylase (AADC), the enzyme that catalyzes conversion of L-3,4-dihydroxyphenylalanine, the product of TH, to DA (Lu et al., 2006) and the DA transporter (DAT) (Dougalis et al., 2012).”
§ Dorsal Raphe Dopamine Neurons Represent the Experience of Social Isolation > Results > DRN DA Neurons Release DA and Glutamate
What the sources say
- Not checked yetcites Lu et al., 2006
- Not checked yetcites Dougalis et al., 2012 source
boosted- Asserted: passes — The authors put it forward as true.
- Checkable: passes — It can be checked against evidence.
- Load-bearing: passes — The paper’s conclusions depend on it.
- Based: passes — The paper gives a reason why it holds.
It may state two separate claims as one.
None of the sources cited for this claim have been checked yet.
In the paper
“Furthermore, DRN TH+ neurons lack dopamine-β-hydroxylase, which is necessary to convert DA to norepinephrine (Nagatsu et al., 1979), and do not express 5-hydroxytryptamine (5-HT) (Stratford and Wirtshafter, 1990).”
§ Dorsal Raphe Dopamine Neurons Represent the Experience of Social Isolation > Results > DRN DA Neurons Release DA and Glutamate
What the sources say
- Not checked yetcites Nagatsu et al., 1979 source
- Not checked yetcites Stratford and Wirtshafter, 1990
plain- Asserted: passes — The authors put it forward as true.
- Checkable: passes — It can be checked against evidence.
- Load-bearing: unclear — It is unclear whether the paper’s conclusions depend on it.
- Based: passes — The paper gives a reason why it holds.
It may state two separate claims as one.
A conclusion the paper draws from its own results — it cites no other source for it, so there is none to check. The quote shows it is in the paper.
In the paper
“We posit that this recapitulates a loneliness-like state, in which social approach is driven to alleviate the aversive state associated with social isolation.”
§ Dorsal Raphe Dopamine Neurons Represent the Experience of Social Isolation > Results > Optogenetic Activation of DRN DA Neurons Mimics a Loneliness-like State
hedgeddirect- Asserted: passes — The authors put it forward as true.
- Checkable: passes — It can be checked against evidence.
- Load-bearing: passes — The paper’s conclusions depend on it.
- Based: passes — The paper gives a reason why it holds.
It may state two separate claims as one.
- Rests on an assumption: The behavioral and neural state induced by acute social isolation in mice corresponds to the subjective experience of loneliness in humans.
A conclusion the paper draws from its own results — it cites no other source for it, so there is none to check. The quote shows it is in the paper.
In the paper
“In sum, we find that increasing activity of DRN DA neurons in group-housed mice promotes social preference but also elicits a negative affective state in the absence of a social target.”
§ Dorsal Raphe Dopamine Neurons Represent the Experience of Social Isolation > Results > Optogenetic Activation of DRN DA Neurons Mimics a Loneliness-like State
plaindirect- Asserted: passes — The authors put it forward as true.
- Checkable: passes — It can be checked against evidence.
- Load-bearing: passes — The paper’s conclusions depend on it.
- Based: passes — The paper gives a reason why it holds.
It may state two separate claims as one.
In the paper
“Rodents are innately social creatures and prefer social rather than isolate housing (Loo et al., 2001).”
§ Dorsal Raphe Dopamine Neurons Represent the Experience of Social Isolation > Introduction
What the sources say
- Not checked yetcites Loo et al., 2001 source
plain- Asserted: passes — The authors put it forward as true.
- Checkable: passes — It can be checked against evidence.
- Load-bearing: fails — The paper’s conclusions may not depend on it.
- Based: passes — The paper gives a reason why it holds.
Probably not a substantial claim. The paper’s conclusions may not depend on it.
What the paper did — it cites no source for this, so there is none to check. The quote shows it is in the paper.
In the paper
“In the DRN, ChR2-expressing neurons reliably followed these photostimulation parameters (Figure 3D).”
§ Dorsal Raphe Dopamine Neurons Represent the Experience of Social Isolation > Results > DRN DA Neurons Release DA and Glutamate
plaincorrelational- Asserted: passes — The authors put it forward as true.
- Checkable: passes — It can be checked against evidence.
- Load-bearing: passes — The paper’s conclusions depend on it.
- Based: passes — The paper gives a reason why it holds.
The quote only partly states this claim.
None of the sources cited for this claim have been checked yet.
In the paper
“Social isolation, social exclusion, or feelings of social disconnection can lead to loneliness, which is a strongly aversive emotional state in humans and detrimental to physical and mental well-being (Cacioppo et al., 2006, Cacioppo et al., 2014, Holt-Lunstad et al., 2010, House et al., 1988).”
§ Dorsal Raphe Dopamine Neurons Represent the Experience of Social Isolation > Introduction
What the sources say
plaindirect- Asserted: passes — The authors put it forward as true.
- Checkable: passes — It can be checked against evidence.
- Load-bearing: fails — The paper’s conclusions may not depend on it.
- Based: passes — The paper gives a reason why it holds.
Probably not a substantial claim. The paper’s conclusions may not depend on it.
None of the sources cited for this claim have been checked yet.
In the paper
“Social isolation, social exclusion, or feelings of social disconnection can lead to loneliness, which is a strongly aversive emotional state in humans and detrimental to physical and mental well-being (Cacioppo et al., 2006, Cacioppo et al., 2014, Holt-Lunstad et al., 2010, House et al., 1988).”
§ Dorsal Raphe Dopamine Neurons Represent the Experience of Social Isolation > Introduction
What the sources say
boosteddirect- Asserted: passes — The authors put it forward as true.
- Checkable: passes — It can be checked against evidence.
- Load-bearing: fails — The paper’s conclusions may not depend on it.
- Based: passes — The paper gives a reason why it holds.
Probably not a substantial claim. The paper’s conclusions may not depend on it. It may state two separate claims as one.
None of the sources cited for this claim have been checked yet.
In the paper
“However, since optogenetic activation of VTA DA neurons increases social interaction (Gunaydin et al., 2014) and supports positive reinforcement (Tsai et al., 2009, Witten et al., 2011), they are thought to play a causal role in social reward.”
§ Dorsal Raphe Dopamine Neurons Represent the Experience of Social Isolation > Introduction
What the sources say
hedgedconditional- Asserted: passes — The authors put it forward as true.
- Checkable: passes — It can be checked against evidence.
- Load-bearing: passes — The paper’s conclusions depend on it.
- Based: passes — The paper gives a reason why it holds.
Probably not a substantial claim.
None of the sources cited for this claim have been checked yet.
In the paper
“Perceived social isolation (or loneliness) reflects the quality of an individual’s social interactions (Hawkley et al., 2008, Peplau, 1978) rather than their quantity or frequency.”
§ Dorsal Raphe Dopamine Neurons Represent the Experience of Social Isolation > Discussion > The Subjective Experience of Social Isolation
What the sources say
- Not checked yetcites Hawkley et al., 2008 source
- Not checked yetcites Peplau, 1978
plaincorrelational- Asserted: passes — The authors put it forward as true.
- Checkable: passes — It can be checked against evidence.
- Load-bearing: fails — The paper’s conclusions may not depend on it.
- Based: passes — The paper gives a reason why it holds.
Probably not a substantial claim. The paper’s conclusions may not depend on it.
In the paper
“the motivation for social re-connection was hypothesized to be “sensitive to satiation patterns” (Baumeister and Leary, 1995).”
§ Dorsal Raphe Dopamine Neurons Represent the Experience of Social Isolation > Discussion > Satisfying the Profile of a Neural Substrate for a Loneliness-like State
What the sources say
- Not checked yetcites Baumeister and Leary, 1995 source
hedgedcorrelational- Asserted: passes — The authors put it forward as true.
- Checkable: passes — It can be checked against evidence.
- Load-bearing: passes — The paper’s conclusions depend on it.
- Based: passes — The paper gives a reason why it holds.
Probably not a substantial claim.
In the paper
“while in mice, altering synaptic efficacy in the mPFC is sufficient to promote a change in social rank (Wang et al., 2011).”
§ Dorsal Raphe Dopamine Neurons Represent the Experience of Social Isolation > Discussion > The Subjective Experience of Social Isolation
What the sources say
- Not checked yetcites Wang et al., 2011 source
plaindirect- Asserted: passes — The authors put it forward as true.
- Checkable: passes — It can be checked against evidence.
- Load-bearing: fails — The paper’s conclusions may not depend on it.
- Based: passes — The paper gives a reason why it holds.
Probably not a substantial claim. The paper’s conclusions may not depend on it.
In the paper
“distinct neural circuits are thought to motivate food consumption related to the rewarding value of food (Nieh et al., 2015)”
§ Dorsal Raphe Dopamine Neurons Represent the Experience of Social Isolation > Discussion > Satisfying the Profile of a Neural Substrate for a Loneliness-like State
What the sources say
- Not checked yetcites Nieh et al., 2015 source
hedgeddirect- Asserted: passes — The authors put it forward as true.
- Checkable: passes — It can be checked against evidence.
- Load-bearing: fails — The paper’s conclusions may not depend on it.
- Based: passes — The paper gives a reason why it holds.
Probably not a substantial claim. The paper’s conclusions may not depend on it.
None of the sources cited for this claim have been checked yet.
In the paper
“DA receptor signaling in these regions modulates synaptic transmission and activity (Kash et al., 2008, de la Mora et al., 2010).”
§ Dorsal Raphe Dopamine Neurons Represent the Experience of Social Isolation > Discussion > Characterizing Components of the DRN DA Circuit
What the sources say
plaindirect- Asserted: passes — The authors put it forward as true.
- Checkable: passes — It can be checked against evidence.
- Load-bearing: fails — The paper’s conclusions may not depend on it.
- Based: passes — The paper gives a reason why it holds.
Probably not a substantial claim. The paper’s conclusions may not depend on it.
A conclusion the paper draws from its own results — it cites no other source for it, so there is none to check. The quote shows it is in the paper.
In the paper
“suggests that these neurons either play a role in detecting or in reconciling the disparity between the current and desired social environment.”
§ Dorsal Raphe Dopamine Neurons Represent the Experience of Social Isolation > Discussion > Satisfying the Profile of a Neural Substrate for a Loneliness-like State
hedgedconditional- Asserted: passes — The authors put it forward as true.
- Checkable: passes — It can be checked against evidence.
- Load-bearing: passes — The paper’s conclusions depend on it.
- Based: passes — The paper gives a reason why it holds.
It may state two separate claims as one.
In the paper
“It has been hypothesized that the “need to belong” represents a powerful motivational drive, comparable to the basic need for food in a state of hunger (Baumeister and Leary, 1995).”
§ Dorsal Raphe Dopamine Neurons Represent the Experience of Social Isolation > Discussion > Satisfying the Profile of a Neural Substrate for a Loneliness-like State
What the sources say
- Not checked yetcites Baumeister and Leary, 1995 source
hedgedcorrelational- Asserted: fails — The authors may not put it forward as true.
- Checkable: passes — It can be checked against evidence.
- Load-bearing: fails — The paper’s conclusions may not depend on it.
- Based: passes — The paper gives a reason why it holds.
Probably not a substantial claim. The authors may not put it forward as true. The paper’s conclusions may not depend on it.
In the paper
“the neuropeptide vasoactive intestinal peptide (VIP) is co-expressed in a subset of DA neurons (Dougalis et al., 2012).”
§ Dorsal Raphe Dopamine Neurons Represent the Experience of Social Isolation > Discussion > Characterizing Components of the DRN DA Circuit
What the sources say
- Not checked yetcites Dougalis et al., 2012 source
plaincorrelational- Asserted: passes — The authors put it forward as true.
- Checkable: passes — It can be checked against evidence.
- Load-bearing: fails — The paper’s conclusions may not depend on it.
- Based: passes — The paper gives a reason why it holds.
Probably not a substantial claim. The paper’s conclusions may not depend on it.
In the paper
“the BNST has been associated with mediating long-term “tonic” behavioral responses to sustained, diffuse, and/or unpredictable threats”
§ Dorsal Raphe Dopamine Neurons Represent the Experience of Social Isolation > Discussion > Characterizing Components of the DRN DA Circuit
What the sources say
- Not checked yetcites Davis et al., 2010 source
hedgedcorrelational- Asserted: passes — The authors put it forward as true.
- Checkable: passes — It can be checked against evidence.
- Load-bearing: fails — The paper’s conclusions may not depend on it.
- Based: passes — The paper gives a reason why it holds.
Probably not a substantial claim. The paper’s conclusions may not depend on it.
A conclusion the paper draws from its own results — it cites no other source for it, so there is none to check. The quote shows it is in the paper.
In the paper
“Thus, DA, glutamate, VIP, or the coordinated activity of these three neurotransmitters/neuromodulators may be important in facilitating the output of the DRN DA neurons.”
§ Dorsal Raphe Dopamine Neurons Represent the Experience of Social Isolation > Discussion > Characterizing Components of the DRN DA Circuit
hedgedconditional- Asserted: passes — The authors put it forward as true.
- Checkable: passes — It can be checked against evidence.
- Load-bearing: fails — The paper’s conclusions may not depend on it.
- Based: passes — The paper gives a reason why it holds.
Probably not a substantial claim. The paper’s conclusions may not depend on it. It may state two separate claims as one.
A conclusion the paper draws from its own results — it cites no other source for it, so there is none to check. The quote shows it is in the paper.
In the paper
“This suggests that activation of these neurons may be recapitulating a loneliness-like state, which is marked by a negative-affective state in which the drive to seek social contact is increased.”
§ Dorsal Raphe Dopamine Neurons Represent the Experience of Social Isolation > Discussion > Satisfying the Profile of a Neural Substrate for a Loneliness-like State
hedgedconditional- Asserted: passes — The authors put it forward as true.
- Checkable: passes — It can be checked against evidence.
- Load-bearing: passes — The paper’s conclusions depend on it.
- Based: passes — The paper gives a reason why it holds.
It may state two separate claims as one.
A conclusion the paper draws from its own results — it cites no other source for it, so there is none to check. The quote shows it is in the paper.
In the paper
“Thus, in a similar manner, social behavior may be driven by distinct neural circuits when motivated by social reward and when motivated by the punishment of social isolation.”
§ Dorsal Raphe Dopamine Neurons Represent the Experience of Social Isolation > Discussion > Satisfying the Profile of a Neural Substrate for a Loneliness-like State
hedgedconditional- Asserted: passes — The authors put it forward as true.
- Checkable: passes — It can be checked against evidence.
- Load-bearing: fails — The paper’s conclusions may not depend on it.
- Based: passes — The paper gives a reason why it holds.
Probably not a substantial claim. The paper’s conclusions may not depend on it.
None of the sources cited for this claim have been checked yet.
In the paper
“and the need to obtain food to alleviate the negative state of hunger (Chen et al., 2015, Sternson et al., 2013).”
§ Dorsal Raphe Dopamine Neurons Represent the Experience of Social Isolation > Discussion > Satisfying the Profile of a Neural Substrate for a Loneliness-like State
What the sources say
plaindirect- Asserted: passes — The authors put it forward as true.
- Checkable: passes — It can be checked against evidence.
- Load-bearing: fails — The paper’s conclusions may not depend on it.
- Based: passes — The paper gives a reason why it holds.
Probably not a substantial claim. The paper’s conclusions may not depend on it.
None of the sources cited for this claim have been checked yet.
In the paper
“The BNST and the CeA have been implicated in diverse behavioral functions (Davis et al., 2010, Janak and Tye, 2015, Kim et al., 2013)”
§ Dorsal Raphe Dopamine Neurons Represent the Experience of Social Isolation > Discussion > Characterizing Components of the DRN DA Circuit
What the sources say
plaincorrelational- Asserted: passes — The authors put it forward as true.
- Checkable: passes — It can be checked against evidence.
- Load-bearing: fails — The paper’s conclusions may not depend on it.
- Based: passes — The paper gives a reason why it holds.
Probably not a substantial claim. The paper’s conclusions may not depend on it.
In the paper
“whereas the CeA is thought to be more important in the rapid, acute response to threatening stimuli (Davis et al., 2010)”
§ Dorsal Raphe Dopamine Neurons Represent the Experience of Social Isolation > Discussion > Characterizing Components of the DRN DA Circuit
What the sources say
- Not checked yetcites Davis et al., 2010 source
hedgedcorrelational- Asserted: passes — The authors put it forward as true.
- Checkable: passes — It can be checked against evidence.
- Load-bearing: fails — The paper’s conclusions may not depend on it.
- Based: passes — The paper gives a reason why it holds.
Probably not a substantial claim. The paper’s conclusions may not depend on it.
In the paper
“While “loneliness” per se is difficult to directly test in mice, and consequently, the lack of animal literature on this phenomenon is noted (Cacioppo et al., 2014)”
§ Dorsal Raphe Dopamine Neurons Represent the Experience of Social Isolation > Discussion > The Subjective Experience of Social Isolation
What the sources say
- Not checked yetcites Cacioppo et al., 2014 source
plain- Asserted: passes — The authors put it forward as true.
- Checkable: fails — It may be too vague to check against evidence.
- Load-bearing: fails — The paper’s conclusions may not depend on it.
- Based: passes — The paper gives a reason why it holds.
Probably not a substantial claim. It may be too vague to check against evidence. The paper’s conclusions may not depend on it.
In the paper
“it has been postulated that the motivation for social re-connection should elicit “goal-orientated behavior” (Baumeister and Leary, 1995).”
§ Dorsal Raphe Dopamine Neurons Represent the Experience of Social Isolation > Discussion > Satisfying the Profile of a Neural Substrate for a Loneliness-like State
What the sources say
- Not checked yetcites Baumeister and Leary, 1995 source
hedgeddirect- Asserted: passes — The authors put it forward as true.
- Checkable: passes — It can be checked against evidence.
- Load-bearing: passes — The paper’s conclusions depend on it.
- Based: passes — The paper gives a reason why it holds.
Probably not a substantial claim.
The paper relies on this without support.
The behavioral and neural state induced by acute social isolation in mice corresponds to the subjective experience of loneliness in humans.
“Taken together, we propose that DRN DA neurons represent a neural substrate for the subjective experience of social isolation and serve to promote a response to alleviate this aversive state.”
“supporting a role for DRN dopamine neurons in mediating a loneliness-like state.”
The paper relies on this without support.
The subjective experience of social interaction differs between members of a social group depending on their social rank.
“As a result, the subjective experience of social interaction is likely to differ between members of a social group dependent on their social rank.”
The paper relies on this without support.
Social rank offers a useful estimate of an individual's subjective social experience.
“social rank offers a useful estimate of an individual’s subjective social experience.”
Claims other papers make about this one
Each is checked against this paper’s own text: does it say what the citing paper says it does?
In the citing paper
“Notably, social rank also predicted the magnitude of behavioral effects elicited upon DRN dopamine manipulations in mice118.”
From Neural mechanisms of social homeostasis (2019) · cites this paper as [118]
In the citing paper
“However, the behavioral change observed in these assays was greater in dominant animals relative to subordinates118.”
From Neural mechanisms of social homeostasis (2019) · cites this paper as [118]
In the citing paper
“This observation suggests that prior social experience may influence the ability of the DRN dopamine neurons to modulate behavior.”
From Neural mechanisms of social homeostasis (2019) · cites this paper as [118]
In the citing paper
“The DRN dopamine system might be one source of negative motivational drive in response to social deficit118.”
From Neural mechanisms of social homeostasis (2019) · cites this paper as [118]
In the citing paper
“These neurons are also Vglut2+ at neonatal timepoints [13], consistent with functional data showing glutamate co-transmission from PAG/DR DA neurons in the adult [47,48].”
From Classification of midbrain dopamine neurons using single-cell gene expression profiling approaches (2020) · cites this paper as [47]
In the citing paper
“inhibition of DR DA neurons promoted social avoidance only following an experience of social isolation [154].”
From Neural circuits regulating prosocial behaviors (2023) · cites this paper as [154]
In the citing paper
“acute social isolation stress was found to induce synaptic adaptations on DA neurons in the DR, but not in the VTA [154].”
From Neural circuits regulating prosocial behaviors (2023) · cites this paper as [154]
In the citing paper
“it was not observed after a brief 24-hr period of social isolation, as expected from previous work (Matthews et al., 2016; Figure 1—figure supplement 1A, B).”
From Oxytocin neurons mediate the effect of social isolation via the VTA circuits (2022) · cites this paper as Matthews et al., 2016
In the citing paper
“While in rodents, 24 hr of social isolation does not change synaptic strength onto DA neurons of the VTA (Matthews et al., 2016)”
From Oxytocin neurons mediate the effect of social isolation via the VTA circuits (2022) · cites this paper as Matthews et al., 2016
In the citing paper
“Brief periods of acute social isolation have been reported to activate midbrain regions in humans (Tomova et al., 2020) and increase DA neurons’ activity within the dorsal Raphe nucleus (DRN) in mice (Matthews et al., 2016).”
From Oxytocin neurons mediate the effect of social isolation via the VTA circuits (2022) · cites this paper as Matthews et al., 2016
In the citing paper
“Remarkably, acute social isolation during adulthood changes the synaptic strength at excitatory inputs onto DA neurons of the DRN in rodents, leaving synaptic transmission onto DA neurons of the VTA unaltered (Matthews et al., 2016).”
From Oxytocin neurons mediate the effect of social isolation via the VTA circuits (2022) · cites this paper as Matthews et al., 2016
Citations
Cites
The need to belong: Desire for interpersonal attachments as a fundamental human motivation.
Baumeister, R. F., & Leary, M. R. (1995) · Psychological Bulletin · doi:10.1037//0033-2909.117.3.497 · Cited by 23,245
Social Relationships and Mortality Risk: A Meta-analytic Review
Holt-Lunstad, J., Smith, T. B., & Layton, J. B. (2010) · PLoS Medicine · doi:10.1371/journal.pmed.1000316 · Cited by 7,272 · cited 2×
“Social isolation, social exclusion, or feelings of social disconnection can lead to loneliness, which is a strongly aversive emotional state in humans and detrimental to physical and mental well-being (Cacioppo et al., 2006, 2014; Holt-Lunstad et al., 2010; House et al., 1988).”
BackgroundSocial Relationships and Health
House, J. S., Landis, K. R., & Umberson, D. (1988) · Science · doi:10.1126/science.3399889 · Cited by 7,073
Ultrasensitive fluorescent proteins for imaging neuronal activity
Chen, T.-W., Wardill, T. J., Sun, Y., Pulver, S. R., Renninger, S. L., Baohan, A., Schreiter, E. R., Kerr, R. A., Orger, M. B., Jayaraman, V., et al. (2013) · Nature · doi:10.1038/nature12354 · Cited by 6,474
Self-esteem as an interpersonal monitor: The sociometer hypothesis
Leary, M. R., Tambor, E. S., Terdal, S. K., & Downs, D. L. (1995) · Journal of Personality and Social Psychology · doi:10.1037/0022-3514.68.3.518 · Cited by 2,519
Cacioppo, J. T., Hughes, M. E., Waite, L. J., Hawkley, L. C., & Thisted, R. A. (2006) · Psychology and Aging · doi:10.1037/0882-7974.21.1.140 · Cited by 2,380
From circuits to behaviour in the amygdala
Janak, P. H., & Tye, K. M. (2015) · Nature · doi:10.1038/nature14188 · Cited by 2,011 · cited 2×
“The BNST and the CeA have been implicated in diverse behavioral functions (Davis et al., 2010; Janak and Tye, 2015; Kim et al., 2013), and DA receptor signaling in these regions modulates synaptic transmission and activity (Kash et al., 2008; de la Mora et al., 2010).”
BackgroundSelf-citationSwanson, L. W. (1982) · Brain Research Bulletin · doi:10.1016/0361-9230(82)90145-9 · Cited by 1,718 · cited 2×
“…in several regions including the medial prefrontal cortex (mPFC), bed nucleus of the stria terminalis (BNST), lateral hypothalamus, central amygdala (CeA), entorhinal cortex, and basolateral amygdala (Hasue and Shammah-Lagnado, 2002; Meloni et al., 2006; Swanson, 1982; Yoshida et al., 1989).”
BackgroundResultMoy, S. S., Nadler, J. J., Perez, A., Barbaro, R. P., Johns, J. M., Magnuson, T. R., Piven, J., & Crawley, J. N. (2004) · Genes, Brain and Behavior · doi:10.1111/j.1601-1848.2004.00076.x · Cited by 1,522 · cited 1×
“We assessed social preference utilizing the three-chamber sociability task, in which time spent on the ‘‘social’’ side of the chamber (containing a juvenile mouse under a wire cup) is used as a measure of sociability (Moy et al., 2004; Silverman et al., 2010).”
MethodPhasic vs Sustained Fear in Rats and Humans: Role of the Extended Amygdala in Fear vs Anxiety
Davis, M., Walker, D. L., Miles, L., & Grillon, C. (2010) · Neuropsychopharmacology · doi:10.1038/npp.2009.109 · Cited by 1,513 · cited 2×
“The BNST and the CeA have been implicated in diverse behavioral functions (Davis et al., 2010; Janak and Tye, 2015; Kim et al., 2013), and DA receptor signaling in these regions modulates synaptic transmission and activity (Kash et al., 2008; de la Mora et al., 2010).”
Background
Cited by
Sorted by citations
Guzik, T. J., MOHIDDIN, S. A., Dimarco, A. D., Patel, V., Savvatis, K., Marelli‐Berg, F. M., Madhur, M. S., Tomaszewski, M., Maffia, P., D’Acquisto, F., et al. (2020) · Cardiovascular Research · doi:10.1093/cvr/cvaa106 · Cited by 1,484
Integration of optogenetics with complementary methodologies in systems neuroscience
Kim, C. K., Adhikari, A., & Deisseroth, K. (2017) · Nature reviews. Neuroscience · doi:10.1038/nrn.2017.15 · Cited by 690
Social determinants of health and survival in humans and other animals
Snyder-Mackler, N., Burger, J. R., Gaydosh, L., Belsky, D. W., Noppert, G. A., Campos, F. A., Bartolomucci, A., Yang, Y. C., Aiello, A. E., O’Rand, A., et al. (2020) · Science · doi:10.1126/science.aax9553 · Cited by 679
Gating of social reward by oxytocin in the ventral tegmental area
Hung, L. W., Neuner, S., Polepalli, J. S., Beier, K. T., Wright, M., Walsh, J. J., Lewis, E. M., Luo, L., Deisseroth, K., Dölen, G., et al. (2017) · Science · doi:10.1126/science.aan4994 · Cited by 578
Loneliness in the Modern Age: An Evolutionary Theory of Loneliness (ETL)
Cacioppo, J. T., & Cacioppo, S. (2018) · Advances in Experimental Social Psychology · doi:10.1016/bs.aesp.2018.03.003 · Cited by 481
Poulin, J.-F., Caronia, G., Hofer, C., Cui, Q., Helm, B., Ramakrishnan, C., Chan, C. S., Dombeck, D. A., Deisseroth, K., & Awatramani, R. (2018) · Nature Neuroscience · doi:10.1038/s41593-018-0203-4 · Cited by 423
Hunger-Driven Motivational State Competition
Burnett, C. J., Li, C., Webber, E., Tsaousidou, E., Xue, S. Y., Brüning, J. C., & Krashes, M. J. (2016) · Neuron · doi:10.1016/j.neuron.2016.08.032 · Cited by 305
The Neuropeptide Tac2 Controls a Distributed Brain State Induced by Chronic Social Isolation Stress
Zelikowsky, M., Hui, M., Karigo, T., Choe, A., Yang, B., Blanco, M. R., Beadle, K., Gradinaru, V., Deverman, B. E., & Anderson, D. J. (2018) · Cell · doi:10.1016/j.cell.2018.03.037 · Cited by 290
Anterior cingulate cortex dysfunction underlies social deficits in Shank3 mutant mice
Guo, B., Chen, J., Chen, Q., Ren, K., Feng, D., Mao, H., Yao, H., Yang, J., Liu, H., Liu, Y., et al. (2019) · Nature Neuroscience · doi:10.1038/s41593-019-0445-9 · Cited by 287
Acute social isolation evokes midbrain craving responses similar to hunger
Tomova, L., Wang, K. L., Thompson, T., Matthews, G. A., Takahashi, A., Tye, K. M., & Saxe, R. (2020) · Nature Neuroscience · doi:10.1038/s41593-020-00742-z · Cited by 283
Self-citationDorsal Raphe Dopamine Neurons Modulate Arousal and Promote Wakefulness by Salient Stimuli
Cho, J. R., Treweek, J. B., Robinson, J. E., Xiao, C., Bremner, L. R., Greenbaum, A., & Gradinaru, V. (2017) · Neuron · doi:10.1016/j.neuron.2017.05.020 · Cited by 276
Neural mechanisms of social homeostasis
Matthews, G. A., & Tye, K. M. (2019) · Annals of the New York Academy of Sciences · doi:10.1111/nyas.14016 · Cited by 273
Self-citation5-HT release in nucleus accumbens rescues social deficits in mouse autism model
Walsh, J. J., Christoffel, D. J., Heifets, B. D., Ben-Dor, G. A., Selimbeyoglu, A., Hung, L. W., Deisseroth, K., & Malenka, R. C. (2018) · Nature · doi:10.1038/s41586-018-0416-4 · Cited by 256
Classification of midbrain dopamine neurons using single-cell gene expression profiling approaches
Poulin, J.-F., Gaertner, Z., Moreno-Ramos, O. A., & Awatramani, R. (2020) · Trends in Neurosciences · doi:10.1016/j.tins.2020.01.004 · Cited by 238
Biological underpinnings for lifelong learning machines
Kudithipudi, D., Aguilar-Simon, M., Babb, J., Bazhenov, M., Blackiston, D., Bongard, J., Brna, A. P., Chakravarthi Raja, S., Cheney, N., Clune, J., et al. (2022) · Nature Machine Intelligence · doi:10.1038/s42256-022-00452-0 · Cited by 236
The emergence and influence of internal states
Flavell, S. W., Gogolla, N., Lovett-Barron, M., & Zelikowsky, M. (2022) · Neuron · doi:10.1016/j.neuron.2022.04.030 · Cited by 246
Using the tube test to measure social hierarchy in mice
Fan, Z., Zhu, H. L., Zhou, T., Wang, S., Wu, Y., & Hu, H. (2019) · Nature Protocols · doi:10.1038/s41596-018-0116-4 · Cited by 227
Deep brain optogenetics without intracranial surgery
Chen, R., Gore, F., Nguyen, Q.-A., Ramakrishnan, C., Patel, S., Kim, S. H., Raffiee, M., Kim, Y. S., Hsueh, B., Krook-Magnuson, E. I., et al. (2020) · Nature Biotechnology · doi:10.1038/s41587-020-0679-9 · Cited by 233
Preventing social isolation in older people
Cotterell, N., Buffel, T., & Phillipson, C. (2018) · Maturitas · doi:10.1016/j.maturitas.2018.04.014 · Cited by 248
A Model for Basic Emotions Using Observations of Behavior in Drosophila
Gu, S., Wang, F., Patel, N. P., Bourgeois, J. A., & Huang, J. H. (2019) · Frontiers in Psychology · doi:10.3389/fpsyg.2019.00781 · Cited by 267
Ko, J. (2017) · Frontiers in Neural Circuits · doi:10.3389/fncir.2017.00041 · Cited by 229
Viewpoints: Approaches to defining and investigating fear
Mobbs, D., Adolphs, R., Fanselow, M. S., Barrett, L. F., LeDoux, J. E., Ressler, K., & Tye, K. M. (2019) · Nature Neuroscience · doi:10.1038/s41593-019-0456-6 · Cited by 202
Self-citationA Specialized Neural Circuit Gates Social Vocalizations in the Mouse
Tschida, K., Michael, V., Takatoh, J., Han, B.-X., Zhao, S., Sakurai, K., MOONEY, R. D., & Wang, F. (2019) · Neuron · doi:10.1016/j.neuron.2019.05.025 · Cited by 188
An amygdala-to-hypothalamus circuit for social reward
Hu, R. K., Zuo, Y., Ly, T., Wang, J., Meera, P., Wu, Y. E., & Hong, W. (2021) · Nature Neuroscience · doi:10.1038/s41593-021-00828-2 · Cited by 174
Identification of a Brainstem Circuit Controlling Feeding
Nectow, A. R., Schneeberger, M., Zhang, H., Field, B. C., Renier, N., Azevedo, E. P., Patel, B., Liang, Y., Mitra, S. S., Tessier‐Lavigne, M., et al. (2017) · Cell · doi:10.1016/j.cell.2017.06.045 · Cited by 172
Bariselli, S., Hörnberg, H., Prévost-Solié, C., Musardo, S., Hatstatt-Burklé, L., Scheiffele, P., & Bellone, C. (2018) · Nature Communications · doi:10.1038/s41467-018-05382-3 · Cited by 171
Modulating the Neuromodulators: Dopamine, Serotonin, and the Endocannabinoid System
Peters, K. Z., Cheer, J. F., & Tonini, R. (2021) · Trends in Neurosciences · doi:10.1016/j.tins.2021.02.001 · Cited by 180
Distinct and Dynamic ON and OFF Neural Ensembles in the Prefrontal Cortex Code Social Exploration
Liang, B., Zhang, L., Barbera, G., Fang, W., Zhang, J., Chen, X., Chen, R., Li, Y., & Lin, D. (2018) · Neuron · doi:10.1016/j.neuron.2018.08.043 · Cited by 174
Silva, C., & McNaughton, N. (2019) · Progress in Neurobiology · doi:10.1016/j.pneurobio.2019.02.001 · Cited by 166
Improved green and red GRAB sensors for monitoring dopaminergic activity in vivo
Zhuo, Y., Luo, B., Yi, X., Dong, H., Miao, X., Wan, J., Williams, J. T., Campbell, M. G., Cai, R., Qian, T., et al. (2023) · Nature Methods · doi:10.1038/s41592-023-02100-w · Cited by 174
The neural circuitry of social homeostasis: Consequences of acute versus chronic social isolation
Lee, C. R., Chen, A., & Tye, K. M. (2021) · Cell · doi:10.1016/j.cell.2021.02.028 · Cited by 146
Self-citationComparative studies of social buffering: A consideration of approaches, terminology, and pitfalls
Kiyokawa, Y., & Hennessy, M. B. (2017) · Neuroscience & Biobehavioral Reviews · doi:10.1016/j.neubiorev.2017.12.005 · Cited by 136
Diet-Derived Fatty Acids, Brain Inflammation, and Mental Health
Melo, H. M., Santos, L. E., & Ferreira, S. T. (2019) · Frontiers in Neuroscience · doi:10.3389/fnins.2019.00265 · Cited by 136
Advances in understanding neural mechanisms of social dominance
Zhou, T., Sandi, C., & Hu, H. (2018) · Current Opinion in Neurobiology · doi:10.1016/j.conb.2018.01.006 · Cited by 133
The hypocretin (orexin) system: from a neural circuitry perspective
Li, S., & de Lecea, L. (2020) · Neuropharmacology · doi:10.1016/j.neuropharm.2020.107993 · Cited by 138
Tang, W., Kochubey, O., Kintscher, M., & Schneggenburger, R. (2020) · Journal of Neuroscience · doi:10.1523/jneurosci.1796-19.2020 · Cited by 131
Song, Q., Wei, A., Xu, H., Gu, Y., Jiang, Y. Q., Dong, N., Zheng, C., Wang, Q., Gao, M., Sun, S., et al. (2024) · Nature Neuroscience · doi:10.1038/s41593-023-01519-w · Cited by 133
A Paranigral VTA Nociceptin Circuit that Constrains Motivation for Reward
Parker, K. E., Pedersen, C. E., Gomez, A. M., Spangler, S. M., Walicki, M. C., Feng, S., Stewart, S., Otis, J. M., Al‐Hasani, R., McCall, J. G., et al. (2019) · Cell · doi:10.1016/j.cell.2019.06.034 · Cited by 113
Dorsal tegmental dopamine neurons gate associative learning of fear
Groessl, F., Munsch, T., Meis, S., Griessner, J., Kaczanowska, J., Pliota, P., Kargl, D., Badurek, S., Kraitsy, K., Rassoulpour, A., et al. (2018) · Nature Neuroscience · doi:10.1038/s41593-018-0174-5 · Cited by 118
μ opioid receptor, social behaviour and autism spectrum disorder: reward matters
Pellissier, L. P., Gandía, J., Laboute, T., Becker, J. A. J., & Merrer, J. L. (2017) · British Journal of Pharmacology · doi:10.1111/bph.13808 · Cited by 115
The zebrafish subcortical social brain as a model for studying social behavior disorders
Geng, Y., & Peterson, R. T. (2019) · Disease Models & Mechanisms · doi:10.1242/dmm.039446 · Cited by 119
Dysfunctional serotonergic neuron-astrocyte signaling in depressive-like states
González-Arias, C., Sánchez-Ruiz, A., Esparza, J., Sánchez‐Puelles, C., Arancibia, L., Ramírez‐Franco, J., Gobbo, D., Kirchhoff, F., & Perea, G. (2023) · Molecular Psychiatry · doi:10.1038/s41380-023-02269-8 · Cited by 124
Identification of serotonergic neuronal modules that affect aggressive behavior
Niederkofler, V., Asher, T. E., Okaty, B. W., Rood, B. D., Narayan, A., Hwa, L. S., Beck, S. G., Miczek, K. A., & Dymecki, S. M. (2016) · Cell Reports · doi:10.1016/j.celrep.2016.10.063 · Cited by 113
An Integrative Interdisciplinary Perspective on Social Dominance Hierarchies
Qu, C., Ligneul, R., der Henst, J. V., & Dreher, J. (2017) · Trends in Cognitive Sciences · doi:10.1016/j.tics.2017.08.004 · Cited by 123
Yu, W., Pati, D., Pina, M. M., Schmidt, K. T., Boyt, K. M., Hunker, A. C., Zweifel, L. S., McElligott, Z. A., & Kash, T. L. (2021) · Neuron · doi:10.1016/j.neuron.2021.03.001 · Cited by 112
A mesocortical dopamine circuit enables the cultural transmission of vocal behaviour
Tanaka, M., Sun, F., Li, Y., & MOONEY, R. D. (2018) · Nature · doi:10.1038/s41586-018-0636-7 · Cited by 116
A distinct D1-MSN subpopulation down-regulates dopamine to promote negative emotional state
Liu, Z., Le, Q., Lv, Y., Chen, X., Cui, J., Zhou, Y., Cheng, D., Ma, C., Su, X., Xiao, L., et al. (2021) · Cell Research · doi:10.1038/s41422-021-00588-5 · Cited by 110
Midbrain dopamine neurons signal aversion in a reward-context-dependent manner
Matsumoto, H., Tian, J., Uchida, N., & Watabe‐Uchida, M. (2016) · eLife · doi:10.7554/elife.17328 · Cited by 121
Endocannabinoid Signaling in the Control of Social Behavior
Don, W., Allsop, S. A., Tye, K. M., & Piomelli, D. (2017) · Trends in Neurosciences · doi:10.1016/j.tins.2017.04.005 · Cited by 120
Self-citationNeurobiology of Loneliness, Isolation, and Loss: Integrating Human and Animal Perspectives
Vitale, E. M., & Smith, A. S. (2022) · Frontiers in Behavioral Neuroscience · doi:10.3389/fnbeh.2022.846315 · Cited by 127
Donovan, M., Mackey, C. S., Platt, G. N., Rounds, J., Brown, A. N., Trickey, D. J., Liu, Y., Jones, K. M., & Wang, Z. (2020) · Neurobiology of Stress · doi:10.1016/j.ynstr.2020.100278 · Cited by 85
Stamatakis, A. M., Schachter, M. J., Gulati, S., Zitelli, K. T., Malanowski, S., Tajik, A., Fritz, C., Trulson, M. O., & Otte, S. L. (2018) · Frontiers in Neuroscience · doi:10.3389/fnins.2018.00496 · Cited by 108
The Raphe Dopamine System Controls the Expression of Incentive Memory
Lin, R., Liang, J., Wang, R., Yan, T., Zhou, Y., Liu, Y., Feng, Q., Sun, F., Li, Y., Li, A., et al. (2020) · Neuron · doi:10.1016/j.neuron.2020.02.009 · Cited by 97
Dopamine tunes prefrontal outputs to orchestrate aversive processing
Weele, C. M. V., Siciliano, C. A., & Tye, K. M. (2018) · Brain Research · doi:10.1016/j.brainres.2018.11.044 · Cited by 98
Self-citationHeterogeneity in striatal dopamine circuits: Form and function in dynamic reward seeking
Collins, A. L., & Saunders, B. T. (2020) · Journal of Neuroscience Research · doi:10.1002/jnr.24587 · Cited by 93
In vivo functional diversity of midbrain dopamine neurons within identified axonal projections
Farassat, N., Costa, K. M., Stojanovic, S., Albert, S., Kovacheva, L., Shin, J., Egger, R., Somayaji, M., Duvarci, S., Schneider, G., et al. (2019) · eLife · doi:10.7554/elife.48408 · Cited by 96
Valentinova, K., Tchenio, A., Trusel, M., Clerke, J. A., Lalive, A. L., Tzanoulinou, S., Matera, A., Moutkine, I., Maroteaux, L., Paolicelli, R. C., et al. (2019) · Nature Neuroscience · doi:10.1038/s41593-019-0421-4 · Cited by 93
Dysregulation of brain dopamine systems in major depressive disorder
Delva, N. C., & Stanwood, G. D. (2021) · Experimental Biology and Medicine · doi:10.1177/1535370221991830 · Cited by 96
Cerebellar modulation of synaptic input to freezing-related neurons in the periaqueductal gray
Vaaga, C. E., Brown, S. T., & Raman, I. M. (2020) · eLife · doi:10.7554/elife.54302 · Cited by 89
The Three-Dimensional Signal Collection Field for Fiber Photometry in Brain Tissue
Pisanello, M., Pisano, F., Hyun, M., Maglie, E., Balena, A., Vittorio, M. D., Sabatini, B. L., & Pisanello, F. (2019) · Frontiers in Neuroscience · doi:10.3389/fnins.2019.00082 · Cited by 85
Carbon dots-based dopamine sensors: Recent advances and challenges
Liu, C., Lin, X., Liao, J. P., Yang, M., Jiang, M., Huang, Y., Du, Z., Chen, L., Fan, S., & Huang, Q. (2024) · Chinese Chemical Letters · doi:10.1016/j.cclet.2024.109598 · Cited by 85
Aversion hot spots in the dopamine system
Verharen, J. P. H., Zhu, Y., & Lammel, S. (2020) · Current Opinion in Neurobiology · doi:10.1016/j.conb.2020.02.002 · Cited by 85
A hypothalamic circuit underlying the dynamic control of social homeostasis
Liu, D., Rahman, M., Johnson, A., Amo, R., Tsutsui‐Kimura, I., Sullivan, Z. A., Pena, N., Talay, M., Logeman, B. L., Finkbeiner, S., et al. (2025) · Nature · doi:10.1038/s41586-025-08617-8 · Cited by 89
Pinto, D. F. C., Yang, H., Dorocic, I. P., de Jong, J. W., Han, V. J., Peck, J. R., Zhu, Y., Liu, C. J., Beier, K. T., Smidt, M. P., et al. (2019) · Nature Communications · doi:10.1038/s41467-019-12392-2 · Cited by 80
The impact of workplace loneliness on employee outcomes: what role does psychological capital play?
Firoz, M., & Chaudhary, R. (2021) · Personnel Review · doi:10.1108/pr-03-2020-0200 · Cited by 86
Oxytocin neurons mediate the effect of social isolation via the VTA circuits
Musardo, S., Contestabile, A., Knoop, M., Baud, O., & Bellone, C. (2022) · eLife · doi:10.7554/elife.73421 · Cited by 77
Modulation of 5-HT release by dynorphin mediates social deficits during opioid withdrawal
Pomrenze, M. B., Pinto, D. F. C., Neumann, P. A., Llorach, P., Tucciarone, J., Morishita, W., Eshel, N., Heifets, B. D., & Malenka, R. C. (2022) · Neuron · doi:10.1016/j.neuron.2022.09.024 · Cited by 79
Characterizing the mechanisms of social connection
Delgado, M. R., Fareri, D. S., & Chang, L. J. (2023) · Neuron · doi:10.1016/j.neuron.2023.09.012 · Cited by 89
Neural circuits regulating prosocial behaviors
Walsh, J. J., Christoffel, D. J., & Malenka, R. C. (2023) · Neuropsychopharmacology · doi:10.1038/s41386-022-01348-8 · Cited by 72
Zhang, H., Li, K., Chen, H., Gao, S., Xia, Z., Zhang, J., Wang, F., & Chen, J. (2018) · Brain Structure and Function · doi:10.1007/s00429-018-1623-3 · Cited by 75
Midbrain circuits of novelty processing
Tapper, A. R., & Molas, S. (2020) · Neurobiology of Learning and Memory · doi:10.1016/j.nlm.2020.107323 · Cited by 74
IGF1-Dependent Synaptic Plasticity of Mitral Cells in Olfactory Memory during Social Learning
Liu, Z., Chen, Z., Shang, C., Yan, F., Shi, Y., Zhang, J., Qu, B., Han, H., Wang, Y., Li, D., et al. (2017) · Neuron · doi:10.1016/j.neuron.2017.06.015 · Cited by 70
Wang, Z., Shwani, T., Liu, J., Zhong, P., Yang, F., Schatz, K. C., Zhang, F., Pralle, A., & Yan, Z. (2022) · Molecular Psychiatry · doi:10.1038/s41380-022-01574-y · Cited by 66
Neural systems that facilitate the representation of social rank
Dwortz, M. F., Curley, J. P., Tye, K. M., & Padilla-Coreano, N. (2022) · Philosophical Transactions of the Royal Society B · doi:10.1098/rstb.2020.0444 · Cited by 64
Self-citationSeidemann, R., Duek, O. A., Jia, R., Levy, I., & Harpaz‐Rotem, I. (2021) · Chronic Stress · doi:10.1177/2470547021996006 · Cited by 69
Fontana, B. D., Müller, T. E., Cleal, M., de Abreu, M. S., Norton, W., Demin, K. A., Amstislavskaya, T. G., Petersen, E. V., Kalueff, A. V., Parker, M. O., et al. (2021) · Progress in Neurobiology · doi:10.1016/j.pneurobio.2021.101993 · Cited by 61
Netser, S., Haskal, S., Magalnik, H., & Wagner, S. (2017) · Molecular Autism · doi:10.1186/s13229-017-0169-1 · Cited by 65
GPCR-Based Dopamine Sensors—A Detailed Guide to Inform Sensor Choice for In Vivo Imaging
Labouesse, M. A., Cola, R. B., & Patriarchi, T. (2020) · International Journal of Molecular Sciences · doi:10.3390/ijms21218048 · Cited by 63
A D2 to D1 shift in dopaminergic inputs to midbrain 5-HT neurons causes anorexia in mice
Cai, X., Liu, H., Feng, B. C., Yu, M., He, Y., Liu, H., Liang, C., Yang, Y., Tu, L., Zhang, N., et al. (2022) · Nature Neuroscience · doi:10.1038/s41593-022-01062-0 · Cited by 59
Dynamic influences on the neural encoding of social valence
Padilla-Coreano, N., Tye, K. M., & Zelikowsky, M. (2022) · Nature reviews. Neuroscience · doi:10.1038/s41583-022-00609-1 · Cited by 59
Self-citationLiang, Y. Y., Zhou, M., He, Y., Zhang, W., Wu, Q., Luo, T., Zhang, J., Jia, F., Qi, L., Ai, S., et al. (2024) · Nature Human Behaviour · doi:10.1038/s41562-024-01970-0 · Cited by 62
Needham, B. D., Tang, W., & Wu, W. (2018) · Developmental Neurobiology · doi:10.1002/dneu.22581 · Cited by 60
A Hierarchy of Autonomous Systems for Vocal Production
Zhang, Y. S., & Ghazanfar, A. A. (2020) · Trends in Neurosciences · doi:10.1016/j.tins.2019.12.006 · Cited by 54
Cho, J. R., Chen, X., Kahan, A., Robinson, J. E., Wagenaar, D. A., & Gradinaru, V. (2021) · Journal of Neuroscience · doi:10.1523/jneurosci.2690-20.2021 · Cited by 58
Fukumitsu, K., Kaneko, M., Maruyama, T., Yoshihara, C., Huang, A. J. Y., McHugh, T. J., Itohara, S., Tanaka, M., & Kuroda, K. O. (2022) · Nature Communications · doi:10.1038/s41467-022-28131-z · Cited by 56
Social Deprivation Induces Astrocytic TRPA1-GABA Suppression of Hippocampal Circuits
Cheng, Y.-T., Woo, J., Luna-Figueroa, E., Maleki, E., Harmancı, A. S., & Deneen, B. (2022) · Neuron · doi:10.1016/j.neuron.2023.01.015 · Cited by 60
Preclinical voluntary drinking models for alcohol abstinence‐induced affective disturbances in mice
Holleran, K. M., & Winder, D. G. (2016) · Genes Brain & Behavior · doi:10.1111/gbb.12338 · Cited by 53
Porter‐Stransky, K. A., Centanni, S. W., Karne, S. L., Odil, L. M., Fekir, S., Wong, J. C., Jerome, C., Mitchell, H. A., Escayg, A., Pedersen, N. P., et al. (2018) · Biological Psychiatry · doi:10.1016/j.biopsych.2018.07.027 · Cited by 57
The ventrolateral periaqueductal grey updates fear via positive prediction error
Walker, R. A., Wright, K. M., Jhou, T. C., & McDannald, M. A. (2019) · European Journal of Neuroscience · doi:10.1111/ejn.14536 · Cited by 55
Therapeutic Challenges of Post-traumatic Stress Disorder: Focus on the Dopaminergic System
Torrisi, S. A., Leggio, G. M., Drago, F., & Salomone, S. (2019) · Frontiers in Pharmacology · doi:10.3389/fphar.2019.00404 · Cited by 59
Aversive Motivation and Cognitive ControlPreprint
Yee, D. M., Leng, X., Shenhav, A., & Braver, T. S. (2021) · PsyArXiv (OSF Preprints) · doi:10.1016/j.neubiorev.2021.12.016 · Cited by 59
Al-Kachak, A., Salvo, G. D., Fulton, S. L., Chan, J. C., Farrelly, L. A., Lepack, A. E., Bastle, R. M., Kong, L., Cathomas, F., Newman, E. L., et al. (2024) · Nature Communications · doi:10.1038/s41467-024-49336-4 · Cited by 57
Lörincz, M. L., & Adamantidis, A. (2016) · Progress in Neurobiology · doi:10.1016/j.pneurobio.2016.09.003 · Cited by 54
Acute social isolation evokes midbrain craving responses similar to hungerPreprint
Tomova, L., Wang, K. L., Thompson, T. W., Matthews, G. A., Takahashi, A., Tye, K. M., & Saxe, R. R. (2020) · bioRxiv (Cold Spring Harbor Laboratory) · doi:10.1101/2020.03.25.006643 · Cited by 67
Self-citationRigney, N., Beaumont, R., & Petrulis, A. (2020) · Hormones and Behavior · doi:10.1016/j.yhbeh.2020.104715 · Cited by 49
Bridging skin, brain, and behavior to understand pleasurable social touch
Elias, L. J., & Abdus-Saboor, I. (2022) · Current Opinion in Neurobiology · doi:10.1016/j.conb.2022.102527 · Cited by 51
Shi, Q., Gao, Z., Jia, G., Li, C., Huang, Q., Ishii, H., Takanishi, A., & Fukuda, T. (2020) · IEEE Transactions on Robotics · doi:10.1109/tro.2020.3033705 · Cited by 47
A Modified Robotic Rat to Study Rat-Like Pitch and Yaw Movements
Shi, Q., Li, C., Li, K., Huang, Q., Ishii, H., Takanishi, A., & Fukuda, T. (2018) · IEEE/ASME Transactions on Mechatronics · doi:10.1109/tmech.2018.2863269 · Cited by 45
Duffner, L. A., Janssen, N., Deckers, K., Schroyen, S., de Vugt, M. E., Köhler, S., Adam, S., Verhey, F. R. J., & Veenstra, M. Y. (2024) · Journal of the American Medical Directors Association · doi:10.1016/j.jamda.2024.105110 · Cited by 52
Lavenda-Grosberg, D., Lalzar, M., Leser, N., Yaseen, A., Malik, A., Maroun, M., Barki‐Harrington, L., & Wagner, S. (2021) · Molecular Psychiatry · doi:10.1038/s41380-021-01342-4 · Cited by 44
Metadata
- Authors
- Matthews, G. A., Nieh, E. H., Vander Weele, C. M., Halbert, S. A., Pradhan, R. V., Yosafat, A. S., Glober, G. F., Izadmehr, E. M., Thomas, R. E., Lacy, G. D., Wildes, C. P., Ungless, M. A., & Tye, K. M.
- Affiliations
- Hammersmith Hospital (GB)
- Massachusetts Institute of Technology (US)
- Corresponding author
- Ungless, Mark A.
- Tye, Kay M.
- ORCID
- Venue
- Cell
- Publisher
- Elsevier BV
- Published
- 2016-02
- Volume
- 164
- Issue
- 4
- Pages
- 617-631
- ISSN
- 0092-8674 (ISSN-L)
- PMC
- PMC4752823
- OpenAlex
- W2269038554
- Semantic Scholar
- 1adbaade5ef3bde98d2bb90790ddf3f098fbafb7
- Cited by
- 402
- References
- 73
- Citations by year
- 2026: 30 · 2025: 47 · 2024: 46 · 2023: 48 · 2022: 36 · 2021: 56 · 2020: 30 · 2019: 34 · 2018: 33 · 2017: 25 · 2016: 17
- FWCI
- 20.38
- Type
- journal article
- Language
- en
- Open access
- hybrid
- doi.org
- Licence
- Locations
- Cell (publishedVersion, cc-by)
- Europe PMC (PubMed Central) (publishedVersion, cc-by)
- PubMed Central (publishedVersion, cc-by)
- PubMed (publishedVersion)
- DSpace@MIT (Massachusetts Institute of Technology) (submittedVersion, cc-by-nc)
- Spiral (Imperial College London) (submittedVersion, other-oa)
- Elsevier eBooks
- Funders
- JPB Foundation
- PIIF
- PNDRF
- JFDP
- Whitehall Foundation
- Klingenstein Foundation
- NARSAD Young Investigator Award
- Alfred P Sloan Foundation
- New York Stem Cell Foundation
- McKnight Foundation
- Whitehead Career Development Chair
- NIMH (R01-MH102441-01)
- NIA (RF1-AG047661-01)
- NIH (DP2-DK-102256-01)
- U.K. Medical Research Council (MC-A654-5QB70)
- The Royal Society
- Simons Center
- NSF Graduate Research Program Fellowship
- Integrative Neuronal Systems Fellowship
- NIGMS (T32 GM007484)
- NSF
- Undergraduate Research Opportunities Program at MIT
- MIT Summer Research Program
- Northeastern Cooperative Education Program
- Topics
- Life Sciences › Neuroscience › Cellular and Molecular Neuroscience › Neurotransmitter Receptor Influence on Behavior
- Life Sciences › Neuroscience › Endocrine and Autonomic Systems › Neuroendocrine regulation and behavior
- Life Sciences › Neuroscience › Cellular and Molecular Neuroscience › Neuroscience and Neuropharmacology Research
- Keywords
- dorsal raphe nucleus, dopaminergic neurons, social isolation, loneliness, social reward, social preferences, place avoidance, social rank, synaptic plasticity, calcium imaging, optogenetic stimulation, negative emotions
- MeSH terms
- Animals, Dopamine, Loneliness, Male, Reward, Synapses, Ventral Tegmental Area, Patch-Clamp Techniques, Glutamic Acid, Mice, Dopaminergic Neurons, Optogenetics, Dorsal Raphe Nucleus, In Vitro Techniques
About these checks
Registry, retraction, Cites and statistics results are computed, not judged, with one exception: a printed reference that no index lists is read once by a model before it counts as a citation error. Claims are extracted by a model and kept only when their quote appears verbatim in the text; each cited source is then checked, with a model’s help, for whether it says what the claim relies on. Those verdicts can be wrong — read the claim’s quote and the cited source before relying on one.
A language model drew the claims from the paper on 2026-10-09, under version 3 of the claim definition (model deepseek-v4.1-flash, prompt extract-v3).
A second model labelled each claim on 2026-10-09 (model jev-1.13-20260917, definition revision gold-guideline-v0.2).
Statistics and arithmetic are recomputed, not judged.
Confidence bands are shown only for fields calibrated on our annotated test set. None is calibrated yet, so no band is shown.
What counts as a claim ›How we measure confidence ›How we check this ›
Are you an author, or do you see a problem with this page? Request a review
