

The DOI matches its Crossref record; 13 of the 13 references it cites were found in a registry or an index.
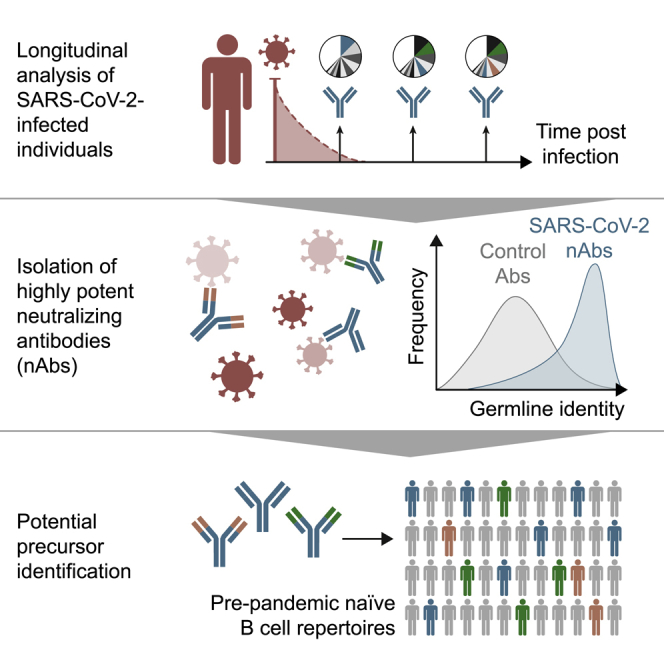
Longitudinal Isolation of Potent Near-Germline SARS-CoV-2-Neutralizing Antibodies from COVID-19 Patients
Published version of a preprint
Overview
The claims and statistics of this paper haven’t been checked yet.
Run the check — free, no account needed. It reads the open-access text and checks the sources it cites.
Integrity signals
Registry
Cites
Statistics
Figures
Verification
Claims the paper makes
The claims and statistics of this paper haven’t been checked yet.
Run the check — free, no account needed. It reads the open-access text and checks the sources it cites.
Claims other papers make about this one
Each is checked against this paper’s own text: does it say what the citing paper says it does?
In the citing paper
“In contrast, RBD-binding antibodies exhibited higher neutralizing activity [[33], [34], [35]].”
From Systemic profiling of immune responses in healthy adults vaccinated with an RBD-targeting COVID-19 mRNA vaccine (2025) · cites this paper as [33]
Self-check
Percentages, sums and reported differences re-computed from the paper’s own numbers.
The self-check needs the paper’s full text.
Citations
Cites
A novel coronavirus from patients with pneumonia in China, 2019
Zhu, N., Zhang, D., Wang, W., Li, X., Yang, B., Song, J., Zhao, X., Huang, B., Shi, W., Lu, R., et al. (2020) · New England Journal of Medicine · doi:10.1056/nejmoa2001017 · Cited by 28,244
Cryo-EM structure of the 2019-nCoV spike in the prefusion conformation
Wrapp, D., Wang, N., Corbett, K. S., Goldsmith, J. A., Hsieh, C.-L., Abiona, O., Graham, B. S., & McLellan, J. S. (2020) · Science · doi:10.1126/science.abb2507 · Cited by 8,897
Antibody responses to SARS-CoV-2 in patients with COVID-19
Long, Q.-X., Liu, B.-Z., Deng, H.-J., Wu, G.-C., Deng, K., Chen, Y.-K., Liao, P., Qiu, J.-F., Lin, Y., Cai, X.-F., et al. (2020) · Nature Medicine · doi:10.1038/s41591-020-0897-1 · Cited by 2,876
Clinical and immunological assessment of asymptomatic SARS-CoV-2 infections
Long, Q.-X., Tang, X.-J., Shi, Q.-L., Li, Q., Deng, H.-J., Yuan, J., Hu, J.-L., Xu, W., Zhang, Y., Lv, F.-J., et al. (2020) · Nature Medicine · doi:10.1038/s41591-020-0965-6 · Cited by 2,686
Convergent Antibody Responses to SARS-CoV-2 in Convalescent Individuals
Robbiani, D. F., Gaebler, C., Muecksch, F., Lorenzi, J. C. C., Wang, Z., Cho, A., Agudelo, M., Barnes, C. O., Gazumyan, A., Finkin, S., et al. (2020) · Nature · doi:10.1038/s41586-020-2456-9 · Cited by 1,853
Human neutralizing antibodies elicited by SARS-CoV-2 infection
Ju, B., Zhang, Q., Ge, J., Wang, R., Sun, J., Ge, X., Yu, J., Shan, S., Zhou, B., Song, S., et al. (2020) · Nature · doi:10.1038/s41586-020-2380-z · Cited by 1,667
Potent neutralizing antibodies against multiple epitopes on SARS-CoV-2 spike
Liu, L., Wang, P., Nair, M. S., Yu, J., Rapp, M., Wang, Q., Luo, Y., Chan, J. F.-W., Sahi, V., Figueroa, A., et al. (2020) · Nature · doi:10.1038/s41586-020-2571-7 · Cited by 1,349
SARS-CoV-2-reactive T cells in healthy donors and patients with COVID-19
Braun, J., Loyal, L., Frentsch, M., Wendisch, D., Georg, P., Kurth, F., Hippenstiel, S., Dingeldey, M., Kruse, B., Fauchere, F., et al. (2020) · Nature · doi:10.1038/s41586-020-2598-9 · Cited by 1,310
Baum, A., Fulton, B. O., Wloga, E., Copin, R., Pascal, K. E., Russo, V., Giordano, S., Lanza, K., Negron, N., Ni, M., et al. (2020) · Science · doi:10.1126/science.abd0831 · Cited by 1,253
Studies in humanized mice and convalescent humans yield a SARS-CoV-2 antibody cocktail
Hansen, J., Baum, A., Pascal, K. E., Russo, V., Giordano, S., Wloga, E., Fulton, B. O., Yan, Y., Koon, K., Patel, K., et al. (2020) · Science · doi:10.1126/science.abd0827 · Cited by 1,210
Research works printed but not linked: 60
- Andreano, 2020, Identification of neutralizing human monoclonal antibodies from Italian Covid-19 convalescent patients, bioRxiv
- Burton, 2020, Rational Vaccine Design in the Time of COVID-19, Cell Host Microbe, 27, 695, 10.1016/j.chom.2020.04.022 · DOI
- Cao, 2020, Potent neutralizing antibodies against SARS-CoV-2 identified by high-throughput single-cell sequencing of convalescent patients’ B cells, Cell., 10.1016/j.cell.2020.05.025 · DOI · Paper page
- Corti, 2011, A neutralizing antibody selected from plasma cells that binds to group 1 and group 2 influenza A hemagglutinins, Science, 333, 850, 10.1126/science.1205669 · DOI · Paper page
- Davis, 2019, Longitudinal Analysis of the Human B Cell Response to Ebola Virus Infection, Cell, 177, 1566, 10.1016/j.cell.2019.04.036 · DOI
- Dong, 2020, An interactive web-based dashboard to track COVID-19 in real time, Lancet Infect. Dis., 20, 533, 10.1016/S1473-3099(20)30120-1 · DOI · Paper page
- Duan, 2020, Effectiveness of convalescent plasma therapy in severe COVID-19 patients, Proc. Natl. Acad. Sci. USA, 117, 9490, 10.1073/pnas.2004168117 · DOI
- Edler, 2019, raxmlGUI 2.0 beta: a graphical interface and toolkit for phylogenetic analyses using RAxML, bioRxiv
- Ehrhardt, 2019, Polyclonal and convergent antibody response to Ebola virus vaccine rVSV-ZEBOV, Nat. Med., 25, 1589, 10.1038/s41591-019-0602-4 · DOI
- Eisenberg, 1984, Analysis of membrane and surface protein sequences with the hydrophobic moment plot, J. Mol. Biol., 179, 125, 10.1016/0022-2836(84)90309-7 · DOI
- Fauci, 2015, PUBLIC HEALTH. Toward an HIV vaccine: A scientific journey, Science, 349, 386, 10.1126/science.aac6300 · DOI
- Flyak, 2016, Cross-Reactive and Potent Neutralizing Antibody Responses in Human Survivors of Natural Ebolavirus Infection, Cell, 164, 392, 10.1016/j.cell.2015.12.022 · DOI
- Grifoni, 2020, Targets of T cell responses to SARS-CoV-2 coronavirus in humans with COVID-19 disease and unexposed individuals, Cell, 181, 1489, 10.1016/j.cell.2020.05.015 · DOI · Paper page
- Hoffmann, 2020, SARS-CoV-2 Cell Entry Depends on ACE2 and TMPRSS2 and Is Blocked by a Clinically Proven Protease Inhibitor, Cell, 181, 271, 10.1016/j.cell.2020.02.052 · DOI · Paper page
- Huang, 2016, Identification of a CD4-Binding-Site Antibody to HIV that Evolved Near-Pan Neutralization Breadth, Immunity, 45, 1108, 10.1016/j.immuni.2016.10.027 · DOI
- Huang, 2016, Engineered Bispecific Antibodies with Exquisite HIV-1-Neutralizing Activity, Cell, 165, 1621, 10.1016/j.cell.2016.05.024 · DOI
- Huang, 2020, Clinical features of patients infected with 2019 novel coronavirus in Wuhan, China, Lancet, 395, 497, 10.1016/S0140-6736(20)30183-5 · DOI · Paper page
- Joyce, 2016, Vaccine-Induced Antibodies that Neutralize Group 1 and Group 2 Influenza A Viruses, Cell, 166, 609, 10.1016/j.cell.2016.06.043 · DOI · Paper page
- Kallewaard, 2016, Structure and Function Analysis of an Antibody Recognizing All Influenza A Subtypes, Cell, 166, 596, 10.1016/j.cell.2016.05.073 · DOI
- Klein, 2013, Antibodies in HIV-1 vaccine development and therapy, Science, 341, 1199, 10.1126/science.1241144 · DOI
- Koch, 2020, Safety and immunogenicity of a modified vaccinia virus Ankara vector vaccine candidate for Middle East respiratory syndrome: an open-label, phase 1 trial, The Lancet, 20, 827
- Koff, 2013, Accelerating next-generation vaccine development for global disease prevention, Science, 340, 1232910, 10.1126/science.1232910 · DOI · Paper page
- Kowarz, 2015, Optimized Sleeping Beauty transposons rapidly generate stable transgenic cell lines, Biotechnol. J., 10, 647, 10.1002/biot.201400821 · DOI
- Kreer, 2020, openPrimeR for multiplex amplification of highly diverse templates, J. Immunol. Methods, 480, 112752, 10.1016/j.jim.2020.112752 · DOI
- Kreer, 2020, Exploiting B Cell Receptor Analyses to Inform on HIV-1 Vaccination Strategies, Vaccines (Basel), 8, 13, 10.3390/vaccines8010013 · DOI
- Kwakkenbos, 2010, Generation of stable monoclonal antibody-producing B cell receptor-positive human memory B cells by genetic programming, Nat. Med., 16, 123, 10.1038/nm.2071 · DOI
- Li, 2020, Potent neutralization of SARS-CoV-2 in vitro and in an animal model by a human monoclonal antibody, bioRxiv
- Liu, 2020, Neutralizing Antibodies Isolated by a site-directed Screening have Potent Protection on SARS-CoV-2 Infection, bioRxiv
- Mascola, 2010, The role of antibodies in HIV vaccines, Annu. Rev. Immunol., 28, 413, 10.1146/annurev-immunol-030409-101256 · DOI
- Ni, 2020, Detection of SARS-CoV-2-Specific Humoral and Cellular Immunity in COVID-19 Convalescent Individuals, Immunity, 52, 971, 10.1016/j.immuni.2020.04.023 · DOI
- Pinto, 2020, Cross-neutralization of SARS-CoV-2 by a human monoclonal SARS-CoV antibody, Nature., 10.1038/s41586-020-2349-y · DOI · Paper page
- Rogers, 2020, Isolation of potent SARS-CoV-2 neutralizing antibodies and protection from disease in a small animal model, Science, 10.1126/science.abc7520 · DOI · Paper page
- Sanders, 2020, Pharmacologic Treatments for Coronavirus Disease 2019 (COVID-19): A Review, JAMA., 10.1001/jama.2020.6019 · DOI
- Saphire, 2018, Systematic Analysis of Monoclonal Antibodies against Ebola Virus GP Defines Features that Contribute to Protection, Cell, 174, 938, 10.1016/j.cell.2018.07.033 · DOI · Paper page
- Scheid, 2011, Sequence and structural convergence of broad and potent HIV antibodies that mimic CD4 binding, Science, 333, 1633, 10.1126/science.1207227 · DOI
- Schommers, 2020, Restriction of HIV-1 Escape by a Highly Broad and Potent Neutralizing Antibody, Cell, 180, 471, 10.1016/j.cell.2020.01.010 · DOI
- Sempowski, 2020, Pandemic Preparedness: Developing Vaccines and Therapeutic Antibodies For COVID-19, Cell, 181, 1458, 10.1016/j.cell.2020.05.041 · DOI
- Shi, 2020, A human neutralizing antibody targets the receptor binding site of SARS-CoV-2, Nature., 10.1038/s41586-020-2381-y · DOI · Paper page
- Sievers, 2011, Fast, scalable generation of high-quality protein multiple sequence alignments using Clustal Omega, Mol. Syst. Biol., 7, 539, 10.1038/msb.2011.75 · DOI
- Stadlbauer, 2020, SARS-CoV-2 Seroconversion in Humans: A Detailed Protocol for a Serological Assay, Antigen Production, and Test Setup, Curr. Protoc. Microbiol., 57, e100, 10.1002/cpmc.100 · DOI
- Stamatakis, 2014, RAxML version 8: a tool for phylogenetic analysis and post-analysis of large phylogenies, Bioinformatics, 30, 1312, 10.1093/bioinformatics/btu033 · DOI · Paper page
- Tiller, 2008, Efficient generation of monoclonal antibodies from single human B cells by single cell RT-PCR and expression vector cloning, J. Immunol. Methods, 329, 112, 10.1016/j.jim.2007.09.017 · DOI
- Vander Heiden, 2014, pRESTO: a toolkit for processing high-throughput sequencing raw reads of lymphocyte receptor repertoires, Bioinformatics, 30, 1930, 10.1093/bioinformatics/btu138 · DOI
- von Boehmer, 2016, Sequencing and cloning of antigen-specific antibodies from mouse memory B cells, Nat. Protoc., 11, 1908, 10.1038/nprot.2016.102 · DOI
- Walker, 2018, Passive immunotherapy of viral infections: ‘super-antibodies’ enter the fray, Nat. Rev. Immunol., 18, 297, 10.1038/nri.2017.148 · DOI
- Walker, 2009, Broad and potent neutralizing antibodies from an African donor reveal a new HIV-1 vaccine target, Science, 326, 285, 10.1126/science.1178746 · DOI
- Walls, 2020, Structure, Function, and Antigenicity of the SARS-CoV-2 Spike Glycoprotein, Cell, 181, 281, 10.1016/j.cell.2020.02.058 · DOI · Paper page
- Wang, 2020, A human monoclonal antibody blocking SARS-CoV-2 infection, Nat. Commun., 11, 2251, 10.1038/s41467-020-16256-y · DOI
- Wec, 2020, Longitudinal dynamics of the human B cell response to the yellow fever 17D vaccine, Proc. Natl. Acad. Sci. USA, 117, 6675, 10.1073/pnas.1921388117 · DOI
- Wec, 2020, Broad neutralization of SARS-related viruses by human monoclonal antibodies, Science,, eabc7424
- Wrapp, 2020, Structural Basis for Potent Neutralization of Betacoronaviruses by Single-Domain Camelid Antibodies, Cell, 181, 1004, 10.1016/j.cell.2020.04.031 · DOI · Paper page
- Wu, 2010, Rational design of envelope identifies broadly neutralizing human monoclonal antibodies to HIV-1, Science, 329, 856, 10.1126/science.1187659 · DOI
- Wu, 2020, A noncompeting pair of human neutralizing antibodies block COVID-19 virus binding to its receptor ACE2, Science, 10.1126/science.abc2241 · DOI
- Ye, 2013, IgBLAST: an immunoglobulin variable domain sequence analysis tool, Nucleic Acids Res., 41, 10.1093/nar/gkt382 · DOI
- Yuan, 2020, Isolation of and Characterization of Neutralizing Antibodies to Covid-19 from a Large Human Naïve scFv Phage Display Library, bioRxiv
- Zeng, 2020, Blocking antibodies against SARS-CoV-2 RBD isolated from a phage display antibody library using a competitive biopanning strategy, bioRxiv
- Zhang, 2013, Germinal center B cells govern their own fate via antibody feedback, J. Exp. Med., 210, 457, 10.1084/jem.20120150 · DOI
- Zhou, 2020, A pneumonia outbreak associated with a new coronavirus of probable bat origin, Nature, 579, 270, 10.1038/s41586-020-2012-7 · DOI · Paper page
- Zolla-Pazner, 2019, Vaccine-induced V1V2-specific antibodies control and or protect against infection with HIV, SIV and SHIV, Curr. Opin. HIV AIDS, 14, 309, 10.1097/COH.0000000000000551 · DOI
- Zost, 2020, Potently neutralizing human antibodies that block SARS-CoV-2 receptor binding and protect animals, bioRxiv
Cited by
Sorted by citations
Evolution of antibody immunity to SARS-CoV-2
Gaebler, C., Wang, Z., Lorenzi, J. C. C., Muecksch, F., Finkin, S., Tokuyama, M., Cho, A., Jankovic, M., Schaefer-Babajew, D., Oliveira, T. Y., et al. (2021) · Nature · doi:10.1038/s41586-021-03207-w · Cited by 1,674
SARS-CoV-2 neutralizing antibody structures inform therapeutic strategies
Barnes, C. O., Jette, C. A., Abernathy, M. E., Dam, K.-M. A., Esswein, S. R., Gristick, H. B., Malyutin, A. G., Sharaf, N. G., Huey-Tubman, K. E., Lee, Y. E., et al. (2020) · Nature · doi:10.1038/s41586-020-2852-1 · Cited by 1,599
Escape from neutralizing antibodies by SARS-CoV-2 spike protein variants
Weisblum, Y., Schmidt, F., Zhang, F., DaSilva, J., Poston, D., Lorenzi, J. C., Muecksch, F., Rutkowska, M., Hoffmann, H.-H., Michailidis, E., et al. (2020) · eLife · doi:10.7554/elife.61312 · Cited by 1,308
Persistence of serum and saliva antibody responses to SARS-CoV-2 spike antigens in COVID-19 patients
Isho, B., Abe, K. T., Zuo, M., Jamal, A. J., Rathod, B., Wang, J. H., Li, Z., Chao, G., Rojas, O. L., Bang, Y. M., et al. (2020) · Science Immunology · doi:10.1126/sciimmunol.abe5511 · Cited by 822
Naturally enhanced neutralizing breadth against SARS-CoV-2 one year after infection
Wang, Z., Muecksch, F., Schaefer-Babajew, D., Finkin, S., Viant, C., Gaebler, C., Hoffmann, H. H., Barnes, C. O., Cipolla, M., Ramos, V., et al. (2021) · Nature · doi:10.1038/s41586-021-03696-9 · Cited by 721
Cerutti, G., Guo, Y., Zhou, T., Gorman, J., Lee, M., Rapp, M., Reddem, E. R., Yu, J., Bahna, F., Bimela, J., et al. (2021) · Cell Host & Microbe · doi:10.1016/j.chom.2021.03.005 · Cited by 519
Enhanced SARS-CoV-2 neutralization by dimeric IgA
Wang, Z., Lorenzi, J. C. C., Muecksch, F., Finkin, S., Viant, C., Gaebler, C., Cipolla, M., Hoffmann, H.-H., Oliveira, T. Y., Oren, D. A., et al. (2021) · Science Translational Medicine · doi:10.1126/scitranslmed.abf1555 · Cited by 475
Mapping mutations to the SARS-CoV-2 RBD that escape binding by different classes of antibodies
Greaney, A. J., Starr, T. N., Barnes, C. O., Weisblum, Y., Schmidt, F., Caskey, M., Gaebler, C., Cho, A., Agudelo, M., Finkin, S., et al. (2021) · Nature Communications · doi:10.1038/s41467-021-24435-8 · Cited by 433
Gruell, H., Vanshylla, K., Tober-Lau, P., Hillus, D., Schommers, P., Lehmann, C., Kurth, F., Sander, L. E., & Klein, F. (2022) · Nature Medicine · doi:10.1038/s41591-021-01676-0 · Cited by 410
Self-citationStructural and functional ramifications of antigenic drift in recent SARS-CoV-2 variants
Yuan, M., Huang, D., Lee, C.-C. D., Wu, N. C., Jackson, A. M., Zhu, X., Liu, H., Peng, L., van Gils, M. J., Sanders, R. W., et al. (2021) · doi:10.1101/2021.02.16.430500 · Cited by 364
Kreye, J., Reincke, S. M., Kornau, H.-C., Sánchez-Sendin, E., Corman, V. M., Liu, H., Yuan, M., Wu, N. C., Zhu, X., Lee, C.-C. D., et al. (2020) · Cell · doi:10.1016/j.cell.2020.09.049 · Cited by 347
Maturation and persistence of the anti-SARS-CoV-2 memory B cell response
Sokal, A., Chappert, P., Barba-Spaeth, G., Roeser, A., Fourati, S., Azzaoui, I., Vandenberghe, A., Fernandez, I., Meola, A., Bouvier-Alias, M., et al. (2021) · Cell · doi:10.1016/j.cell.2021.01.050 · Cited by 340
SARS-CoV-2 501Y.V2 escapes neutralization by South African COVID-19 donor plasma
Wibmer, C. K., Ayres, F., Hermanus, T., Madzivhandila, M., Kgagudi, P., Oosthuysen, B., Lambson, B. E., de Oliveira, T., Vermeulen, M., van der Berg, K., et al. (2021) · doi:10.1101/2021.01.18.427166
Genetic and structural basis for SARS-CoV-2 variant neutralization by a two-antibody cocktail
Dong, J., Zost, S. J., Greaney, A. J., Starr, T. N., Dingens, A. S., Chen, E. C., Chen, R. E., Case, J. B., Sutton, R. E., Gilchuk, P., et al. (2021) · Nature Microbiology · doi:10.1038/s41564-021-00972-2 · Cited by 285
Kinetics and correlates of the neutralizing antibody response to SARS-CoV-2 infection in humans
Vanshylla, K., Di Cristanziano, V., Kleipass, F., Dewald, F., Schommers, P., Gieselmann, L., Gruell, H., Schlotz, M., Ercanoglu, M. S., Stumpf, R., et al. (2021) · Cell Host & Microbe · doi:10.1016/j.chom.2021.04.015 · Cited by 153
Self-citationSilva-Cayetano, A., Foster, W. S., Innocentin, S., Belij-Rammerstorfer, S., Spencer, A. J., Burton, O. T., Fra-Bidó, S., Le Lee, J., Thakur, N., Conceicao, C., et al. (2021) · Med · doi:10.1016/j.medj.2020.12.006 · Cited by 84
Sequence signatures of two public antibody clonotypes that bind SARS-CoV-2 receptor binding domain
Tan, T. J. C., Yuan, M., Kuzelka, K., Padron, G. C., Beal, J. R., Chen, X., Wang, Y., Rivera-Cardona, J., Zhu, X., Stadtmueller, B. M., et al. (2021) · Nature Communications · doi:10.1038/s41467-021-24123-7 · Cited by 75
A public vaccine-induced human antibody protects against SARS-CoV-2 and emerging variants
Schmitz, A. J., Turner, J. S., Liu, Z., Aziati, I. D., Chen, R. E., Joshi, A., Bricker, T. L., Darling, T. L., Adelsberg, D. C., Alsoussi, W. B., et al. (2021) · doi:10.1101/2021.03.24.436864 · Cited by 72
Genetic and structural basis for recognition of SARS-CoV-2 spike protein by a two-antibody cocktail
Dong, J., Zost, S. J., Greaney, A. J., Starr, T. N., Dingens, A. S., Chen, E. C., Chen, R. E., Case, J. B., Sutton, R. E., Gilchuk, P., et al. (2021) · doi:10.1101/2021.01.27.428529 · Cited by 55
Muecksch, F., Weisblum, Y., Barnes, C. O., Schmidt, F., Schaefer-Babajew, D., Lorenzi, J. C. C., Flyak, A. I., DeLaitsch, A. T., Huey-Tubman, K. E., Hou, S., et al. (2021) · doi:10.1101/2021.03.07.434227 · Cited by 39
Anti- SARS-CoV-2 Receptor Binding Domain Antibody Evolution after mRNA Vaccination
Cho, A., Muecksch, F., Schaefer-Babajew, D., Wang, Z., Finkin, S., Gaebler, C., Ramos, V., Cipolla, M., Mendoza, P., Agudelo, M., et al. (2021) · doi:10.1101/2021.07.29.454333 · Cited by 275
Germinal center responses to SARS-CoV-2 mRNA vaccines in healthy and immunocompromised individuals
Lederer, K., Parvathaneni, K., Painter, M. M., Bettini, E., Agarwal, D., Lundgreen, K. A., Weirick, M., Goel, R. R., Xu, X., Drapeau, E. M., et al. (2021) · doi:10.1101/2021.09.16.21263686 · Cited by 179
Zhou, C., Sun, M., Huang, X., Liu, P., Ouyang, Z., Wu, M., Yuan, L., Chen, J., Shu, W., Cao, T., et al. (2025) · hLife · doi:10.1016/j.hlife.2025.04.008 · Cited by 5
Metadata
- Authors
- Kreer, C., Zehner, M., Weber, T., Ercanoglu, M. S., Gieselmann, L., Rohde, C., Halwe, S., Korenkov, M., Schommers, P., Vanshylla, K., Di Cristanziano, V., Janicki, H., Brinker, R., Ashurov, A., Krähling, V., Kupke, A., Cohen-Dvashi, H., Koch, M., Eckert, J. M., Lederer, S., Pfeifer, N., Wolf, T., Vehreschild, M. J. G. T., Wendtner, C., Diskin, R., Gruell, H., Becker, S., & Klein, F.
- Venue
- Cell
- Publisher
- Elsevier BV
- Published
- 2020-08
- Volume
- 182
- Issue
- 4
- Pages
- 843-854.e12
- ISSN
- 0092-8674
- PMC
- PMC7355337
- Cited by
- 309
- References
- 13
- Language
- en
- Update notices
- erratum (2020-09-17)
- Licence
- Funders
- Bundesministerium für Bildung und Forschung
- Deutsches Zentrum für Infektionsforschung
- Deutsche Forschungsgemeinschaft
- European Research Council
About these checks
Registry, retraction, Cites and statistics results are computed, not judged, with one exception: a printed reference that no index lists is read once by a model before it counts as a citation error. Claims are extracted by a model and kept only when their quote appears verbatim in the text; each cited source is then checked, with a model’s help, for whether it says what the claim relies on. Those verdicts can be wrong — read the claim’s quote and the cited source before relying on one.
Statistics and arithmetic are recomputed, not judged.
Confidence bands are shown only for fields calibrated on our annotated test set. None is calibrated yet, so no band is shown.
What counts as a claim ›How we measure confidence ›How we check this ›
Are you an author, or do you see a problem with this page? Request a review
