

The DOI matches its Crossref record; 59 of the 59 references it cites were found in a registry or an index; none of the 42 sources its claims cite is checked for support yet.
Roux-en-Y Gastric Bypass and Vertical Banded Gastroplasty Induce Long-Term Changes on the Human Gut Microbiome Contributing to Fat Mass Regulation
Open accessAbstract
Bariatric surgery is currently the most effective procedure for the treatment of obesity. Given the role of the gut microbiota in regulating host metabolism and adiposity, we investigated the long-term effects of bariatric surgery on the microbiome of patients randomized to Roux-en-Y gastric bypass or vertical banded gastroplasty and matched for weight and fat mass loss. The two surgical procedures induced similar and durable changes on the gut microbiome that were not dependent on body mass index and resulted in altered levels of fecal and circulating metabolites compared with obese controls. By colonizing germ-free mice with stools from the patients, we demonstrated that the surgically altered microbiota promoted reduced fat deposition in recipient mice. These mice also had a lower respiratory quotient, indicating decreased utilization of carbohydrates as fuel. Our results suggest that the gut microbiota may play a direct role in the reduction of adiposity observed after bariatric surgery.
Overview
AI snapshot
Written from the paper’s full text.
TL;DR
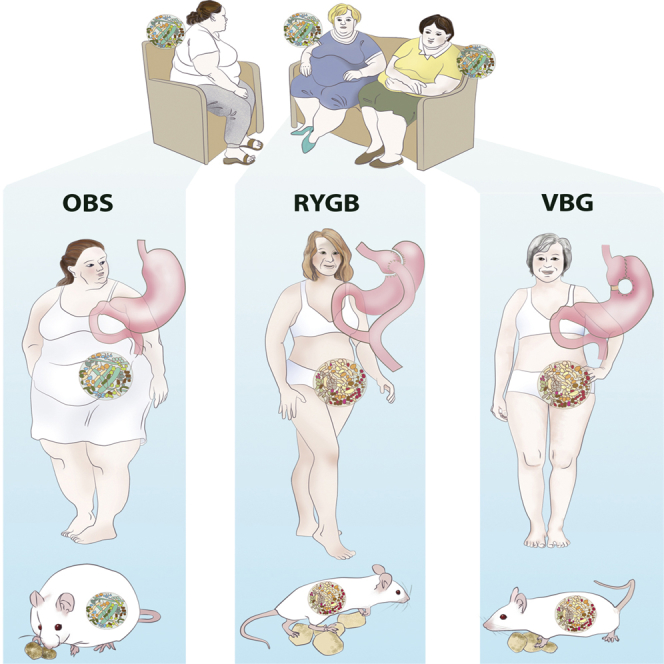
Bariatric surgery in women randomized to Roux-en-Y gastric bypass (RYGB) or vertical banded gastroplasty (VBG) produced similar, durable gut microbiome changes about 9 years later that were not explained by BMI. Transplanting these surgically altered microbiotas into germ-free mice reduced fat deposition, suggesting the microbiome contributes directly to post-surgery adiposity reduction.
Key findings
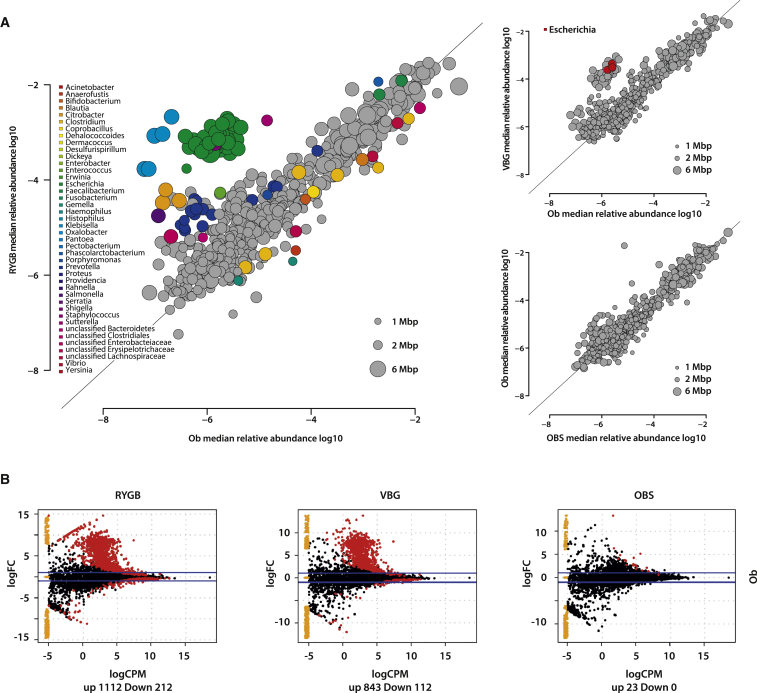
- At 9.4 years after randomization, RYGB and VBG patients showed similar microbiome shifts; RYGB versus obese controls differed significantly, with 29 microbial genera differing in abundance, while VBG versus controls and RYGB versus VBG differences were not significant after multiple-testing correction.
- Metagenomic functional content differed: 928 KOs were enriched and 60 depleted in RYGB versus OBS, and 682 KOs were enriched and 33 depleted in VBG versus OBS; only 17 KOs differed between RYGB and VBG, all enriched in VBG.
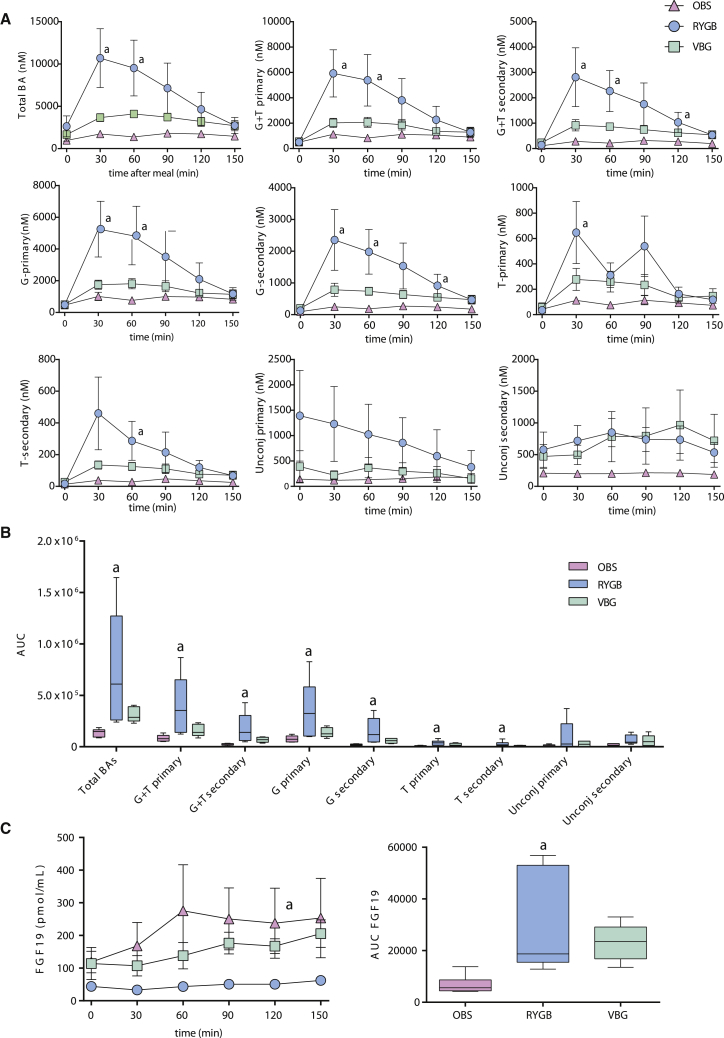
- Fecal short-chain fatty acid/branched-chain fatty acid ratio decreased after surgery and was significant for RYGB; postprandial bile acid response was pronounced in RYGB, with increased total and conjugated bile acids and increased FGF19 response versus OBS.
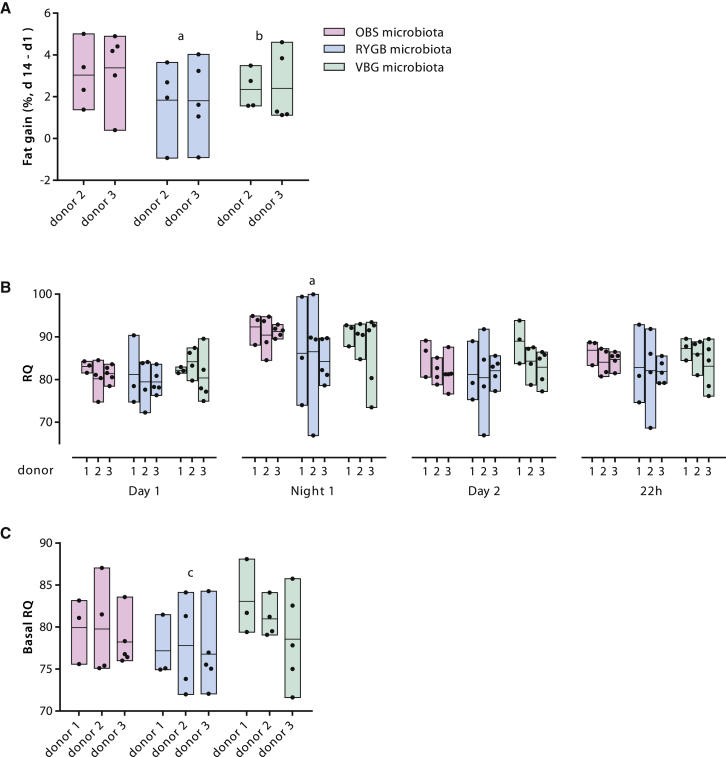
- Germ-free mice colonized with RYGB or VBG microbiota for 2 weeks accumulated 43% and 26% less body fat, respectively, than mice colonized with OBS microbiota; RYGB-colonized mice also had a lower respiratory quotient.
Methods
- Cross-sectional human study of fecal samples from 14 women 9.4 years after randomization to RYGB (n = 7) or VBG (n = 7), matched for pre- and post-operative weight, BMI, and body composition, plus non-operated severely obese women (OBS, n = 7) and BMI-matched post-surgical controls (Ob, n = 9).
- Shotgun metagenomic sequencing on Illumina HiSeq 2000; reads aligned to 2,382 reference genomes and the MetaHIT gene catalog, with KEGG ortholog/pathway analysis and multiple-testing correction.
- Fecal SCFAs/BCFAs measured by GC-MS; plasma TMAO, choline, betaine, and bile acids measured by UPLC-MS/MS; fecal microbiota from three RYGB, three VBG, and three OBS patients transplanted into germ-free female mice for 2 weeks, with body composition and indirect calorimetry.
Limitations
- The paper states that the small sample size may explain the lack of distinct microbiota profiles between RYGB and VBG, and that bile acid gene findings need validation in larger cohorts and at shorter time points after surgery.
- The paper states that future studies of microbiome from patients achieving different levels of weight and fat loss are required to validate the findings.
- Evident from the text: the human cohort was small, all female, and diabetes-free, and the human microbiome–adiposity link is supported by mouse transplantation rather than direct human causality.
Model-written summary. Check it against the paper before relying on it.
Integrity signals
Registry
Cites
Statistics
Figures
Verification
Claims the paper makes
58 Own result · 21 Not checked yet · 17 Own interpretation · 8 Own method · 1 Sources not found · 1 No basis given
A result the paper reports from its own data — it cites no other source for it, so there is none to check. The quote shows it is in the paper.
In the paper
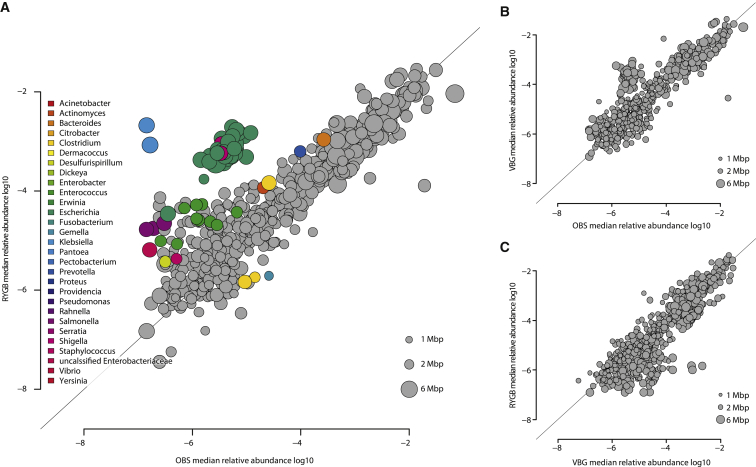
“We observed significant differences in microbiota composition for RYGB versus OBS samples, but not for VBG versus OBS or RYGB versus VBG (Figure 1; Table S3).”
§ Roux-en-Y Gastric Bypass and Vertical Banded Gastroplasty Induce Long-Term Changes on the Human Gut Microbiome Contributing to Fat Mass Regulation > Results and Discussion > Bariatric Surgery has Long-Term Effects on Gut Microbiota Composition
plain- Asserted: passes — The authors put it forward as true.
- Checkable: passes — It can be checked against evidence.
- Load-bearing: unclear — It is unclear whether the paper’s conclusions depend on it.
- Based: passes — The paper gives a reason why it holds.
A result the paper reports from its own data — it cites no other source for it, so there is none to check. The quote shows it is in the paper.
In the paper
“In addition, the reporter pathways for nitrogen metabolism, fatty acid metabolism, and two-component systems were enriched both in RYGB versus OBS and VBG versus OBS microbiomes (Tables 1 and S4).”
§ Roux-en-Y Gastric Bypass and Vertical Banded Gastroplasty Induce Long-Term Changes on the Human Gut Microbiome Contributing to Fat Mass Regulation > Results and Discussion > Bariatric Surgery Has Long-Term Effects on the Genetic Content of the Gut Microbiota
plaincorrelational- Asserted: passes — The authors put it forward as true.
- Checkable: passes — It can be checked against evidence.
- Load-bearing: unclear — It is unclear whether the paper’s conclusions depend on it.
- Based: passes — The paper gives a reason why it holds.
A result the paper reports from its own data — it cites no other source for it, so there is none to check. The quote shows it is in the paper.
In the paper
“The reporter pathways for phosphotransferase systems and fluorobenzoate degradation were enriched in RYGB versus OBS microbiomes, and the reporter pathways for flagellar assembly, sulfur relay system, glutathione metabolism, glyoxylate and dicarboxylate metabolism, ABC transporters (in particular for lysine/arginine/ornithine, histidine, and putrescine), and phenylalanine metabolism were enriched”
§ Roux-en-Y Gastric Bypass and Vertical Banded Gastroplasty Induce Long-Term Changes on the Human Gut Microbiome Contributing to Fat Mass Regulation > Results and Discussion > Bariatric Surgery Has Long-Term Effects on the Genetic Content of the Gut Microbiota
plaincorrelational- Asserted: passes — The authors put it forward as true.
- Checkable: passes — It can be checked against evidence.
- Load-bearing: unclear — It is unclear whether the paper’s conclusions depend on it.
- Based: passes — The paper gives a reason why it holds.
A result the paper reports from its own data — it cites no other source for it, so there is none to check. The quote shows it is in the paper.
In the paper
“We observed significant differences in microbiota composition for RYGB versus OBS samples, but not for VBG versus OBS or RYGB versus VBG (Figure 1; Table S3).”
§ Roux-en-Y Gastric Bypass and Vertical Banded Gastroplasty Induce Long-Term Changes on the Human Gut Microbiome Contributing to Fat Mass Regulation > Results and Discussion > Bariatric Surgery has Long-Term Effects on Gut Microbiota Composition
plaincorrelational- Asserted: passes — The authors put it forward as true.
- Checkable: passes — It can be checked against evidence.
- Load-bearing: passes — The paper’s conclusions depend on it.
- Based: passes — The paper gives a reason why it holds.
A result the paper reports from its own data — it cites no other source for it, so there is none to check. The quote shows it is in the paper.
In the paper
“We found that the two-component systems responding to nitrogen availability (nifA), phosphoglycerate transport (pgtCAP), and short-chain fatty acid (SCFA) metabolism (acetoacetate, atoCE) were specifically enriched in RYGB compared to OBS, while salt stress response and twitching motility were specifically enriched in VBG compared to OBS (Table S4).”
§ Roux-en-Y Gastric Bypass and Vertical Banded Gastroplasty Induce Long-Term Changes on the Human Gut Microbiome Contributing to Fat Mass Regulation > Results and Discussion > Bariatric Surgery Has Long-Term Effects on the Genetic Content of the Gut Microbiota
plaincorrelational- Asserted: passes — The authors put it forward as true.
- Checkable: passes — It can be checked against evidence.
- Load-bearing: unclear — It is unclear whether the paper’s conclusions depend on it.
- Based: passes — The paper gives a reason why it holds.
A result the paper reports from its own data — it cites no other source for it, so there is none to check. The quote shows it is in the paper.
In the paper
“However, the RYGB and VBG patients in our study were not under inflammatory stress as determined by plasma CRP levels (Table S1).”
§ Roux-en-Y Gastric Bypass and Vertical Banded Gastroplasty Induce Long-Term Changes on the Human Gut Microbiome Contributing to Fat Mass Regulation > Results and Discussion > Bariatric Surgery has Long-Term Effects on Gut Microbiota Composition
plain- Asserted: passes — The authors put it forward as true.
- Checkable: passes — It can be checked against evidence.
- Load-bearing: unclear — It is unclear whether the paper’s conclusions depend on it.
- Based: passes — The paper gives a reason why it holds.
A result the paper reports from its own data — it cites no other source for it, so there is none to check. The quote shows it is in the paper.
In the paper
“E. coli tended to increase, while Eubacterium rectale and Roseburia intestinalis tended to decrease in VBG compared to OBS (Table S3).”
§ Roux-en-Y Gastric Bypass and Vertical Banded Gastroplasty Induce Long-Term Changes on the Human Gut Microbiome Contributing to Fat Mass Regulation > Results and Discussion > Bariatric Surgery has Long-Term Effects on Gut Microbiota Composition
hedgedcorrelational- Asserted: passes — The authors put it forward as true.
- Checkable: passes — It can be checked against evidence.
- Load-bearing: unclear — It is unclear whether the paper’s conclusions depend on it.
- Based: passes — The paper gives a reason why it holds.
A result the paper reports from its own data — it cites no other source for it, so there is none to check. The quote shows it is in the paper.
In the paper
“The abundance of species belonging to 29 microbial genera differed significantly between RYGB and OBS samples (Figure 1A; Table S3); in particular, the levels of several species in the Gammaproteobacteria class were higher while the levels of three species in the Firmicutes phylum (Clostridium difficile, Clostridium hiranonis, and Gemella sanguinis) were lower in RYGB versus OBS samples (Table S3”
§ Roux-en-Y Gastric Bypass and Vertical Banded Gastroplasty Induce Long-Term Changes on the Human Gut Microbiome Contributing to Fat Mass Regulation > Results and Discussion > Bariatric Surgery has Long-Term Effects on Gut Microbiota Composition
plaincorrelational- Asserted: passes — The authors put it forward as true.
- Checkable: passes — It can be checked against evidence.
- Load-bearing: unclear — It is unclear whether the paper’s conclusions depend on it.
- Based: passes — The paper gives a reason why it holds.
A result the paper reports from its own data — it cites no other source for it, so there is none to check. The quote shows it is in the paper.
In the paper
“The two surgical procedures induced similar and durable changes on the gut microbiome that were not dependent on body mass index and resulted in altered levels of fecal and circulating metabolites compared with obese controls.”
§ Roux-en-Y Gastric Bypass and Vertical Banded Gastroplasty Induce Long-Term Changes on the Human Gut Microbiome Contributing to Fat Mass Regulation > Abstract
plaindirect- Asserted: passes — The authors put it forward as true.
- Checkable: passes — It can be checked against evidence.
- Load-bearing: passes — The paper’s conclusions depend on it.
- Based: passes — The paper gives a reason why it holds.
- Rests on an assumption: There are no long-term investigations of the stability of gut microbiota changes after bariatric surgery or of the effects of different procedures on the human gut microbiota.
A result the paper reports from its own data — it cites no other source for it, so there is none to check. The quote shows it is in the paper.
In the paper
“The abundance of species belonging to 29 microbial genera differed significantly between RYGB and OBS samples (Figure 1A; Table S3); in particular, the levels of several species in the Gammaproteobacteria class were higher while the levels of three species in the Firmicutes phylum (Clostridium difficile, Clostridium hiranonis, and Gemella sanguinis) were lower in RYGB versus OBS samples (Table S3”
§ Roux-en-Y Gastric Bypass and Vertical Banded Gastroplasty Induce Long-Term Changes on the Human Gut Microbiome Contributing to Fat Mass Regulation > Results and Discussion > Bariatric Surgery has Long-Term Effects on Gut Microbiota Composition
plaincorrelational- Asserted: passes — The authors put it forward as true.
- Checkable: passes — It can be checked against evidence.
- Load-bearing: passes — The paper’s conclusions depend on it.
- Based: passes — The paper gives a reason why it holds.
- It may state two separate claims as one. 22
- Probably not a substantial claim. 18
A result the paper reports from its own data — it cites no other source for it, so there is none to check. The quote shows it is in the paper.
In the paper
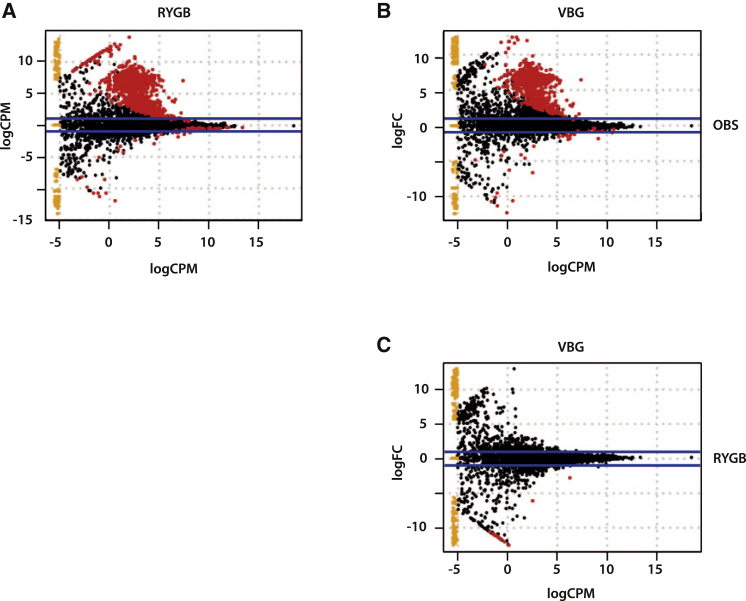
“We observed differences in the microbiome of operated and non-operated severely obese women (Figure 2; Table S4): 928 KOs were enriched and 60 were depleted in RYGB versus OBS samples (Figure 2A; Table S4), while 682 KOs were enriched and 33 were depleted in VBG versus OBS samples (Figure 2B; Table S4).”
§ Roux-en-Y Gastric Bypass and Vertical Banded Gastroplasty Induce Long-Term Changes on the Human Gut Microbiome Contributing to Fat Mass Regulation > Results and Discussion > Bariatric Surgery Has Long-Term Effects on the Genetic Content of the Gut Microbiota
plaincorrelational- Asserted: passes — The authors put it forward as true.
- Checkable: passes — It can be checked against evidence.
- Load-bearing: unclear — It is unclear whether the paper’s conclusions depend on it.
- Based: passes — The paper gives a reason why it holds.
It may state two separate claims as one.
A result the paper reports from its own data — it cites no other source for it, so there is none to check. The quote shows it is in the paper.
In the paper
“However, only 17 KOs were differentially abundant between RYGB and VBG samples, all enriched in VBG (Figure 2C; Table S4).”
§ Roux-en-Y Gastric Bypass and Vertical Banded Gastroplasty Induce Long-Term Changes on the Human Gut Microbiome Contributing to Fat Mass Regulation > Results and Discussion > Bariatric Surgery Has Long-Term Effects on the Genetic Content of the Gut Microbiota
plain- Asserted: passes — The authors put it forward as true.
- Checkable: passes — It can be checked against evidence.
- Load-bearing: unclear — It is unclear whether the paper’s conclusions depend on it.
- Based: passes — The paper gives a reason why it holds.
It may state two separate claims as one.
A result the paper reports from its own data — it cites no other source for it, so there is none to check. The quote shows it is in the paper.
In the paper
“Importantly, total fiber intake did not differ, while protein intake decreased for RYGB and VBG women (Table S1), indicating that the lower SCFA/BCFA ratio was not a consequence of dietary consumption.”
§ Roux-en-Y Gastric Bypass and Vertical Banded Gastroplasty Induce Long-Term Changes on the Human Gut Microbiome Contributing to Fat Mass Regulation > Results and Discussion > Bariatric Surgery Has Long-Term Effects on Microbial Fermentation
plain- Asserted: passes — The authors put it forward as true.
- Checkable: passes — It can be checked against evidence.
- Load-bearing: passes — The paper’s conclusions depend on it.
- Based: passes — The paper gives a reason why it holds.
It may state two separate claims as one.
A result the paper reports from its own data — it cites no other source for it, so there is none to check. The quote shows it is in the paper.
In the paper
“The SCFAs acetate, propionate, and butyrate were present in comparable proportions, but their concentrations tended to decrease in RYGB and VBG samples (Figures S2A–S2D), while the BCFAs isobutyrate and isovalerate, produced from the amino acids valine and leucine, respectively, either showed no change or a slight tendency to increase in RYGB and VBG samples (Figures S2E–S2G).”
§ Roux-en-Y Gastric Bypass and Vertical Banded Gastroplasty Induce Long-Term Changes on the Human Gut Microbiome Contributing to Fat Mass Regulation > Results and Discussion > Bariatric Surgery Has Long-Term Effects on Microbial Fermentation
hedgedcorrelational- Asserted: passes — The authors put it forward as true.
- Checkable: passes — It can be checked against evidence.
- Load-bearing: passes — The paper’s conclusions depend on it.
- Based: passes — The paper gives a reason why it holds.
It may state two separate claims as one.
A result the paper reports from its own data — it cites no other source for it, so there is none to check. The quote shows it is in the paper.
In the paper
“We found again an expansion in Proteobacteria and a reduction in several clostridial species after RYGB, and also a significant increase in the relative abundance of three E. coli species in VBG (Figure 4A; Table S5).”
§ Roux-en-Y Gastric Bypass and Vertical Banded Gastroplasty Induce Long-Term Changes on the Human Gut Microbiome Contributing to Fat Mass Regulation > Results and Discussion > Analysis of BMI as a Possible Confounding Factor
plaindirect- Asserted: passes — The authors put it forward as true.
- Checkable: passes — It can be checked against evidence.
- Load-bearing: unclear — It is unclear whether the paper’s conclusions depend on it.
- Based: passes — The paper gives a reason why it holds.
It may state two separate claims as one.
A result the paper reports from its own data — it cites no other source for it, so there is none to check. The quote shows it is in the paper.
In the paper
“body weight gain and food intake did not differ between the groups during the 2-week colonization period (Figures S5D and S5E)”
§ Roux-en-Y Gastric Bypass and Vertical Banded Gastroplasty Induce Long-Term Changes on the Human Gut Microbiome Contributing to Fat Mass Regulation > Results and Discussion > Transmission of the Human Adiposity Phenotype by Transplantation of the Gut Microbiota
plain- Asserted: passes — The authors put it forward as true.
- Checkable: passes — It can be checked against evidence.
- Load-bearing: passes — The paper’s conclusions depend on it.
- Based: passes — The paper gives a reason why it holds.
It may state two separate claims as one.
A result the paper reports from its own data — it cites no other source for it, so there is none to check. The quote shows it is in the paper.
In the paper
“However, the RYGB patients had significantly reduced fasting insulin compared with OBS, whereas there was a trend toward reduction in the VBG patients (Table S1).”
§ Roux-en-Y Gastric Bypass and Vertical Banded Gastroplasty Induce Long-Term Changes on the Human Gut Microbiome Contributing to Fat Mass Regulation > Experimental Procedures > Subjects and Sample Collection
plaincorrelationaln = 7- Asserted: passes — The authors put it forward as true.
- Checkable: passes — It can be checked against evidence.
- Load-bearing: unclear — It is unclear whether the paper’s conclusions depend on it.
- Based: passes — The paper gives a reason why it holds.
It may state two separate claims as one.
A result the paper reports from its own data — it cites no other source for it, so there is none to check. The quote shows it is in the paper.
In the paper
“However, we observed a pronounced postprandial bile acid response in RYGB compared to OBS patients, with a significant increase in total and glycine- and taurine-conjugated bile acids, but not unconjugated bile acids (Figures 3A and 3B).”
§ Roux-en-Y Gastric Bypass and Vertical Banded Gastroplasty Induce Long-Term Changes on the Human Gut Microbiome Contributing to Fat Mass Regulation > Results and Discussion > Bariatric Surgery Has Long-Term Effects on Bile Acid Metabolism
plaincorrelational- Asserted: passes — The authors put it forward as true.
- Checkable: passes — It can be checked against evidence.
- Load-bearing: passes — The paper’s conclusions depend on it.
- Based: passes — The paper gives a reason why it holds.
It may state two separate claims as one.
A result the paper reports from its own data — it cites no other source for it, so there is none to check. The quote shows it is in the paper.
In the paper
“Although O2 consumption, body weight gain, and food intake did not differ during the measurements (Figures S5F–S5I)”
§ Roux-en-Y Gastric Bypass and Vertical Banded Gastroplasty Induce Long-Term Changes on the Human Gut Microbiome Contributing to Fat Mass Regulation > Results and Discussion > Transmission of the Human Adiposity Phenotype by Transplantation of the Gut Microbiota
plain- Asserted: passes — The authors put it forward as true.
- Checkable: passes — It can be checked against evidence.
- Load-bearing: passes — The paper’s conclusions depend on it.
- Based: passes — The paper gives a reason why it holds.
It may state two separate claims as one.
None of the sources cited for this claim have been checked yet.
In the paper
“In addition, dietary weight loss interventions have been shown to increase gene richness of the microbiota and shift its composition toward that of lean individuals (Cotillard et al., 2013; Ley et al., 2006).”
§ Roux-en-Y Gastric Bypass and Vertical Banded Gastroplasty Induce Long-Term Changes on the Human Gut Microbiome Contributing to Fat Mass Regulation > Introduction
What the sources say
plaindirect- Asserted: passes — The authors put it forward as true.
- Checkable: passes — It can be checked against evidence.
- Load-bearing: fails — The paper’s conclusions may not depend on it.
- Based: passes — The paper gives a reason why it holds.
Probably not a substantial claim. The paper’s conclusions may not depend on it. It may state two separate claims as one.
None of the sources cited for this claim have been checked yet.
In the paper
“Recent work has also indicated that the gut microbiota may mediate some of the beneficial effects of bariatric surgery, and changes in the composition and diversity of the gut microbiota have been observed in the short term after RYGB in humans (Furet et al., 2010; Graessler et al., 2013; Kong et al., 2013; Zhang et al., 2009), as well as after vertical sleeve gastrectomy and RYGB in mice (Liou et”
§ Roux-en-Y Gastric Bypass and Vertical Banded Gastroplasty Induce Long-Term Changes on the Human Gut Microbiome Contributing to Fat Mass Regulation > Introduction
What the sources say
plaincorrelational- Asserted: passes — The authors put it forward as true.
- Checkable: passes — It can be checked against evidence.
- Load-bearing: passes — The paper’s conclusions depend on it.
- Based: passes — The paper gives a reason why it holds.
Probably not a substantial claim.
None of the sources cited for this claim have been checked yet.
In the paper
“Indeed, obesity has been associated with altered gut microbiota composition, reduced microbial diversity, and reduced gene richness (Le Chatelier et al., 2013; Ley et al., 2005; Turnbaugh et al., 2009).”
§ Roux-en-Y Gastric Bypass and Vertical Banded Gastroplasty Induce Long-Term Changes on the Human Gut Microbiome Contributing to Fat Mass Regulation > Introduction
What the sources say
plaincorrelational- Asserted: passes — The authors put it forward as true.
- Checkable: passes — It can be checked against evidence.
- Load-bearing: passes — The paper’s conclusions depend on it.
- Based: passes — The paper gives a reason why it holds.
Probably not a substantial claim. It may state two separate claims as one.
None of the sources cited for this claim have been checked yet.
In the paper
“Recent work has also indicated that the gut microbiota may mediate some of the beneficial effects of bariatric surgery, and changes in the composition and diversity of the gut microbiota have been observed in the short term after RYGB in humans (Furet et al., 2010; Graessler et al., 2013; Kong et al., 2013; Zhang et al., 2009), as well as after vertical sleeve gastrectomy and RYGB in mice (Liou et”
§ Roux-en-Y Gastric Bypass and Vertical Banded Gastroplasty Induce Long-Term Changes on the Human Gut Microbiome Contributing to Fat Mass Regulation > Introduction
What the sources say
plaincorrelational- Asserted: passes — The authors put it forward as true.
- Checkable: passes — It can be checked against evidence.
- Load-bearing: fails — The paper’s conclusions may not depend on it.
- Based: passes — The paper gives a reason why it holds.
Probably not a substantial claim. The paper’s conclusions may not depend on it.
None of the sources cited for this claim have been checked yet.
In the paper
“Moreover, our results are in agreement with previous findings showing an expansion of Proteobacteria shortly after RYGB, both in humans (Furet et al., 2010; Graessler et al., 2013; Kong et al., 2013; Zhang et al., 2009) and mice (Liou et al., 2013).”
§ Roux-en-Y Gastric Bypass and Vertical Banded Gastroplasty Induce Long-Term Changes on the Human Gut Microbiome Contributing to Fat Mass Regulation > Results and Discussion > Bariatric Surgery has Long-Term Effects on Gut Microbiota Composition
What the sources say
plaincorrelational- Asserted: passes — The authors put it forward as true.
- Checkable: passes — It can be checked against evidence.
- Load-bearing: fails — The paper’s conclusions may not depend on it.
- Based: passes — The paper gives a reason why it holds.
Probably not a substantial claim. The paper’s conclusions may not depend on it.
None of the sources cited for this claim have been checked yet.
In the paper
“There are a number of bariatric surgery procedures, of which Roux-en-Y gastric bypass (RYGB) is considered one of the most effective, promoting both weight reduction and improvement of metabolism (Sjöström et al., 2007; Werling et al., 2013a).”
§ Roux-en-Y Gastric Bypass and Vertical Banded Gastroplasty Induce Long-Term Changes on the Human Gut Microbiome Contributing to Fat Mass Regulation > Introduction
What the sources say
- Not checked yetcites Sjöström et al., 2007 source
- Not checked yetcites Werling et al., 2013a
plaindirect- Asserted: passes — The authors put it forward as true.
- Checkable: passes — It can be checked against evidence.
- Load-bearing: fails — The paper’s conclusions may not depend on it.
- Based: passes — The paper gives a reason why it holds.
Probably not a substantial claim. The paper’s conclusions may not depend on it. It may state two separate claims as one.
What the paper did — it cites no source for this, so there is none to check. The quote shows it is in the paper.
In the paper
“RYGB and VBG patients were matched for pre- and post-operative weight, BMI, and body composition, and had thus experienced similar weight and fat mass loss.”
§ Roux-en-Y Gastric Bypass and Vertical Banded Gastroplasty Induce Long-Term Changes on the Human Gut Microbiome Contributing to Fat Mass Regulation > Results and Discussion > Bariatric Surgery has Long-Term Effects on Gut Microbiota Composition
plaindirectn = 14- Asserted: passes — The authors put it forward as true.
- Checkable: passes — It can be checked against evidence.
- Load-bearing: passes — The paper’s conclusions depend on it.
- Based: passes — The paper gives a reason why it holds.
It may state two separate claims as one.
What the paper did — it cites no source for this, so there is none to check. The quote shows it is in the paper.
In the paper
“For microbiota transplantations, we selected stool samples from three RYGB, three VBG, and three OBS patients who did not use medications and did not receive cholecystectomy and used these samples to colonize GF Swiss Webster female mice in three independent experiments.”
§ Roux-en-Y Gastric Bypass and Vertical Banded Gastroplasty Induce Long-Term Changes on the Human Gut Microbiome Contributing to Fat Mass Regulation > Experimental Procedures > Mouse Experiments
plainn = 3- Asserted: passes — The authors put it forward as true.
- Checkable: passes — It can be checked against evidence.
- Load-bearing: passes — The paper’s conclusions depend on it.
- Based: passes — The paper gives a reason why it holds.
Probably not a substantial claim.
In the paper
“These observations are of interest because high TMAO levels linked to TMA oxidation by the human hepatic flavin monooxygenase FMO3 have been associated with cardiovascular diseases (CVDs) (Tang et al., 2013; Wang et al., 2011), while it is known that RYGB is associated with a lower CVD risk (Sjöström et al., 2012).”
§ Roux-en-Y Gastric Bypass and Vertical Banded Gastroplasty Induce Long-Term Changes on the Human Gut Microbiome Contributing to Fat Mass Regulation > Results and Discussion > Bariatric Surgery Has Long-Term Effects on the Genetic Content of the Gut Microbiota
What the sources say
- Not checked yetcites Sjöström et al., 2012 source
boostedcorrelational- Asserted: passes — The authors put it forward as true.
- Checkable: passes — It can be checked against evidence.
- Load-bearing: fails — The paper’s conclusions may not depend on it.
- Based: passes — The paper gives a reason why it holds.
Probably not a substantial claim. The paper’s conclusions may not depend on it.
A conclusion the paper draws from its own results — it cites no other source for it, so there is none to check. The quote shows it is in the paper.
In the paper
“Together with these observations, our results suggest that bariatric surgery produces a specific shift in the microbiota that persists for up to a decade after surgery and is different from shifts related to dietary interventions for weight loss.”
§ Roux-en-Y Gastric Bypass and Vertical Banded Gastroplasty Induce Long-Term Changes on the Human Gut Microbiome Contributing to Fat Mass Regulation > Results and Discussion > Analysis of BMI as a Possible Confounding Factor
hedgeddirect- Asserted: passes — The authors put it forward as true.
- Checkable: passes — It can be checked against evidence.
- Load-bearing: passes — The paper’s conclusions depend on it.
- Based: passes — The paper gives a reason why it holds.
It may state two separate claims as one.
What the paper did — it cites no source for this, so there is none to check. The quote shows it is in the paper.
In the paper
“All study participants were informed verbally and in writing and signed a consent form.”
§ Roux-en-Y Gastric Bypass and Vertical Banded Gastroplasty Induce Long-Term Changes on the Human Gut Microbiome Contributing to Fat Mass Regulation > Experimental Procedures > Subjects and Sample Collection
plainn = 21- Asserted: passes — The authors put it forward as true.
- Checkable: passes — It can be checked against evidence.
- Load-bearing: fails — The paper’s conclusions may not depend on it.
- Based: passes — The paper gives a reason why it holds.
Probably not a substantial claim. The paper’s conclusions may not depend on it. It may state two separate claims as one.
None of the sources cited for this claim have been checked yet.
In the paper
“Bile acids are cholesterol metabolites that facilitate the absorption of dietary fat and fat-soluble molecules and are now also recognized as regulators of energy metabolism through activation of the receptors TGR5 and FXR (Hylemon et al., 2009; Lefebvre et al., 2009).”
§ Roux-en-Y Gastric Bypass and Vertical Banded Gastroplasty Induce Long-Term Changes on the Human Gut Microbiome Contributing to Fat Mass Regulation > Results and Discussion > Bariatric Surgery Has Long-Term Effects on Bile Acid Metabolism
What the sources say
plaindirect- Asserted: passes — The authors put it forward as true.
- Checkable: passes — It can be checked against evidence.
- Load-bearing: fails — The paper’s conclusions may not depend on it.
- Based: passes — The paper gives a reason why it holds.
Probably not a substantial claim. The paper’s conclusions may not depend on it. It may state two separate claims as one.
None of the sources cited for this claim have been checked yet.
In the paper
“These observations are of interest because high TMAO levels linked to TMA oxidation by the human hepatic flavin monooxygenase FMO3 have been associated with cardiovascular diseases (CVDs) (Tang et al., 2013; Wang et al., 2011), while it is known that RYGB is associated with a lower CVD risk (Sjöström et al., 2012).”
§ Roux-en-Y Gastric Bypass and Vertical Banded Gastroplasty Induce Long-Term Changes on the Human Gut Microbiome Contributing to Fat Mass Regulation > Results and Discussion > Bariatric Surgery Has Long-Term Effects on the Genetic Content of the Gut Microbiota
What the sources say
plaincorrelational- Asserted: passes — The authors put it forward as true.
- Checkable: passes — It can be checked against evidence.
- Load-bearing: passes — The paper’s conclusions depend on it.
- Based: passes — The paper gives a reason why it holds.
Probably not a substantial claim.
A conclusion the paper draws from its own results — it cites no other source for it, so there is none to check. The quote shows it is in the paper.
In the paper
“The increased levels of TMAO in RYGB samples might be the consequence of a less anaerobic metabolism in the RYGB intestine, which is supported by the broad increase of facultative anaerobes in RYGB microbiomes, and could occur due to the shortening of the small bowel.”
§ Roux-en-Y Gastric Bypass and Vertical Banded Gastroplasty Induce Long-Term Changes on the Human Gut Microbiome Contributing to Fat Mass Regulation > Results and Discussion > Bariatric Surgery Has Long-Term Effects on the Genetic Content of the Gut Microbiota
hedgedconditional- Asserted: passes — The authors put it forward as true.
- Checkable: passes — It can be checked against evidence.
- Load-bearing: fails — The paper’s conclusions may not depend on it.
- Based: passes — The paper gives a reason why it holds.
Probably not a substantial claim. The paper’s conclusions may not depend on it.
A conclusion the paper draws from its own results — it cites no other source for it, so there is none to check. The quote shows it is in the paper.
In the paper
“thus indicating decreased utilization of carbohydrates and increased utilization of lipids as fuel in recipients of RYGB microbiota.”
§ Roux-en-Y Gastric Bypass and Vertical Banded Gastroplasty Induce Long-Term Changes on the Human Gut Microbiome Contributing to Fat Mass Regulation > Results and Discussion > Transmission of the Human Adiposity Phenotype by Transplantation of the Gut Microbiota
hedgeddirect- Asserted: passes — The authors put it forward as true.
- Checkable: passes — It can be checked against evidence.
- Load-bearing: passes — The paper’s conclusions depend on it.
- Based: passes — The paper gives a reason why it holds.
It may state two separate claims as one.
None of the sources cited for this claim have been checked yet.
In the paper
“The postprandial bile acid response is blunted in obesity and enhanced after RYGB, indicating that this response might be important for inducing satiety, reduced food intake, and lower body weight (Ahmad et al., 2013; Glicksman et al., 2010).”
§ Roux-en-Y Gastric Bypass and Vertical Banded Gastroplasty Induce Long-Term Changes on the Human Gut Microbiome Contributing to Fat Mass Regulation > Results and Discussion > Bariatric Surgery Has Long-Term Effects on Bile Acid Metabolism
What the sources say
plaindirect- Asserted: passes — The authors put it forward as true.
- Checkable: passes — It can be checked against evidence.
- Load-bearing: passes — The paper’s conclusions depend on it.
- Based: passes — The paper gives a reason why it holds.
It may state two separate claims as one.
What the paper did — it cites no source for this, so there is none to check. The quote shows it is in the paper.
In the paper
“To control for differences in BMI, we compared the gut microbiome of RYGB and VBG patients with that of non-operated women (Ob, n = 9) with BMI matched to the post-surgical BMI of the RYGB and VBG patients (BMI = 31.9 ± 2.7 [SD]) (Table S1 and S5).”
§ Roux-en-Y Gastric Bypass and Vertical Banded Gastroplasty Induce Long-Term Changes on the Human Gut Microbiome Contributing to Fat Mass Regulation > Results and Discussion > Analysis of BMI as a Possible Confounding Factor
plainn = 9- Asserted: passes — The authors put it forward as true.
- Checkable: passes — It can be checked against evidence.
- Load-bearing: passes — The paper’s conclusions depend on it.
- Based: passes — The paper gives a reason why it holds.
Probably not a substantial claim.
In the paper
“The reduced fat mass gain in GF mice transplanted with RYGB and VBG microbiota is in agreement with our results on the composition of the gut microbiome and with a short-term human study showing an inverse correlation between E. coli abundance and fat mass after RYGB (Furet et al., 2010).”
§ Roux-en-Y Gastric Bypass and Vertical Banded Gastroplasty Induce Long-Term Changes on the Human Gut Microbiome Contributing to Fat Mass Regulation > Results and Discussion > Transmission of the Human Adiposity Phenotype by Transplantation of the Gut Microbiota
What the sources say
- Not checked yetcites Furet et al., 2010 source
plaincorrelational- Asserted: passes — The authors put it forward as true.
- Checkable: passes — It can be checked against evidence.
- Load-bearing: passes — The paper’s conclusions depend on it.
- Based: passes — The paper gives a reason why it holds.
It may state two separate claims as one.
What the paper did — it cites no source for this, so there is none to check. The quote shows it is in the paper.
In the paper
“The 21 women in our study did no use antibiotics for at least 6 weeks before inclusion in the study.”
§ Roux-en-Y Gastric Bypass and Vertical Banded Gastroplasty Induce Long-Term Changes on the Human Gut Microbiome Contributing to Fat Mass Regulation > Experimental Procedures > Subjects and Sample Collection
plainn = 21- Asserted: passes — The authors put it forward as true.
- Checkable: passes — It can be checked against evidence.
- Load-bearing: passes — The paper’s conclusions depend on it.
- Based: passes — The paper gives a reason why it holds.
Probably not a substantial claim.
What the paper did — it cites no source for this, so there is none to check. The quote shows it is in the paper.
In the paper
“All animal experiments were approved by the Gothenburg Animal Ethics Committee.”
§ Roux-en-Y Gastric Bypass and Vertical Banded Gastroplasty Induce Long-Term Changes on the Human Gut Microbiome Contributing to Fat Mass Regulation > Experimental Procedures > Mouse Experiments
plain- Asserted: passes — The authors put it forward as true.
- Checkable: passes — It can be checked against evidence.
- Load-bearing: fails — The paper’s conclusions may not depend on it.
- Based: passes — The paper gives a reason why it holds.
Probably not a substantial claim. The paper’s conclusions may not depend on it.
In the paper
“Reduced RQ has been observed in humans after RYGB and associated to reduced glucose oxidation, increased lipid oxidation, and increased plasma levels of conjugated bile acids (Simonen et al., 2012).”
§ Roux-en-Y Gastric Bypass and Vertical Banded Gastroplasty Induce Long-Term Changes on the Human Gut Microbiome Contributing to Fat Mass Regulation > Results and Discussion > Transmission of the Human Adiposity Phenotype by Transplantation of the Gut Microbiota
What the sources say
- Not checked yetcites Simonen et al., 2012 source
plaincorrelational- Asserted: passes — The authors put it forward as true.
- Checkable: passes — It can be checked against evidence.
- Load-bearing: passes — The paper’s conclusions depend on it.
- Based: passes — The paper gives a reason why it holds.
It may state two separate claims as one.
In the paper
“All p values were corrected for multiple testing with the method from Benjamini and Hochberg (1995).”
§ Roux-en-Y Gastric Bypass and Vertical Banded Gastroplasty Induce Long-Term Changes on the Human Gut Microbiome Contributing to Fat Mass Regulation > Experimental Procedures > DNA Extraction and Metagenome Data Analysis
What the sources say
- Not checked yetcites Benjamini and Hochberg (1995) source
plain- Asserted: passes — The authors put it forward as true.
- Checkable: passes — It can be checked against evidence.
- Load-bearing: passes — The paper’s conclusions depend on it.
- Based: passes — The paper gives a reason why it holds.
Probably not a substantial claim.
What the paper did — it cites no source for this, so there is none to check. The quote shows it is in the paper.
In the paper
“The studies were performed in accordance with the Declaration of Helsinki and were approved by the Regional Ethical Review Board in Gothenburg, Sweden (no: 359-09 and 740-10).”
§ Roux-en-Y Gastric Bypass and Vertical Banded Gastroplasty Induce Long-Term Changes on the Human Gut Microbiome Contributing to Fat Mass Regulation > Experimental Procedures > Subjects and Sample Collection
plain- Asserted: passes — The authors put it forward as true.
- Checkable: passes — It can be checked against evidence.
- Load-bearing: fails — The paper’s conclusions may not depend on it.
- Based: passes — The paper gives a reason why it holds.
Probably not a substantial claim. The paper’s conclusions may not depend on it. It may state two separate claims as one.
A conclusion the paper draws from its own results — it cites no other source for it, so there is none to check. The quote shows it is in the paper.
In the paper
“The similar SCFA/BCFA ratio and the analysis of pathways enriched in RYGB and VBG compared to OBS subjects reveal some common effects of the two bariatric surgery procedures and indicate altered intestinal fermentation shifted toward reduced production of SCFAs and increased amino acid fermentation after bariatric surgery.”
§ Roux-en-Y Gastric Bypass and Vertical Banded Gastroplasty Induce Long-Term Changes on the Human Gut Microbiome Contributing to Fat Mass Regulation > Results and Discussion > Bariatric Surgery Has Long-Term Effects on Microbial Fermentation
hedgeddirect- Asserted: passes — The authors put it forward as true.
- Checkable: passes — It can be checked against evidence.
- Load-bearing: passes — The paper’s conclusions depend on it.
- Based: passes — The paper gives a reason why it holds.
It may state two separate claims as one.
What the paper did — it cites no source for this, so there is none to check. The quote shows it is in the paper.
In the paper
“None of the women included in our study had diabetes.”
§ Roux-en-Y Gastric Bypass and Vertical Banded Gastroplasty Induce Long-Term Changes on the Human Gut Microbiome Contributing to Fat Mass Regulation > Experimental Procedures > Subjects and Sample Collection
plain- Asserted: passes — The authors put it forward as true.
- Checkable: passes — It can be checked against evidence.
- Load-bearing: fails — The paper’s conclusions may not depend on it.
- Based: passes — The paper gives a reason why it holds.
Probably not a substantial claim. The paper’s conclusions may not depend on it.
The paper relies on this without support.
There are no long-term investigations of the stability of gut microbiota changes after bariatric surgery or of the effects of different procedures on the human gut microbiota.
“However, there are no long-term investigations of the stability of these changes or of the effects of different procedures on the human gut microbiota.”
The paper relies on this without support.
The causal link between alterations to the microbiota and the reduction in adiposity observed after bariatric surgery has not been previously analyzed in humans.
“Additionally, the causal link between the alterations to the microbiota and the reduction in adiposity observed after bariatric surgery has not been previously analyzed in humans.”
The paper relies on this without support.
Both RYGB and VBG are associated with reduced luminal exposure to gastric acidity.
“For example, increases in pH have been shown to promote the growth of E. coli in vitro (Duncan et al., 2009), and both RYGB and VBG are associated with reduced luminal exposure to gastric acidity.”
The paper relies on this without support.
The observed microbiome shifts are attributable to bariatric surgery rather than to unmeasured differences in diet or other lifestyle factors.
“Importantly, the changes in the microbiome were not dependent on BMI or degree of weight and fat mass loss, thus revealing shifts in the gut microbiota that were specific to bariatric surgery.”
Claims other papers make about this one
Each is checked against this paper’s own text: does it say what the citing paper says it does?
The cited source says what the claim attributes to it.
In the citing paper
“In addition, amelioration of obesity by bariatric or Roux-en-Y gastric bypass surgery results in a change in gut microbial composition (Gralka et al., 2015;Tremaroli et al., 2015;Zhang et al., 2009), even though this is not the case for weight gain in anorexia nervosa (Mack et al., 2016).”
From The Microbiota-Gut-Brain Axis (2019) · cites this paper as Tremaroli et al., 2015
In the citing paper
“This observation also holds true when the microbiota from obese or lean humans is transferred to germ-free mice (Ridaura et al., 2013; Tremaroli et al., 2015).”
From Understanding the Holobiont: How Microbial Metabolites Affect Human Health and Shape the Immune System (2017) · cites this paper as Tremaroli et al., 2015
In the citing paper
“reports of alterations in the gut microbiota of obese people4,13–15, which confer the obese or adiposity phenotypes when transferred to mice14,16”
From Diet–microbiota interactions as moderators of human metabolism (2016) · cites this paper as [16]
In the citing paper
“transplantation of the fecal microbiota from patients with obesity, steatosis or type 2 diabetes can partly reproduce the donor’s metabolic phenotype in mouse recipients [4–7].”
From Dietary lipids, gut microbiota and lipid metabolism (2019) · cites this paper as [6]
Citations
Cites
R: A Language and Environment for Statistical Computing
R Core Team (2000) · doi:10.32614/r.manuals · Cited by 355,893
Controlling the False Discovery Rate: A Practical and Powerful Approach to Multiple Testing
Benjamini, Y., & Hochberg, Y. (1995) · Journal of the Royal Statistical Society Series B: Statistical Methodology · doi:10.1111/j.2517-6161.1995.tb02031.x · Cited by 109,482
Fast gapped-read alignment with Bowtie 2
Langmead, B., & Salzberg, S. L. (2012) · Nature Methods · doi:10.1038/nmeth.1923 · Cited by 56,400
Ultrafast and memory-efficient alignment of short DNA sequences to the human genome.
Langmead, B., Trapnell, C., Pop, M., & Salzberg, S. L. (2009) · Genome Biology · doi:10.1186/gb-2009-10-3-r25 · Cited by 21,849
Search and clustering orders of magnitude faster than BLAST
Edgar, R. C. (2010) · Bioinformatics · doi:10.1093/bioinformatics/btq461 · Cited by 21,098
An obesity-associated gut microbiome with increased capacity for energy harvest
Turnbaugh, P. J., Ley, R. E., Mahowald, M. A., Magrini, V., Mardis, E. R., & Gordon, J. I. (2006) · Nature · doi:10.1038/nature05414 · Cited by 12,444
A human gut microbial gene catalogue established by metagenomic sequencing
MetaHIT Consortium, Qin, J., Li, R., Raes, J., Arumugam, M., Burgdorf, K. S., Manichanh, C., Nielsen, T., Pons, N., Levenez, F., et al. (2010) · Nature · doi:10.1038/nature08821 · Cited by 11,624
Human gut microbes associated with obesity
Ley, R. E., Turnbaugh, P. J., Klein, S., & Gordon, J. I. (2006) · Nature · doi:10.1038/4441022a · Cited by 8,785
A core gut microbiome in obese and lean twins
Turnbaugh, P. J., Hamady, M., Yatsunenko, T., Cantarel, B. L., Duncan, A., Ley, R. E., Sogin, M. L., Jones, W. J., Roe, B. A., Affourtit, J. P., et al. (2009) · Nature · doi:10.1038/nature07540 · Cited by 7,823
A metagenome-wide association study of gut microbiota in type 2 diabetes
Qin, J., Li, Y., Cai, Z., Li, S., Zhu, J., Zhang, F., Liang, S., Zhang, W., Guan, Y., Shen, D., et al. (2012) · Nature · doi:10.1038/nature11450 · Cited by 6,762
Cited by
Sorted by citations
Cryan, J. F., O'Riordan, K. J., Cowan, C. S. M., Sandhu, K. V., Bastiaanssen, T. F. S., Boehme, M., Codagnone, M. G., Cussotto, S., Fulling, C., Golubeva, A. V., et al. (2019) · Physiological Reviews · doi:10.1152/physrev.00018.2018 · Cited by 5,286
The Human Intestinal Microbiome in Health and Disease
Lynch, S. V., & Pedersen, O. (2016) · New England Journal of Medicine · doi:10.1056/nejmra1600266 · Cited by 3,637
Intestinal Crosstalk between Bile Acids and Microbiota and Its Impact on Host Metabolism
Wahlstrom, A. M., Sayin, S. I., Marschall, H., & Bäckhed, F. (2016) · Cell Metabolism · doi:10.1016/j.cmet.2016.05.005 · Cited by 2,969
Self-citationDiet–microbiota interactions as moderators of human metabolism
Sonnenburg, J. L., & Bäckhed, F. (2016) · Nature · doi:10.1038/nature18846 · Cited by 2,257
Self-citationGut microbiota in cardiovascular health and disease
Tang, W. H. W., Kitai, T., & Hazen, S. L. (2017) · Circulation Research · doi:10.1161/circresaha.117.309715 · Cited by 1,670
Wu, H., Esteve, E., Tremaroli, V., Khan, M. T., Caesar, R., Mannerås-Holm, L., Ståhlman, M., Olsson, L. M., Serino, M., Planas-Fèlix, M., et al. (2017) · Nature Medicine · doi:10.1038/nm.4345 · Cited by 1,632
Self-citationGut microbiome and serum metabolome alterations in obesity and after weight-loss intervention
Liu, R., Hong, J., Xu, X., Feng, Q., Zhang, D., Gu, Y., Shi, J., Zhao, S., Liu, W., Wang, X., et al. (2017) · Nature Medicine · doi:10.1038/nm.4358 · Cited by 1,501
Signals from the gut microbiota to distant organs in physiology and disease
Schroeder, B. O., & Bäckhed, F. (2016) · Nature Medicine · doi:10.1038/nm.4185 · Cited by 1,409
Self-citationGut microbial metabolites as multi-kingdom intermediates
Krautkramer, K. A., Fan, J., & Bäckhed, F. (2021) · Nature Reviews Microbiology · doi:10.1038/s41579-020-0438-4 · Cited by 1,398
Self-citationFrom NASH to HCC: current concepts and future challenges
Anstee, Q. M., Reeves, H. L., Kotsiliti, E., Govaere, O., & Heikenwalder, M. (2019) · Nature Reviews Gastroenterology & Hepatology · doi:10.1038/s41575-019-0145-7 · Cited by 1,392
Martin, C. R., Osadchiy, V., Kalani, A., & Mayer, E. A. (2018) · Cellular and Molecular Gastroenterology and Hepatology · doi:10.1016/j.jcmgh.2018.04.003 · Cited by 1,284
Dietary lipids, gut microbiota and lipid metabolism
Schoeler, M., & Caesar, R. (2019) · Reviews in Endocrine and Metabolic Disorders · doi:10.1007/s11154-019-09512-0 · Cited by 1,163
Adipose tissue and insulin resistance in obese
Ahmed, B., Sultana, R., & Greene, M. W. (2021) · Biomedicine & Pharmacotherapy · doi:10.1016/j.biopha.2021.111315 · Cited by 1,162
Rubino, F., Nathan, D. M., Eckel, R. H., Schauer, P. R., Alberti, K. G. M. M., Zimmet, P. Z., Del Prato, S., Ji, L., Sadikot, S. M., Herman, W. H., et al. (2016) · Diabetes Care · doi:10.2337/dc16-0236 · Cited by 1,008
Self-citationThe Human Gut Microbiome: From Association to Modulation
Schmidt, T. S. B., Raes, J., & Bork, P. (2018) · Cell · doi:10.1016/j.cell.2018.02.044 · Cited by 845
Postler, T. S., & Ghosh, S. (2017) · Cell Metabolism · doi:10.1016/j.cmet.2017.05.008 · Cited by 876
Diet-microbiota interactions and personalized nutrition
Kolodziejczyk, A. A., Zheng, D., & Elinav, E. (2019) · Nature Reviews Microbiology · doi:10.1038/s41579-019-0256-8 · Cited by 879
Gut-liver axis: Pathophysiological concepts and clinical implications
Tilg, H., Adolph, T. E., & Trauner, M. (2022) · Cell Metabolism · doi:10.1016/j.cmet.2022.09.017 · Cited by 843
Role of gut microbiota in atherosclerosis
Jonsson, A. L., & Bäckhed, F. (2016) · Nature Reviews Cardiology · doi:10.1038/nrcardio.2016.183 · Cited by 662
Self-citationWolfe, B. M., Kvach, E., & Eckel, R. H. (2016) · Circulation Research · doi:10.1161/circresaha.116.307591 · Cited by 695
The Gut–Brain Axis and the Microbiome: Mechanisms and Clinical Implications
Osadchiy, V., Martin, C. R., & Mayer, E. A. (2019) · Clinical Gastroenterology and Hepatology · doi:10.1016/j.cgh.2018.10.002 · Cited by 555
The Gut Microbiome Profile in Obesity: A Systematic Review
Castaner, O., Goday, A., Park, Y.-M., Lee, S.-H., Magkos, F., Shiow, S.-A. T. E., & Schröder, H. (2018) · International Journal of Endocrinology · doi:10.1155/2018/4095789 · Cited by 570
Zhang, L., & Davies, S. S. (2016) · Genome Medicine · doi:10.1186/s13073-016-0296-x · Cited by 521
The role of Gut Microbiota in the development of obesity and Diabetes
Baothman, O. A. S., Zamzami, M. A., Taher, I., Abubaker, J. A., & Abu‐Farha, M. (2016) · Lipids in Health and Disease · doi:10.1186/s12944-016-0278-4 · Cited by 509
Microbiota-gut-brain axis: Modulator of host metabolism and appetite
van de Wouw, M., Schellekens, H., Dinan, T. G., & Cryan, J. F. (2017) · The Journal of Nutrition · doi:10.3945/jn.116.240481 · Cited by 461
Role of bile acids and their receptors in gastrointestinal and hepatic pathophysiology
Fuchs, C. D., & Trauner, M. (2022) · Nature Reviews Gastroenterology & Hepatology · doi:10.1038/s41575-021-00566-7 · Cited by 490
The Intestinal Immune System in Obesity and Insulin Resistance
Winer, D. A., Luck, H., Tsai, S. J., & Winer, S. (2016) · Cell Metabolism · doi:10.1016/j.cmet.2016.01.003 · Cited by 493
Aberrant intestinal microbiota in individuals with prediabetes
Allin, K. H., Tremaroli, V., Caesar, R., Jensen, B. A. H., Damgaard, M. V., Bahl, M. I., Licht, T. R., Hansen, T. H., Nielsen, T., Dantoft, T. M., et al. (2018) · Diabetologia · doi:10.1007/s00125-018-4550-1 · Cited by 479
Self-citationRole of bile acids in metabolic control
Molinaro, A., Wahlström, A., & Marschall, H.-U. (2018) · Trends in Endocrinology & Metabolism · doi:10.1016/j.tem.2017.11.002 · Cited by 447
Major microbiota dysbiosis in severe obesity: fate after bariatric surgery
Aron-Wisnewsky, J., Prifti, E., Belda, E., Ichou, F., Kayser, B. D., Dao, M. C., Verger, E. O., Hedjazi, L., Bouillot, J.-L., Chevallier, J.-M., et al. (2019) · Gut · doi:10.1136/gutjnl-2018-316103 · Cited by 418
Discrepant gut microbiota markers for the classification of obesity-related metabolic abnormalities
Zeng, Q., Li, D., He, Y., Li, Y., Yang, Z., Zhao, X., Liu, Y., Wang, Y., Sun, J., Feng, X., et al. (2019) · Scientific Reports · doi:10.1038/s41598-019-49462-w · Cited by 412
Role of the gut microbiota in host appetite control: bacterial growth to animal feeding behaviour
Fetissov, S. O. (2017) · Nature Reviews Endocrinology · doi:10.1038/nrendo.2016.150 · Cited by 403
Courcoulas, A. P., Belle, S. H., Neiberg, R. H., Pierson, S. K., Eagleton, J. K., Kalarchian, M. A., DeLany, J. P., Lang, W., & Jakicic, J. M. (2015) · JAMA Surgery · doi:10.1001/jamasurg.2015.1534 · Cited by 376
Mechanisms of diabetes improvement following bariatric/metabolic surgery
Batterham, R. L., & Cummings, D. E. (2016) · Diabetes Care · doi:10.2337/dc16-0145 · Cited by 376
Obesity and Cancer: The Oil that Feeds the Flame
Font-Burgada, J., Sun, B., & Karin, M. (2016) · Cell Metabolism · doi:10.1016/j.cmet.2015.12.015 · Cited by 364
Brunkwall, L., & Orho‐Melander, M. (2017) · Diabetologia · doi:10.1007/s00125-017-4278-3 · Cited by 372
Gut microbiome and its role in obesity and insulin resistance
Lee, C. J., Sears, C. L., & Maruthur, N. M. (2019) · Annals of the New York Academy of Sciences · doi:10.1111/nyas.14107 · Cited by 366
The gut microbiome, diet, and links to cardiometabolic and chronic disorders
Aron‐Wisnewsky, J., & Clément, K. (2015) · Nature Reviews Nephrology · doi:10.1038/nrneph.2015.191 · Cited by 338
Koh, A., & Bäckhed, F. (2020) · Molecular Cell · doi:10.1016/j.molcel.2020.03.005 · Cited by 322
Self-citationVallianou, N. G., Stratigou, T., Christodoulatos, G. S., & Dalamaga, Μ. (2019) · Current Obesity Reports · doi:10.1007/s13679-019-00352-2 · Cited by 325
Pallejá, A., Kashani, A., Allin, K. H., Nielsen, T., Zhang, C., Li, Y., Brach, T., Liang, S., Feng, Q., Jørgensen, N. B., et al. (2016) · Genome Medicine · doi:10.1186/s13073-016-0312-1 · Cited by 320
The gut microbiota in obesity and weight management: microbes as friends or foe?
Hul, M. V., & Cani, P. D. (2023) · Nature Reviews Endocrinology · doi:10.1038/s41574-022-00794-0 · Cited by 353
de Groot, P. F., Scheithauer, T. P. M., Bakker, G. J., Prodan, A., Levin, E., Khan, M. T., Herrema, H., Ackermans, M. T., Serlie, M. J. M., de Brauw, M., et al. (2019) · Gut · doi:10.1136/gutjnl-2019-318320 · Cited by 317
Self-citationThe gut microbiota and metabolic disease: current understanding and future perspectives
Arora, T., & Bäckhed, F. (2016) · Journal of Internal Medicine · doi:10.1111/joim.12508 · Cited by 312
Self-citationVallianou, N. G., Christodoulatos, G. S., Karampela, Ι., Tsilingiris, D., Magkos, F., Stratigou, T., Kounatidis, D. C., & Dalamaga, Μ. (2021) · Biomolecules · doi:10.3390/biom12010056 · Cited by 305
Murphy, R., Tsai, P., Jüllig, M., Liu, A., Plank, L., & Booth, M. (2017) · Obesity Surgery · doi:10.1007/s11695-016-2399-2 · Cited by 285
Evaluating Causality of Gut Microbiota in Obesity and Diabetes in Humans
Meijnikman, A. S., Gerdes, V. E. A., Nieuwdorp, M., & Herrema, H. (2017) · Endocrine Reviews · doi:10.1210/er.2017-00192 · Cited by 283
Tseng, C.-H., & Wu, C. (2018) · Journal of the Formosan Medical Association · doi:10.1016/j.jfma.2018.07.009 · Cited by 286
Kim, Y., & Shin, C. (2018) · Current Neuropharmacology · doi:10.2174/1570159x15666170915141036 · Cited by 281
The Mouse Microbiome Is Required for Sex-Specific Diurnal Rhythms of Gene Expression and Metabolism
Weger, B. D., Gobet, C., Yeung, J., Martin, E., Jimenez, S., Betrisey, B., Foata, F., Berger, B., Balvay, A., Foussier, A., et al. (2019) · Cell Metabolism · doi:10.1016/j.cmet.2018.09.023 · Cited by 269
Women and Their Microbes: The Unexpected Friendship
Younes, J. A., Lievens, E., Hummelen, R., van der Westen, R., Reid, G., & Petrova, M. (2017) · Trends in Microbiology · doi:10.1016/j.tim.2017.07.008 · Cited by 243
The Gut Microbiota (Microbiome) in Cardiovascular Disease and Its Therapeutic Regulation
Rahman, M. M., Islam, F., Harun-Or-Rashid, M., Mamun, A. A., Rahaman, M. S., Islam, M. M., Meem, A. F. K., Sutradhar, P. R., Mitra, S., Mimi, A. A., et al. (2022) · Frontiers in Cellular and Infection Microbiology · doi:10.3389/fcimb.2022.903570 · Cited by 272
Effects of diet versus gastric bypass on metabolic function in diabetes
Yoshino, M., Kayser, B. D., Yoshino, J., Stein, R. I., Reeds, D., Eagon, J. C., Eckhouse, S. R., Watrous, J. D., Jain, M., Knight, R., et al. (2020) · New England Journal of Medicine · doi:10.1056/nejmoa2003697 · Cited by 246
Seganfredo, F. B., Blume, C. A., Moehlecke, M., Giongo, A., Casagrande, D. S., Spolidoro, J. V. N., Padoin, A. V., Schaan, B. D., & Mottin, C. C. (2017) · Obesity Reviews · doi:10.1111/obr.12541 · Cited by 228
Mechanisms underlying the weight loss effects of RYGB and SG: similar, yet different
Pucci, A. B. F., & Batterham, R. L. (2018) · Journal of Endocrinological Investigation · doi:10.1007/s40618-018-0892-2 · Cited by 230
Influence of Early Life, Diet, and the Environment on the Microbiome
Dong, T. S., & Gupta, A. (2018) · Clinical Gastroenterology and Hepatology · doi:10.1016/j.cgh.2018.08.067 · Cited by 232
Insulin action at a molecular level – 100 years of progress
White, M. F., & Kahn, C. R. (2021) · Molecular Metabolism · doi:10.1016/j.molmet.2021.101304 · Cited by 221
Regulation of energy balance by a gut–brain axis and involvement of the gut microbiota
Bauer, P. V., Hamr, S. C., & Duca, F. A. (2015) · Cellular and Molecular Life Sciences · doi:10.1007/s00018-015-2083-z · Cited by 231
Impact of Gut Microbiota on Host Glycemic Control
Gérard, C., & Vidal, H. (2019) · Frontiers in Endocrinology · doi:10.3389/fendo.2019.00029 · Cited by 220
Roles of the Gut in Glucose Homeostasis
Holst, J. J., Gribble, F. M., Horowitz, M., & Rayner, C. K. (2016) · Diabetes Care · doi:10.2337/dc16-0351 · Cited by 216
Hypothalamic bile acid-TGR5 signaling protects from obesity
Castellanos-Jankiewicz, A., Guzmán‐Quevedo, O., Fénelon, V. S., Zizzari, P., Quarta, C., Bellocchio, L., Tailleux, A., Charton, J., Fernandois, D., Henricsson, M., et al. (2021) · Cell Metabolism · doi:10.1016/j.cmet.2021.04.009 · Cited by 211
Self-citationImplication of gut microbiota metabolites in cardiovascular and metabolic diseases
Brial, F., Lay, A. L., Dumas, M., & Gauguier, D. (2018) · Cellular and Molecular Life Sciences · doi:10.1007/s00018-018-2901-1 · Cited by 201
Glucose metabolism after bariatric surgery: implications for T2DM remission and hypoglycaemia
Sandoval, D. A., & Patti, M. (2022) · Nature Reviews Endocrinology · doi:10.1038/s41574-022-00757-5 · Cited by 218
Baghdasaryan, A., Fuchs, C. D., Österreicher, C. H., Lemberger, U. J., Halilbasic, E., Påhlman, I., Graffner, H., Krones, E., Fickert, P., Wahlström, A., et al. (2016) · Journal of Hepatology · doi:10.1016/j.jhep.2015.10.024 · Cited by 187
Self-citationSummit, O. B. O. T. D. O. T. 2. D. S., Rubino, F., Nathan, D. M., Eckel, R. H., Schauer, P. R., Alberti, K. G. M. M., Zimmet, P., Prato, S. D., Ji, L., SADIKOT, S. M., et al. (2016) · Obesity Surgery · doi:10.1007/s11695-016-2457-9 · Cited by 194
Gut microbiota and diabetes: From correlation to causality and mechanism
Li, W., Stirling, K., Yang, J., & Zhang, L. (2020) · World Journal of Diabetes · doi:10.4239/wjd.v11.i7.293 · Cited by 189
Skye, S. M., Zhu, W., Romano, K. A., Guo, C.-J., Wang, Z., Jia, X., Kirsop, J., Haag, B., Lang, J. M., DiDonato, J. A., et al. (2018) · Circulation Research · doi:10.1161/circresaha.118.313142 · Cited by 189
The gut microbiota and its interactions with cardiovascular disease
Xu, H., Wang, X., Feng, W., Liu, Q., Zhou, S., Liu, Q., & Cai, L. (2020) · Microbial Biotechnology · doi:10.1111/1751-7915.13524 · Cited by 196
Xia, J., Jin, C., Pan, Z., Sun, L., Fu, Z., & Jin, Y. (2018) · The Science of The Total Environment · doi:10.1016/j.scitotenv.2018.03.053 · Cited by 184
Modulation of the gut microbiome: a systematic review of the effect of bariatric surgery
Guo, Y. H., Huang, Z., Liu, C., Qi, L., Sheng, Y., & Zou, D. (2017) · European Journal of Endocrinology · doi:10.1530/eje-17-0403 · Cited by 184
Bariatric Surgery in Obesity: Effects on Gut Microbiota and Micronutrient Status
Ciobârcă, D., Cătoi, A. F., Copăescu, C., Miere, D., & Crișan, G. (2020) · Nutrients · doi:10.3390/nu12010235 · Cited by 194
Effects of Fecal Microbiome Transfer in Adolescents With Obesity
Leong, K. S. W., Jayasinghe, T. N., Wilson, B. C., Derraik, J. G. B., Albert, B. B., Chiavaroli, V., Svirskis, D. M., Beck, K. L., Conlon, C. A., Jiang, Y., et al. (2020) · JAMA Network Open · doi:10.1001/jamanetworkopen.2020.30415 · Cited by 186
Food Intake and Eating Behavior After Bariatric Surgery
Al‐Najim, W., Docherty, N. G., & le Roux, C. W. (2018) · Physiological Reviews · doi:10.1152/physrev.00021.2017 · Cited by 185
Self-citationHul, M. V., Geurts, L., Plovier, H., Druart, C., Everard, A., Ståhlman, M., Rhimi, M., Chira, K., Teissèdre, P., Delzenne, N. M., et al. (2017) · American Journal of Physiology-Endocrinology and Metabolism · doi:10.1152/ajpendo.00107.2017 · Cited by 176
Self-citationReshaping the gut microbiota: Impact of low calorie sweeteners and the link to insulin resistance?
Nettleton, J. E., Reimer, R. A., & Shearer, J. (2016) · Physiology & Behavior · doi:10.1016/j.physbeh.2016.04.029 · Cited by 158
The gut microbiome influences host diet selection behavior
Trevelline, B. K., & Kohl, K. D. (2022) · Proceedings of the National Academy of Sciences · doi:10.1073/pnas.2117537119 · Cited by 162
Rubino, F., Nathan, D. M., Eckel, R. H., Schauer, P. R., Alberti, K. G. M. M., Zimmet, P. Z., Del Prato, S., Ji, L., Sadikot, S. M., Herman, W. H., et al. (2016) · Surgery for Obesity and Related Diseases · doi:10.1016/j.soard.2016.05.018 · Cited by 157
Linking microbiota to human diseases: a systems biology perspective
Wu, H., Tremaroli, V., & Bäckhed, F. (2015) · Trends in Endocrinology & Metabolism · doi:10.1016/j.tem.2015.09.011 · Cited by 150
Self-citationGut Microbiota Dysbiosis in Human Obesity: Impact of Bariatric Surgery
Debédat, J., Clément, K., & Aron‐Wisnewsky, J. (2019) · Current Obesity Reports · doi:10.1007/s13679-019-00351-3 · Cited by 165
Djekic, D., Shi, L. S., Brolin, H., Carlsson, F., Särnqvist, C., Savolainen, O. I., Cao, Y., Bäckhed, F., Tremaroli, V., Landberg, R., et al. (2020) · Journal of the American Heart Association · doi:10.1161/jaha.120.016518 · Cited by 165
Self-citationLi, Q., Lauber, C. L., Czarnecki-Maulden, G., Pan, Y., & Hannah, S. S. (2017) · mBio · doi:10.1128/mbio.01703-16 · Cited by 148
Impact of Gut Microbiota and Diet on the Development of Atherosclerosis in Apoe −/− Mice
Jonsson, A. L., Caesar, R., Akrami, R., Reinhardt, C., Hållenius, F. F., Borén, J., & Bäckhed, F. (2018) · Arteriosclerosis Thrombosis and Vascular Biology · doi:10.1161/atvbaha.118.311233 · Cited by 157
Self-citationEmerging concepts in intestinal immune control of obesity-related metabolic disease
Khan, S. M., Luck, H., Winer, S., & Winer, D. A. (2021) · Nature Communications · doi:10.1038/s41467-021-22727-7 · Cited by 161
Gut microbiota link dietary fiber intake and short-chain fatty acid metabolism with eating behavior
Medawar, E., Haange, S., Rolle-Kampczyk, U. E., Engelmann, B., Dietrich, A., Thieleking, R., Wiegank, C., Fries, C., Horstmann, A., Villringer, A., et al. (2021) · Translational Psychiatry · doi:10.1038/s41398-021-01620-3 · Cited by 153
Roy, T. L., Debédat, J., Marquet, F., Da-Cunha, C., Ichou, F., Guerre-Millo, M., Kapel, N., Aron‐Wisnewsky, J., & Clément, K. (2019) · Frontiers in Microbiology · doi:10.3389/fmicb.2018.03289 · Cited by 152
Magouliotis, D. E., Tasiopoulou, V. S., Sioka, E., Chatedaki, C., & Zacharoulis, D. (2017) · Obesity Surgery · doi:10.1007/s11695-017-2595-8 · Cited by 157
Lange, O., Proczko-Stepaniak, M., & Mika, A. (2023) · Current Obesity Reports · doi:10.1007/s13679-023-00503-6 · Cited by 168
Crosstalk between glucagon-like peptide 1 and gut microbiota in metabolic diseases
Zeng, Y., Wu, Y., Zhang, Q., & Xiao, X. (2023) · mBio · doi:10.1128/mbio.02032-23 · Cited by 180
Ilhan, Z. E., DiBaise, J. K., Isern, N., Hoyt, D. W., Marcus, A. K., Kang, D., Crowell, M. D., Rittmann, B. E., & Krajmalnik‐Brown, R. (2017) · The ISME Journal · doi:10.1038/ismej.2017.71 · Cited by 140
Roles of the gut in the metabolic syndrome: an overview
Fändriks, L. (2016) · Journal of Internal Medicine · doi:10.1111/joim.12584 · Cited by 146
Self-citationFecal Microbiota Transplantation: a Future Therapeutic Option for Obesity/Diabetes?
Aron‐Wisnewsky, J., Clément, K., & Nieuwdorp, M. (2019) · Current Diabetes Reports · doi:10.1007/s11892-019-1180-z · Cited by 148
A microbial metabolite remodels the gut-liver axis following bariatric surgery
Chaudhari, S. N., Luo, J. N., Harris, D. A., Aliakbarian, H., Yao, L., Paik, D., Subramaniam, R., Adhikari, A. A., Vernon, A. H., Kılıç, A., et al. (2021) · Cell Host & Microbe · doi:10.1016/j.chom.2020.12.004 · Cited by 143
Obesity-related cognitive impairment: The role of endothelial dysfunction
Buie, J. N. J., Watson, L. S., Smith, C. J., & Sims‐Robinson, C. (2019) · Neurobiology of Disease · doi:10.1016/j.nbd.2019.104580 · Cited by 138
Mechanisms of Weight Loss After Obesity Surgery
Akalestou, E., Miras, A. D., Rutter, G. A., & le Roux, C. W. (2022) · Endocrine Reviews · doi:10.1210/endrev/bnab022 · Cited by 136
Self-citationMetabolomic analysis in inflammatory bowel disease: A systematic review
Gallagher, K., Catesson, A., Griffin, J. L., Holmes, E., & Williams, H. R. T. (2021) · Journal of Crohn's and Colitis · doi:10.1093/ecco-jcc/jjaa227 · Cited by 133
Xu, M., Jung, X., Hines, O. J., Eibl, G., & Chen, Y. (2018) · Pancreas · doi:10.1097/mpa.0000000000000974 · Cited by 138
Fatty acid metabolism and the basis of brown adipose tissue function
Calderón‐Domínguez, M., Mir, J. F., Fucho, R., Weber, M., Serra, D., & Herrero, L. (2015) · Adipocyte · doi:10.1080/21623945.2015.1122857 · Cited by 134
Makki, K., Brolin, H., Petersen, N., Henricsson, M., Christensen, D. P., Khan, M. T., Wahlstrom, A. M., Bergh, P., Tremaroli, V., Schoonjans, K., et al. (2022) · Gut · doi:10.1136/gutjnl-2021-326541 · Cited by 136
Self-citationSanmiguel, C. P., Jacobs, J. P., Gupta, A., Ju, T., Stains, J., Coveleskie, K., Lagishetty, V., Balioukova, A., Chen, Y., Dutson, E., et al. (2017) · Psychosomatic Medicine · doi:10.1097/psy.0000000000000494 · Cited by 133
Gut microbiota and obesity: Concepts relevant to clinical care
Dao, M. C., & Clément, K. (2017) · European Journal of Internal Medicine · doi:10.1016/j.ejim.2017.10.005 · Cited by 138
Metadata
- Authors
- Tremaroli, V., Karlsson, F., Werling, M., Ståhlman, M., Kovatcheva-Datchary, P., Olbers, T., Fändriks, L., le Roux, C. W., Nielsen, J., & Bäckhed, F.
- Affiliations
- University of Gothenburg (SE)
- Chalmers University of Technology (SE)
- Sahlgrenska University Hospital (SE)
- University of Copenhagen (DK)
- Corresponding author
- Bäckhed, Fredrik
- ORCID
- Venue
- Cell Metabolism
- Publisher
- Elsevier BV
- Published
- 2015-08
- Volume
- 22
- Issue
- 2
- Pages
- 228-238
- ISSN
- 1550-4131 (ISSN-L)
- PMC
- PMC4537510
- OpenAlex
- W2103218211
- Cited by
- 757
- References
- 59
- Citations by year
- 2026: 26 · 2025: 37 · 2024: 43 · 2023: 68 · 2022: 79 · 2021: 72 · 2020: 100 · 2019: 86 · 2018: 76 · 2017: 82 · 2016: 73 · 2015: 14
- FWCI
- 35.42
- Type
- journal article
- Language
- en
- Open access
- hybrid
- doi.org
- Licence
- Locations
- Cell Metabolism (publishedVersion, cc-by-nc-nd)
- Europe PMC (PubMed Central) (publishedVersion, cc-by-nc-nd)
- PubMed Central (publishedVersion, cc-by-nc-nd)
- PubMed (publishedVersion)
- Research at the University of Copenhagen (University of Copenhagen) (publishedVersion)
- Chalmers Publication Library (Chalmers University of Technology) (submittedVersion)
- Chalmers Research (Chalmers University of Technology) (submittedVersion)
- Spiral (Imperial College London) (submittedVersion, other-oa)
- Funders
- Hjärt-Lungfonden
- Knut och Alice Wallenbergs Stiftelse
- Vetenskapsrådet
- Sahlgrenska Universitetssjukhuset
- Göteborgs Universitet
- Institut National Du Cancer
- Novo Nordisk Fonden (NNF13OC0008163, NNF13SA0006017)
- Topics
- Life Sciences › Biochemistry, Genetics and Molecular Biology › Molecular Biology › Gut microbiota and health
- Health Sciences › Medicine › Surgery › Bariatric Surgery and Outcomes
- Health Sciences › Medicine › Endocrinology, Diabetes and Metabolism › Adipokines, Inflammation, and Metabolic Diseases
- Keywords
- Roux-en-Y gastric bypass, vertical banded gastroplasty, bariatric surgery, gut microbiota, obesity, adiposity, fecal metabolites, circulating metabolites, germ-free mice, fat deposition, respiratory quotient, carbohydrate utilization
- MeSH terms
- Animals, Female, Follow-Up Studies, Humans, Intestines, Obesity, Gastric Bypass, Body Mass Index, Adiposity, Mice, Microbiota
About these checks
Registry, retraction, Cites and statistics results are computed, not judged, with one exception: a printed reference that no index lists is read once by a model before it counts as a citation error. Claims are extracted by a model and kept only when their quote appears verbatim in the text; each cited source is then checked, with a model’s help, for whether it says what the claim relies on. Those verdicts can be wrong — read the claim’s quote and the cited source before relying on one.
A language model drew the claims from the paper on 2026-10-07, under version 3 of the claim definition (model deepseek-v4.1-flash, prompt extract-v3).
A second model labelled each claim on 2026-10-07 (model jev-1.13-20260917, definition revision gold-guideline-v0.2).
Statistics and arithmetic are recomputed, not judged.
Confidence bands are shown only for fields calibrated on our annotated test set. None is calibrated yet, so no band is shown.
What counts as a claim ›How we measure confidence ›How we check this ›
Are you an author, or do you see a problem with this page? Request a review
