

The DOI matches its Crossref record; 60 of the 60 references it cites were found in a registry or an index.
Whole-genome resequencing reveals world-wide ancestry and adaptive introgression events of domesticated cattle in East Asia
Open accessAbstract
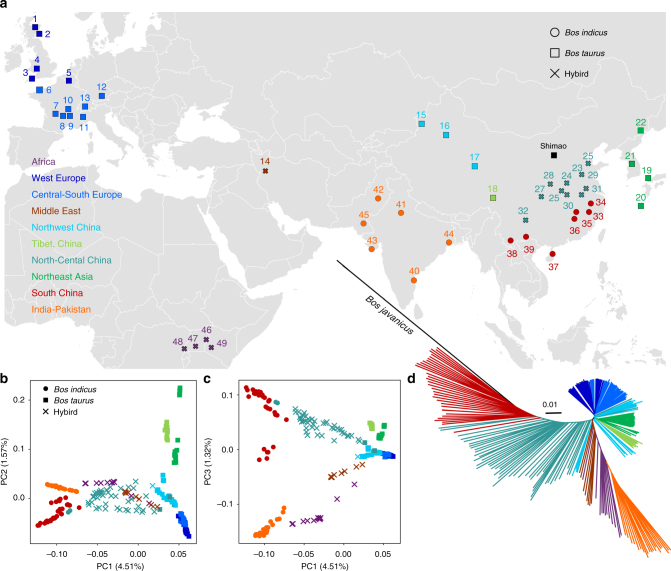
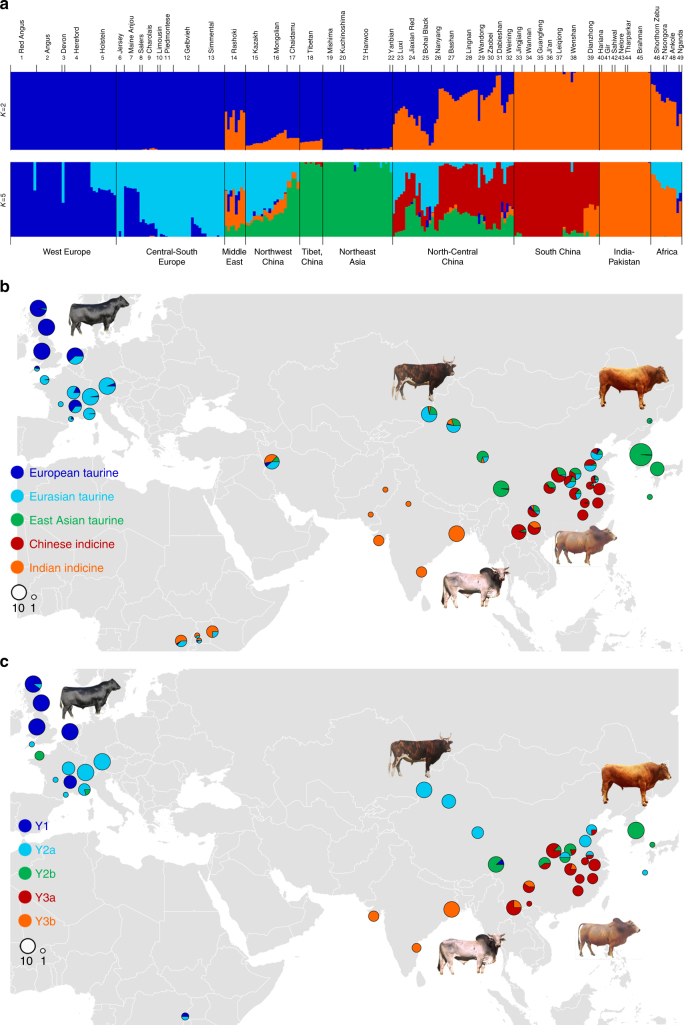
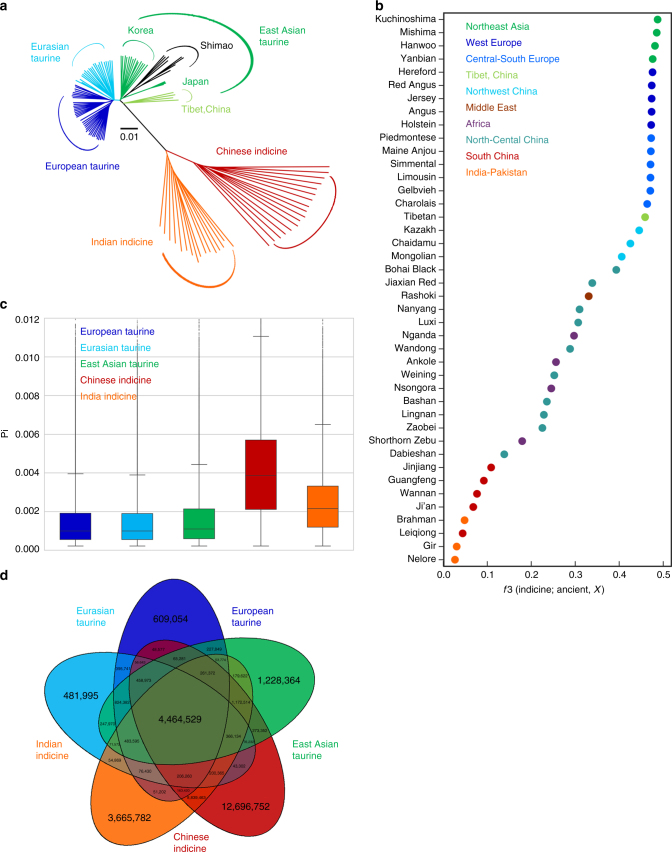
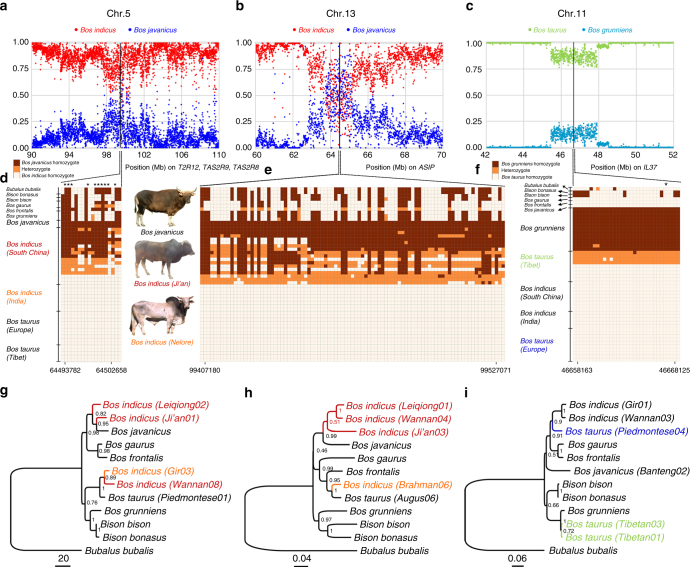
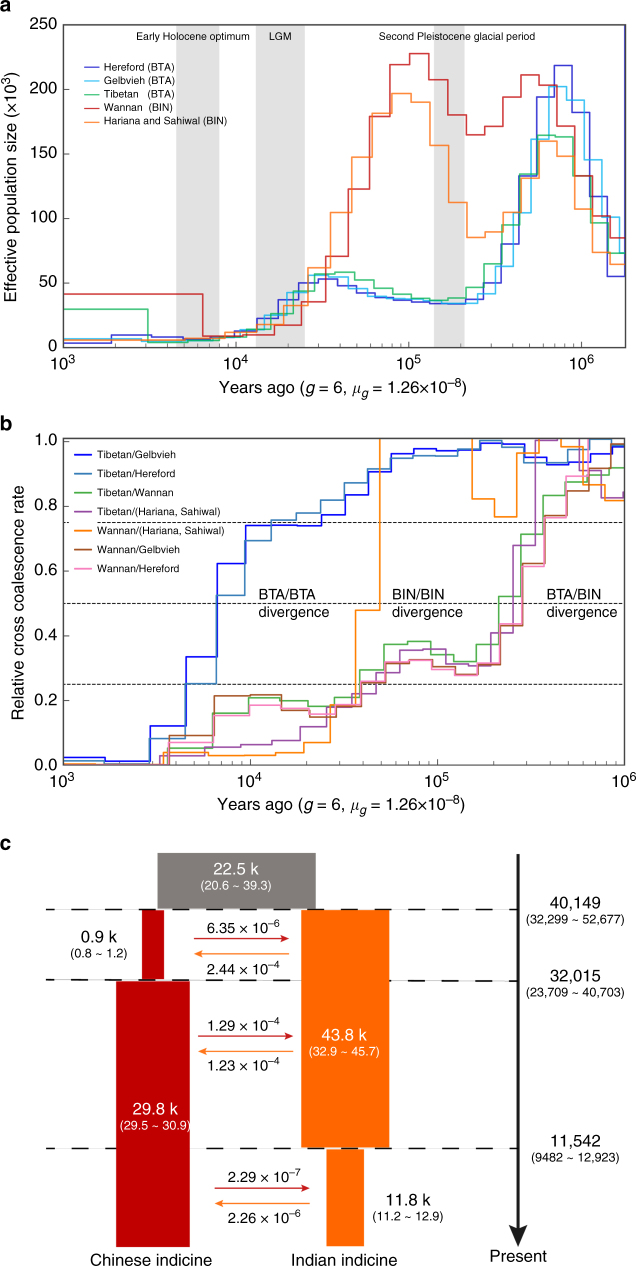
Cattle domestication and the complex histories of East Asian cattle breeds warrant further investigation. Through analysing the genomes of 49 modern breeds and eight East Asian ancient samples, worldwide cattle are consistently classified into five continental groups based on Y-chromosome haplotypes and autosomal variants. We find that East Asian cattle populations are mainly composed of three distinct ancestries, including an earlier East Asian taurine ancestry that reached China at least ~3.9 kya, a later introduced Eurasian taurine ancestry, and a novel Chinese indicine ancestry that diverged from Indian indicine approximately 36.6-49.6 kya. We also report historic introgression events that helped domestic cattle from southern China and the Tibetan Plateau achieve rapid adaptation by acquiring ~2.93% and ~1.22% of their genomes from banteng and yak, respectively. Our findings provide new insights into the evolutionary history of cattle and the importance of introgression in adaptation of cattle to new environmental challenges in East Asia.
Overview
The claims and statistics of this paper haven’t been checked yet.
Run the check — free, no account needed. It reads the open-access text and checks the sources it cites.
Integrity signals
Registry
Cites
Statistics
Figures
Verification
Claims the paper makes
The claims and statistics of this paper haven’t been checked yet.
Run the check — free, no account needed. It reads the open-access text and checks the sources it cites.
Claims other papers make about this one
Each is checked against this paper’s own text: does it say what the citing paper says it does?
The source backs part of the claim, not all of it — or backs it for a different population, condition or comparison.
In the citing paper
“strongly supporting the two independent domestication events involving distinct aurochs subspecies.”
From The Genomic Landscape of Cattle: Domestication, Dispersal, and Adaptive Evolution (2026) · cites this paper as [9]
Experimental — accuracy not yet measuredThe source backs part of the claim, not all of it — or backs it for a different population, condition or comparison.
In the citing paper
“Molecular divergence of taurine and indicine (also referred to as zebu) lineages is estimated to have occurred at approximately 201,000–301,200 years ago [5,7,8,9,10], strongly supporting the two independent domestication events involving distinct aurochs subspecies.”
From The Genomic Landscape of Cattle: Domestication, Dispersal, and Adaptive Evolution (2026) · cites this paper as [9]
Experimental — accuracy not yet measuredThe source backs part of the claim, not all of it — or backs it for a different population, condition or comparison.
In the citing paper
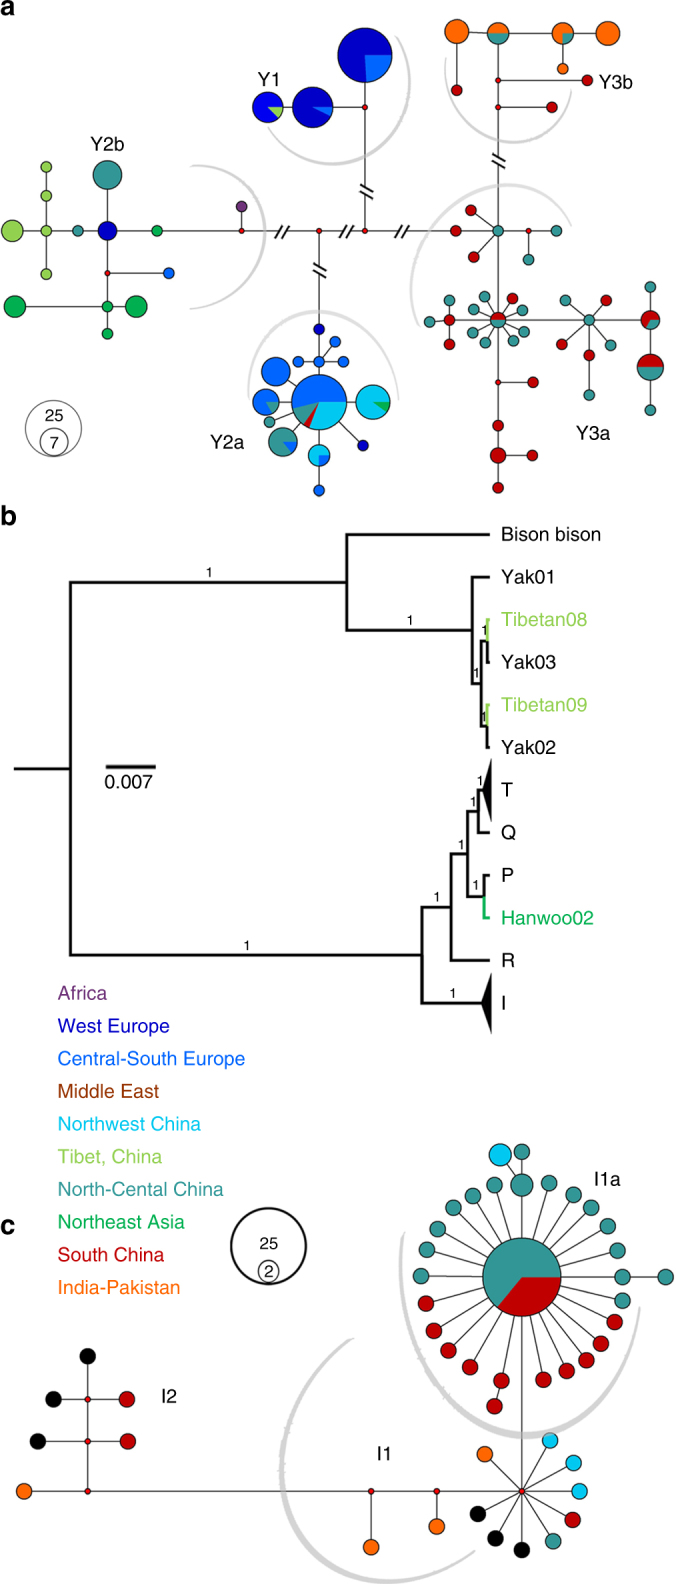
“The Y2 haplogroup is distributed across Eurasia and Africa, whiel Y2a sub-haplogroup is dominant in Eurasian cattle and Y2b sub-haplogroup is found having a higher proportion in Northeast Asian and Qinghai-Tibetan Plateau cattle [9,34].”
From The Genomic Landscape of Cattle: Domestication, Dispersal, and Adaptive Evolution (2026) · cites this paper as [9]
Experimental — accuracy not yet measuredThe source backs part of the claim, not all of it — or backs it for a different population, condition or comparison.
In the citing paper
“The divergence of Y3a from Y3b, as well as sub-haplogroups within indicine mitogenomes, occurred approximately 23,100–24,800 years ago, while South Asian indicine ancestry diverged from East Asian and African indicine ancestry approximately 10,300–40,100 and 11,800 years ago, respectively [9,10].”
From The Genomic Landscape of Cattle: Domestication, Dispersal, and Adaptive Evolution (2026) · cites this paper as [9]
Experimental — accuracy not yet measuredThe source backs part of the claim, not all of it — or backs it for a different population, condition or comparison.
In the citing paper
“The mtDNA I1 haplogroup and Y3b sub-haplogroup are widely distributed in India and other parts of the world, while Y3a sub-haplogroup predominates in southern China and Southeast Asia [6,9,36,37].”
From The Genomic Landscape of Cattle: Domestication, Dispersal, and Adaptive Evolution (2026) · cites this paper as [9]
Experimental — accuracy not yet measured
The source backs part of the claim, not all of it — or backs it for a different population, condition or comparison.
In the citing paper
“The autosomal genetic structure of modern cattle is primarily divided into six ancestries (Table 1): European taurine, East Asian taurine, African taurine, South Asian or Indian indicine, East Asian or Chinese indicine, and African indicine ancestry [9,10,31].”
From The Genomic Landscape of Cattle: Domestication, Dispersal, and Adaptive Evolution (2026) · cites this paper as [9]
Experimental — accuracy not yet measuredThe source backs part of the claim, not all of it — or backs it for a different population, condition or comparison.
In the citing paper
“The introgression proportions of banteng (Bos javanicus), gaur (Bos gaurus), and yak (Bos mutus) ancestries into East Asian indicine or Tibetan taurine cattle ranged from 1.13% to 10.21%, 2.06% to 9.98%, and 0.05% to 2.94%, respectively [9,10].”
From The Genomic Landscape of Cattle: Domestication, Dispersal, and Adaptive Evolution (2026) · cites this paper as [9]
Experimental — accuracy not yet measuredThe source backs part of the claim, not all of it — or backs it for a different population, condition or comparison.
In the citing paper
“During the late Neolithic (4000–5000 years ago), taurine cattle were introduced to East Asia from West Asia, carrying T3 and the East Asian-specific T4 haplogroups [9,33,55,56,57].”
From The Genomic Landscape of Cattle: Domestication, Dispersal, and Adaptive Evolution (2026) · cites this paper as [9]
Experimental — accuracy not yet measuredThe cited source says what the claim attributes to it.
In the citing paper
“Studies based on Y-chromosome microsatellites or SNP markers classify modern cattle paternal origins into taurine Y1, Y2 (Y2a and Y2b), and indicine Y3 (Y3a and Y3b) haplogroups [9,10].”
From The Genomic Landscape of Cattle: Domestication, Dispersal, and Adaptive Evolution (2026) · cites this paper as [9]
The cited source says what the claim attributes to it.
In the citing paper
“Tibetan and Northeast Asian cattle breeds share an East Asian taurine ancestry component, and the Y2b sub-haplogroup was likely maintained by geographical barriers [9].”
From The Genomic Landscape of Cattle: Domestication, Dispersal, and Adaptive Evolution (2026) · cites this paper as [9]
The cited source says what the claim attributes to it.
In the citing paper
“In contrast, Eurasian taurine ancestry and the Y2a sub-haplogroup predominated in cattle from Northwest China and south-central Europe [9].”
From The Genomic Landscape of Cattle: Domestication, Dispersal, and Adaptive Evolution (2026) · cites this paper as [9]
Self-check
Percentages, sums and reported differences re-computed from the paper’s own numbers.
The self-check needs the paper’s full text.
Citations
Cites
Guindon, S., Dufayard, J.-F., Lefort, V., Anisimova, M., Hordijk, W., & Gascuel, O. (2010) · Systematic Biology · doi:10.1093/sysbio/syq010 · Cited by 18,376
Bayesian Phylogenetics with BEAUti and the BEAST 1.7
Drummond, A. J., Suchard, M. A., Xie, D., & Rambaut, A. (2012) · Molecular Biology and Evolution · doi:10.1093/molbev/mss075 · Cited by 10,128
Fast model-based estimation of ancestry in unrelated individuals
Alexander, D. H., Novembre, J., & Lange, K. (2009) · Genome Research · doi:10.1101/gr.094052.109 · Cited by 9,898
Population Structure and Eigenanalysis
Patterson, N., Price, A. L., & Reich, D. (2006) · PLoS Genetics · doi:10.1371/journal.pgen.0020190 · Cited by 5,280
A draft sequence of the Neandertal genome
Green, R. E., Krause, J., Briggs, A. W., Maricic, T., Stenzel, U., Kircher, M., Patterson, N., Li, H., Zhai, W., Fritz, M. H.-Y., et al. (2010) · Science · doi:10.1126/science.1188021 · Cited by 4,318
Clark, P. U., Dyke, A. S., Shakun, J. D., Carlson, A. E., Clark, J., Wohlfarth, B., Mitrovica, J. X., Hostetler, S. W., & McCabe, A. M. (2009) · Science · doi:10.1126/science.1172873 · Cited by 3,277
Browning, S. R., & Browning, B. L. (2007) · The American Journal of Human Genetics · doi:10.1086/521987 · Cited by 3,217
Ancient Admixture in Human History
Patterson, N., Moorjani, P., Luo, Y., Mallick, S., Rohland, N., Zhan, Y., Genschoreck, T., Webster, T., & Reich, D. (2012) · Genetics · doi:10.1534/genetics.112.145037 · Cited by 2,848
Inference of population splits and mixtures from genome-wide allele frequency data
Pickrell, J. K., & Pritchard, J. K. (2012) · PLoS Genetics · doi:10.1371/journal.pgen.1002967 · Cited by 2,731
Gutenkunst, R. N., Hernandez, R. D., Williamson, S. H., & Bustamante, C. D. (2009) · PLoS Genetics · doi:10.1371/journal.pgen.1000695 · Cited by 1,906
Research works printed but not linked: 3
- National Bureau of Statistics. China Statistical Yearbook 2016 (China Statistics Press, Beijing, 2016).
- Vigne, J. D., Peters, J. & Helmer, D. The First Steps of Animal Domestication (Oxbow Books, Oxford, 2005).
- Flad, R., Yuan, J. & Li, S. C. On the source and features of the Neolithic domestic animals in the Gansu and Qinghai region, China. Archaeology 5, 80–86 (2009).
Cited by
Sorted by citations
863 genomes reveal the origin and domestication of chicken
Wang, M.-S., Thakur, M., Peng, M.-S., Jiang, Y., Frantz, L. A. F., Li, M., Zhang, J.-J., Wang, S., Peters, J., Otecko, N. O., et al. (2020) · Cell Research · doi:10.1038/s41422-020-0349-y · Cited by 286
Self-citationWidespread introgression across a phylogeny of 155 Drosophila genomes
Suvorov, A., Kim, B. Y., Wang, J., Armstrong, E. E., Peede, D., D’Agostino, E. R. R., Price, D. K., Waddell, P. J., Lang, M., Courtier‐Orgogozo, V., et al. (2021) · Current Biology · doi:10.1016/j.cub.2021.10.052 · Cited by 278
Ancient Cattle Genomics, Origins, and Rapid Turnover in the Fertile Crescent
Verdugo, M. P., Mullin, V. E., Scheu, A., Mattiangeli, V., Daly, K. G., Maisano Delser, P., Hare, A. J., Burger, J., Collins, M. J., Kehati, R., et al. (2019) · Science · doi:10.1126/science.aav1002 · Cited by 227
Self-citationHu, X., Yang, J. H., Xie, X.-L., Lv, F., Cao, Y.-H., Li, W., Liu, M., Wang, Y., Li, J., Liu, Y., et al. (2018) · Molecular Biology and Evolution · doi:10.1093/molbev/msy208 · Cited by 193
Self-citationThe origin of domestication genes in goats
Zheng, Z., Wang, X., Li, M., Li, Y., Yang, Z., Wang, X., Pan, X., Gong, M., Zhang, Y., Guo, Y., et al. (2020) · Science Advances · doi:10.1126/sciadv.aaz5216 · Cited by 184
Self-citationLv, F., Cao, Y.-H., Liu, G., Luo, L.-Y., Lu, R., Liu, M., Li, W., Zhou, P., Wang, X., Shen, M., et al. (2021) · Molecular Biology and Evolution · doi:10.1093/molbev/msab353 · Cited by 185
Self-citationThe Mosaic Genome of Indigenous African Cattle as a Unique Genetic Resource for African Pastoralism
Kim, K., Kwon, T., Dessie, T., Yoo, D., Mwai, O. A., Jang, J., Sung, S., Lee, S., Salim, B., Jung, J., et al. (2020) · Nature Genetics · doi:10.1038/s41588-020-0694-2 · Cited by 140
Genomic clues of the evolutionary history of Bos indicus cattle
Utsunomiya, Y. T., Milanesi, M., Fortes, M. R. S., Porto‐Neto, L. R., Utsunomiya, A. T. H., Silva, M. V. G. B., Garcia, J. F., & Ajmone‐Marsan, P. (2019) · Animal Genetics · doi:10.1111/age.12836 · Cited by 128
Cao, Y.-H., Xu, S., Shen, M., Chen, Z., Gao, L., Lv, F., Xie, X.-L., Wang, X., Yang, H., Liu, C., et al. (2020) · Molecular Biology and Evolution · doi:10.1093/molbev/msaa236 · Cited by 115
Self-citationUnlocking the origins and biology of domestic animals using ancient DNA and paleogenomics
McHugo, G. P., Dover, M. J., & MacHugh, D. E. (2019) · BMC Biology · doi:10.1186/s12915-019-0724-7 · Cited by 102
Weldenegodguad, M., Popov, R. G., Pokharel, K., Ammosov, I., Ming, Y., Ivanova, Z., & Kantanen, J. (2019) · Frontiers in Genetics · doi:10.3389/fgene.2018.00728 · Cited by 100
Xia, X., Zhang, S., Zhang, H., Zhang, Z., Chen, N., Li, Z., HongXia, S., Liu, X., Lyu, S., Wang, X., et al. (2021) · BMC Genomics · doi:10.1186/s12864-020-07340-0 · Cited by 98
Self-citationZhou, Y., Yang, L., Han, X., Han, J., Hu, Y., Li, F., Xia, H., Peng, L., Boschiero, C., Rosen, B. D., et al. (2022) · Genome Research · doi:10.1101/gr.276550.122 · Cited by 89
Self-citationChen, Z., Xu, Y., Xie, X.-L., Wang, D., Aguilar‐Gómez, D., Liu, G., Li, X., Esmailizadeh, A., Rezaei, V., Kantanen, J., et al. (2021) · Communications Biology · doi:10.1038/s42003-021-02817-4 · Cited by 93
The transcriptomic landscape of yaks reveals molecular pathways for high altitude adaptation
Qi, X., Zhang, Q., He, Y., Yang, L., Zhang, X., Shi, P., Yang, L., Liu, Z., Zhang, F., Liu, F., et al. (2018) · Genome Biology and Evolution · doi:10.1093/gbe/evy264 · Cited by 103
Self-citationChen, N., Xia, X., Hanif, Q., Zhang, F., Dang, R., Huang, B., Lyu, Y., Luo, X., Zhang, H., Yan, H., et al. (2023) · Nature Communications · doi:10.1038/s41467-023-43626-z · Cited by 83
Self-citationEvolution and Domestication of the Bovini Species
Zhang, K., Lenstra, J. A., Zhang, S., Liu, W., & Liu, J. (2020) · Animal Genetics · doi:10.1111/age.12974 · Cited by 82
Leonard, A. S., Crysnanto, D., Fang, Z., Heaton, M. P., Ley, B. L. V., Herrera, C., Bollwein, H., Bickhart, D. M., Kuhn, K. L., Smith, T. P. L., et al. (2022) · Nature Communications · doi:10.1038/s41467-022-30680-2 · Cited by 78
Adaptive introgression from indicine cattle into white cattle breeds from Central Italy
Barbato, M., Hailer, F., Upadhyay, M. R., Corvo, M. D., Colli, L., Negrini, R., Kim, E.-S., Crooijmans, R. P. M. A., Sonstegard, T. S., & Ajmone‐Marsan, P. (2020) · Scientific Reports · doi:10.1038/s41598-020-57880-4 · Cited by 76
BGVD: An Integrated Database for Bovine Sequencing Variations and Selective Signatures
Chen, N., Fu, W., Zhao, J., Shen, J., Chen, Q., Zheng, Z., Chen, H., Sonstegard, T. S., Lei, C., & Jiang, Y. (2020) · Genomics Proteomics & Bioinformatics · doi:10.1016/j.gpb.2019.03.007 · Cited by 78
Self-citationWang, W., Zhang, X., Zhou, X., Zhang, Y., La, Y., Zhang, Y., Li, C., Zhao, Y., Li, F., Liu, B., et al. (2019) · Frontiers in Genetics · doi:10.3389/fgene.2019.00300 · Cited by 75
Self-citationDiverging patterns of introgression from Schistosoma bovis across S. haematobium African lineages
Rey, O., Toulza, È., Chaparro, C., Allienne, J., Kincaid-Smith, J., Mathieu‐Bégné, E., Allan, F., Rollinson, D., Webster, B. L., & Boissier, J. (2021) · PLoS Pathogens · doi:10.1371/journal.ppat.1009313 · Cited by 68
Phylogenomics, biogeography, and adaptive radiation of grapes
Ma, Z., Wen, J., Ickert‐Bond, S. M., Nie, Z., Chen, L.-Q., & Liu, X. (2018) · Molecular Phylogenetics and Evolution · doi:10.1016/j.ympev.2018.08.021 · Cited by 64
Self-citationBuggiotti, L., Yurchenko, A. A., Yudin, N. S., Jagt, C. J. V., Vorobieva, N. V., Kusliy, M. A., Vasiliev, S. K., Rodionov, A. N., Boronetskaya, O. I., Zinovieva, N. A., et al. (2021) · Molecular Biology and Evolution · doi:10.1093/molbev/msab078 · Cited by 64
Evolutionary origin of genomic structural variations in domestic yaks
Liu, X., Liu, W., Lenstra, J. A., Zheng, Z., Wu, X., Jiao, Y., Li, B., Yang, Y. P., Qiu, Q., Liu, H., et al. (2023) · Nature Communications · doi:10.1038/s41467-023-41220-x · Cited by 63
Self-citationAn atlas of CNV maps in cattle, goat and sheep
Huang, Y., Li, Y., Wang, X., Yu, J., Cai, Y., Zheng, Z., Li, R., Zhang, S., Chen, N., Nanaei, H. A., et al. (2021) · Science China Life Sciences · doi:10.1007/s11427-020-1850-x · Cited by 62
Self-citationAncient Genomes Reveal the Evolutionary History and Origin of Cashmere-Producing Goats in China
Cai, Y., Fu, W., Cai, D., Heller, R., Zheng, Z., Wen, J., Li, H., Wang, X., Alshawi, A., Sun, Z., et al. (2020) · Molecular Biology and Evolution · doi:10.1093/molbev/msaa103 · Cited by 61
Self-citationGenomic variants identified from whole-genome resequencing of indicine cattle breeds from Pakistan
Iqbal, N., Liu, X., Yang, T., Huang, Z., Hanif, Q., Asif, M., Khan, Q. M., & Mansoor, S. (2019) · PLoS ONE · doi:10.1371/journal.pone.0215065 · Cited by 58
Li, C., Wu, Y., Chen, B., Cai, Y., Guo, J., Leonard, A. S., Kalds, P., Zhou, S., Zhang, J., Zhou, P., et al. (2022) · Molecular Biology and Evolution · doi:10.1093/molbev/msac253 · Cited by 62
Self-citationYak Domestication: A Review of Linguistic, Archaeological, and Genetic Evidence
Jacques, G., Guedes, J. D., & Zhang, S. (2021) · Ethnobiology Letters · doi:10.14237/ebl.12.1.2021.1755 · Cited by 57
Xia, X., Zhang, F., Li, S., Luo, X., Peng, L., Dong, Z., Pausch, H., Leonard, A. S., Crysnanto, D., Wang, S., et al. (2023) · Genome biology · doi:10.1186/s13059-023-03052-2 · Cited by 53
Self-citationWhole Genome Scan and Selection Signatures for Climate Adaption in Yanbian Cattle
Shen, J., Hanif, Q., Cao, Y., Yu, Y., Lei, C., Zhang, G., & Zhao, Y. (2020) · Frontiers in Genetics · doi:10.3389/fgene.2020.00094 · Cited by 53
Self-citationChen, N., Ren, L., Du, L., Hou, J., Mullin, V. E., Wu, D., Zhao, X., Li, C., Huang, J.-H., Qi, X., et al. (2020) · Proceedings of the National Academy of Sciences · doi:10.1073/pnas.2011696117 · Cited by 50
Self-citationZhang, S., Yao, Z., Li, X., Zhang, Z., Liu, X., Yang, P., Chen, N., Xia, X., Lyu, S., Shi, Q., et al. (2022) · BMC Genomics · doi:10.1186/s12864-022-08645-y · Cited by 51
Self-citationRecent Selection and Introgression Facilitated High-Altitude Adaptation in Cattle
Lyu, Y., Wang, F., Cheng, H., Han, J., Dang, R., Xia, X., Wang, H., Zhong, J., Lenstra, J. A., Zhang, H., et al. (2024) · Science Bulletin · doi:10.1016/j.scib.2024.05.030 · Cited by 50
Self-citationGebrehiwot, N. Z., Strucken, E. M., Aliloo, H., Marshall, K., & Gibson, J. P. (2020) · BMC Genomics · doi:10.1186/s12864-020-07270-x · Cited by 50
Comprehensive analysis of the mitochondrial DNA diversity in Chinese cattle
Xia, X., Qu, K., Zhang, G., Jia, Y., Ma, Z., Zhao, X., Huang, Y., Chen, H., Huang, B., & Lei, C. (2019) · Animal Genetics · doi:10.1111/age.12749 · Cited by 48
Self-citationPérez-Pardal, L., Sánchez-Gracia, A., Álvarez, I., Traoré, A., Ferraz, J. B. S., Fernández, I., Costa, V., Chen, S., Tapio, M., Cantet, R. J. C., et al. (2018) · Scientific Reports · doi:10.1038/s41598-018-36444-7 · Cited by 45
Paleogenomics of Animal Domestication
Irving-Pease, E. K., Ryan, H., Jamieson, A., Dimopoulos, E. A., Larson, G., & Frantz, L. (2018) · Population genomics · doi:10.1007/13836_2018_55 · Cited by 50
Global dispersal and adaptive evolution of domestic cattle: a genomic perspective
Xia, X., Qu, K., Wang, Y., Sinding, M. S., Wang, F., Hanif, Q., Ahmed, Z., Lenstra, J. A., Han, J., Lei, C., et al. (2023) · Stress Biology · doi:10.1007/s44154-023-00085-2 · Cited by 49
Self-citationDai, X., Bian, P., Hu, D., Luo, F., Huang, Y., Jiao, S., Wang, X., Gong, M., Li, R., Cai, Y., et al. (2023) · Genome Research · doi:10.1101/gr.277481.122 · Cited by 43
Self-citationNaval-Sánchez, M., Porto-Neto, L. R., Cardoso, D. F., Hayes, B. J., Daetwyler, H. D., Kijas, J., & Reverter, A. (2020) · Genetics Selection Evolution · doi:10.1186/s12711-020-00546-6 · Cited by 43
Ward, J. A., McHugo, G. P., Dover, M. J., Hall, T. J., Ng’ang’a, S. I., Sonstegard, T. S., Bradley, D. G., Frantz, L., Salter‐Townshend, M., & MacHugh, D. E. (2022) · iScience · doi:10.1016/j.isci.2022.104672 · Cited by 45
Self-citationGenome analyses revealed genetic admixture and selection signatures in Bos indicus
Dixit, S. P., Bhatia, A. K., Ganguly, I., Singh, S., Dash, S., Sharma, A., Anandkumar, N., Dang, A. K., & Jayakumar, S. (2021) · Scientific Reports · doi:10.1038/s41598-021-01144-2 · Cited by 43
Zhang, Y., Hu, Y., Wang, X., Jiang, Q., Zhao, H., Wang, J., Ju, Z., Yang, L., Gao, Y., Wei, X., et al. (2020) · Frontiers in Genetics · doi:10.3389/fgene.2019.01404 · Cited by 42
Genomic analyses reveal distinct genetic architectures and selective pressures in buffaloes
Sun, T., Shen, J., Achilli, A., Chen, N., Chen, Q., Dang, R., Zheng, Z., Zhang, H., Zhang, X., Wang, S., et al. (2020) · GigaScience · doi:10.1093/gigascience/giz166 · Cited by 43
Self-citationEvidence for early domestic yak, taurine cattle, and their hybrids on the Tibetan Plateau
Chen, N., Zhang, Z., Hou, J., Chen, J., Gao, X., Tang, L., Wangdue, S., Zhang, X., Sinding, M. S., Liu, X., et al. (2023) · Science Advances · doi:10.1126/sciadv.adi6857 · Cited by 44
Self-citationGenome-Wide SNP Discovery in Indigenous Cattle Breeds of South Africa
Zwane, A. A., Schnabel, R. D., Hoff, J. L., Choudhury, A., Makgahlela, M. L., Maiwashe, A., van Marle-Köster, E., & Taylor, J. F. (2019) · Frontiers in Genetics · doi:10.3389/fgene.2019.00273 · Cited by 41
Čubrić-Ćurik, V., Novosel, D., Brajković, V., Rota‐Stabelli, O., Krebs, S., Sölkner, J., Šalamon, D., Ristov, S., Berger, B., Trivizaki, S., et al. (2021) · Evolutionary Applications · doi:10.1111/eva.13315 · Cited by 42
Wang, Y., Huang, J., Li, E., Xu, S., Zhan, Z., Zhang, X., Yang, Z., Guo, F., Liu, K., Liu, D., et al. (2022) · Frontiers in Plant Science · doi:10.3389/fpls.2022.813177 · Cited by 40
Self-citationZhu, M., Yang, Y., Yang, H., Zhao, Z., Zhang, H., Blair, H. T., Zheng, W., Wang, M., Fang, C., Yu, Q., et al. (2023) · BMC Genomics · doi:10.1186/s12864-023-09479-y · Cited by 38
Self-citationChai, Z., Xin, J., Zhang, C., Dawayangla, Luosang, Zhang, Q., Pingcuozhandui, Li, C., Zhu, Y., Cao, H., et al. (2020) · BMC Evolutionary Biology · doi:10.1186/s12862-020-01702-8 · Cited by 42
Self-citationLiu, H., Zhou, J., Degen, A. A., Liu, H., Cao, X., Hao, L., Shang, Z., Ran, T., & Long, R. (2022) · Animal nutrition · doi:10.1016/j.aninu.2022.07.015 · Cited by 37
Cheng, H., Zhang, Z., Wen, J., Lenstra, J. A., Heller, R., Cai, Y., Guo, Y., Li, M., Li, R., Li, W., et al. (2023) · PLoS Genetics · doi:10.1371/journal.pgen.1010615 · Cited by 39
Self-citationZhang, D., 兰州大学草地农业科技学院, 草., Zhang, X., Li, F., Yuan, L., Li, X., Zhang, Y., Zhao, Y., Zhao, L.-M., Wang, J.-H., et al. (2022) · 动物学研究 · doi:10.24272/j.issn.2095-8137.2022.124 · Cited by 36
Self-citationBarrera‐Redondo, J., Piñero, D., & Eguiarte, L. E. (2020) · Frontiers in Genetics · doi:10.3389/fgene.2020.00742 · Cited by 36
Ruminant-specific retrotransposons shape regulatory evolution of bovine immunityPreprint
Kelly, C. J., Chitko-McKown, C. G., & Chuong, E. B. (2022) · Genome Research · doi:10.1101/gr.276241.121 · Cited by 38
Genetic diversity of Chinese cattle revealed by Y‐ SNP and Y‐ STR markers
Xia, X., Yao, Y., Li, C., Zhang, F., Qu, K., Chen, H., Huang, B., & Lei, C. (2018) · Animal Genetics · doi:10.1111/age.12742 · Cited by 34
Self-citationWhole‐genome resequencing reveals diversity, global and local ancestry proportions in Yunling cattle
Chen, Q., Zhan, J., Shen, J., Qu, K., Hanif, Q., Liu, J., Zhang, J., Chen, N., Chen, H., Huang, B., et al. (2020) · Journal of Animal Breeding and Genetics · doi:10.1111/jbg.12479 · Cited by 34
Self-citationTrajectory of livestock genomics in South Asia: A comprehensive review
Panigrahi, M., Kumar, H., Saravanan, K. A., Rajawat, D., Nayak, S. S., Ghildiyal, K., Kaisa, K., Parida, S., Bhushan, B., & Dutt, T. (2022) · Gene · doi:10.1016/j.gene.2022.146808 · Cited by 38
The Genomic Natural History of the Aurochs
Rossi, C., Sinding, M.-H. S., Mullin, V. E., Scheu, A., Erven, J. A. M., Verdugo, M. P., Daly, K. G., Ciucani, M. M., Mattiangeli, V., Teasdale, M. D., et al. (2024) · Nature · doi:10.1038/s41586-024-08112-6 · Cited by 32
Self-citationGebrehiwot, N. Z., Strucken, E. M., Marshall, K., Aliloo, H., & Gibson, J. P. (2021) · Genetics Selection Evolution · doi:10.1186/s12711-021-00615-4 · Cited by 34
Nanaei, H. A., 西北农林科技大学动物科技学院, 陕. 杨. 7., Cai, Y., Alshawi, A., Wen, J., Hussain, T., Fu, W., Xu, N., Essa, A., Lenstra, J. A., et al. (2022) · 动物学研究 · doi:10.24272/j.issn.2095-8137.2022.242 · Cited by 39
Self-citationAdmixture in Mammals and How to Understand Its Functional Implications
Fontsere, C., de Manuel, M., Marquès‐Bonet, T., & Kuhlwilm, M. (2019) · BioEssays · doi:10.1002/bies.201900123 · Cited by 29
Cheng, J., Zhao, H., Chen, N., Cao, X., Hanif, Q., Pi, L., Hu, L., Chaogetu, B., Huang, Y., Lan, X., et al. (2020) · BMC Genomics · doi:10.1186/s12864-020-06925-z · Cited by 32
Self-citationSenczuk, G., Guerra, L., Mastrangelo, S., Campobasso, C., Kaouadji, Z., Meghelli, I., Marletta, D., Kusza, S., Karslı, T., Gaouar, S. B. S., et al. (2020) · Genes · doi:10.3390/genes11080932 · Cited by 34
Abdelmanova, A. S., Kharzinova, V. R., Volkova, V. V., Mishina, A. I., Dotsev, A. V., Sermyagin, А. А., Boronetskaya, O., Petrikeeva, L. V., Chinarov, R. Y., Brem, G., et al. (2020) · Genes · doi:10.3390/genes11080940 · Cited by 32
Xia, X., Achilli, A., Lenstra, J. A., Tong, B., Ma, Y., Huang, Y., Han, J., Sun, Z., Chen, H., Lei, C., et al. (2021) · Heredity · doi:10.1038/s41437-021-00428-7 · Cited by 33
Self-citationHypoxia Inducible Factor pathway proteins in high-altitude mammals
Lee, F. S. (2023) · Trends in Biochemical Sciences · doi:10.1016/j.tibs.2023.11.002 · Cited by 31
Foley, N. M., Harris, A. J., Bredemeyer, K. R., Ruedi, M., Puechmaille, S. J., Teeling, E. C., Criscitiello, M. F., & Murphy, W. J. (2024) · Cell Genomics · doi:10.1016/j.xgen.2023.100482 · Cited by 31
Abundant Genetic Diversity of Yunling Cattle Based on Mitochondrial Genome
Xia, X., Qu, K., Li, F., Jia, P., Chen, Q., Chen, N., Zhang, J., Chen, H., Huang, B., & Lei, C. (2019) · Animals · doi:10.3390/ani9090641 · Cited by 33
Self-citationJiang, F., Lin, R., Xiao, C., Xie, T., Jiang, Y., Chen, J., Ni, P., Sung, W.-K. K., Han, J., Du, X., et al. (2021) · Genetics Selection Evolution · doi:10.1186/s12711-021-00627-0 · Cited by 32
Self-citationProfiling the immune epigenome across global cattle breeds
Powell, J., Talenti, A., Fisch, A., Hemmink, J. D., Paxton, E. A., Toye, P. G., Santos, I. K. F. D. M., Ferreira, B. R., Connelley, T., Morrison, L. J., et al. (2023) · Genome biology · doi:10.1186/s13059-023-02964-3 · Cited by 31
Xu, L., Zhu, B., Wang, Z., Xu, L., Liu, Y., Chen, Y., Zhang, L., Gao, X., Gao, H., Zhang, S., et al. (2019) · Animals · doi:10.3390/ani9030083 · Cited by 30
Self-citationXu, S., Akhatayeva, Z., Liu, J., Feng, X., Yu, Y., Badaoui, B., Esmailizadeh, A., Kantanen, J., Amills, M., Lenstra, J. A., et al. (2024) · Science China Life Sciences · doi:10.1007/s11427-024-2744-4 · Cited by 32
A SNP in PLAG1 is associated with body height trait in Chinese cattle
Hou, J., Qu, K., Jia, P., Hanif, Q., Zhang, J., Chen, N., Dang, R., Chen, H., Huang, B., & Lei, C. (2019) · Animal Genetics · doi:10.1111/age.12872 · Cited by 29
Self-citationAssociation of HSF1 Genetic Variation with Heat Tolerance in Chinese Cattle
Rong, Y., Zeng, M., Guan, X., Qu, K., Liu, J., Zhang, J., Chen, H., Huang, B., & Lei, C. (2019) · Animals · doi:10.3390/ani9121027 · Cited by 35
Self-citationPRLH and SOD 1 gene variations associated with heat tolerance in Chinese cattle
Zeng, L., Chen, N., Ning, Q., Yao, Y., Chen, H., Dang, R., Zhang, H., & Lei, C. (2018) · Animal Genetics · doi:10.1111/age.12702 · Cited by 29
Self-citationBarbato, M., Reichel, M. P., Passamonti, M. M., Low, W. Y., Colli, L., Tearle, R. G., Williams, J. L., & Ajmone‐Marsan, P. (2020) · PLoS ONE · doi:10.1371/journal.pone.0231162 · Cited by 27
Origins, timing and introgression of domestic geese revealed by whole genome data
Wen, J., Li, H., Wang, H., Yu, J., Zhu, T., Zhang, J., Li, X., Jiang, Z., Ning, Z., & Qu, L. (2023) · Journal of Animal Science and Biotechnology/Journal of animal science and biotechnology · doi:10.1186/s40104-022-00826-9 · Cited by 28
Discovery of Genomic Characteristics and Selection Signatures in Southern Chinese Local Cattle
Liu, Y., Xu, L., Yang, L., Zhao, G., Li, J., Liu, D., & Li, Y. (2020) · Frontiers in Genetics · doi:10.3389/fgene.2020.533052 · Cited by 27
Self-citationHuang, N., Zhao, L., Wang, J., Jiang, Q., Ju, Z., Wang, X., Yang, C., Gao, Y., Wei, X., Zhang, Y., et al. (2023) · Journal of Animal Science · doi:10.1093/jas/skad006 · Cited by 26
Felkel, S., Wallner, B., Battsetseg, C., Yadamsuren, A., Faye, B., Brem, G., Walzer, C., & Burger, P. A. (2019) · Frontiers in Genetics · doi:10.3389/fgene.2019.00423 · Cited by 25
Jiang, L., Kon, T., Chen, C., Ichikawa, R., Zheng, Q., Pei, L., Takemura, I., Nsobi, L. H., Tabata, H., Pan, H., et al. (2021) · Scientific Reports · doi:10.1038/s41598-021-96896-2 · Cited by 26
Nijman, I. J., Rosen, B. D., Bardou, P., Faraut, T., Cumer, T., Daly, K. G., Zheng, Z., Cai, Y., Nanaei, H. A., Kul, B. Ç., et al. (2022) · Molecular Ecology · doi:10.1111/mec.16579 · Cited by 25
Self-citationLiu, H., Li, Z., Pei, C., Degen, A. A., Hao, L., Cao, X., Liu, H., Zhou, J., & Long, R. (2022) · Animal Feed Science and Technology · doi:10.1016/j.anifeedsci.2022.115395 · Cited by 28
Comparative analysis of carcass traits and meat quality in indigenous Chinese cattle breeds
Ge, F., Li, J., Gao, H., Wang, X., Zhang, X., Gao, H., Zhang, L., Xu, L., Gao, X., Zhu, B., et al. (2023) · Journal of Food Composition and Analysis · doi:10.1016/j.jfca.2023.105645 · Cited by 25
Self-citationZhou, Q., Karunarathne, P., Li, L., Chen, C., Opgenoorth, L., Heer, K., Vendramin, G. G., Piotti, A., Николаевна, Н. Е., Lascoux, M., et al. (2024) · Molecular Ecology · doi:10.1111/mec.17495 · Cited by 26
Genomic insights into ruminant evolution: from past to future prospects
Wang, B., Chen, L., & Wang, W. (2019) · 动物学研究 · doi:10.24272/j.issn.2095-8137.2019.061 · Cited by 27
Genetic Diversity and Selective Signature in Dabieshan Cattle Revealed by Whole-Genome Resequencing
Guan, X., Zhao, S., Xiang, W., Jin, H., Chen, N., Lei, C., Jia, Y., & Xu, L. (2022) · Biology · doi:10.3390/biology11091327 · Cited by 25
Self-citationLi, G., Luo, J., Wang, F., Xu, D., Ahmed, Z., Chen, S., Li, R., & Ma, Z. (2023) · Frontiers in Genetics · doi:10.3389/fgene.2022.1034094 · Cited by 26
Self-citationGinja, C., Guimarães, S. M. F., da Fonseca, R. R., Rasteiro, R., Rodríguez-Varela, R., Simões, L. G., Sarmento, C. D., Belarte, M. C., Kallala, N., Torres, J. R., et al. (2023) · iScience · doi:10.1016/j.isci.2023.107196 · Cited by 27
The evolution of contemporary livestock species: Insights from mitochondrial genome
Jain, K., Panigrahi, M., Nayak, S. S., Rajawat, D., Sharma, A., Sahoo, S. P., Bhushan, B., & Dutt, T. (2024) · Gene · doi:10.1016/j.gene.2024.148728 · Cited by 25
Four Novel SNPs of MYO1A Gene Associated with Heat-Tolerance in Chinese Cattle
Jia, P., Cai, C., Qu, K., Chen, N., Jia, Y., Hanif, Q., Liu, J., Zhang, J., Chen, H., Huang, B., et al. (2019) · Animals · doi:10.3390/ani9110964 · Cited by 25
Self-citationInference of Admixture Origins in Indigenous African Cattle
Kim, K., Kim, D., Hanotte, O., Lee, C., Kim, H., & Jeong, C. (2023) · Molecular Biology and Evolution · doi:10.1093/molbev/msad257 · Cited by 24
Liu, X., Li, Z., Yan, Y., Li, Y., Wu, H., Pei, J., Yan, P., Yang, R., Guo, X., & Lan, X. (2021) · Evolutionary Applications · doi:10.1111/eva.13168 · Cited by 23
Self-citationWhole genome analyses revealed genomic difference between European taurine and East Asian taurine
Chen, Q., Shen, J., Hanif, Q., Chen, N., Huang, Y., Dang, R., Lan, X., Chen, H., & Lei, C. (2020) · Journal of Animal Breeding and Genetics · doi:10.1111/jbg.12501 · Cited by 23
Self-citationWang, X., Ju, Z., Jiang, Q., Zhong, J., Liu, C., Wang, J., Hoff, J. L., Schnabel, R. D., Zhao, H., Gao, Y., et al. (2021) · Genomics · doi:10.1016/j.ygeno.2021.03.023 · Cited by 23
Ma, X., Cheng, H., Liu, Y., Sun, L., Chen, N., Jiang, F., You, W., Yang, Z., Zhang, B., Song, E., et al. (2022) · Animals · doi:10.3390/ani12050665 · Cited by 23
Self-citationWhole genome sequencing of simmental cattle for SNP and CNV discovery
Sun, T., Pei, S., Liu, Y., Hanif, Q., Xu, H., Chen, N., Lei, C., & Yue, X. (2023) · BMC Genomics · doi:10.1186/s12864-023-09248-x · Cited by 23
Self-citation
Metadata
- Authors
- Chen, N., Cai, Y., Chen, Q., Li, R., Wang, K., Huang, Y., Hu, S., Huang, S., Zhang, H., Zheng, Z., Song, W., Ma, Z., Ma, Y., Dang, R., Zhang, Z., Xu, L., Jia, Y., Liu, S., Yue, X., Deng, W., Zhang, X., Sun, Z., Lan, X., Han, J., Chen, H., Bradley, D. G., Jiang, Y., & Lei, C.
- Affiliations
- Northwest A&F University (CN)
- Northwestern Polytechnical University (CN)
- Yunnan University (CN)
- Qinghai University (CN)
- Ningxia University (CN)
- Henan Academy of Agricultural Sciences (CN)
- Anhui Academy of Agricultural Sciences (CN)
- National Beef Cattle Industrial Technology System (CN)
- State Key Laboratory of Herbage Improvement and Grassland Agro-ecosystems (CN)
- Yunnan Agricultural University (CN)
- Kunming Institute of Zoology (CN)
- Chinese Academy of Agricultural Sciences (CN)
- Trinity College Dublin (IE)
- Corresponding author
- Jiang, Yu
- Lei, Chuzhao
- ORCID
- Chen, Ningbo
- Cai, Yudong
- Chen, Qiuming
- Li, Ran
- Wang, Kun
- Huang, Yongzhen
- Hu, Songmei
- Huang, Shisheng
- Zhang, Hucai
- Zheng, Zhuqing
- Song, Weining
- Ma, Zhijie
- Dang, Ruihua
- Zhang, Zijing
- Xu, Lei
- Jia, Yutang
- Yue, Xiangpeng
- Deng, Weidong
- Zhang, Xiaoming
- Lan, Xianyong
- Han, Jianlin
- Chen, Hong
- Bradley, Daniel G
- Jiang, Yu
- Lei, Chuzhao
- Venue
- Nature Communications
- Published
- 2018-06-14
- Volume
- 9
- Issue
- 1
- Pages
- 2337-2337
- ISSN
- 2041-1723 (ISSN-L)
- PMC
- PMC6002414
- OpenAlex
- W2805177757
- Cited by
- 403
- References
- 60
- Citations by year
- 2026: 26 · 2025: 49 · 2024: 66 · 2023: 56 · 2022: 52 · 2021: 74 · 2020: 38 · 2019: 29 · 2018: 12
- FWCI
- 23.77
- Type
- journal article
- Language
- en
- Open access
- gold
- doi.org
- Locations
- Nature Communications (publishedVersion, cc-by)
- Europe PMC (PubMed Central) (publishedVersion, cc-by)
- PubMed Central (publishedVersion, cc-by)
- PubMed (publishedVersion)
- Lanzhou University Institutional Repository (submittedVersion)
- RePEc: Research Papers in Economics (submittedVersion)
- CGSPace A Repository of Agricultural Research Outputs (Consultative Group for International Agricultural Research) (submittedVersion, cc-by)
- DOAJ (DOAJ: Directory of Open Access Journals) (submittedVersion)
- DOAJ (DOAJ: Directory of Open Access Journals) (submittedVersion, cc-by-sa)
- Trinity's Access to Research Output (TARA) (Trinity College Dublin) (submittedVersion)
- Funders
- Natural Science Foundation of Qinghai Province of China
- National Natural Science Foundation of China (31501918)
- Yunnan Modern Agriculture Beef Cattle Industry Technology System
- National Thousand Youth Talents Plan
- National Beef Cattle and Yak Industrial Technology System
- Topics
- Life Sciences › Biochemistry, Genetics and Molecular Biology › Genetics › Genetic and phenotypic traits in livestock
- Life Sciences › Biochemistry, Genetics and Molecular Biology › Genetics › Genetic diversity and population structure
- Life Sciences › Biochemistry, Genetics and Molecular Biology › Genetics › Forensic and Genetic Research
- Keywords
- cattle domestication, population ancestry, adaptive introgression, banteng, yak, Y-chromosome haplotypes
- MeSH terms
- Domestication, Animals, Breeding, Cattle, China, Chromosomes, Female, Genetics, Population, Geography, Haplotypes, Male, Mitochondria, Phylogeny, Species Specificity, Genetic Variation, Models, Statistical, Genome, Tibet, Polymorphism, Single Nucleotide
About these checks
Registry, retraction, Cites and statistics results are computed, not judged, with one exception: a printed reference that no index lists is read once by a model before it counts as a citation error. Claims are extracted by a model and kept only when their quote appears verbatim in the text; each cited source is then checked, with a model’s help, for whether it says what the claim relies on. Those verdicts can be wrong — read the claim’s quote and the cited source before relying on one.
Statistics and arithmetic are recomputed, not judged.
Confidence bands are shown only for fields calibrated on our annotated test set. None is calibrated yet, so no band is shown.
What counts as a claim ›How we measure confidence ›How we check this ›
Are you an author, or do you see a problem with this page? Request a review
