

The DOI matches its Crossref record; 46 of the 46 references it cites were found in a registry or an index; 34 of the 39 sources its claims cite were checked for support.
TMEM55B links autophagy flux, lysosomal repair, and TFE3 activation in response to oxidative stress
Open accessAbstract
Lysosomes have emerged as critical regulators of cellular homeostasis. Here we show that the lysosomal protein TMEM55B contributes to restore cellular homeostasis in response to oxidative stress by three different mechanisms: (1) TMEM55B mediates NEDD4-dependent PLEKHM1 ubiquitination, causing PLEKHM1 proteasomal degradation and halting autophagosome/lysosome fusion; (2) TMEM55B promotes recruitment of components of the ESCRT machinery to lysosomal membranes to stimulate lysosomal repair; and (3) TMEM55B sequesters the FLCN/FNIP complex to facilitate translocation of the transcription factor TFE3 to the nucleus, allowing expression of transcriptional programs that enable cellular adaptation to stress. Knockout of tmem55 genes in zebrafish embryos increases their susceptibility to oxidative stress, causing early death of tmem55-KO animals in response to arsenite toxicity. Altogether, our work identifies a role for TMEM55B as a molecular sensor that coordinates autophagosome degradation, lysosomal repair, and activation of stress responses.
Overview
AI snapshot
Written from the paper’s full text.
TL;DR
TMEM55B acts as a lysosomal sensor that, under acute oxidative stress, coordinates three responses: halting autophagosome–lysosome fusion via NEDD4-dependent PLEKHM1 degradation, promoting ESCRT-mediated lysosomal repair, and activating TFE3 by sequestering FLCN/FNIP. Zebrafish tmem55-knockout embryos show increased susceptibility to arsenite, supporting an in vivo protective role.
Key findings
- Under NaAsO2 (300 μM, 2 h), TMEM55B recruits NEDD4-like E3 ligases via a PPXY motif; TMEM55B is ubiquitinated at seven CD-domain sites (K96, K103, K114, K120, K121, K134, K148), and phosphorylation at S162 increases from 6.98% to almost 30%.
- TMEM55B binds PLEKHM1 via its PH1 domain under oxidative stress, causing NEDD4-dependent PLEKHM1 ubiquitination and proteasomal degradation (blocked by MG132, not bafilomycin A1), which reduces autophagosome/lysosome fusion.
- TMEM55B promotes ESCRT recruitment to lysosomes through both PPXY and P(S/T)AP motifs; TMEM55B-KO cells show higher galectin3 accumulation after 6 h NaAsO2 and significantly more necrosis after 10 h NaAsO2.
- TMEM55B sequesters FLCN/FNIP under NaAsO2, promoting TFE3 nuclear translocation and TFE3-S321 dephosphorylation; tmem55-KO zebrafish embryos have lower survival under continuous 2 mM NaAsO2 (logrank test, P < 0.0001).
Methods
- U2OS and HeLa cells with CRISPR/Cas9 TMEM55B knockout, siRNA depletion, plasmid/adenovirus expression, drug treatments (including NaAsO2 300 μM), immunoprecipitation, immunoblotting, immunofluorescence, flow cytometry, and mass spectrometry.
- Zebrafish: multiplex CRISPR/Cas9 targeting tmem55ba and tmem55bb, plus gRNAs against tmem55a; embryos treated with 2 mM NaAsO2 from 1 dpf, with survival analyzed by Kaplan-Meier curves.
- Statistics: Student’s t test, one-way or two-way ANOVA, and logrank tests; data presented as mean ± SEM, with experiments performed at least three times independently unless otherwise noted.
Limitations
- Stated in the paper: no statistical method was used to predetermine sample size; no data were excluded; experiments were not randomized; investigators were not blinded to allocation during experiments and outcome assessment.
- Evident from the text: mechanistic dissection relies mainly on U2OS/HeLa cell lines and zebrafish, with no mammalian in vivo model because TMEM55B depletion in mice was previously shown to be embryonic lethal.
- Evident from the text: several key interactions were specific to NaAsO2 or high-ROS inducers, so the generality of the proposed TMEM55B stress-response axis across other oxidative stresses remains to be established.
Model-written summary. Check it against the paper before relying on it.
Integrity signals
Registry
Cites
Statistics
Figures
Verification
Claims the paper makes
82 Own result · 32 Own interpretation · 15 Own method · 11 Supported · 9 Partly supported · 4 No basis given · 3 No full text of the sources · 1 Not checked yet · accuracy not yet measured
Every source the paper cites for this claim was checked and supports it.
In the paper
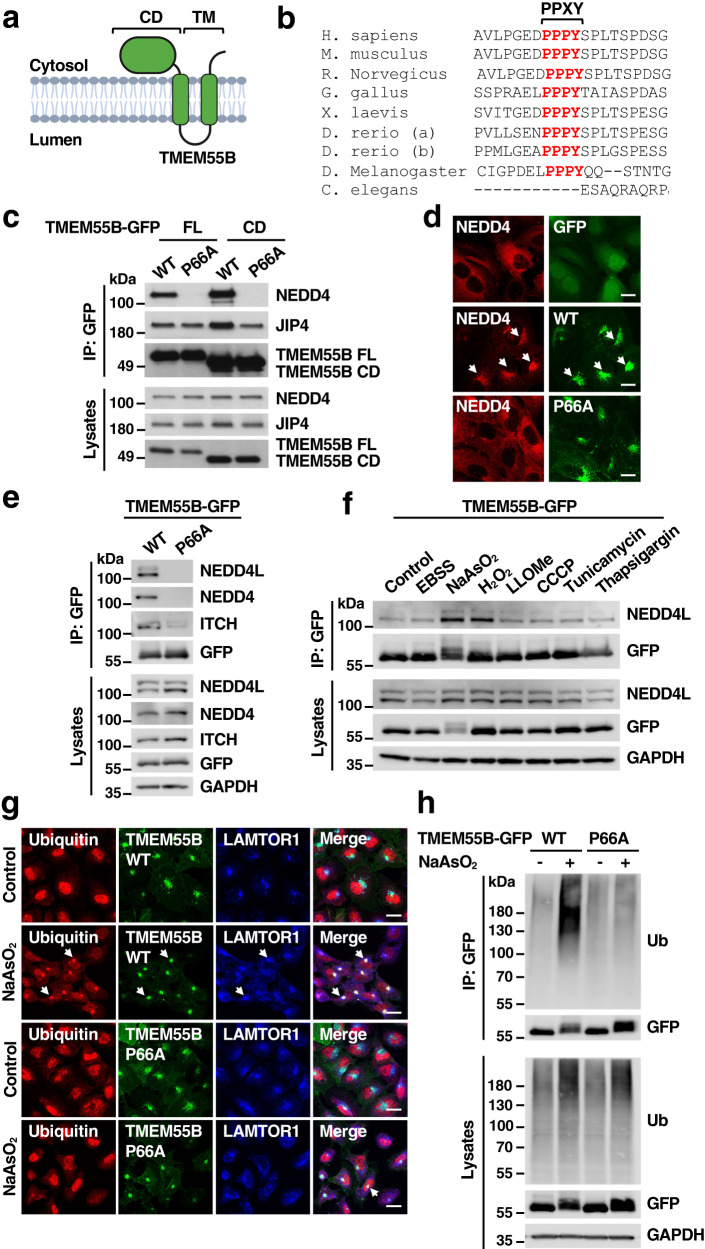
“As we have previously described, expression of recombinant TMEM55B induced lysosomal clustering in the perinuclear region (Fig. 1g)7.”
§ TMEM55B links autophagy flux, lysosomal repair, and TFE3 activation in response to oxidative stress > Results > TMEM55B is ubiquitinated in response to oxidative stress
What the sources say
- Supportedcites [7] Willett, R. et al. TFEB regulates lysosomal positioning by modulating TMEM55B expression and JIP4 recruitment to lysosomes. Nat. Commun. 8, 1580 (2017). source
The Results section (“TMEM55B promotes lysosomal retrograde transport”) reports that overexpressing GFP-TMEM55B changed lysosomes from dispersed throughout the cell to tightly clustered at the cell center. The Methods section (“Recombinant DNA constructs”) identifies GFP-TMEM55B as an expression construct, supporting the claim’s description of recombinant TMEM55B. (LLM, conf=0.94)
plaindirect- Asserted: passes — The authors put it forward as true.
- Checkable: passes — It can be checked against evidence.
- Load-bearing: unclear — It is unclear whether the paper’s conclusions depend on it.
- Based: passes — The paper gives a reason why it holds.
- Supported
Every source the paper cites for this claim was checked and supports it.
In the paper
“Our laboratory previously identified TMEM55B as an important regulator of lysosomal positioning.”
§ TMEM55B links autophagy flux, lysosomal repair, and TFE3 activation in response to oxidative stress > Introduction
What the sources say
- Supportedcites [7] Willett, R. et al. TFEB regulates lysosomal positioning by modulating TMEM55B expression and JIP4 recruitment to lysosomes. Nat. Commun. 8, 1580 (2017). source
In Results, under “TMEM55B promotes lysosomal retrograde transport,” the authors report that TMEM55B depletion caused significant accumulation of lysosomes at the cell periphery and conclude that TMEM55B plays a role in determining lysosome positioning. They also report that TMEM55B overexpression repositioned lysosomes toward the cell center. (LLM, conf=0.94)
plaindirect- Asserted: passes — The authors put it forward as true.
- Checkable: passes — It can be checked against evidence.
- Load-bearing: passes — The paper’s conclusions depend on it.
- Based: passes — The paper gives a reason why it holds.
- Supported
Every source the paper cites for this claim was checked and supports it.
In the paper
“Paradoxically, treatment with NaAsO2 causes robust JIP4-dependent clustering of lysosomes at the cell center7.”
§ TMEM55B links autophagy flux, lysosomal repair, and TFE3 activation in response to oxidative stress > Discussion
What the sources say
- Supportedcites [7] Willett, R. et al. TFEB regulates lysosomal positioning by modulating TMEM55B expression and JIP4 recruitment to lysosomes. Nat. Commun. 8, 1580 (2017). source
The Results section (“MAPK-dependent regulation of the TMEM55B/JIP4 pathway”) reports that NaAsO2 increased lysosomal transport toward the cell center and that NaAsO2-induced clustering was inhibited in JIP4-depleted MEFs. It also reports JIP4-dependent transport in response to NaAsO2 in U2OS cells. (LLM, conf=0.94)
plaindirect- Asserted: passes — The authors put it forward as true.
- Checkable: passes — It can be checked against evidence.
- Load-bearing: unclear — It is unclear whether the paper’s conclusions depend on it.
- Based: passes — The paper gives a reason why it holds.
- Supported
Every source the paper cites for this claim was checked and supports it.
In the paper
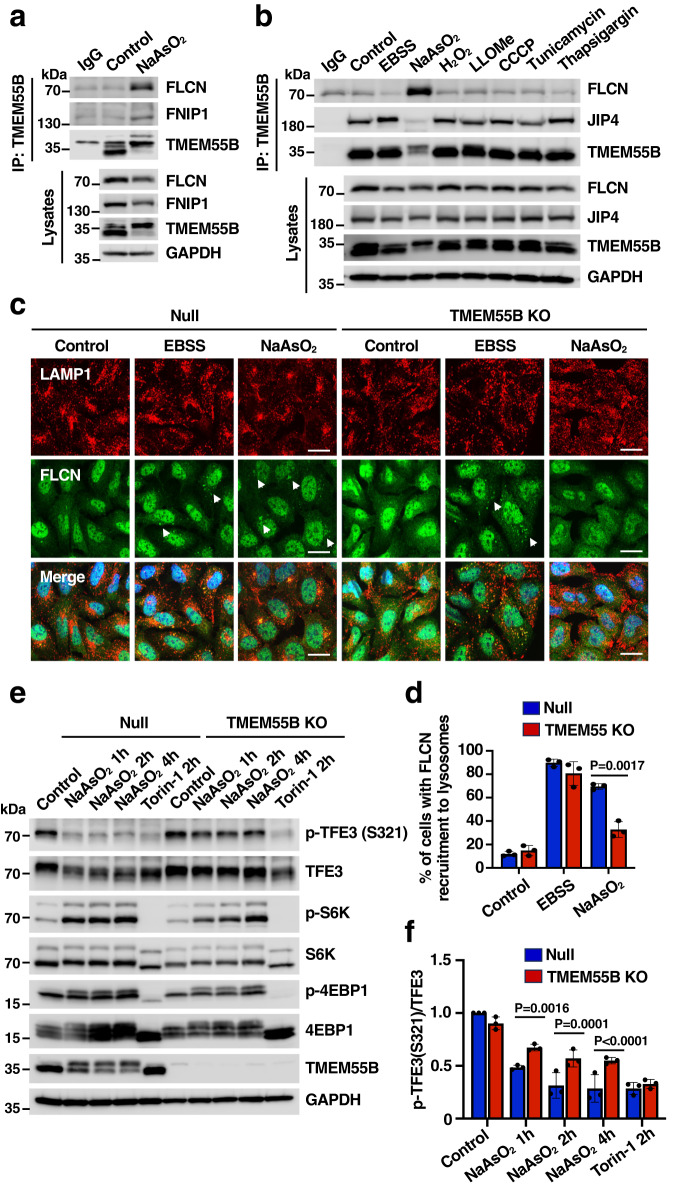
“Accordingly, dephosphorylation of TFE3-S321, which is required for the dissociation of the TFE3/14-3-3 complex and consequent TFE3 nuclear translocation31, was inhibited in TMEM55B-KO cells in response to NaAsO2 but not Torin-1 (Fig. 7d, e).”
§ TMEM55B links autophagy flux, lysosomal repair, and TFE3 activation in response to oxidative stress > Results > TMEM55B sequesters folliculin to induce TFE3 activation
What the sources say
- Supportedcites [31] Martina, J. A. et al. The nutrient-responsive transcription factor TFE3 promotes autophagy, lysosomal biogenesis, and clearance of cellular debris. Sci. Signal. 7, ra9 (2014). source
The Results section (‘mTORC1 promotes retention of TFE3 in the cytosol’) reports that Torin-1 abolished TFE3–14-3-3 binding and that a TFE3-S321A mutation prevented binding and led to nuclear accumulation. This supports the mechanism attributed to this source. The TMEM55B-KO comparison is presented as the citing paper’s own finding (Fig. 7d, e), not as a finding from this source. (LLM, conf=0.86)
plaindirect- Asserted: passes — The authors put it forward as true.
- Checkable: passes — It can be checked against evidence.
- Load-bearing: passes — The paper’s conclusions depend on it.
- Based: passes — The paper gives a reason why it holds.
- Supported
A result the paper reports from its own data — it cites no other source for it, so there is none to check. The quote shows it is in the paper.
In the paper
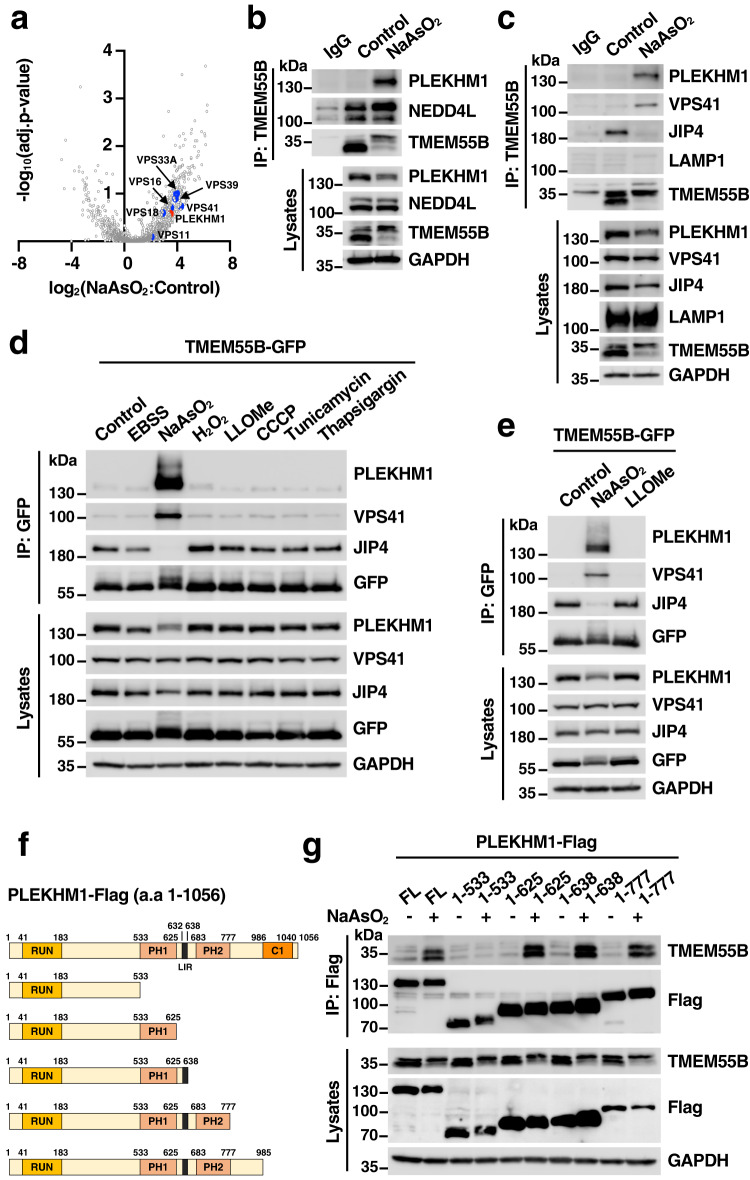
“Very unexpected was the observation that the interaction between TMEM55B and JIP4 was disrupted by NaAsO2”
§ TMEM55B links autophagy flux, lysosomal repair, and TFE3 activation in response to oxidative stress > Results > TMEM55B interacts with PLEKHM1 under oxidative stress
plaindirect- Asserted: passes — The authors put it forward as true.
- Checkable: passes — It can be checked against evidence.
- Load-bearing: passes — The paper’s conclusions depend on it.
- Based: passes — The paper gives a reason why it holds.
In the paper
“Furthermore, phosphorylation of ITCH at T222, a modification known to enhance its catalytic activity14, was observed following incubation with NaAsO2”
§ TMEM55B links autophagy flux, lysosomal repair, and TFE3 activation in response to oxidative stress > Results > TMEM55B interacts with NEDD4-like E3 ligases
What the sources say
- Not checked — no full text of the sourcecites [14] Gallagher, E., Gao, M., Liu, Y. C. & Karin, M. Activation of the E3 ubiquitin ligase Itch through a phosphorylation-induced conformational change. Proc. Natl. Acad. Sci. USA 103, 1717–1722 (2006). source
plaindirect- Asserted: passes — The authors put it forward as true.
- Checkable: passes — It can be checked against evidence.
- Load-bearing: passes — The paper’s conclusions depend on it.
- Based: passes — The paper gives a reason why it holds.
A result the paper reports from its own data — it cites no other source for it, so there is none to check. The quote shows it is in the paper.
In the paper
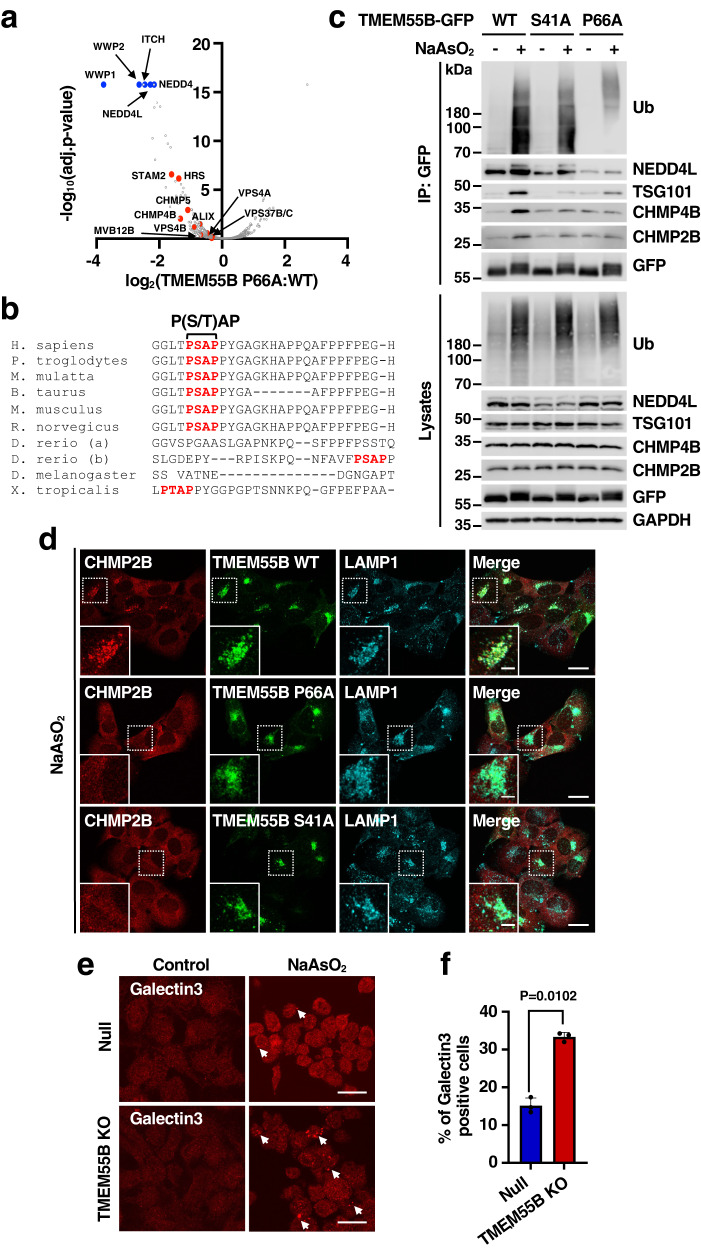
“Accumulation of ubiquitin in the perinuclear region following oxidative stress was much less noticeable in cells expressing TMEM55B-P66A-GFP (Fig. 1g and Supplementary Fig. 1m)”
§ TMEM55B links autophagy flux, lysosomal repair, and TFE3 activation in response to oxidative stress > Results > TMEM55B is ubiquitinated in response to oxidative stress
plain- Asserted: passes — The authors put it forward as true.
- Checkable: passes — It can be checked against evidence.
- Load-bearing: passes — The paper’s conclusions depend on it.
- Based: passes — The paper gives a reason why it holds.
- Rests on an assumption: NaAsO2 treatment induces oxidative stress as the relevant mechanism for the observed cellular effects.
A result the paper reports from its own data — it cites no other source for it, so there is none to check. The quote shows it is in the paper.
In the paper
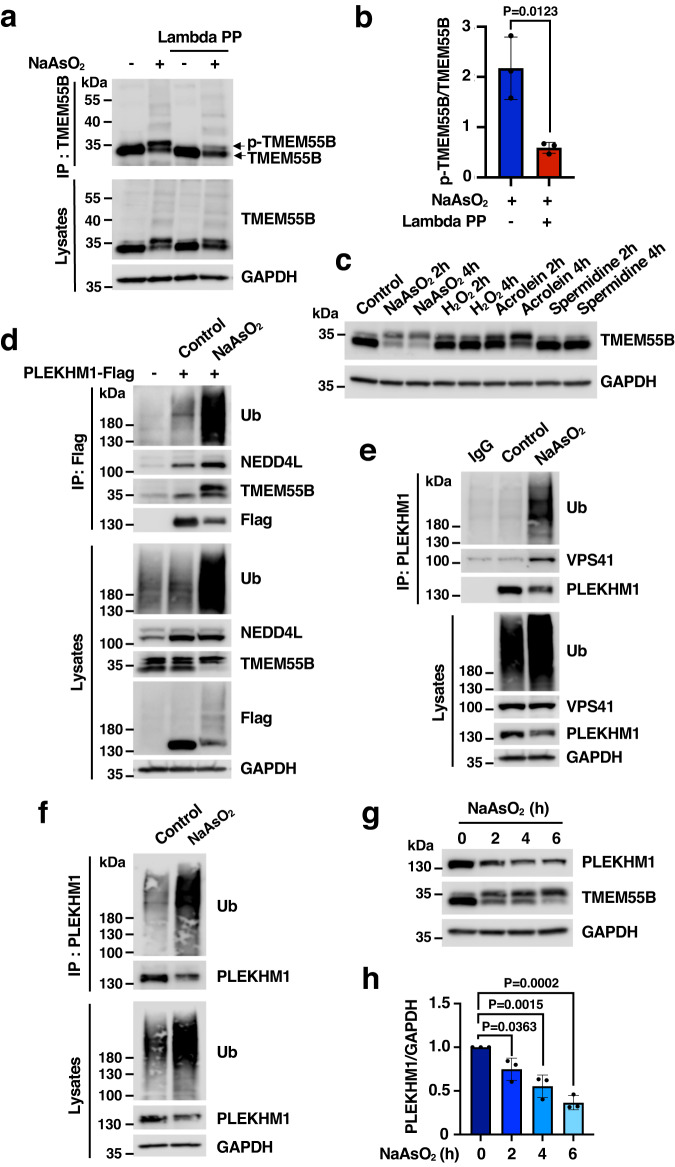
“Importantly, a significant reduction in the total levels of recombinant and endogenous PLEKHM1 was observed after incubation with NaAsO2 for 2 h”
§ TMEM55B links autophagy flux, lysosomal repair, and TFE3 activation in response to oxidative stress > Results > TMEM55B facilitates PLEKHM1 proteasomal degradation
plaindirect- Asserted: passes — The authors put it forward as true.
- Checkable: passes — It can be checked against evidence.
- Load-bearing: passes — The paper’s conclusions depend on it.
- Based: passes — The paper gives a reason why it holds.
A result the paper reports from its own data — it cites no other source for it, so there is none to check. The quote shows it is in the paper.
In the paper
“TMEM55B promotes recruitment of components of the ESCRT machinery to lysosomal membranes to stimulate lysosomal repair”
§ TMEM55B links autophagy flux, lysosomal repair, and TFE3 activation in response to oxidative stress > Abstract
plaindirect- Asserted: passes — The authors put it forward as true.
- Checkable: passes — It can be checked against evidence.
- Load-bearing: passes — The paper’s conclusions depend on it.
- Based: passes — The paper gives a reason why it holds.
A result the paper reports from its own data — it cites no other source for it, so there is none to check. The quote shows it is in the paper.
In the paper
“but also its ubiquitination, as assessed by blotting immunoprecipitated PLEKHM1-Flag with antibodies against ubiquitin and by the smeared bands detected by the Flag antibody in total lysates (Fig. 3d).”
§ TMEM55B links autophagy flux, lysosomal repair, and TFE3 activation in response to oxidative stress > Results > TMEM55B facilitates PLEKHM1 proteasomal degradation
plaindirect- Asserted: passes — The authors put it forward as true.
- Checkable: passes — It can be checked against evidence.
- Load-bearing: passes — The paper’s conclusions depend on it.
- Based: passes — The paper gives a reason why it holds.
- Probably not a substantial claim. 28
- It may state two separate claims as one. 51
- The quote only partly states this claim. 1
The cited sources support only part of this claim — read each source’s verdict below.
In the paper
“It is well established that the ESCRT complex interacts with proteins carrying P(S/T)AP and/or PPXY motifs. The P(S/T)AP domain binds to TSG101, which in turn binds ALIX20, while recruitment of NEDD4-E3 ligases via PPXY motifs, and subsequent protein ubiquitination, further facilitates the recruitment of the ESCRT machinery21.”
§ TMEM55B links autophagy flux, lysosomal repair, and TFE3 activation in response to oxidative stress > Results > TMEM55B promotes ESCRT recruitment to lysosomes
What the sources say
- Partly supportedcites [20] Sundquist, W. I. et al. Ubiquitin recognition by the human TSG101 protein. Mol. Cell 13, 783–789 (2004). sourceExperimental — accuracy not yet measured
The Results and Discussion describe TSG101 binding P(T/S)AP motifs and ubiquitin, potentially linking ESCRT-I to ubiquitylated cargo. The copy does not describe PPXY-mediated recruitment of NEDD4-E3 ligases or establish the claimed sequence from their recruitment through ubiquitination to ESCRT recruitment (searched: PPXY, NEDD4). The ALIX statement has a separate citation in the citing sentence. (LLM, conf=0.82)
- Partly supportedcites [21] Shields, S. B. et al. ESCRT ubiquitin-binding domains function cooperatively during MVB cargo sorting. J. Cell. Biol. 185, 213–224 (2009). sourceExperimental — accuracy not yet measured
The Introduction describes ESCRT components binding ubiquitinated cargo, supporting the general link between ubiquitination and ESCRT-mediated sorting. The Results and discussion also note that TSG101 interacts with PTAP motifs. Our copy does not describe PPXY-mediated recruitment of NEDD4-E3 ligases or TSG101 binding ALIX, so it does not support the claimed interaction chain. (LLM, conf=0.86)
boosteddirect- Asserted: passes — The authors put it forward as true.
- Checkable: passes — It can be checked against evidence.
- Load-bearing: passes — The paper’s conclusions depend on it.
- Based: passes — The paper gives a reason why it holds.
Probably not a substantial claim. It may state two separate claims as one.
- Partly supported
Every source the paper cites for this claim was checked and supports it.
In the paper
“TMEM55B is a lysosomal transmembrane protein that binds to the dynein adapter JIP4, thus promoting dynein-dynactin-dependent lysosomal trafficking to the perinuclear region7.”
§ TMEM55B links autophagy flux, lysosomal repair, and TFE3 activation in response to oxidative stress > Introduction
What the sources say
- Supportedcites [7] Willett, R. et al. TFEB regulates lysosomal positioning by modulating TMEM55B expression and JIP4 recruitment to lysosomes. Nat. Commun. 8, 1580 (2017). source
The Results section, “TMEM55B recruits JIP4 to lysosomal membranes,” reports binding between TMEM55B and JIP4 and concludes that TMEM55B recruits JIP4 to bring dynein–dynactin to lysosomes. The Results section, “TMEM55B promotes lysosomal retrograde transport,” reports that disrupting dynein–dynactin blocks TMEM55B-induced perinuclear lysosome clustering. The Discussion identifies TMEM55B as a lysosomal protein and JIP4 as a motor adapter. (LLM, conf=0.94)
plaindirect- Asserted: passes — The authors put it forward as true.
- Checkable: passes — It can be checked against evidence.
- Load-bearing: passes — The paper’s conclusions depend on it.
- Based: passes — The paper gives a reason why it holds.
It may state two separate claims as one.
- Supported
The cited sources support only part of this claim — read each source’s verdict below.
In the paper
“The Folliculin (FLCN)/Folliculin-interacting protein (FNIP) complex is a critical regulator of TFEB and TFE3 activation. By promoting GDP-loading of RAGC27, FLCN facilitates interaction of TFEB/TFE3 with RAGs, resulting in retention of the transcription factors in the cytosol28,29.”
§ TMEM55B links autophagy flux, lysosomal repair, and TFE3 activation in response to oxidative stress > Results > TMEM55B sequesters folliculin to induce TFE3 activation
What the sources say
- Supportedcites [27] Lawrence, R. E. et al. Structural mechanism of a Rag GTPase activation checkpoint by the lysosomal folliculin complex. Science 366, 971–977 (2019). source
The cited paper’s section on regulation of MiT/TFE factors reports that FLCN’s RagC-GAP activity is key to the cytoplasmic retention of TFEB and TFE3 under high-nutrient conditions. Its description of FLCN-stimulated RagC nucleotide hydrolysis supports the GDP-loading point attached to this citation. The intervening claim about direct TFEB/TFE3 interaction with Rags is attached to other citations in the citing sentence. (LLM, conf=0.91)
- Partly supportedcites [28] Martina, J. A. & Puertollano, R. Rag GTPases mediate amino acid-dependent recruitment of TFEB and MITF to lysosomes. J. Cell Biol. 200, 475–491 (2013). sourceExperimental — accuracy not yet measured
The Results section (“TFEB interacts with active Rags,” page unavailable) shows that TFEB binds active Rag heterodimers containing GDP-bound RagC, and the Introduction says this binding enables phosphorylation and cytosolic retention. Our copy does not establish that FLCN/FNIP promotes RagC GDP-loading or facilitates that interaction, and it studies MITF rather than TFE3. (LLM, conf=0.86)
- Partly supportedcites [29] Napolitano, G. et al. A substrate-specific mTORC1 pathway underlies Birt-Hogg-Dube syndrome. Nature 585, 597–602 (2020). sourceExperimental — accuracy not yet measured
In “TFEB phosphorylation requires active RagC/D” (page not available), the paper identifies FLCN as a RagC/D GAP and shows that GDP-bound RagC interacts with TFEB and promotes its cytoplasmic localization; active RagC/D also restores TFEB localization in FLCN-deficient cells. These passages support the proposed mechanism for TFEB, but do not establish the same Rag-interaction and cytosolic-retention mechanism for TFE3 or specifically test the FLCN/FNIP complex. (LLM, conf=0.85)
plaindirect- Asserted: passes — The authors put it forward as true.
- Checkable: passes — It can be checked against evidence.
- Load-bearing: passes — The paper’s conclusions depend on it.
- Based: passes — The paper gives a reason why it holds.
Probably not a substantial claim. It may state two separate claims as one.
- Supported
The cited sources support only part of this claim — read each source’s verdict below.
In the paper
“We and others have recently reported activation of TFEB and TFE3 in response to oxidative stress both in vivo and in vitro23–25, as well as their involvement in the expression of antioxidant genes26.”
§ TMEM55B links autophagy flux, lysosomal repair, and TFE3 activation in response to oxidative stress > Results > TMEM55B sequesters folliculin to induce TFE3 activation
What the sources say
- Partly supportedcites [23] Martina, J. A. & Puertollano, R. Protein phosphatase 2A stimulates activation of TFEB and TFE3 transcription factors in response to oxidative stress. J. Biol. Chem. 293, 12525–12534 (2018). sourceExperimental — accuracy not yet measured
The Results and Discussion report TFEB and TFE3 activation after oxidative-stress induction in cultured cells, supporting the in vitro part of the claim. The paper does not report in vivo activation. The antioxidant-gene clause is attached to a different citation (26), so it is not assessed here. (LLM, conf=0.87)
- Partly supportedcites [24] Kang, Y., Li, Y., Zhang, T., Chi, Y. & Liu, M. Effects of transcription factor EB on oxidative stress and apoptosis induced by high glucose in podocytes. Int. J. Mol. Med. 44, 447–456 (2019). sourceExperimental — accuracy not yet measured
The Results section reports nuclear translocation of TFEB in mouse podocytes exposed to high glucose in vitro, and reports increased SOD2 and HO1 expression after TFEB overexpression. The paper does not report TFE3 activation or an in vivo experiment, so it supports only part of the attributed claim. No page numbers are available in our copy. (LLM, conf=0.88)
- Partly supportedcites [25] Martina, J. A. et al. A conserved cysteine-based redox mechanism sustains TFEB/HLH-30 activity under persistent stress. EMBO J. 40, e105793 (2021). sourceExperimental — accuracy not yet measured
The cell-culture experiments report oxidative-stress responses of TFEB and TFE3, and the TFEB target-gene analysis identifies oxidative-stress-response genes TXNRD1 and HMOX1 (TFEB and TFE3 form high molecular weight oligomers; Contribution; pages unavailable). The in vivo experiments concern their C. elegans ortholog HLH-30, not TFEB or TFE3 themselves, and the antioxidant-gene experiment tests TFEB rather than TFE3 separately (Discussion; pages unavailable). (LLM, conf=0.84)
- Supportedcites [26] Jeong, E., Martina, J. A., Contreras, P. S., Lee, J. & Puertollano, R. The FACT complex facilitates expression of lysosomal and antioxidant genes through binding to TFEB and TFE3. Autophagy 18, 2333–2349 (2022). source
The section “The FACT complex promotes TFEB-dependent expression of oxidative stress genes” reports that active TFEB upregulated antioxidant genes and that their expression after oxidative stress was impaired in cells lacking both TFEB and TFE3. This supports the antioxidant-gene expression point attributed to this source by citation 26; the in vivo and in vitro activation point is attached to citations 23–25. (LLM, conf=0.93)
plaindirect- Asserted: passes — The authors put it forward as true.
- Checkable: passes — It can be checked against evidence.
- Load-bearing: fails — The paper’s conclusions may not depend on it.
- Based: passes — The paper gives a reason why it holds.
Probably not a substantial claim. The paper’s conclusions may not depend on it. It may state two separate claims as one.
- Partly supported
The cited sources support only part of this claim — read each source’s verdict below.
In the paper
“JIP4-mediated retrograde transport of lysosomes facilitates interaction and fusion between autophagosomes and lysosomes, resulting in degradation of autophagosomal content and restoration of energy homeostasis7–9.”
§ TMEM55B links autophagy flux, lysosomal repair, and TFE3 activation in response to oxidative stress > Introduction
What the sources say
- Partly supportedcites [7] Willett, R. et al. TFEB regulates lysosomal positioning by modulating TMEM55B expression and JIP4 recruitment to lysosomes. Nat. Commun. 8, 1580 (2017). sourceExperimental — accuracy not yet measured
The Results section on starvation reports that JIP4 is required for lysosomes to cluster near the cell center and that JIP4 depletion impairs autophagosome–lysosome fusion and autophagic flux. The Introduction links this fusion to degradation of autophagosomal content. Our copy does not show that these effects restore energy homeostasis; it refers more generally to cellular homeostasis. (LLM, conf=0.86)
- Not checked — no full text of the sourcecites [8] Takemasu, S. et al. Phosphorylation of TMEM55B by Erk/MAPK regulates lysosomal positioning. J. Biochem. 166, 175–185 (2019). source
- Partly supportedcites [9] Sasazawa, Y. et al. Oxidative stress-induced phosphorylation of JIP4 regulates lysosomal positioning in coordination with TRPML1 and ALG2. EMBO J. 41, e111476 (2022). sourceExperimental — accuracy not yet measured
The Results sections on spm/acrolein treatment and phospho-JIP4 link lysosomal retrograde transport to increased autophagosome–lysosome fusion and autophagic flux. The Introduction explains that fusion leads to degradation of vesicle contents and that autophagy maintains cellular homeostasis. Our copy does not establish that JIP4-mediated transport restores energy homeostasis specifically. (LLM, conf=0.85)
plaindirect- Asserted: passes — The authors put it forward as true.
- Checkable: passes — It can be checked against evidence.
- Load-bearing: fails — The paper’s conclusions may not depend on it.
- Based: passes — The paper gives a reason why it holds.
Probably not a substantial claim. The paper’s conclusions may not depend on it.
- Partly supported
Every source the paper cites for this claim was checked and supports it.
In the paper
“Activation of TFEB/TFE3 following starvation increases TMEM55B protein levels, leading to increased JIP4 recruitment to the lysosomal surface7.”
§ TMEM55B links autophagy flux, lysosomal repair, and TFE3 activation in response to oxidative stress > Introduction
What the sources say
- Supportedcites [7] Willett, R. et al. TFEB regulates lysosomal positioning by modulating TMEM55B expression and JIP4 recruitment to lysosomes. Nat. Commun. 8, 1580 (2017). source
The Results section reports that starvation activates TFEB/TFE3 and increases TMEM55B protein levels. In a separate Results section, TMEM55B overexpression increased JIP4 recruitment to lysosomal membranes, supporting the causal chain in the claim. No page numbers are available in our copy. (LLM, conf=0.90)
plaindirect- Asserted: passes — The authors put it forward as true.
- Checkable: passes — It can be checked against evidence.
- Load-bearing: passes — The paper’s conclusions depend on it.
- Based: passes — The paper gives a reason why it holds.
It may state two separate claims as one.
- Supported
The cited sources support only part of this claim — read each source’s verdict below.
In the paper
“Under certain stress conditions, such as treatment with lysosomal ionophores, lipidation of GABARAP serves as a mechanism to sequester the FLCN/FNIP complex, inhibiting its GAP activity and resulting in TFEB and TFE3 activation30.”
§ TMEM55B links autophagy flux, lysosomal repair, and TFE3 activation in response to oxidative stress > Results > TMEM55B sequesters folliculin to induce TFE3 activation
What the sources say
- Partly supportedcites [30] Goodwin, J. M. et al. GABARAP sequesters the FLCN-FNIP tumor suppressor complex to couple autophagy with lysosomal biogenesis. Sci. Adv. 7, eabj2485 (2021). sourceExperimental — accuracy not yet measured
The Results report that the ionophore monensin induces FLCN-FNIP1 sequestration and FNIP1-LIR-dependent TFEB activation; the Fig. 7 model links GABARAP-dependent sequestration to nuclear retention of TFEB/TFE3. But the Results describe inhibition of FLCN-FNIP GAP activity as a proposed mechanism (“could inhibit”), so the claim states that step more definitively than the source does. No page numbers are available in our copy. (LLM, conf=0.84)
plaindirect- Asserted: passes — The authors put it forward as true.
- Checkable: passes — It can be checked against evidence.
- Load-bearing: fails — The paper’s conclusions may not depend on it.
- Based: passes — The paper gives a reason why it holds.
Probably not a substantial claim. The paper’s conclusions may not depend on it. It may state two separate claims as one.
- Partly supported
Every source the paper cites for this claim was checked and supports it.
In the paper
“It was previously reported that depletion of PLEKHM1 significantly reduces the fusion rate between autophagosomes and lysosomes16.”
§ TMEM55B links autophagy flux, lysosomal repair, and TFE3 activation in response to oxidative stress > Results > TMEM55B facilitates PLEKHM1 proteasomal degradation
What the sources say
- Supportedcites [16] McEwan, D. G. et al. PLEKHM1 regulates autophagosome-lysosome fusion through HOPS complex and LC3/GABARAP proteins. Mol. Cell 57, 39–54 (2015). source
The paper’s Highlights state that genetic loss of PLEKHM1 inhibits autophagosome–lysosome fusion. In the Results (page unavailable), fusion-related measures were significantly reduced in Plekhm1-deficient cells, supporting the claim, although the paper does not report a direct measurement of fusion rate. (LLM, conf=0.90)
plaindirect- Asserted: passes — The authors put it forward as true.
- Checkable: passes — It can be checked against evidence.
- Load-bearing: passes — The paper’s conclusions depend on it.
- Based: passes — The paper gives a reason why it holds.
Probably not a substantial claim.
- Supported
The cited sources support only part of this claim — read each source’s verdict below.
In the paper
“Please note that the nuclear staining observed in these cells is nonspecific, as it has been previously detected in FLCN-depleted cells31,32.”
§ TMEM55B links autophagy flux, lysosomal repair, and TFE3 activation in response to oxidative stress > Results > TMEM55B sequesters folliculin to induce TFE3 activation
What the sources say
- Partly supportedcites [31] Martina, J. A. et al. The nutrient-responsive transcription factor TFE3 promotes autophagy, lysosomal biogenesis, and clearance of cellular debris. Sci. Signal. 7, ra9 (2014). sourceExperimental — accuracy not yet measured
The Results section says the nuclear FLCN staining was also detected in FLCN-depleted cells. It calls the staining “probably non-specific,” whereas the citing sentence states that it is nonspecific without that qualification. No page number is available in the provided copy. (LLM, conf=0.86)
- Supportedcites [32] Tsun, Z. Y. et al. The folliculin tumor suppressor is a GAP for the RagC/D GTPases that signal amino acid levels to mTORC1. Mol. Cell 52, 495–505 (2013). source
The Results section on FLCN lysosomal localization states that an anti-FLCN antibody produced a non-specific nuclear signal. It also reports that FLCN knockdown did not diminish the immunofluorescence signal of most antibodies tested, supporting the interpretation of nuclear staining as non-specific. (LLM, conf=0.93)
plain- Asserted: passes — The authors put it forward as true.
- Checkable: passes — It can be checked against evidence.
- Load-bearing: fails — The paper’s conclusions may not depend on it.
- Based: passes — The paper gives a reason why it holds.
Probably not a substantial claim. The paper’s conclusions may not depend on it.
- Partly supported
Every source the paper cites for this claim was checked and supports it.
In the paper
“Lack of gDNA contamination in cDNA samples was confirmed using a fragment of zebrafish β-actin cDNA that was amplified by PCR (35 cycles) as previously described45.”
§ TMEM55B links autophagy flux, lysosomal repair, and TFE3 activation in response to oxidative stress > Methods > Total RNA extraction from zebrafish embryos and cDNA synthesis
What the sources say
- Supportedcites [45] Rissone, A. et al. Reticular dysgenesis-associated AK2 protects hematopoietic stem and progenitor cell development from oxidative stress. J. Exp. Med. 212, 1185–1202 (2015). source
The RT-PCR section of Materials and Methods states that a zebrafish β-actin cDNA fragment was amplified by PCR for 35 cycles using primers that demonstrate the lack of genomic contamination in the RNA preparations used to make the cDNA. This supports the cited description of the contamination check. (LLM, conf=0.94)
plain- Asserted: passes — The authors put it forward as true.
- Checkable: passes — It can be checked against evidence.
- Load-bearing: fails — The paper’s conclusions may not depend on it.
- Based: passes — The paper gives a reason why it holds.
Probably not a substantial claim. The paper’s conclusions may not depend on it.
- Supported
Every source the paper cites for this claim was checked and supports it.
In the paper
“The ESCRT-I subunit TSG101 is also required for efficient ESCRT-III recruitment22.”
§ TMEM55B links autophagy flux, lysosomal repair, and TFE3 activation in response to oxidative stress > Discussion
What the sources say
- Supportedcites [22] Radulovic, M. et al. ESCRT-mediated lysosome repair precedes lysophagy and promotes cell survival. EMBO J. 37, e99753 (2018). source
In the section “TSG101 depletion inhibits CHMP4B recruitment on damaged lysosomes whereas CHMP2A knockdown stabilizes it” (page not provided), TSG101 depletion strongly delayed recruitment of CHMP4B, an ESCRT-III subunit. The authors conclude that TSG101 in ESCRT-I is upstream of ESCRT-III recruitment to damaged lysosomes. (LLM, conf=0.92)
plaindirect- Asserted: passes — The authors put it forward as true.
- Checkable: passes — It can be checked against evidence.
- Load-bearing: fails — The paper’s conclusions may not depend on it.
- Based: passes — The paper gives a reason why it holds.
Probably not a substantial claim. The paper’s conclusions may not depend on it.
- Supported
Every source the paper cites for this claim was checked and supports it.
In the paper
“In agreement with previous studies, nutrient deprivation caused clear FLCN recruitment to lysosomes31–33, which was comparable between Null and TMEM55-KO cells (Fig. 7c, d)”
§ TMEM55B links autophagy flux, lysosomal repair, and TFE3 activation in response to oxidative stress > Results > TMEM55B sequesters folliculin to induce TFE3 activation
What the sources say
- Supportedcites [31] Martina, J. A. et al. The nutrient-responsive transcription factor TFE3 promotes autophagy, lysosomal biogenesis, and clearance of cellular debris. Sci. Signal. 7, ra9 (2014). source
The Results section reports that FLCN association with lysosomal membranes increased in nutrient-deprived ARPE-19 cells (Fig. 3B), supporting the statement attached to this citation. The comparison between Null and TMEM55-KO cells is presented as the citing paper’s own result (Fig. 7c, d), not as a finding attributed to this source. (LLM, conf=0.93)
- Supportedcites [32] Tsun, Z. Y. et al. The folliculin tumor suppressor is a GAP for the RagC/D GTPases that signal amino acid levels to mTORC1. Mol. Cell 52, 495–505 (2013). source
The Results section (‘FLCN Co-Localizes with the Rag GTPases on the Lysosomal Surface in an Amino Acid-Sensitive Fashion’) reports that endogenous FLCN was enriched at the lysosomal surface during amino acid starvation and dispersed after amino acid stimulation. The comparison between Null and TMEM55-KO cells is presented as the citing paper’s own Fig. 7c,d result, not as a finding attributed to this source. (LLM, conf=0.93)
- Supportedcites [33] Petit, C. S., Roczniak-Ferguson, A. & Ferguson, S. M. Recruitment of folliculin to lysosomes supports the amino acid-dependent activation of Rag GTPases. J. Cell Biol. 202, 1107–1122 (2013). source
The Results section, “Amino acid–dependent recruitment of FLCN to lysosomes” (Fig. 4 C), reports that starvation recruits FLCN to lysosomes. The comparison between Null and TMEM55-KO cells is presented as the citing authors’ own Fig. 7 result, not as a finding attributed to this source. (LLM, conf=0.93)
boosted- Asserted: passes — The authors put it forward as true.
- Checkable: passes — It can be checked against evidence.
- Load-bearing: unclear — It is unclear whether the paper’s conclusions depend on it.
- Based: passes — The paper gives a reason why it holds.
It may state two separate claims as one.
- Supported
The cited sources support only part of this claim — read each source’s verdict below.
In the paper
“Furthermore, JIP4 was also showed to link ARL8, RUFY3 and RUFY4 to dynein to regulate lysosomal size and positioning40,41.”
§ TMEM55B links autophagy flux, lysosomal repair, and TFE3 activation in response to oxidative stress > Discussion
What the sources say
- Partly supportedcites [40] Kumar, G. et al. RUFY3 links Arl8b and JIP4-Dynein complex to regulate lysosome size and positioning. Nat. Commun. 13, 1540 (2022). sourceExperimental — accuracy not yet measured
The Results section on retrograde transport shows that RUFY3 links Arl8b-positive lysosomes to the JIP4–dynein complex and that JIP4 and dynein are required for RUFY3-mediated lysosome positioning. The Results section on lysosome size reports that RUFY3 depletion reduces size, but says it remains unclear whether the RUFY3–JIP4–dynein complex regulates that effect. Our copy does not establish the claimed RUFY4 link. (LLM, conf=0.89)
- Partly supportedcites [41] Keren-Kaplan, T. et al. RUFY3 and RUFY4 are ARL8 effectors that promote coupling of endolysosomes to dynein-dynactin. Nat. Commun. 13, 1506 (2022). sourceExperimental — accuracy not yet measured
The Discussion reports that RUFY3 interacts with JIP4 and helps connect ARL8B to dynein-dynactin for lysosome positioning. It does not establish a JIP4 interaction with RUFY4 or show that this combined pathway regulates lysosomal size; size appears in the title of a separate study listed in the References. (LLM, conf=0.85)
plaindirect- Asserted: passes — The authors put it forward as true.
- Checkable: passes — It can be checked against evidence.
- Load-bearing: fails — The paper’s conclusions may not depend on it.
- Based: passes — The paper gives a reason why it holds.
Probably not a substantial claim. The paper’s conclusions may not depend on it.
- Partly supported
Every source the paper cites for this claim was checked and supports it.
In the paper
“In the nucleus, TFE3 can induce expression of multiple antioxidant26 and lysosomal genes31, contributing to cell survival and allowing restoration of cellular homeostasis.”
§ TMEM55B links autophagy flux, lysosomal repair, and TFE3 activation in response to oxidative stress > Discussion
What the sources say
- Supportedcites [26] Jeong, E., Martina, J. A., Contreras, P. S., Lee, J. & Puertollano, R. The FACT complex facilitates expression of lysosomal and antioxidant genes through binding to TFEB and TFE3. Autophagy 18, 2333–2349 (2022). source
Citation 31 is attached to the lysosomal-gene claim. The Introduction (page unavailable) says that TFE3 regulates genes involved in lysosomal biogenesis and that, under stress, it moves to the nucleus and activates transcriptional networks aimed at preserving cellular functions and restoring homeostasis. (LLM, conf=0.90)
- Supportedcites [31] Martina, J. A. et al. The nutrient-responsive transcription factor TFE3 promotes autophagy, lysosomal biogenesis, and clearance of cellular debris. Sci. Signal. 7, ra9 (2014). source
The Results section ('TFE3 promotes expression of lysosomal genes independently of TFEB') reports that TFE3 increased expression of multiple lysosomal genes. The Discussion states that TFE3 moves to the nucleus and activates genes promoting survival during starvation, and links its regulation to cellular homeostasis. The antioxidant-gene assertion is attached to citation 26, not this source. (LLM, conf=0.93)
plaindirect- Asserted: passes — The authors put it forward as true.
- Checkable: passes — It can be checked against evidence.
- Load-bearing: passes — The paper’s conclusions depend on it.
- Based: passes — The paper gives a reason why it holds.
It may state two separate claims as one.
- Supported
The cited sources support only part of this claim — read each source’s verdict below.
In the paper
“This may be explained by recent observations showing that JIP4 phosphorylation following oxidative stress induces its interaction with the TRPML1/ALG2 complex, which also mediates dynein-dependent retrograde transport of lysosomes9,38,39.”
§ TMEM55B links autophagy flux, lysosomal repair, and TFE3 activation in response to oxidative stress > Discussion
What the sources say
- Supportedcites [9] Sasazawa, Y. et al. Oxidative stress-induced phosphorylation of JIP4 regulates lysosomal positioning in coordination with TRPML1 and ALG2. EMBO J. 41, e111476 (2022). source
The Results section reports that oxidative-stress-induced JIP4 phosphorylation is required for its association with the TRPML1–ALG2 complex and that this promotes dynein-dependent lysosomal retrograde transport. The Discussion clarifies that the association may be indirect; the citing sentence does not claim direct binding. (LLM, conf=0.90)
- Partly supportedcites [38] Vergarajauregui, S., Martina, J. A. & Puertollano, R. Identification of the penta-EF-hand protein ALG-2 as a Ca2+-dependent interactor of mucolipin-1. J. Biol. Chem. 284, 36357–36366 (2009). sourceExperimental — accuracy not yet measured
The Results report that mucolipin-1 (MCOLN1/TRPML1) interacts with ALG-2, supporting the named pairing. Our copy does not report JIP4 phosphorylation after oxidative stress, JIP4 binding to that pair, or dynein-dependent retrograde lysosome transport (searched: JIP4, oxidative stress, dynein-dependent transport). (LLM, conf=0.87)
- Partly supportedcites [39] Li, X. et al. A molecular mechanism to regulate lysosome motility for lysosome positioning and tubulation. Nat. Cell Biol. 18, 404–417 (2016). sourceExperimental — accuracy not yet measured
The Results sections on TRPML1-dependent migration and ALG-2 support a TRPML1–ALG-2 pathway linked to dynein-dependent retrograde lysosome transport (page numbers unavailable). The paper does not report JIP4 phosphorylation after oxidative stress or a resulting interaction with that pathway; searches for JIP4 and oxidative-stress phosphorylation found no such passage. (LLM, conf=0.89)
hedgeddirect- Asserted: passes — The authors put it forward as true.
- Checkable: passes — It can be checked against evidence.
- Load-bearing: fails — The paper’s conclusions may not depend on it.
- Based: passes — The paper gives a reason why it holds.
Probably not a substantial claim. The paper’s conclusions may not depend on it. It may state two separate claims as one.
- Supported
The cited sources support only part of this claim — read each source’s verdict below.
In the paper
“For example, translocation of ESCRT to lysosomes in response to LLOMe is triggered by the efflux of lysosomal Ca2+ and subsequent recruitment of ALIX, which in turn brings other ESCRT-III components42.”
§ TMEM55B links autophagy flux, lysosomal repair, and TFE3 activation in response to oxidative stress > Discussion
What the sources say
- Partly supportedcites [42] Skowyra, M. L., Schlesinger, P. H., Naismith, T. V. & Hanson, P. I. Triggered recruitment of ESCRT machinery promotes endolysosomal repair. Science 360, eaar5078 (2018). sourceExperimental — accuracy not yet measured
In “ESCRTs respond to endolysosomal damage” (page not given), the paper reports ESCRT recruitment after LLOME damage and shows that calcium chelation prevents it. It does not establish lysosomal Ca2+ efflux as the specific trigger. ALIX colocalizes with recruited ESCRT proteins, but depleting ALIX alone does not impair CHMP4A recruitment; suppression requires depletion of both ALIX and TSG101. The claimed sequence in which ALIX brings in the other ESCRT-III components therefore overstates the finding. (LLM, conf=0.89)
plaindirect- Asserted: passes — The authors put it forward as true.
- Checkable: passes — It can be checked against evidence.
- Load-bearing: fails — The paper’s conclusions may not depend on it.
- Based: passes — The paper gives a reason why it holds.
Probably not a substantial claim. The paper’s conclusions may not depend on it.
- Partly supported
A result the paper reports from its own data — it cites no other source for it, so there is none to check. The quote shows it is in the paper.
In the paper
“In agreement with these studies, we observed a significant reduction in NEDD4L S448 phosphorylation when cells were incubated in starvation media (EBSS) for 4 h (Supplementary Fig. 1i, j). Reduced NEDD4L phosphorylation, and thereby activation, was also observed when oxidative stress was induced by treatment with NaAsO2 (Supplementary Fig. 1i, j).”
§ TMEM55B links autophagy flux, lysosomal repair, and TFE3 activation in response to oxidative stress > Results > TMEM55B interacts with NEDD4-like E3 ligases
plaindirect- Asserted: passes — The authors put it forward as true.
- Checkable: passes — It can be checked against evidence.
- Load-bearing: passes — The paper’s conclusions depend on it.
- Based: passes — The paper gives a reason why it holds.
It may state two separate claims as one.
- Rests on an assumption: NaAsO2 treatment induces oxidative stress as the relevant mechanism for the observed cellular effects.
A result the paper reports from its own data — it cites no other source for it, so there is none to check. The quote shows it is in the paper.
In the paper
“We also observed that recombinant PLEKHM1-Flag co-immunoprecipitated TMEM55-GFP full length (FL), as well as its N-terminal cytosolic domain (CD) (Supplementary Fig. 2f).”
§ TMEM55B links autophagy flux, lysosomal repair, and TFE3 activation in response to oxidative stress > Results > TMEM55B interacts with PLEKHM1 under oxidative stress
plaincorrelational- Asserted: passes — The authors put it forward as true.
- Checkable: passes — It can be checked against evidence.
- Load-bearing: unclear — It is unclear whether the paper’s conclusions depend on it.
- Based: passes — The paper gives a reason why it holds.
It may state two separate claims as one.
A result the paper reports from its own data — it cites no other source for it, so there is none to check. The quote shows it is in the paper.
In the paper
“The interaction seemed to be very specific for NaAsO2, as we did not detect binding of PLEKHM1 or VPS41 to either recombinant or endogenous TMEM55B when cells were incubated with a variety of stressors, including EBSS, H2O2, CCCP, LLOMe, tunicamycin or thapsigargin (Fig. 2d and Supplementary Fig. 2a).”
§ TMEM55B links autophagy flux, lysosomal repair, and TFE3 activation in response to oxidative stress > Results > TMEM55B interacts with PLEKHM1 under oxidative stress
hedged- Asserted: passes — The authors put it forward as true.
- Checkable: passes — It can be checked against evidence.
- Load-bearing: passes — The paper’s conclusions depend on it.
- Based: passes — The paper gives a reason why it holds.
It may state two separate claims as one.
A result the paper reports from its own data — it cites no other source for it, so there is none to check. The quote shows it is in the paper.
In the paper
“Interestingly, we found that those compounds that generated high ROS levels, including NaAsO2 and acrolein, also caused TMEM55B phosphorylation and TMEM55B/JIP4 dissociation (Fig. 3c, Supplementary Fig. 3b, c).”
§ TMEM55B links autophagy flux, lysosomal repair, and TFE3 activation in response to oxidative stress > Results > Acute oxidative stress induces TMEM55B phosphorylation
plaindirect- Asserted: passes — The authors put it forward as true.
- Checkable: passes — It can be checked against evidence.
- Load-bearing: passes — The paper’s conclusions depend on it.
- Based: passes — The paper gives a reason why it holds.
It may state two separate claims as one.
A result the paper reports from its own data — it cites no other source for it, so there is none to check. The quote shows it is in the paper.
In the paper
“Importantly, treatment with TAK243, a selective ubiquitin activating enzyme (UBA1) inhibitor, did not affect binding of TMEM55B to PLEKHM1, but prevented NaAsO2-induced PLEKHM1 degradation, further demonstrating that this is a ubiquitination-mediated process (Supplementary Fig. 4a, b).”
§ TMEM55B links autophagy flux, lysosomal repair, and TFE3 activation in response to oxidative stress > Results > TMEM55B facilitates PLEKHM1 proteasomal degradation
boosteddirect- Asserted: passes — The authors put it forward as true.
- Checkable: passes — It can be checked against evidence.
- Load-bearing: passes — The paper’s conclusions depend on it.
- Based: passes — The paper gives a reason why it holds.
It may state two separate claims as one.
A result the paper reports from its own data — it cites no other source for it, so there is none to check. The quote shows it is in the paper.
In the paper
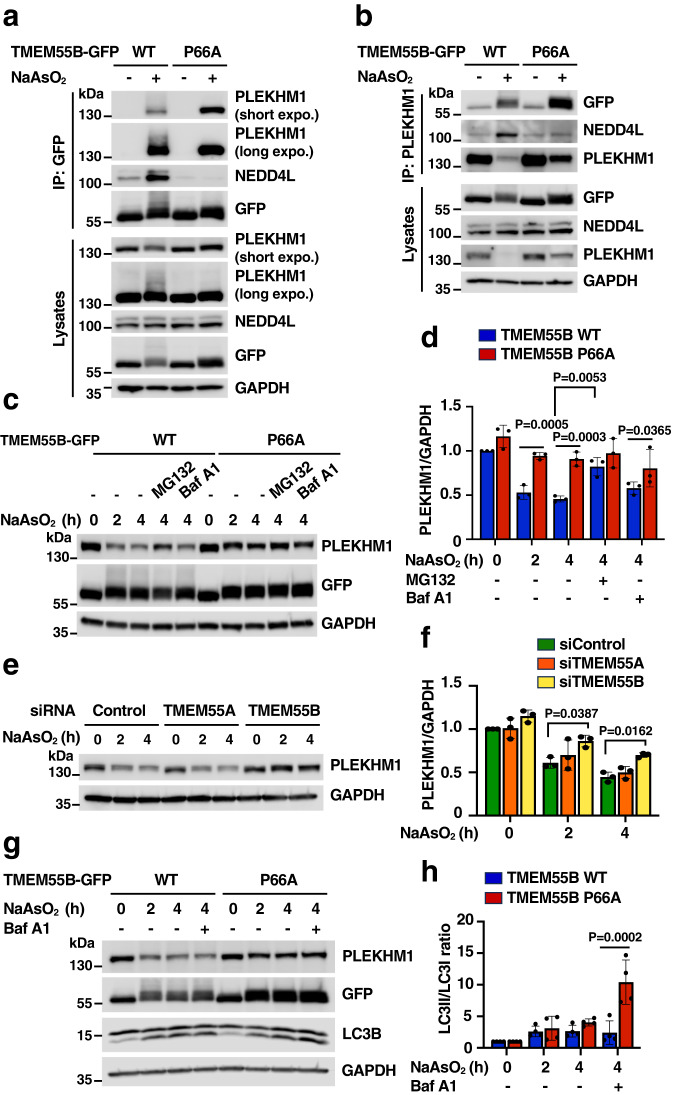
“Conversely, the levels of PLEKHM1 remained constant in cells expressing TMEM55B P66A, resulting in continuous autophagosome/lysosome fusion (Fig. 4g, h).”
§ TMEM55B links autophagy flux, lysosomal repair, and TFE3 activation in response to oxidative stress > Results > TMEM55B facilitates PLEKHM1 proteasomal degradation
plaindirect- Asserted: passes — The authors put it forward as true.
- Checkable: passes — It can be checked against evidence.
- Load-bearing: passes — The paper’s conclusions depend on it.
- Based: passes — The paper gives a reason why it holds.
It may state two separate claims as one.
A result the paper reports from its own data — it cites no other source for it, so there is none to check. The quote shows it is in the paper.
In the paper
“Notably, whereas both TMEM55B WT and P66A showed strong binding to PLEKHM1 upon incubation with NaAsO2, only TMEM55B WT recruited also NEDD4L (Fig. 4a).”
§ TMEM55B links autophagy flux, lysosomal repair, and TFE3 activation in response to oxidative stress > Results > TMEM55B facilitates PLEKHM1 proteasomal degradation
plaincorrelational- Asserted: passes — The authors put it forward as true.
- Checkable: passes — It can be checked against evidence.
- Load-bearing: passes — The paper’s conclusions depend on it.
- Based: passes — The paper gives a reason why it holds.
It may state two separate claims as one.
A result the paper reports from its own data — it cites no other source for it, so there is none to check. The quote shows it is in the paper.
In the paper
“Knockout of tmem55 genes in zebrafish embryos increases their susceptibility to oxidative stress, causing early death of tmem55-KO animals in response to arsenite toxicity.”
§ TMEM55B links autophagy flux, lysosomal repair, and TFE3 activation in response to oxidative stress > Abstract
plaindirect- Asserted: passes — The authors put it forward as true.
- Checkable: passes — It can be checked against evidence.
- Load-bearing: passes — The paper’s conclusions depend on it.
- Based: passes — The paper gives a reason why it holds.
It may state two separate claims as one.
None of the sources cited for this claim have been checked yet.
In the paper
“As previously described, incubation with LLOMe at 300 μM for 10 h had minimal effect on cell viability22 and no differences were observed between Null and TMEM55B-KO cells (Supplementary Fig. 6a, b).”
§ TMEM55B links autophagy flux, lysosomal repair, and TFE3 activation in response to oxidative stress > Results > TMEM55B promotes ESCRT recruitment to lysosomes
What the sources say
- Not checked yetcites [22] Radulovic, M. et al. ESCRT-mediated lysosome repair precedes lysophagy and promotes cell survival. EMBO J. 37, e99753 (2018). source
Checked before — its earlier verdict is held back until a new check runs.
plain- Asserted: passes — The authors put it forward as true.
- Checkable: passes — It can be checked against evidence.
- Load-bearing: unclear — It is unclear whether the paper’s conclusions depend on it.
- Based: passes — The paper gives a reason why it holds.
It may state two separate claims as one.
- Not checked yet
A result the paper reports from its own data — it cites no other source for it, so there is none to check. The quote shows it is in the paper.
In the paper
“The interaction of TMEM55B with FLCN does not requires the PPXY motif (Supplementary Fig. 7a) and is very specific for NaAsO2, as it was not observed in response to other stressors (Fig. 7b and Supplementary Fig. 7b).”
§ TMEM55B links autophagy flux, lysosomal repair, and TFE3 activation in response to oxidative stress > Results > TMEM55B sequesters folliculin to induce TFE3 activation
plain- Asserted: passes — The authors put it forward as true.
- Checkable: passes — It can be checked against evidence.
- Load-bearing: passes — The paper’s conclusions depend on it.
- Based: passes — The paper gives a reason why it holds.
It may state two separate claims as one.
A result the paper reports from its own data — it cites no other source for it, so there is none to check. The quote shows it is in the paper.
In the paper
“These results were further supported by the significantly reduced PLEKHM1 degradation observed in TMEM55B-depleted cells, while depletion of the family member TMEM55A had no effect (Fig. 4e, f).”
§ TMEM55B links autophagy flux, lysosomal repair, and TFE3 activation in response to oxidative stress > Results > TMEM55B facilitates PLEKHM1 proteasomal degradation
plaindirect- Asserted: passes — The authors put it forward as true.
- Checkable: passes — It can be checked against evidence.
- Load-bearing: passes — The paper’s conclusions depend on it.
- Based: passes — The paper gives a reason why it holds.
It may state two separate claims as one.
A result the paper reports from its own data — it cites no other source for it, so there is none to check. The quote shows it is in the paper.
In the paper
“Using this approach, seven ubiquitination sites were identified: K96, K103, K114, K120, K121, K134, and K148, all of them located in the CD domain.”
§ TMEM55B links autophagy flux, lysosomal repair, and TFE3 activation in response to oxidative stress > Results > TMEM55B is ubiquitinated in response to oxidative stress
plaincorrelational- Asserted: passes — The authors put it forward as true.
- Checkable: passes — It can be checked against evidence.
- Load-bearing: passes — The paper’s conclusions depend on it.
- Based: passes — The paper gives a reason why it holds.
It may state two separate claims as one. The quote only partly states this claim.
A result the paper reports from its own data — it cites no other source for it, so there is none to check. The quote shows it is in the paper.
In the paper
“Furthermore, PLEKHM1 degradation was blocked by incubation with the proteosome inhibitor MG132, but not by inhibiting lysosomal activity with bafilomycin A1, indicating that TMEM55B promotes PLEKHM1 ubiquitination and proteasomal degradation in response to NaAsO2 (Fig. 4c, d).”
§ TMEM55B links autophagy flux, lysosomal repair, and TFE3 activation in response to oxidative stress > Results > TMEM55B facilitates PLEKHM1 proteasomal degradation
hedged- Asserted: passes — The authors put it forward as true.
- Checkable: passes — It can be checked against evidence.
- Load-bearing: passes — The paper’s conclusions depend on it.
- Based: passes — The paper gives a reason why it holds.
It may state two separate claims as one.
A result the paper reports from its own data — it cites no other source for it, so there is none to check. The quote shows it is in the paper.
In the paper
“However, only TMEM55B-GFP-WT induced robust CHMP2B recruitment, further suggesting that TMEM55B ubiquitination alone is not sufficient to stimulate efficient ESCRT recruitment to lysosomes under oxidative stress conditions (Fig. 5d and Supplementary Fig. 5b).”
§ TMEM55B links autophagy flux, lysosomal repair, and TFE3 activation in response to oxidative stress > Results > TMEM55B promotes ESCRT recruitment to lysosomes
hedgedconditional- Asserted: passes — The authors put it forward as true.
- Checkable: passes — It can be checked against evidence.
- Load-bearing: passes — The paper’s conclusions depend on it.
- Based: passes — The paper gives a reason why it holds.
It may state two separate claims as one.
A result the paper reports from its own data — it cites no other source for it, so there is none to check. The quote shows it is in the paper.
In the paper
“It is important to note that both, TMEM55B-GFP and TMEM55B-P66A-GFP were efficiently transported to lysosomes, indicating that NEDD4 is not required for TMEM55B sorting.”
§ TMEM55B links autophagy flux, lysosomal repair, and TFE3 activation in response to oxidative stress > Results > TMEM55B interacts with NEDD4-like E3 ligases
hedged- Asserted: passes — The authors put it forward as true.
- Checkable: passes — It can be checked against evidence.
- Load-bearing: passes — The paper’s conclusions depend on it.
- Based: passes — The paper gives a reason why it holds.
It may state two separate claims as one.
A result the paper reports from its own data — it cites no other source for it, so there is none to check. The quote shows it is in the paper.
In the paper
“However, it is important to note that the potential role of TMEM55B in lysosomal repair seems to be specific for oxidative stress, as the number of galectin3-positive puncta induced by LLOMe was not different between control (Null) and TMEM55B-depleted (TMEM55B-KO) cells (Supplementary Fig. 5c).”
§ TMEM55B links autophagy flux, lysosomal repair, and TFE3 activation in response to oxidative stress > Results > TMEM55B promotes ESCRT recruitment to lysosomes
hedged- Asserted: passes — The authors put it forward as true.
- Checkable: passes — It can be checked against evidence.
- Load-bearing: passes — The paper’s conclusions depend on it.
- Based: passes — The paper gives a reason why it holds.
It may state two separate claims as one.
A result the paper reports from its own data — it cites no other source for it, so there is none to check. The quote shows it is in the paper.
In the paper
“Similar to recombinant TMEM55B-GFP, endogenous TMEM55B localized to LAMP1-positive structures and appeared in clustered lysosomes upon NaAsO2 treatment”
§ TMEM55B links autophagy flux, lysosomal repair, and TFE3 activation in response to oxidative stress > Results > TMEM55B interacts with NEDD4-like E3 ligases
hedgedcorrelational- Asserted: passes — The authors put it forward as true.
- Checkable: passes — It can be checked against evidence.
- Load-bearing: unclear — It is unclear whether the paper’s conclusions depend on it.
- Based: passes — The paper gives a reason why it holds.
It may state two separate claims as one.
A result the paper reports from its own data — it cites no other source for it, so there is none to check. The quote shows it is in the paper.
In the paper
“As shown in Fig. 2b, c, endogenous TMEM55B pulled-down PLEKHM1 and the HOPS subunit VPS41, but not LAMP1, following NaAsO2 treatment.”
§ TMEM55B links autophagy flux, lysosomal repair, and TFE3 activation in response to oxidative stress > Results > TMEM55B interacts with PLEKHM1 under oxidative stress
plaincorrelational- Asserted: passes — The authors put it forward as true.
- Checkable: passes — It can be checked against evidence.
- Load-bearing: passes — The paper’s conclusions depend on it.
- Based: passes — The paper gives a reason why it holds.
It may state two separate claims as one.
A result the paper reports from its own data — it cites no other source for it, so there is none to check. The quote shows it is in the paper.
In the paper
“However, under these conditions, no noticeable accumulation of ubiquitin was observed on the lysosomal surface, which showed instead a predominant nuclear distribution (Fig. 1g).”
§ TMEM55B links autophagy flux, lysosomal repair, and TFE3 activation in response to oxidative stress > Results > TMEM55B is ubiquitinated in response to oxidative stress
plain- Asserted: passes — The authors put it forward as true.
- Checkable: passes — It can be checked against evidence.
- Load-bearing: unclear — It is unclear whether the paper’s conclusions depend on it.
- Based: passes — The paper gives a reason why it holds.
It may state two separate claims as one.
A result the paper reports from its own data — it cites no other source for it, so there is none to check. The quote shows it is in the paper.
In the paper
“We observed that even though PLEKHM1-Flag and TMEM55B-GFP co-localize to Rab7-positive puncta both in control and NaAsO2-treated cells (Supplementary Fig. 2b), the interaction between the two proteins was only detected upon incubation with NaAsO2 (Supplementary Fig. 2c, d).”
§ TMEM55B links autophagy flux, lysosomal repair, and TFE3 activation in response to oxidative stress > Results > TMEM55B interacts with PLEKHM1 under oxidative stress
plaincorrelational- Asserted: passes — The authors put it forward as true.
- Checkable: passes — It can be checked against evidence.
- Load-bearing: passes — The paper’s conclusions depend on it.
- Based: passes — The paper gives a reason why it holds.
It may state two separate claims as one.
A result the paper reports from its own data — it cites no other source for it, so there is none to check. The quote shows it is in the paper.
In the paper
“NEDD4 showed a diffuse cytosolic distribution in GFP-expressing cells, but it was recruited to lysosomes when co-expressed with TMEM55B-GFP. Consistent with the requirement of the PPXY motif for the binding between TMEM55B and NEDD4, we did not observe recruitment of NEDD4 to lysosomes upon expression of the TMEM55B-P66A-GFP mutant (Fig. 1d).”
§ TMEM55B links autophagy flux, lysosomal repair, and TFE3 activation in response to oxidative stress > Results > TMEM55B interacts with NEDD4-like E3 ligases
plaindirect- Asserted: passes — The authors put it forward as true.
- Checkable: passes — It can be checked against evidence.
- Load-bearing: passes — The paper’s conclusions depend on it.
- Based: passes — The paper gives a reason why it holds.
It may state two separate claims as one.
A result the paper reports from its own data — it cites no other source for it, so there is none to check. The quote shows it is in the paper.
In the paper
“However, none of the tested inhibitors prevented NaAsO2-induced TMEM55B phosphorylation, nor interaction of TMEM55B with PLEKHM1 and VPS41, or JIP4 detachment (Supplementary Fig. 3d,e).”
§ TMEM55B links autophagy flux, lysosomal repair, and TFE3 activation in response to oxidative stress > Results > Acute oxidative stress induces TMEM55B phosphorylation
plain- Asserted: passes — The authors put it forward as true.
- Checkable: passes — It can be checked against evidence.
- Load-bearing: passes — The paper’s conclusions depend on it.
- Based: passes — The paper gives a reason why it holds.
It may state two separate claims as one.
A result the paper reports from its own data — it cites no other source for it, so there is none to check. The quote shows it is in the paper.
In the paper
“This mutation completely abolished the ability of TMEM55B to interact with NEDD4, confirming that TMEM55B binding to NEDD4 occurs via PPXY motifs.”
§ TMEM55B links autophagy flux, lysosomal repair, and TFE3 activation in response to oxidative stress > Results > TMEM55B interacts with NEDD4-like E3 ligases
boosteddirect- Asserted: passes — The authors put it forward as true.
- Checkable: passes — It can be checked against evidence.
- Load-bearing: passes — The paper’s conclusions depend on it.
- Based: passes — The paper gives a reason why it holds.
It may state two separate claims as one.
A result the paper reports from its own data — it cites no other source for it, so there is none to check. The quote shows it is in the paper.
In the paper
“As seen in Fig. 2g and Supplementary Fig. 2e, only those chimeras containing the PH1 domain (residues 533-625) were able to bind TMEM55B following NaAsO2 treatment, suggesting that the LIR (residues 632-638), PH2 (residues 683-777), and C1 (residues 986-1040) domains are dispensable for the interaction.”
§ TMEM55B links autophagy flux, lysosomal repair, and TFE3 activation in response to oxidative stress > Results > TMEM55B interacts with PLEKHM1 under oxidative stress
hedgedcorrelational- Asserted: passes — The authors put it forward as true.
- Checkable: passes — It can be checked against evidence.
- Load-bearing: passes — The paper’s conclusions depend on it.
- Based: passes — The paper gives a reason why it holds.
It may state two separate claims as one.
A result the paper reports from its own data — it cites no other source for it, so there is none to check. The quote shows it is in the paper.
In the paper
“PLEKHM1 pulled down both TMEM55B WT and the P66A mutant, but the binding to NEDD4L and the reduction in PLEKHM1 levels were much more pronounced upon TMEM55B-WT expression (Fig. 4b).”
§ TMEM55B links autophagy flux, lysosomal repair, and TFE3 activation in response to oxidative stress > Results > TMEM55B facilitates PLEKHM1 proteasomal degradation
plaincorrelational- Asserted: passes — The authors put it forward as true.
- Checkable: passes — It can be checked against evidence.
- Load-bearing: passes — The paper’s conclusions depend on it.
- Based: passes — The paper gives a reason why it holds.
It may state two separate claims as one.
A result the paper reports from its own data — it cites no other source for it, so there is none to check. The quote shows it is in the paper.
In the paper
“Immunoprecipitation of TMEM55B under denaturing conditions followed by immunoblotting for ubiquitin revealed a high molecular weight smear in cells expressing TMEM55B-WT-GFP upon treatment with NaAsO2 (Fig. 1h). In contrast, TMEM55B-GFP ubiquitination was very modest under control conditions or upon mutation of the PPXY motif (Fig. 1h)”
§ TMEM55B links autophagy flux, lysosomal repair, and TFE3 activation in response to oxidative stress > Results > TMEM55B is ubiquitinated in response to oxidative stress
plain- Asserted: passes — The authors put it forward as true.
- Checkable: passes — It can be checked against evidence.
- Load-bearing: passes — The paper’s conclusions depend on it.
- Based: passes — The paper gives a reason why it holds.
It may state two separate claims as one.
A result the paper reports from its own data — it cites no other source for it, so there is none to check. The quote shows it is in the paper.
In the paper
“In contrast, generation of oxidative stress by treatment with NaAsO2, a condition that activates NEDD4-like E3 ligases (Supplementary Fig. 1i, k), resulted in a clear concentration of ubiquitin on lysosomes, as determined by its co-localization with TMEM55B-GFP and the lysosomal marker LAMTOR1 (Fig. 1g).”
§ TMEM55B links autophagy flux, lysosomal repair, and TFE3 activation in response to oxidative stress > Results > TMEM55B is ubiquitinated in response to oxidative stress
boosteddirect- Asserted: passes — The authors put it forward as true.
- Checkable: passes — It can be checked against evidence.
- Load-bearing: passes — The paper’s conclusions depend on it.
- Based: passes — The paper gives a reason why it holds.
It may state two separate claims as one.
- Rests on an assumption: NaAsO2 treatment induces oxidative stress as the relevant mechanism for the observed cellular effects.
A result the paper reports from its own data — it cites no other source for it, so there is none to check. The quote shows it is in the paper.
In the paper
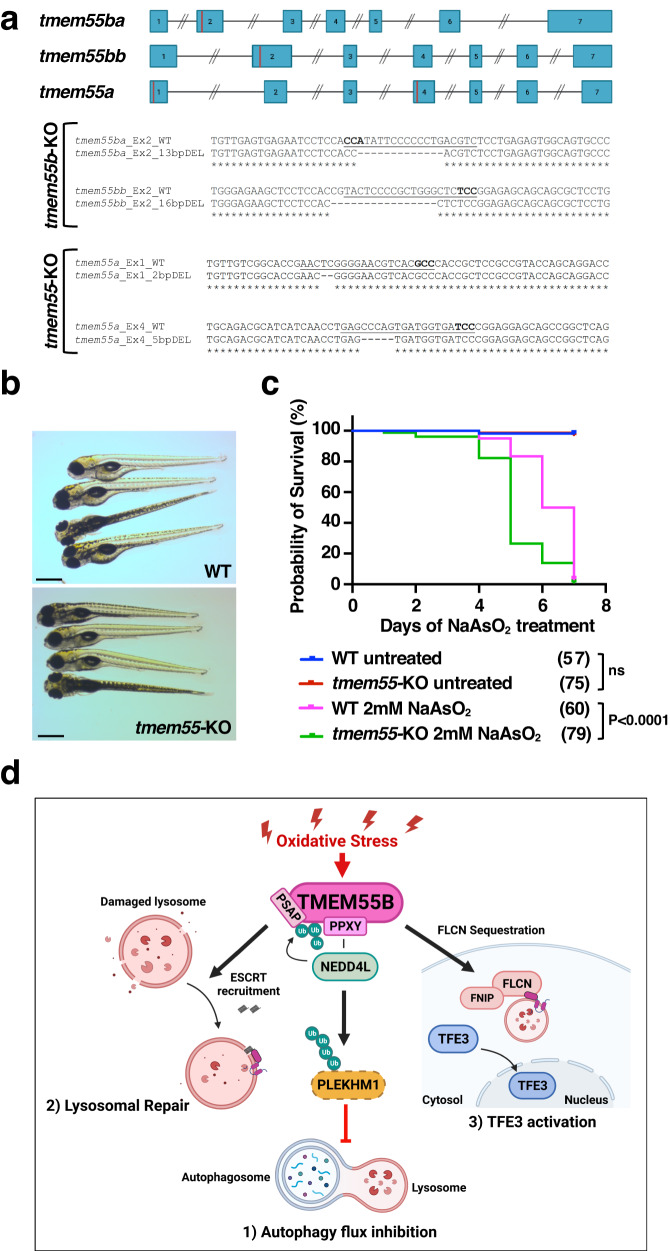
“Notwithstanding the presence of potentially deleterious mutations at the genomic level, double homozygous fish, hereafter indicated as tmem55b-KO, were viable and fertile and did not present any evident phenotype.”
§ TMEM55B links autophagy flux, lysosomal repair, and TFE3 activation in response to oxidative stress > Results > Increased susceptibility of tmem55-KO embryos to arsenite
plain- Asserted: passes — The authors put it forward as true.
- Checkable: passes — It can be checked against evidence.
- Load-bearing: passes — The paper’s conclusions depend on it.
- Based: passes — The paper gives a reason why it holds.
It may state two separate claims as one.
The paper states this without a source or data behind it here, so there is nothing to check it against. The quote shows it is in the paper.
In the paper
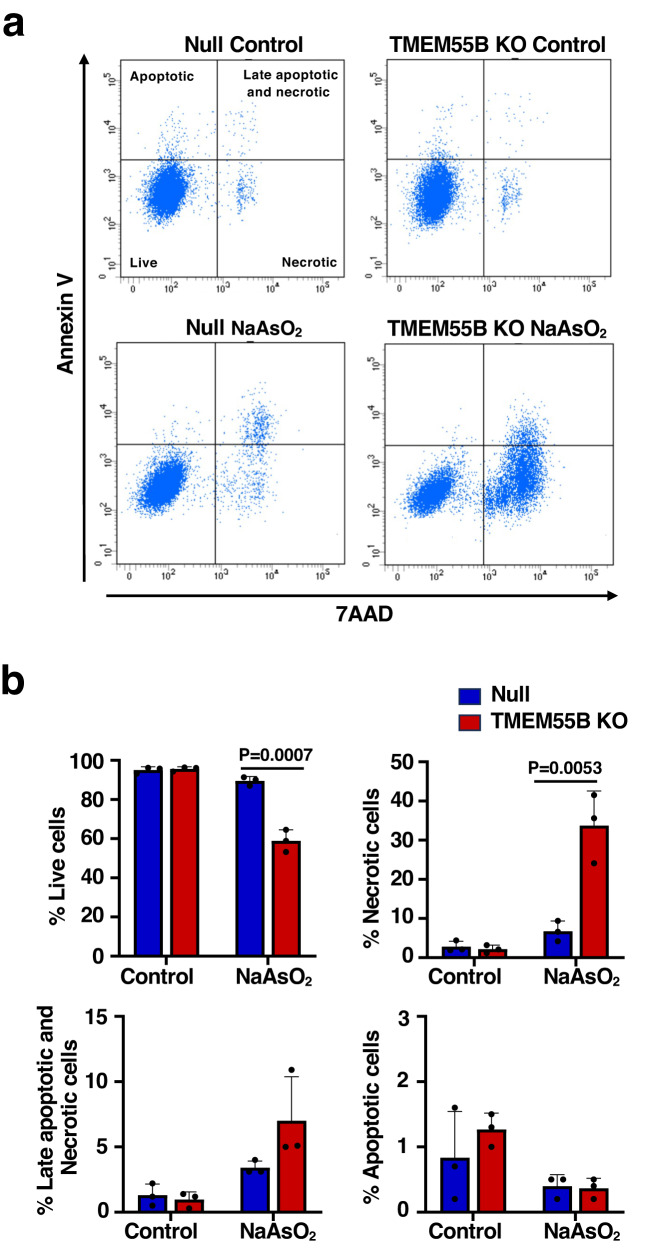
“As such, NaAsO2-induced accumulation of galectin3-positive puncta, a marker for rupture of lysosomal membranes, as well as necrosis, were significantly increased in TMEM55B-depleted cells.”
§ TMEM55B links autophagy flux, lysosomal repair, and TFE3 activation in response to oxidative stress > Discussion
plaindirect- Asserted: passes — The authors put it forward as true.
- Checkable: passes — It can be checked against evidence.
- Load-bearing: passes — The paper’s conclusions depend on it.
- Based: passes — The paper gives a reason why it holds.
It may state two separate claims as one.
A result the paper reports from its own data — it cites no other source for it, so there is none to check. The quote shows it is in the paper.
In the paper
“The viability of tmem55-knockout zebrafish embryos incubated with NaAsO2 was severely reduced when compared with WT embryos, indicating that TMEM55B has a protective role in arsenic-mediated embryo toxicity.”
§ TMEM55B links autophagy flux, lysosomal repair, and TFE3 activation in response to oxidative stress > Discussion
hedgeddirect- Asserted: passes — The authors put it forward as true.
- Checkable: passes — It can be checked against evidence.
- Load-bearing: passes — The paper’s conclusions depend on it.
- Based: passes — The paper gives a reason why it holds.
It may state two separate claims as one.
A result the paper reports from its own data — it cites no other source for it, so there is none to check. The quote shows it is in the paper.
In the paper
“Notably, while efficient recruitment of FLCN to lysosomes was observed in Null cells upon treatment with NaAsO2, the amount of FLCN bound to lysosomal membranes was significantly reduced in TMEM55B-depleted cells (Fig. 7c, d).”
§ TMEM55B links autophagy flux, lysosomal repair, and TFE3 activation in response to oxidative stress > Results > TMEM55B sequesters folliculin to induce TFE3 activation
plaindirect- Asserted: passes — The authors put it forward as true.
- Checkable: passes — It can be checked against evidence.
- Load-bearing: passes — The paper’s conclusions depend on it.
- Based: passes — The paper gives a reason why it holds.
It may state two separate claims as one.
A result the paper reports from its own data — it cites no other source for it, so there is none to check. The quote shows it is in the paper.
In the paper
“Unexpectedly, we observed TMEM55B- and NEDD4-dependent ubiquitination of PLEKHM1, causing PLEKHM1 proteasomal degradation and reducing the rate of fusion between autophagosomes and lysosomes.”
§ TMEM55B links autophagy flux, lysosomal repair, and TFE3 activation in response to oxidative stress > Discussion
plaindirect- Asserted: passes — The authors put it forward as true.
- Checkable: passes — It can be checked against evidence.
- Load-bearing: passes — The paper’s conclusions depend on it.
- Based: passes — The paper gives a reason why it holds.
It may state two separate claims as one.
A result the paper reports from its own data — it cites no other source for it, so there is none to check. The quote shows it is in the paper.
In the paper
“As previously observed for the tmem55b-KO fish, the genetically introduced mutations induced the activation of nonsense-mediated mRNA decay (NMD) mechanisms and, therefore, a reduction of the mRNA transcript levels (Supplementary Fig. 8b).”
§ TMEM55B links autophagy flux, lysosomal repair, and TFE3 activation in response to oxidative stress > Results > Increased susceptibility of tmem55-KO embryos to arsenite
plaindirect- Asserted: passes — The authors put it forward as true.
- Checkable: passes — It can be checked against evidence.
- Load-bearing: unclear — It is unclear whether the paper’s conclusions depend on it.
- Based: passes — The paper gives a reason why it holds.
It may state two separate claims as one.
A result the paper reports from its own data — it cites no other source for it, so there is none to check. The quote shows it is in the paper.
In the paper
“As shown in Fig. 8c, tmem55-KO embryos were significantly more susceptible to prolonged NaAsO2 treatment and presented a lower survival rate compared to controls, confirming the important involvement of tmem55 in cellular stress response to increased levels of oxidative stress.”
§ TMEM55B links autophagy flux, lysosomal repair, and TFE3 activation in response to oxidative stress > Results > Increased susceptibility of tmem55-KO embryos to arsenite
boostedcorrelational- Asserted: passes — The authors put it forward as true.
- Checkable: passes — It can be checked against evidence.
- Load-bearing: passes — The paper’s conclusions depend on it.
- Based: passes — The paper gives a reason why it holds.
It may state two separate claims as one.
A result the paper reports from its own data — it cites no other source for it, so there is none to check. The quote shows it is in the paper.
In the paper
“In contrast, galectin3 staining in response to LLOMe was not affected by depletion of TMEM55B, suggesting that cells may use distinct machineries and regulatory mechanisms for different damaging agents.”
§ TMEM55B links autophagy flux, lysosomal repair, and TFE3 activation in response to oxidative stress > Discussion
hedged- Asserted: passes — The authors put it forward as true.
- Checkable: passes — It can be checked against evidence.
- Load-bearing: unclear — It is unclear whether the paper’s conclusions depend on it.
- Based: passes — The paper gives a reason why it holds.
It may state two separate claims as one.
A result the paper reports from its own data — it cites no other source for it, so there is none to check. The quote shows it is in the paper.
In the paper
“Triple homozygous tmem55 embryos (tmem55-KO) grew normally without noticeable embryonic defects (Fig. 8b), reached adulthood, and were fertile.”
§ TMEM55B links autophagy flux, lysosomal repair, and TFE3 activation in response to oxidative stress > Results > Increased susceptibility of tmem55-KO embryos to arsenite
plain- Asserted: passes — The authors put it forward as true.
- Checkable: passes — It can be checked against evidence.
- Load-bearing: passes — The paper’s conclusions depend on it.
- Based: passes — The paper gives a reason why it holds.
It may state two separate claims as one.
The paper states this without a source or data behind it here, so there is nothing to check it against. The quote shows it is in the paper.
In the paper
“TMEM55B interacts with members of the NEDD4-like family of E3 ligases via a PPXY motif, inducing their recruitment to the lysosomal surface.”
§ TMEM55B links autophagy flux, lysosomal repair, and TFE3 activation in response to oxidative stress > Discussion
plaindirect- Asserted: passes — The authors put it forward as true.
- Checkable: passes — It can be checked against evidence.
- Load-bearing: passes — The paper’s conclusions depend on it.
- Based: passes — The paper gives a reason why it holds.
It may state two separate claims as one.
A conclusion the paper draws from its own results — it cites no other source for it, so there is none to check. The quote shows it is in the paper.
In the paper
“Altogether, our data suggest that TMEM55B recruits NEDD4-like E3 ligases to lysosomes, which upon stress-mediated activation, might mediate ubiquitination of lysosomal proteins.”
§ TMEM55B links autophagy flux, lysosomal repair, and TFE3 activation in response to oxidative stress > Results > TMEM55B interacts with NEDD4-like E3 ligases
hedgedconditional- Asserted: passes — The authors put it forward as true.
- Checkable: passes — It can be checked against evidence.
- Load-bearing: passes — The paper’s conclusions depend on it.
- Based: passes — The paper gives a reason why it holds.
It may state two separate claims as one.
A conclusion the paper draws from its own results — it cites no other source for it, so there is none to check. The quote shows it is in the paper.
In the paper
“Altogether, our data indicate that TMEM55B is ubiquitinated in several residues in response to oxidative stress and that the PPXY motif is required for TMEM55B ubiquitination.”
§ TMEM55B links autophagy flux, lysosomal repair, and TFE3 activation in response to oxidative stress > Results > TMEM55B is ubiquitinated in response to oxidative stress
hedgeddirect- Asserted: passes — The authors put it forward as true.
- Checkable: passes — It can be checked against evidence.
- Load-bearing: passes — The paper’s conclusions depend on it.
- Based: passes — The paper gives a reason why it holds.
It may state two separate claims as one.
- Rests on an assumption: NaAsO2 treatment induces oxidative stress as the relevant mechanism for the observed cellular effects.
A conclusion the paper draws from its own results — it cites no other source for it, so there is none to check. The quote shows it is in the paper.
In the paper
“These results suggest that TMEM55B may halt fusion of autophagosomes with damaged lysosomes, while at the same time promoting their repair.”
§ TMEM55B links autophagy flux, lysosomal repair, and TFE3 activation in response to oxidative stress > Results > TMEM55B promotes ESCRT recruitment to lysosomes
hedgedconditional- Asserted: passes — The authors put it forward as true.
- Checkable: passes — It can be checked against evidence.
- Load-bearing: passes — The paper’s conclusions depend on it.
- Based: passes — The paper gives a reason why it holds.
It may state two separate claims as one.
- Rests on an assumption: ESCRT recruitment to lysosomes is an early event following lysosomal damage.
- Rests on an assumption: Extensive damage that cannot be repaired by the ESCRT complex leads to accumulation of galectins, triggering elimination of damaged lysosomes by lysophagy.
In the paper
“Since the ESCRT complex plays an important role in mediating lysosome repair19, we hypothesized that TMEM55B may facilitate ubiquitin-dependent ESCRT recruitment to the lysosomal membrane in response to oxidative stress.”
§ TMEM55B links autophagy flux, lysosomal repair, and TFE3 activation in response to oxidative stress > Results > TMEM55B promotes ESCRT recruitment to lysosomes
What the sources say
- Not checked — no full text of the sourcecites [19] Papadopoulos, C., Kravic, B. & Meyer, H. Repair or lysophagy: dealing with damaged lysosomes. J. Mol. Biol. 432, 231–239 (2020). source
plaindirect- Asserted: passes — The authors put it forward as true.
- Checkable: passes — It can be checked against evidence.
- Load-bearing: passes — The paper’s conclusions depend on it.
- Based: passes — The paper gives a reason why it holds.
Probably not a substantial claim.
A conclusion the paper draws from its own results — it cites no other source for it, so there is none to check. The quote shows it is in the paper.
In the paper
“This ubiquitination, together with the presence of a PSAP motif, promotes the recruitment of ESCRT proteins and facilitates lysosomal repair.”
§ TMEM55B links autophagy flux, lysosomal repair, and TFE3 activation in response to oxidative stress > Discussion
plaindirect- Asserted: passes — The authors put it forward as true.
- Checkable: passes — It can be checked against evidence.
- Load-bearing: passes — The paper’s conclusions depend on it.
- Based: passes — The paper gives a reason why it holds.
It may state two separate claims as one.
What the paper did — it cites no source for this, so there is none to check. The quote shows it is in the paper.
In the paper
“Each experiment was replicated at least three times.”
- Also stated in: § Statistics and reproducibility · plain
“Each experiment was performed at least three times independently with similar results unless otherwise mentioned in figure legends.”
§ TMEM55B links autophagy flux, lysosomal repair, and TFE3 activation in response to oxidative stress > Methods > Quantitative real-time PCR
plain- Asserted: passes — The authors put it forward as true.
- Checkable: passes — It can be checked against evidence.
- Load-bearing: fails — The paper’s conclusions may not depend on it.
- Based: passes — The paper gives a reason why it holds.
Probably not a substantial claim. The paper’s conclusions may not depend on it.
- Also stated in: § Statistics and reproducibility · plain
What the paper did — it cites no source for this, so there is none to check. The quote shows it is in the paper.
In the paper
“Zebrafish husbandry and embryo staging were performed in accordance with relevant guidelines and regulations.”
§ TMEM55B links autophagy flux, lysosomal repair, and TFE3 activation in response to oxidative stress > Methods > Zebrafish husbandry and imaging
plain- Asserted: passes — The authors put it forward as true.
- Checkable: passes — It can be checked against evidence.
- Load-bearing: fails — The paper’s conclusions may not depend on it.
- Based: fails — The paper may give no reason why it holds.
Probably not a substantial claim. The paper’s conclusions may not depend on it. The paper may give no reason why it holds.
What the paper did — it cites no source for this, so there is none to check. The quote shows it is in the paper.
In the paper
“TMEM55B KO clones were verified by sequencing and western blotting analysis.”
§ TMEM55B links autophagy flux, lysosomal repair, and TFE3 activation in response to oxidative stress > Methods > Cell lines cultures and treatments
plain- Asserted: passes — The authors put it forward as true.
- Checkable: passes — It can be checked against evidence.
- Load-bearing: passes — The paper’s conclusions depend on it.
- Based: passes — The paper gives a reason why it holds.
Probably not a substantial claim.
What the paper did — it cites no source for this, so there is none to check. The quote shows it is in the paper.
In the paper
“Only embryos from injections with high target frequency were moved into the system and grown until adulthood.”
§ TMEM55B links autophagy flux, lysosomal repair, and TFE3 activation in response to oxidative stress > Methods > Generation of zebrafish TMEM55 KO lines
plain- Asserted: passes — The authors put it forward as true.
- Checkable: passes — It can be checked against evidence.
- Load-bearing: fails — The paper’s conclusions may not depend on it.
- Based: passes — The paper gives a reason why it holds.
Probably not a substantial claim. The paper’s conclusions may not depend on it.
What the paper did — it cites no source for this, so there is none to check. The quote shows it is in the paper.
In the paper
“Specificity of the RT-PCR products was assessed by gel electrophoresis. A single product with the expected length was detected for each reaction.”
§ TMEM55B links autophagy flux, lysosomal repair, and TFE3 activation in response to oxidative stress > Methods > Quantitative real-time PCR
plain- Asserted: passes — The authors put it forward as true.
- Checkable: passes — It can be checked against evidence.
- Load-bearing: fails — The paper’s conclusions may not depend on it.
- Based: passes — The paper gives a reason why it holds.
Probably not a substantial claim. The paper’s conclusions may not depend on it.
What the paper did — it cites no source for this, so there is none to check. The quote shows it is in the paper.
In the paper
“Immunoblots were quantitated with densitometric analysis using ImageJ (NIH) and normalized to GAPDH as a loading control.”
§ TMEM55B links autophagy flux, lysosomal repair, and TFE3 activation in response to oxidative stress > Methods > Immunoprecipitation and immunoblotting
plain- Asserted: passes — The authors put it forward as true.
- Checkable: passes — It can be checked against evidence.
- Load-bearing: passes — The paper’s conclusions depend on it.
- Based: passes — The paper gives a reason why it holds.
Probably not a substantial claim.
A conclusion the paper draws from its own results — it cites no other source for it, so there is none to check. The quote shows it is in the paper.
In the paper
“Likewise, TMEM55B recruits TSG101, presumably via its P(S/T)AP motif, while its NEDD4-dependent ubiquitination may further facilitate recruitment of the ESCRT machinery.”
§ TMEM55B links autophagy flux, lysosomal repair, and TFE3 activation in response to oxidative stress > Discussion
hedgedconditional- Asserted: passes — The authors put it forward as true.
- Checkable: passes — It can be checked against evidence.
- Load-bearing: passes — The paper’s conclusions depend on it.
- Based: passes — The paper gives a reason why it holds.
It may state two separate claims as one.
What the paper did — it cites no source for this, so there is none to check. The quote shows it is in the paper.
In the paper
“No data were excluded from the analyses.”
§ TMEM55B links autophagy flux, lysosomal repair, and TFE3 activation in response to oxidative stress > Methods > Statistics and reproducibility
plain- Asserted: passes — The authors put it forward as true.
- Checkable: passes — It can be checked against evidence.
- Load-bearing: fails — The paper’s conclusions may not depend on it.
- Based: passes — The paper gives a reason why it holds.
Probably not a substantial claim. The paper’s conclusions may not depend on it.
What the paper did — it cites no source for this, so there is none to check. The quote shows it is in the paper.
In the paper
“All peptides were filtered out at 1% false discovery rate (FDR) and their relative abundances were compared based on the areas under curve (AUC) of their corresponding chromatographic peaks.”
§ TMEM55B links autophagy flux, lysosomal repair, and TFE3 activation in response to oxidative stress > Methods > Mass spectrometry
plain- Asserted: passes — The authors put it forward as true.
- Checkable: passes — It can be checked against evidence.
- Load-bearing: fails — The paper’s conclusions may not depend on it.
- Based: passes — The paper gives a reason why it holds.
Probably not a substantial claim. The paper’s conclusions may not depend on it.
What the paper did — it cites no source for this, so there is none to check. The quote shows it is in the paper.
In the paper
“The experiments were not randomized.”
§ TMEM55B links autophagy flux, lysosomal repair, and TFE3 activation in response to oxidative stress > Methods > Statistics and reproducibility
plain- Asserted: passes — The authors put it forward as true.
- Checkable: passes — It can be checked against evidence.
- Load-bearing: fails — The paper’s conclusions may not depend on it.
- Based: passes — The paper gives a reason why it holds.
Probably not a substantial claim. The paper’s conclusions may not depend on it.
What the paper did — it cites no source for this, so there is none to check. The quote shows it is in the paper.
In the paper
“Statistical analysis was performed on pairwise comparison of individual survival curves using both the logrank (Mantel-Cox) test and the Gehan-Breslow-Wilcoxon test, obtaining the same results.”
§ TMEM55B links autophagy flux, lysosomal repair, and TFE3 activation in response to oxidative stress > Methods > NaAsO2 treatment and survival assay in zebrafish embryos
plain- Asserted: passes — The authors put it forward as true.
- Checkable: passes — It can be checked against evidence.
- Load-bearing: fails — The paper’s conclusions may not depend on it.
- Based: passes — The paper gives a reason why it holds.
Probably not a substantial claim. The paper’s conclusions may not depend on it.
What the paper did — it cites no source for this, so there is none to check. The quote shows it is in the paper.
In the paper
“No statistical method was used to predetermine the sample size.”
§ TMEM55B links autophagy flux, lysosomal repair, and TFE3 activation in response to oxidative stress > Methods > Statistics and reproducibility
plain- Asserted: passes — The authors put it forward as true.
- Checkable: passes — It can be checked against evidence.
- Load-bearing: fails — The paper’s conclusions may not depend on it.
- Based: passes — The paper gives a reason why it holds.
Probably not a substantial claim. The paper’s conclusions may not depend on it.
What the paper did — it cites no source for this, so there is none to check. The quote shows it is in the paper.
In the paper
“All the primer pairs were designed on different exons to avoid the amplification of DNA possibly contaminating cDNA preparations.”
§ TMEM55B links autophagy flux, lysosomal repair, and TFE3 activation in response to oxidative stress > Methods > Total RNA extraction from zebrafish embryos and cDNA synthesis
plaindirect- Asserted: passes — The authors put it forward as true.
- Checkable: passes — It can be checked against evidence.
- Load-bearing: fails — The paper’s conclusions may not depend on it.
- Based: passes — The paper gives a reason why it holds.
Probably not a substantial claim. The paper’s conclusions may not depend on it.
What the paper did — it cites no source for this, so there is none to check. The quote shows it is in the paper.
In the paper
“All zebrafish experiments were performed in compliance with the National Institutes of Health (NIH) guidelines for animal handling and research under NHLBI Animal Care and Use Committee (ACUC) approved protocol H-0252R5.”
§ TMEM55B links autophagy flux, lysosomal repair, and TFE3 activation in response to oxidative stress > Methods > Ethical statement
plain- Asserted: passes — The authors put it forward as true.
- Checkable: passes — It can be checked against evidence.
- Load-bearing: fails — The paper’s conclusions may not depend on it.
- Based: passes — The paper gives a reason why it holds.
Probably not a substantial claim. The paper’s conclusions may not depend on it.
What the paper did — it cites no source for this, so there is none to check. The quote shows it is in the paper.
In the paper
“The confidence of phosphorylation site localization is assessed with ptmRS node in Proteome Discoverer 2.2 platform (ThermoFisher Scientific).”
§ TMEM55B links autophagy flux, lysosomal repair, and TFE3 activation in response to oxidative stress > Methods > Mass spectrometry
plain- Asserted: passes — The authors put it forward as true.
- Checkable: passes — It can be checked against evidence.
- Load-bearing: fails — The paper’s conclusions may not depend on it.
- Based: passes — The paper gives a reason why it holds.
Probably not a substantial claim. The paper’s conclusions may not depend on it.
What the paper did — it cites no source for this, so there is none to check. The quote shows it is in the paper.
In the paper
“The Investigators were not blinded to allocation during experiments and outcome assessment.”
§ TMEM55B links autophagy flux, lysosomal repair, and TFE3 activation in response to oxidative stress > Methods > Statistics and reproducibility
plain- Asserted: passes — The authors put it forward as true.
- Checkable: passes — It can be checked against evidence.
- Load-bearing: fails — The paper’s conclusions may not depend on it.
- Based: passes — The paper gives a reason why it holds.
Probably not a substantial claim. The paper’s conclusions may not depend on it.
The paper relies on this without support.
NaAsO2 treatment induces oxidative stress as the relevant mechanism for the observed cellular effects.
“generation of oxidative stress by treatment with NaAsO2”
The paper relies on this without support.
ESCRT recruitment to lysosomes is an early event following lysosomal damage.
“ESCRT recruitment to lysosomes is an early event following lysosomal damage.”
The paper relies on this without support.
Extensive damage that cannot be repaired by the ESCRT complex leads to accumulation of galectins, triggering elimination of damaged lysosomes by lysophagy.
“Extensive damage that cannot be repaired by the ESCRT complex leads to accumulation of galectins, triggering elimination of damaged lysosomes by lysophagy.”
The paper relies on this without support.
TFEB and TFE3 orchestrate cellular response to stress by promoting expression of lysosomal and autophagic genes, contributing to elimination of waste material and restoration of energy homeostasis.
“The transcription factors TFEB and TFE3 orchestrate cellular response to a variety of stress conditions. By promoting expression of lysosomal and autophagic genes, TFEB and TFE3 contribute to the elimination of waste material and the restoration of energy homeostasis.”
The paper relies on this without support.
TMEM55B regulates lysosomal positioning by interacting with JIP4 to connect lysosomes to dynein for retrograde movement, relevant during starvation.
“The role of TMEM55B in regulating lysosomal positioning is well established. Through its interaction with JIP4, TMEM55B connects lysosomes to the minus-end microtubule motor dynein, allowing retrograde movement of lysosomes from the periphery to the cell center. This function is particularly relevant during starvation conditions, when lysosomal retrograde movement facilitates contact and fusion of”
Claims other papers make about this one
Each is checked against this paper’s own text: does it say what the citing paper says it does?
The cited source says what the claim attributes to it.
In the citing paper
“and that it is not only critical under stress conditions as suggested previously, at least in neurons (Jeong et al., 2024).”
From TMEM55B promotes anterograde transport and distal axonal distribution of LAMP1-positive organelles (2026) · cites this paper as Jeong et al., 2024
The cited source says what the claim attributes to it.
In the citing paper
“TMEM55B also regulates autophagosome-lysosome fusion, lysosomal repair, and TFE3 nuclear translocation under stress (Jeong et al. 2024), interacts with amino-acid sensing complexes (Hashimoto et al. 2018), and modulates cholesterol metabolism via PI(4,5)P2 phosphatase activity (Qin et al. 2020).”
From TMEM55B downregulation promotes neurodegeneration in Alzheimer’s disease models (2026) · cites this paper as Jeong et al. 2024
In the citing paper
“TMEM55B mediates PLEKHM1 degradation, ESCRT repair, and TFE3 activation (Jeong et al. 2024).”
From TMEM55B downregulation promotes neurodegeneration in Alzheimer’s disease models (2026) · cites this paper as Jeong et al. 2024
Self-check
Percentages, sums and reported differences re-computed from the paper’s own numbers.
Each contradiction between two passages listed here was confirmed by an independent check.
Rated minor: it would not touch a result — a value no result rests on, a p-value that stays on the same side of the significance level, or a conflict that is clerical, resolved elsewhere in the paper, or outside its own findings.
In the paper
§ TMEM55B links autophagy flux, lysosomal repair, and TFE3 activation in response to oxidative stress > Results > Acute oxidative stress induces TMEM55B phosphorylation
“Furthermore, JAK3 IV inhibitors, which were recently reported to block oxidative stress-mediated phosphorylation of JIP49, did not stop the dissociation of the TMEM55B/JIP4 complex under our experimental conditions (Supplementary Fig. 3d).”
§ TMEM55B links autophagy flux, lysosomal repair, and TFE3 activation in response to oxidative stress > Methods > Cell lines cultures and treatments
“JAK3 VI inhibitor (Sigama-Aldrich, 420126)”
Rated minor: it would not touch a result — a value no result rests on, a p-value that stays on the same side of the significance level, or a conflict that is clerical, resolved elsewhere in the paper, or outside its own findings.
In the paper
§ TMEM55B links autophagy flux, lysosomal repair, and TFE3 activation in response to oxidative stress > Methods > NaAsO2 treatment and survival assay in zebrafish embryos
“The medium was removed and changed with a 2 mM solution of NaAsO2 (ChemCruz, CAS number 7784-46-5) in E3 medium from a 1 mM stock solution in ultra-pure water.”
§ TMEM55B links autophagy flux, lysosomal repair, and TFE3 activation in response to oxidative stress > Methods > NaAsO2 treatment and survival assay in zebrafish embryos
“the solutions were changed with new ones prepared fresh every day from a 1 M NaAsO2 stock solution prepared daily diluting the powder in ultra-pure water.”
Citations
Cites
The PRIDE database resources in 2022: a hub for mass spectrometry-based proteomics evidences
Perez-Riverol, Y., Bai, J., Bandla, C., García-Seisdedos, D., Hewapathirana, S., Kamatchinathan, S., Kundu, D. J., Prakash, A., Frericks-Zipper, A., Eisenacher, M., et al. (2022) · Nucleic Acids Research · doi:10.1093/nar/gkab1038 · Cited by 6,125
Lysosomes: fusion and function
Luzio, J. P., Pryor, P. R., & Bright, N. A. (2007) · Nature Reviews Molecular Cell Biology · doi:10.1038/nrm2217 · Cited by 1,807
Lysosomes as dynamic regulators of cell and organismal homeostasis
Ballabio, A., & Bonifacino, J. S. (2020) · Nature Reviews Molecular Cell Biology · doi:10.1038/s41580-019-0185-4 · Cited by 1,469
Physiological functions of the HECT family of ubiquitin ligases
Rotin, D., & Kumar, S. (2009) · Nature Reviews Molecular Cell Biology · doi:10.1038/nrm2690 · Cited by 1,105
Martina, J. A., Diab, H. I., Lishu, L., Jeong-A, L., Patange, S., Raben, N., & Puertollano, R. (2014) · Science Signaling · doi:10.1126/scisignal.2004754 · Cited by 677
Self-citationTriggered recruitment of ESCRT machinery promotes endolysosomal repair
Skowyra, M. L., Schlesinger, P. H., Naismith, T. V., & Hanson, P. I. (2018) · Science · doi:10.1126/science.aar5078 · Cited by 578
Mechanisms and functions of lysosome positioning
Pu, J., Guardia, C. M., Keren-Kaplan, T., & Bonifacino, J. S. (2016) · Journal of Cell Science · doi:10.1242/jcs.196287 · Cited by 570
Tsun, Z.-Y., Bar-Peled, L., Chantranupong, L., Zoncu, R., Wang, T., Kim, C., Spooner, E., & Sabatini, D. M. (2013) · Molecular Cell · doi:10.1016/j.molcel.2013.09.016 · Cited by 565
PLEKHM1 Regulates Autophagosome-Lysosome Fusion through HOPS Complex and LC3/GABARAP Proteins
McEwan, D. G., Popovic, D., Gubas, A., Terawaki, S., Suzuki, H., Stadel, D., Coxon, F. P., Miranda de Stegmann, D., Bhogaraju, S., Maddi, K., et al. (2015) · Molecular Cell · doi:10.1016/j.molcel.2014.11.006 · Cited by 563
ESCRT‐mediated lysosome repair precedes lysophagy and promotes cell survival
Radulovic, M., Schink, K. O., Wenzel, E. M., Nähse, V., Bongiovanni, A., Lafont, F., & Stenmark, H. (2018) · The EMBO Journal · doi:10.15252/embj.201899753 · Cited by 496
Cited by
Sorted by citations
Key Mechanisms in Lysosome Stability, Degradation and Repair
Zhang, R., Vooijs, M., & Keulers, T. G. (2025) · Molecular and Cellular Biology · doi:10.1080/10985549.2025.2494762 · Cited by 48
Lysosomal Repair in Health and Disease
Xun, J., & Tan, J. X. (2025) · Journal of Cellular Physiology · doi:10.1002/jcp.70044 · Cited by 24
TFEB and TFE3 regulate STING1-dependent immune responses by controlling type I interferon signaling
Tapía, P., Martina, J. A., Contreras, P. S., Prashar, A., Jeong, E., Nardo, D. D., & Puertollano, R. (2025) · Autophagy · doi:10.1080/15548627.2025.2487036 · Cited by 21
Self-citationHu, Y., Yang, Z., Wang, X., Li, X., & Wei, M. (2026) · Antioxidants · doi:10.3390/antiox15010073 · Cited by 18
Long, Z., Li, Y., Yu, T. Y., Li, T., Wang, J., Zhang, Y., Li, H., Yin, P., Zhou, H., & Yao, S. (2025) · Analytical Chemistry · doi:10.1021/acs.analchem.5c02130 · Cited by 18
Loss of TMEM55B modulates lipid metabolism through dysregulated lipophagy and mitochondrial function
Qin, Y., Teker, S. S., Cunza, N. L., Tong, Y., Theusch, E., Yang, N. V., Venkatesan, L., Su, J., Wang, X., Krauss, R. M., et al. (2026) · Cell Death and Disease · doi:10.1038/s41419-025-08210-x · Cited by 5
Liu, D., Mao, J., Dai, Y., Li, K., Tian, Q., Xue, F., Yang, S., & An, L. (2026) · Nanoscale · doi:10.1039/d5nr03792a · Cited by 5
Rissone, A., Spina, M. L., Bresciani, E., Syed, Z. A., Combs, C. A., Kirby, M., ELKAHLOUN, A. G., Chen, V., Sood, R. B., Burgess, S. M., et al. (2025) · PLoS Genetics · doi:10.1371/journal.pgen.1011754 · Cited by 4
Self-citationGenkwanin reduces airway epithelial cell ferroptosis and alleviates asthma symptoms in mice
Chen, X., Liu, J., An, Z., Li, M., Ji, X.-H., Huang, J., & Yan, X. (2025) · Phytomedicine · doi:10.1016/j.phymed.2025.157306 · Cited by 3
Nadar‐Ponniah, P. T., & Lopez-Escamez, J. A. (2025) · Journal of Clinical Medicine · doi:10.3390/jcm14051427 · Cited by 3
The multifaceted significance of phosphoinositides in endocytic trafficking
Xie, C., & Shi, A. (2026) · FEBS Letters · doi:10.1002/1873-3468.70268 · Cited by 2
Snead, A. M., Patel, S., Krout, M., Hippman, R. S., Smith, G., Dileep, D., Chagoor, N., Shi, R., Linares-Saldana, R., Dobria, A., et al. (2024) · bioRxiv (Cold Spring Harbor Laboratory) · doi:10.1101/2024.11.04.621986 · Cited by 2
Effect of spermidine on cuproptosis in follicular granulosa cells
Li, S., Qi, Y., Qi, Y., Wang, Z., Xu, S., Xiao, T., Zhu, Y., Zheng, W., Wang, X., Jiang, D., et al. (2025) · British Poultry Science · doi:10.1080/00071668.2025.2454962 · Cited by 1
Zhao, G. F., Shen, Y., Ma, J., Huang, X. S., Chen, J., Shi, J., xia, J., Wang, S., Huang, G., & Wu, W. (2026) · Journal of Orthopaedic Translation · doi:10.1016/j.jot.2025.11.002 · Cited by 1
Liu, Y., Zhang, Y., Yu, S., Yang, Q., & He, G. (2026) · European Journal of Pharmacology · doi:10.1016/j.ejphar.2026.178561 · Cited by 1
TMEM55B—Jack of all trades in the endo-lysosomal system?
Daμμe, M., & Kümmel, D. (2026) · Structure · doi:10.1016/j.str.2025.12.012 · Cited by 1
Moore, J., Rao, L., Garcia-Bellido, S., Guo, F., Botas, J., & Botas, J. (2026) · Neurobiology of Disease · doi:10.1016/j.nbd.2026.107364 · Cited by 1
Kunselman, J. M., Williamson, C. D., Golding, A. E., Jia, R., Sohn, M., Dale, R., & Bonifacino, J. S. (2025) · Molecular Biology of the Cell · doi:10.1091/mbc.e25-07-0346 · Cited by 1
TMEM55B downregulation promotes neurodegeneration in Alzheimer’s disease models
Roy, B., Contu, V. R., Jeziorek, M., Friedman, W. J., & Wong, C.-O. (2026) · doi:10.64898/2026.10.21.760809
TMEM55B promotes anterograde transport and distal axonal distribution of LAMP1-positive organelles
Rudnik, S., Li, C. H., Gottschling, D.-C., Veh, A., Barbosa, D. J., Richter, J., Stroobants, S., Schuster, B., Beck, I. M., Sedlack, R., et al. (2026) · doi:10.64898/2026.10.27.762112
JIP4 deficiency causes a lysosomal storage disease arising from impaired cystine effluxPreprint
Nassar, L. M., Shi, X., Roczniak-Ferguson, A., Shen, H., & Ferguson, S. M. (2025) · bioRxiv (Cold Spring Harbor Laboratory) · doi:10.1101/2025.06.06.657909
TMEM55B Maintains Lysosomal Homeostasis and Promotes ER –Lysosome Calcium Signaling
Mukae, N., Maki, H., & Shirane, M. (2026) · Traffic · doi:10.1101/2025.10.21.683636
Jeong, E., Willett, R. A., Rissone, A., Spina, M. L., & Puertollano, R. (2024) · Figshare · doi:10.25444/nhlbi.24982584
Self-citationCo-option of Lysosomal machinery for sponge biosilicification
Rangarajan-Paul, M., Nichols, S., & Tresguerres, M. (2026) · Journal of Experimental Biology · doi:10.1242/jeb.252876
Zheng, H., Zhu, Z., Zhu, J., Chen, D., Ruan, R., & Ning, R. (2026) · International Journal of General Medicine · doi:10.2147/ijgm.s581128
Mucoadhesive Antioxidant Nanoadjuvant Delivers Enhanced Intranasal Influenza Vaccine Immunogenicity
Yin, J., Zhao, Y., Li, Z. L., Xu, Y., Wang, Z., Zhang, J., & Miao, J. (2026) · ACS Applied Materials & Interfaces · doi:10.1021/acsami.6c07805
Retromer-targeted therapy for neurodegenerative diseases
Persico, M., Tuithung, S., Lorenzo, A., Crawford, D., Eleuteri, S., & Simon, D. K. (2026) · Molecular Neurodegeneration · doi:10.1186/s13024-026-00971-z
BmCPV subverts autophagic flux by suppressing TMEM55B to facilitate viral replication
Mo, X., Song, W., Sui, L., Jiang, S., He, H., Zhang, Y., Cheng, J., Qian, P., & Tang, X. (2026) · Gene · doi:10.1016/j.gene.2026.150417
Metadata
- Authors
- Jeong, E., Willett, R., Rissone, A., La Spina, M., & Puertollano, R.
- Affiliations
- National Institutes of Health (US)
- Corresponding author
- Puertollano, Rosa
- Venue
- Nature Communications
- Published
- 2024-01-02
- Volume
- 15
- Issue
- 1
- Pages
- 93-93
- ISSN
- 2041-1723 (ISSN-L)
- PMC
- PMC10761734
- OpenAlex
- W4390499631
- Cited by
- 25
- References
- 46
- Citations by year
- 2026: 14 · 2025: 10 · 2024: 1
- FWCI
- 3.95
- Type
- journal article
- Language
- en
- Open access
- gold
- doi.org
- Locations
- Nature Communications (publishedVersion, cc-by)
- PubMed Central (publishedVersion, cc-by)
- PubMed (publishedVersion)
- Padua Research Archive (University of Padova) (submittedVersion, cc-by)
- RePEc: Research Papers in Economics (submittedVersion)
- DOAJ (DOAJ: Directory of Open Access Journals) (submittedVersion, cc-by-sa)
- Funders
- U.S. Department of Health & Human Services | National Institutes of Health (ZIA HL006075)
- Topics
- Life Sciences › Biochemistry, Genetics and Molecular Biology › Cell Biology › Autophagy in Disease and Therapy
- Life Sciences › Biochemistry, Genetics and Molecular Biology › Physiology › Calcium signaling and nucleotide metabolism
- Life Sciences › Biochemistry, Genetics and Molecular Biology › Cell Biology › Cellular transport and secretion
- Keywords
- autophagic flux, oxidative stress, NEDD4, ESCRT machinery, lysosomal membrane repair, arsenite toxicity, zebrafish, lysosomes
- MeSH terms
- Animals, Autophagy, Lysosomes, Zebrafish, Oxidative Stress, Basic Helix-Loop-Helix Leucine Zipper Transcription Factors
About these checks
Registry, retraction, Cites and statistics results are computed, not judged, with one exception: a printed reference that no index lists is read once by a model before it counts as a citation error. Claims are extracted by a model and kept only when their quote appears verbatim in the text; each cited source is then checked, with a model’s help, for whether it says what the claim relies on. Those verdicts can be wrong — read the claim’s quote and the cited source before relying on one.
A language model drew the claims from the paper on 2026-11-09, under version 3 of the claim definition (model deepseek-v4.1-flash, prompt extract-v3).
A second model labelled each claim on 2026-11-09 (model jev-1.13-20260917, definition revision gold-guideline-v0.2).
Cited sources are checked with a language model’s help (gpt-6-sol).
Statistics and arithmetic are recomputed, not judged.
Confidence bands are shown only for fields calibrated on our annotated test set. None is calibrated yet, so no band is shown.
What counts as a claim ›How we measure confidence ›How we check this ›
Are you an author, or do you see a problem with this page? Request a review
