

The DOI matches its Crossref record; 56 of the 58 references it cites were found in a registry or an index.
Critical assessment of protein intrinsic disorder prediction
Open accessPublished version of a preprint
Abstract
Abstract Intrinsically disordered proteins, defying the traditional protein structure–function paradigm, are a challenge to study experimentally. Because a large part of our knowledge rests on computational predictions, it is crucial that their accuracy is high. The Critical Assessment of protein Intrinsic Disorder prediction (CAID) experiment was established as a community-based blind test to determine the state of the art in prediction of intrinsically disordered regions and the subset of residues involved in binding. A total of 43 methods were evaluated on a dataset of 646 proteins from DisProt. The best methods use deep learning techniques and notably outperform physicochemical methods. The top disorder predictor has F max = 0.483 on the full dataset and F max = 0.792 following filtering out of bona fide structured regions. Disordered binding regions remain hard to predict, with F max = 0.231. Interestingly, computing times among methods can vary by up to four orders of magnitude.
Overview
The claims and statistics of this paper haven’t been checked yet.
Run the check — free, no account needed. It reads the open-access text and checks the sources it cites.
Integrity signals
Registry
Cites
Statistics
Figures
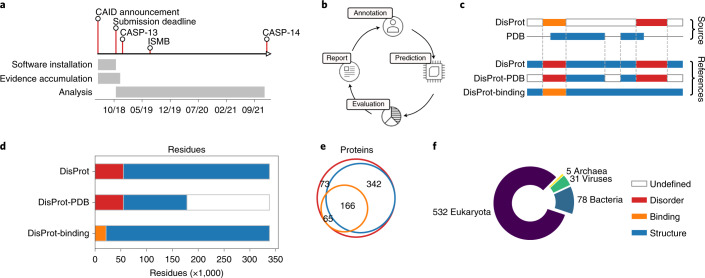
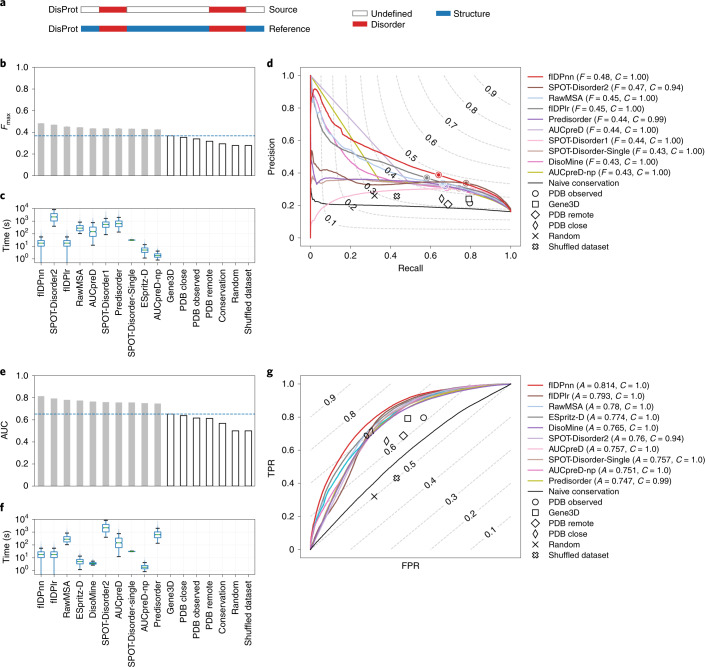
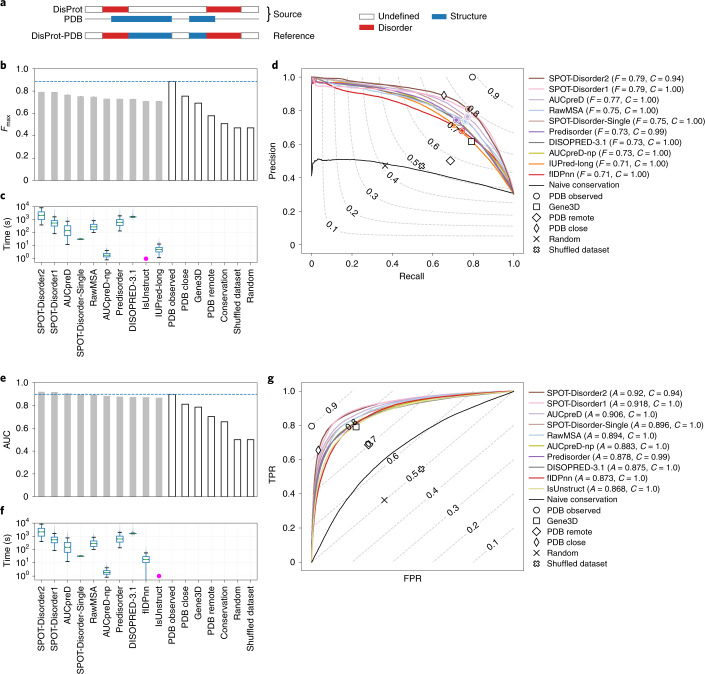
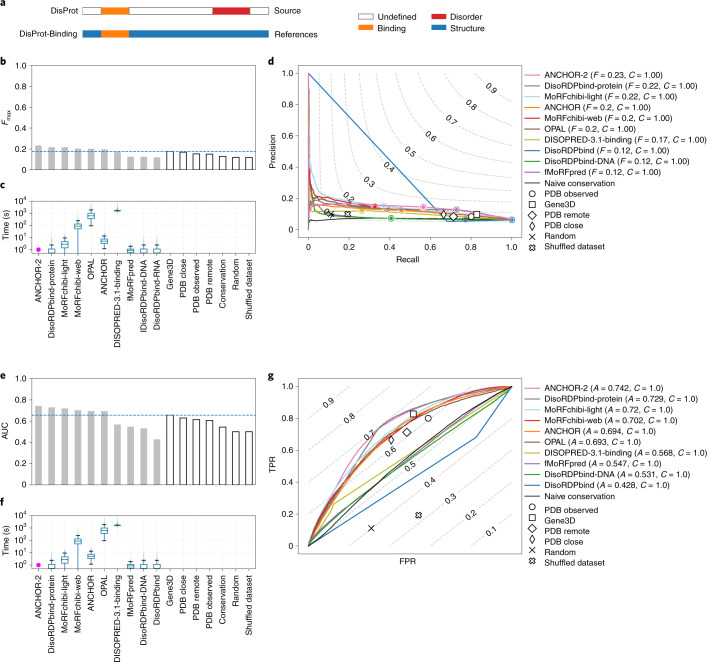
Verification
Claims the paper makes
The claims and statistics of this paper haven’t been checked yet.
Run the check — free, no account needed. It reads the open-access text and checks the sources it cites.
Claims other papers make about this one
Each is checked against this paper’s own text: does it say what the citing paper says it does?
The check wasn’t confident either way, so it gives no verdict — never disputed.
In the citing paper
“Conservative estimates indicate that roughly 30% of sequences, 30residues or longer, drawn at random from the human proteome, are likely to be IDRs. 3,5”
From AlphaFold and Implications for Intrinsically Disordered Proteins (2021) · cites this paper as [5]
Experimental — accuracy not yet measuredIn the citing paper
“pLDDT scores have been shown to be a competitive disorder predictor compared to standards in disorder prediction.5”
From AlphaFold and Implications for Intrinsically Disordered Proteins (2021) · cites this paper as [5]
Self-check
Percentages, sums and reported differences re-computed from the paper’s own numbers.
The self-check needs the paper’s full text.
Citations
Cites
Gapped BLAST and PSI-BLAST: a new generation of protein database search programs
Altschul, S. (1997) · Nucleic Acids Research · doi:10.1093/nar/25.17.3389 · Cited by 73,302
UniProt: the Universal Protein knowledgebase
Apweiler, R. (2003) · Nucleic Acids Research · doi:10.1093/nar/gkh131 · Cited by 7,593
UniProt: the universal protein knowledgebase
The UniProt Consortium (2017) · Nucleic Acids Research · doi:10.1093/nar/gkw1099 · Cited by 4,436
Intrinsically disordered proteins in cellular signalling and regulation
Wright, P. E., & Dyson, H. J. (2014) · Nature Reviews Molecular Cell Biology · doi:10.1038/nrm3920 · Cited by 2,482
Prediction and Functional Analysis of Native Disorder in Proteins from the Three Kingdoms of Life
Ward, J. J., Sodhi, J. S., McGuffin, L. J., Buxton, B. F., & Jones, D. T. (2004) · Journal of Molecular Biology · doi:10.1016/j.jmb.2004.02.002 · Cited by 2,010
Mészáros, B., Erdős, G., & Dosztányi, Z. (2018) · Nucleic Acids Research · doi:10.1093/nar/gky384 · Cited by 1,454
InterPro in 2019: improving coverage, classification and access to protein sequence annotations
Mitchell, A. L., Attwood, T. K., Babbitt, P. C., Blum, M., Bork, P., Bridge, A., Brown, S. D., Chang, H.-Y., El-Gebali, S., Fraser, M. I., et al. (2019) · Nucleic Acids Research · doi:10.1093/nar/gky1100 · Cited by 1,426
Coupling of folding and binding for unstructured proteins
Dyson, H. J., & Wright, P. E. (2002) · Current Opinion in Structural Biology · doi:10.1016/s0959-440x(02)00289-0 · Cited by 1,327
Linding, R., Jensen, L. J., Diella, F., Bork, P., Gibson, T. J., & Russell, R. B. (2003) · Structure · doi:10.1016/j.str.2003.10.002 · Cited by 1,235
Intrinsic Disorder in Cell-signaling and Cancer-associated Proteins
Iakoucheva, L. M., Brown, C. J., Lawson, J. D., Obradović, Z., & Dunker, A. K. (2002) · Journal of Molecular Biology · doi:10.1016/s0022-2836(02)00969-5 · Cited by 1,214
Cited by
Sorted by citations
Items 301–343 of 343
AFFIPred : AlphaFold2 structure‐based Functional Impact Prediction of missense variations
Pir, M. S., & Timucin, E. (2025) · Protein Science · doi:10.1002/pro.70030
Ito, T., Ota, K., Hishinuma, H., & Shimizu, H. (2025) · bioRxiv (Cold Spring Harbor Laboratory) · doi:10.1101/2025.06.10.658754
The effects of retinal disease on intrinsic protein disorder and liquid–liquid-phase separation
Hadzijahic, N., Kim, C. K., Djulbegovic, M. B., Antonietti, M., Gonzalez, D. J. T., Uversky, V. N., Pulido, J. S., & Karp, C. L. (2025) · Journal of Proteins and Proteomics · doi:10.1007/s42485-025-00188-6
Prediction of Intrinsically Disordered Lipid Binding Residues with DisoLipPred
Zhao, B., & Kurgan, L. (2025) · Methods in molecular biology · doi:10.1007/978-1-0716-4662-5_17
Wu, C., Zhang, F., Jia, P., Zeng, M., & Li, M. (2025) · Lecture notes in computer science · doi:10.1007/978-981-95-0698-9_15
Exploring the Bottleneck in Cryo-EM Dynamic Disorder Feature and Advanced Hybrid Prediction Model
Zheng, S. (2025) · Biophysica · doi:10.3390/biophysica5030039 · Cited by 1
Comparative assessment of binding residue predictions in intrinsically disordered regions
Basu, S., & Kurgan, L. (2025) · Protein Science · doi:10.1002/pro.70298
Reyes-Soria, F. A., Guillén-Chable, F., Castaño, E., Sánchez‐Teyer, L. F., Herrera-Alamillo, M. Á., Pereira‐Santana, A., & Rodríguez‐Zapata, L. C. (2025) · Current Issues in Molecular Biology · doi:10.3390/cimb47090769 · Cited by 1
Molecular attributes of intrinsically disordered regions in secretomes influence fungal pathogenesisPreprint
Mohapatra, A., Kadumuri, R. V., Sharma, A., Saju, A. P., Ramadasan, H., Agrawal, A., Sharma, V., & Chavali, S. (2025) · bioRxiv (Cold Spring Harbor Laboratory) · doi:10.1101/2025.10.01.679754
Meng, D., Alvarez, H. M. G., Glavina, J., Leonetti, C. O., Pollastri, G., & Chemes, L. B. (2025) · bioRxiv (Cold Spring Harbor Laboratory) · doi:10.1101/2025.10.29.685455 · Cited by 1
DARUMA: a gateway to fast and easy prediction of intrinsically disordered regions
Shimizu, I., Ida, T., Ozawa, Y., Fukuchi, S., & Anbo, H. (2025) · PeerJ Computer Science · doi:10.7717/peerj-cs.3343
Khan, M. I., Bhide, A. J., & Banerjee, A. K. (2025) · Plant Stress · doi:10.1016/j.stress.2025.101163
Navigating the labyrinth of drugging the disordered
Tolani, S., Mitra, D., Dantu, S. C., & Kumar, A. (2025) · Biophysical Reviews · doi:10.1007/s12551-025-01391-x · Cited by 2
Defects in DNA damage signaling and cell cycle checkpoints in a mouse model of Rhno1 deletion
Her, J., Santhosh, A., Gonzalez-Rodriguez, Y., Jirapongwattana, N., Gurumurthy, C. B., Karpf, A. R., & Bunting, S. F. (2025) · Cell Death Discovery · doi:10.1038/s41420-025-02912-z
Zheng, L., Shi, S., Lu, M., Fang, P., Pan, Z., Zhang, H., Zhou, Z., Zhang, H., Mou, M., Huang, S., et al. (2024) · Figshare · doi:10.6084/m9.figshare.25132187
Zheng, L., Shi, S., Lu, M., Fang, P., Pan, Z., Zhang, H., Zhou, Z., Zhang, H., Mou, M., Huang, S., et al. (2024) · Figshare · doi:10.6084/m9.figshare.25132066
Tang, Y.-J., Yan, K., Zhang, X., Tian, Y., & Liu, B. (2023) · Figshare · doi:10.6084/m9.figshare.24098206
Additional file 1 of Intrinsic disorder in PRAME and its role in uveal melanoma
Antonietti, M., Taylor, D. J., Djulbegovic, M., Dayhoff, G. W., Uversky, V. N., Shields, C. L., & Karp, C. L. (2024) · Figshare · doi:10.6084/m9.figshare.26612879
The folding of tandem repeat proteins
Andrade-Navarro, M. A., Kajava, A. V., & Schumbera, E. (2025) · Elsevier eBooks · doi:10.1016/b978-0-323-99507-8.00021-4
Unraveling circadian rhythms—computational insights into molecular mechanisms
Rao, Y., & Srivastava, A. (2026) · FEBS Letters · doi:10.1002/1873-3468.70264
Measuring and locating the changes in protein structure using MELO
Zheng, L., Liao, Y., Zhang, Y., Liu, M., Lu, M., Fu, T., Shi, S., Sun, X., Gu, C., Sun, H., et al. (2026) · Nature Communications · doi:10.1038/s41467-025-68110-8
Regulation of Substrate Transport in the Early Stages of Fatty Acid Synthesis
Leidner, F., & Grubmüller, H. (2026) · Springer eBooks · doi:10.1007/978-3-031-91312-9_34
Zhang, F., Xia, C., Dong, M., Zeng, M., Zhang, J., & Li, M. (2025) · IEEE International Conference on Bioinformatics and Biomedicine (BIBM) · doi:10.1109/bibm66473.2025.11356110
Structural insights into Phospholipase Cε activity and regulation
Mahurkar, K. A., Barrios, S. L., McCauley, F. D., & Lyon, A. M. (2026) · Journal of Biological Chemistry · doi:10.1016/j.jbc.2026.111289
Reliable Evaluation and Learning in Multi-input Biological Association PredictionPreprint
Moghadam, S. A., & Montazeri, H. (2026) · bioRxiv (Cold Spring Harbor Laboratory) · doi:10.64898/2026.02.17.706287
Galzitskaya, O. V., Glyakina, A. V., Lobanov, M. Y., & Dovidchenko, N. V. (2026) · Biosystems · doi:10.1016/j.biosystems.2026.105756
Hofmann, O. F., & Ospina-Giraldo, M. D. (2026) · Journal of the Pennsylvania Academy of Science · doi:10.5325/jpennacadscie.97.1-2.0176
Chatterjee, A., & Vijay, N. (2026) · Scientific Reports · doi:10.1038/s41598-026-48432-3
Transposable elements as evolutionary substrates of protein disorder in the human proteomePreprint
Donagh, J. M., Vergesio, N., Aguilar, A., Nores, R., Lagares, A., Fornasari, M. S., & Parisi, G. D. (2026) · bioRxiv (Cold Spring Harbor Laboratory) · doi:10.64898/2026.06.12.731867
SPPIDER-seq: sequence-based partner-aware predictor of protein-protein interaction sites
Porollo, A., Jadhav, O., Alvarez, A., & Chen, J.-C. (2026) · Bioinform. · doi:10.1093/bioinformatics/btag388
Malhis, N., Mehdiabadi, M., Erdős, G., Gsponer, J. A., Kurgan, L., Tosatto, S. C. E., Dosztányi, Z., & Piovesan, D. (2026) · bioRxiv (Cold Spring Harbor Laboratory) · doi:10.64898/2026.06.24.733783
Deep mutational scanning of SARS ‐ CoV ‐2 nucleocapsid reveals regional stability patterns
Keith, A. D., Keen, M. M., Frank, F., & Ortlund, E. A. (2026) · Protein Science · doi:10.1002/pro.70706
Reliable evaluation and learning in multi-input biological association prediction
Moghadam, S. A., Paoli, L., & Montazeri, H. (2026) · Briefings in Bioinformatics · doi:10.1093/bib/bbag376
Betrán, A. L., Agnarelli, A., Samuels, M. E., Vella, V., Nia, R. S., Vega, D. D., Poudine, N., Carter-Lopez, D. S., Ditsiou, A., Eravci, M., et al. (2026) · Cells · doi:10.3390/cells15161473
Tzavella, K., Olsen, C., & Vranken, W. (2026) · Computational and Structural Biotechnology Journal · doi:10.34133/csbj.0226
Prediction of Intrinsically Disordered Regions That Bind RNA with DisoRDPbind
Peng, Z., & Kurgan, L. (2026) · Methods in molecular biology · doi:10.1007/978-1-0716-5372-2_14
Tamerler, C., & Snead, M. L. (2026) · Biomimetics · doi:10.3390/biomimetics11090680
The Disordome Paradigm: How Intrinsic Disorder Encodes Emergent Biological Function
Fantini, J., Lefebvre, M., Aulas, A., Chahinian, H., & Yahi, N. (2026) · Molecules · doi:10.3390/molecules31203662
Challenges and opportunities of AI-based approaches for intrinsically disordered proteins
Ozbas, C. E., Akkum, F. I., Damar, M., Uversky, V. N., & Coskuner‐Weber, O. (2026) · Elsevier eBooks · doi:10.1016/b978-0-443-44536-1.00004-3
FAIRsharing record for: Protein Ensemble Database
FAIRsharing Team, & Mičetić, I. (2022) · FAIRsharing.org · doi:10.25504/fairsharing.489e03
Metadata
- Authors
- Necci, M., Piovesan, D., Predictors, C., Hoque, M. T., Walsh, I., Iqbal, S., Vendruscolo, M., Sormanni, P., Wang, C., Raimondi, D., Sharma, R., Zhou, Y., Litfin, T., Galzitskaya, O. V., Lobanov, M. Y., Vranken, W., Wallner, B., Mirabello, C., Malhis, N., Dosztányi, Z., Erdős, G., Mészáros, B., Gao, J., Wang, K., Hu, G., Wu, Z., Sharma, A., Hanson, J., Paliwal, K., Callebaut, I., Bitard-Feildel, T., Orlando, G., Peng, Z., Xu, J., Wang, S., Jones, D. T., Cozzetto, D., Meng, F., Yan, J., Gsponer, J., Cheng, J., Wu, T., Kurgan, L., Curators, D., Promponas, V. J., Tamana, S., Marino-Buslje, C., Martínez-Pérez, E., Chasapi, A., Ouzounis, C., Dunker, A. K., Kajava, A. V., Leclercq, J. Y., Aykac-Fas, B., Lambrughi, M., Maiani, E., Papaleo, E., Chemes, L. B., Álvarez, L., González-Foutel, N. S., Iglesias, V., Pujols, J., Ventura, S., Palopoli, N., Benítez, G. I., Parisi, G., Bassot, C., Elofsson, A., Govindarajan, S., Lamb, J., Salvatore, M., Hatos, A., Monzon, A. M., Bevilacqua, M., Mičetić, I., Minervini, G., Paladin, L., Quaglia, F., Leonardi, E., Davey, N., Horvath, T., Kovacs, O. P., Murvai, N., Pancsa, R., Schad, E., Szabo, B., Tantos, A., Macedo-Ribeiro, S., Manso, J. A., Pereira, P. J. B., Davidović, R., Veljkovic, N., Hajdu-Soltész, B., Pajkos, M., Szaniszló, T., Guharoy, M., Lazar, T., Macossay-Castillo, M., Tompa, P., & Tosatto, S. C. E.
- Affiliations
- University of Padua (IT)
- LSU New Orleans (US)
- Agency for Science, Technology and Research (SG)
- Broad Institute (US)
- University of Cambridge (GB)
- Columbia University (US)
- Fiji National University (FJ)
- Griffith University (AU)
- Russian Academy of Sciences (RU)
- Linköping University (SE)
- Eötvös Loránd University (HU)
- Nankai University (CN)
- Sorbonne Université (FR)
- Tianjin University (CN)
- Toyota Technological Institute at Chicago (US)
- University College London (GB)
- University of Alberta (CA)
- University of British Columbia (CA)
- University of Missouri (US)
- Virginia Commonwealth University (US)
- University of Cyprus (CY)
- Fundación Instituto Leloir (AR)
- Centre for Research and Technology Hellas (GR)
- Université de Montpellier (FR)
- Danish Cancer Society (DK)
- Consejo Nacional de Investigaciones Científicas y Técnicas (AR)
- Universitat Autònoma de Barcelona (ES)
- National University of Quilmes (AR)
- Stockholm University (SE)
- University of Copenhagen (DK)
- Institute of Cancer Research (GB)
- Institute of Molecular Life Sciences (HU)
- Universidade do Porto (PT)
- Vrije Universiteit Brussel (BE)
- Corresponding author
- Tosatto, Silvio C. E.
- ORCID
- Necci, Marco
- Piovesan, Damiano
- Hoque, Md Tamjidul
- Walsh, Ian
- Iqbal, Sumaiya
- Vendruscolo, Michele
- Sormanni, Pietro
- Wang, Chen
- Raimondi, Daniele
- Sharma, Ronesh
- Zhou, Yaoqi
- Litfin, Thomas
- Galzitskaya, Oxana Valerianovna
- Vranken, Wim
- Wallner, Björn
- Mirabello, Claudio
- Malhis, Nawar
- Dosztányi, Zsuzsanna
- Mészáros, Bálint
- Gao, Jianzhao
- Wang, Kui
- Hu, Gang
- Wu, Zhonghua
- Sharma, Alok
- Hanson, Jack
- Paliwal, Kuldip
- Callebaut, Isabelle
- Orlando, Gabriele
- Peng, Zhenling
- Xu, Jinbo
- Wang, Sheng
- Jones, David T.
- Cozzetto, Domenico
- Yan, Jing
- Gsponer, Jörg
- Cheng, Jianlin
- Wu, Tianqi
- Kurgan, Lukasz
- Promponas, Vasilis J.
- Tamana, Stella
- Chasapi, Anastasia
- Ouzounis, Christos
- Dunker, A. Keith
- Kajava, Andrey V.
- Leclercq, Jeremy Y.
- Lambrughi, Matteo
- Maiani, Emiliano
- Papaleo, Elena
- Chemes, Lucia Beatriz
- Pujols, Jordi
- Ventura, Salvador
- Parisi, Gustavo
- Bassot, Claudio
- Elofsson, Arne
- Lamb, John
- Salvatore, Marco
- Hatos, András
- Bevilacqua, Martina
- Mičetić, Ivan
- Minervini, Giovanni
- Paladin, Lisanna
- Quaglia, Federica
- Leonardi, Emanuela
- Davey, Norman
- Murvai, Nikoletta
- Pancsa, Rita
- Pereira, Pedro José Barbosa
- Davidović, Radoslav
- Pajkos, Mátyás
- Szaniszló, Tamás
- Guharoy, Mainak
- Tosatto, Silvio C. E.
- Venue
- Nature Methods
- Published
- 2021-04-19
- Volume
- 18
- Issue
- 5
- Pages
- 472-481
- ISSN
- 1548-7091 (ISSN-L)
- 1548-7105
- PMC
- PMC8105172
- OpenAlex
- W3156051371
- Cited by
- 343
- References
- 58
- Citations by year
- 2026: 35 · 2025: 64 · 2024: 68 · 2023: 72 · 2022: 69 · 2021: 32
- FWCI
- 18.99
- Type
- journal article
- Language
- en
- Open access
- hybrid
- doi.org
- Locations
- Nature Methods (publishedVersion, cc-by)
- bioRxiv (Cold Spring Harbor Laboratory) (acceptedVersion, cc-by-nc-nd)
- PubMed Central (publishedVersion, cc-by)
- PubMed (publishedVersion)
- HAL (submittedVersion, other-oa)
- Dipòsit Digital de Documents de la UAB (Universitat Autònoma de Barcelona) (submittedVersion, cc-by)
- Griffith Research Online (submittedVersion, cc-by)
- CONICET Digital (CONICET) (submittedVersion, cc-by)
- Apollo (University of Cambridge) (submittedVersion, cc-by)
- ELTE Digital Institutional Repository (EDIT) (Eötvös Loránd University) (submittedVersion, other-oa)
- UCL Discovery (University College London) (submittedVersion)
- IUScholarWorks (Indiana University) (submittedVersion, cc-by)
- VinaR (Institute of Nuclear Sciences "Vinča") (submittedVersion, cc-by)
- VUBIR (Vrije Universiteit Brussel) (submittedVersion)
- Padua Research Archive (University of Padova) (submittedVersion, cc-by)
- Apollo
- Apollo (cc-by)
- Funders
- EC | Horizon 2020 Framework Programme (778247)
- Ministero dell’Istruzione, dell’Università e della Ricerca (2017483NH8)
- Topics
- Life Sciences › Biochemistry, Genetics and Molecular Biology › Molecular Biology › Protein Structure and Dynamics
- Life Sciences › Biochemistry, Genetics and Molecular Biology › Molecular Biology › Machine Learning in Bioinformatics
- Life Sciences › Pharmacology, Toxicology and Pharmaceutics › Drug Discovery › Computational Drug Discovery Methods
- Keywords
- intrinsically disordered proteins, CAID, blind test, deep learning, physicochemical methods, DisProt, prediction accuracy, benchmarking
- MeSH terms
- Amino Acid Sequence, Protein Binding, Protein Conformation, Software, Protein Folding, Computational Biology, Databases, Protein, Intrinsically Disordered Proteins
About these checks
Registry, retraction, Cites and statistics results are computed, not judged, with one exception: a printed reference that no index lists is read once by a model before it counts as a citation error. Claims are extracted by a model and kept only when their quote appears verbatim in the text; each cited source is then checked, with a model’s help, for whether it says what the claim relies on. Those verdicts can be wrong — read the claim’s quote and the cited source before relying on one.
Statistics and arithmetic are recomputed, not judged.
Confidence bands are shown only for fields calibrated on our annotated test set. None is calibrated yet, so no band is shown.
What counts as a claim ›How we measure confidence ›How we check this ›
Are you an author, or do you see a problem with this page? Request a review
