

The DOI matches its Crossref record; 60 of the 60 references it cites were found in a registry or an index; 19 of the 43 sources its claims cite were checked for support.
Expression of miR-33 from an SREBP2 Intron Inhibits Cholesterol Export and Fatty Acid Oxidation*
Open accessAbstract
The regulation of synthesis, degradation, and distribution of lipids is crucial for homeostasis of organisms and cells. The sterol regulatory element-binding protein (SREBP) transcription factor family is post-translationally activated in situations of reduced lipid abundance and activates numerous genes involved in cholesterol, fatty acid, and phospholipid synthesis. In this study, we provide evidence that the primary transcript of SREBP2 contains an intronic miRNA (miR-33) that reduces cellular cholesterol export via inhibition of translation of the cholesterol export pump ABCA1. Notably, miR-33 also inhibits translation of several transcripts encoding proteins involved in fatty acid β-oxidation including CPT1A, HADHB, and CROT, thereby reducing fatty acid degradation. The genetic locus encoding SREBP2 and miR-33 therefore contains a protein that increases lipid synthesis and a miRNA that prevents export and degradation of newly synthesized lipids. These results add an additional layer of complexity to our understanding of lipid homeostasis and might open possibilities for future therapeutic intervention.
Overview
AI snapshot
Written from the paper’s full text.
TL;DR
miR-33a is encoded in an intron of SREBP2 and directly represses ABCA1, CPT1A, HADHB, and CROT, thereby reducing cholesterol export and fatty acid β-oxidation while increasing cellular lipids. This bifunctional locus couples lipid synthesis with suppression of lipid export and degradation.
Key findings
- miR-33a localizes to an intron of SREBP2 and is evolutionarily conserved; reporter assays show it targets the ABCA1 3′ UTR, and seed-region mutations abolish this response.
- Overexpression of miR-33 reduces endogenous ABCA1 protein and apoAI-dependent cholesterol export in HepG2 and THP1 cells; miR-33 sponges and antagomirs increase ABCA1 protein and cholesterol export.
- miR-33 targets CPT1A, HADHB, and CROT 3′ UTRs; overexpression suppresses HADHB and CPT1A protein, reduces CROT mRNA, causes a 20% reduction in mitochondrial β-oxidation, and increases cellular free fatty acids and triacylglycerides.
- The Drosophila CPT1 3′ UTR contains a conserved functional miR-33 binding site, suggesting ancient regulation of β-oxidation.
Methods
- Reporter assays used luciferase constructs containing wild-type or mutated 3′ UTRs cotransfected with pre-miR-33 or control; lentiviral miR-33 overexpression, miRNA sponges, and antagomirs were tested in HepG2, THP1, Y1, and 293T cells, with Western blot, qPCR, and Northern blot readouts.
- Cholesterol export was measured using [1,2-3H]cholesterol and apoAI; β-oxidation was measured by conversion of [9,10-3H]palmitic acid to water in the presence or absence of etomoxir; lipids were analyzed by TLC.
- Male C57/BL6 mice were fed chow or a high-fat diet (60% calories from fat) for 16 weeks starting at 4 or 8 weeks of age; miR-33 levels were assessed by Northern blot. Analyses used normalized luciferase activity, Student’s t tests, and means ± S.D. or S.E.
Limitations
- Stated: no specific CROT Western blot was obtained; miR-33 inhibition did not reproducibly increase β-oxidation or HADHB/CPT1A protein in HepG2 cells; fasting and high-fat-diet mouse livers showed no significant miR-33 changes, with only a small non-significant trend toward lower levels on high-fat diet; preliminary TLC/gas chromatography did not support altered fatty acid chain lengths; future in vivo experiments are needed.
- Evident: many mechanistic conclusions rely on cell lines, overexpression, and reporter assays, so in vivo regulation and therapeutic relevance remain unestablished; several results are described as data not shown.
Model-written summary. Check it against the paper before relying on it.
Integrity signals
Registry
Cites
Statistics
Figures
Verification
Claims the paper makes
44 Own result · 25 Own interpretation · 15 No full text of the sources · 8 Partly supported · 6 Supported · 5 No basis given · 1 Sources not found · 1 Not checked yet · accuracy not yet measured
The cited sources support only part of this claim — read each source’s verdict below.
In the paper
“Interestingly, the dominant allosteric inhibitor malonyl-CoA regulates CROT similarly to CPT1A (28,52).”
§ Expression of miR-33 from an SREBP2 Intron Inhibits Cholesterol Export and Fatty Acid Oxidation * □ S > miR-33 in Cholesterol and Fatty Acid Metabolism
What the sources say
- Not checked — no full text of the sourcecites [28] Saggerson, 2008, Annu. Rev. Nutr. source
- Partly supportedcites [52] A'Bháird, 1992, Biochem. J. sourceExperimental — accuracy not yet measured
In the 'Kinetics of COT assayed in peroxisomes' section, the paper says malonyl-CoA inhibits peroxisomal COT more selectively than other short-chain acyl-CoA esters and that features of this inhibition resemble CPT-I. It does not establish that the inhibition is allosteric: a separate regulatory binding site is proposed as a possibility, while inhibition of purified COT is described as competitive. Page numbers were not supplied with these passages. (LLM, conf=0.86)
plaindirect- Asserted: passes — The authors put it forward as true.
- Checkable: passes — It can be checked against evidence.
- Load-bearing: unclear — It is unclear whether the paper’s conclusions depend on it.
- Based: passes — The paper gives a reason why it holds.
Every source the paper cites for this claim was checked and supports it.
In the paper
“Surprisingly, there is evidence that reduced gene dosage or activity of this enzyme complex leads to the accumulation of lipids in the liver (hepatic steatosis) (32,33).”
§ Expression of miR-33 from an SREBP2 Intron Inhibits Cholesterol Export and Fatty Acid Oxidation * □ S > miR-33 in Cholesterol and Fatty Acid Metabolism
What the sources say
- Supportedcites [32] Ibdah, 2005, Gastroenterology source
The Discussion reports that heterozygosity for an MTP defect causes fatty liver disease in aging mice and links impaired fatty-acid oxidation to hepatic steatosis. The Results specify that steatosis developed in aging, but not young, heterozygous mice; the citing sentence's 'there is evidence' framing is consistent with that finding. (LLM, conf=0.92)
- Supportedcites [33] Kao, 2006, Hum. Mol. Genet. source
The Western blot and enzyme activity assay section reports reduced mitochondrial trifunctional protein subunits and enzyme activities in affected mice, with similar findings in liver tissue. The Histopathological analyses section reports increased lipid droplets in their hepatocytes, consistent with hepatic steatosis. The paper supports the reduced-activity part of the claim. (LLM, conf=0.92)
plaindirect- Asserted: passes — The authors put it forward as true.
- Checkable: passes — It can be checked against evidence.
- Load-bearing: unclear — It is unclear whether the paper’s conclusions depend on it.
- Based: passes — The paper gives a reason why it holds.
- Supported
A result the paper reports from its own data — it cites no other source for it, so there is none to check. The quote shows it is in the paper.
In the paper
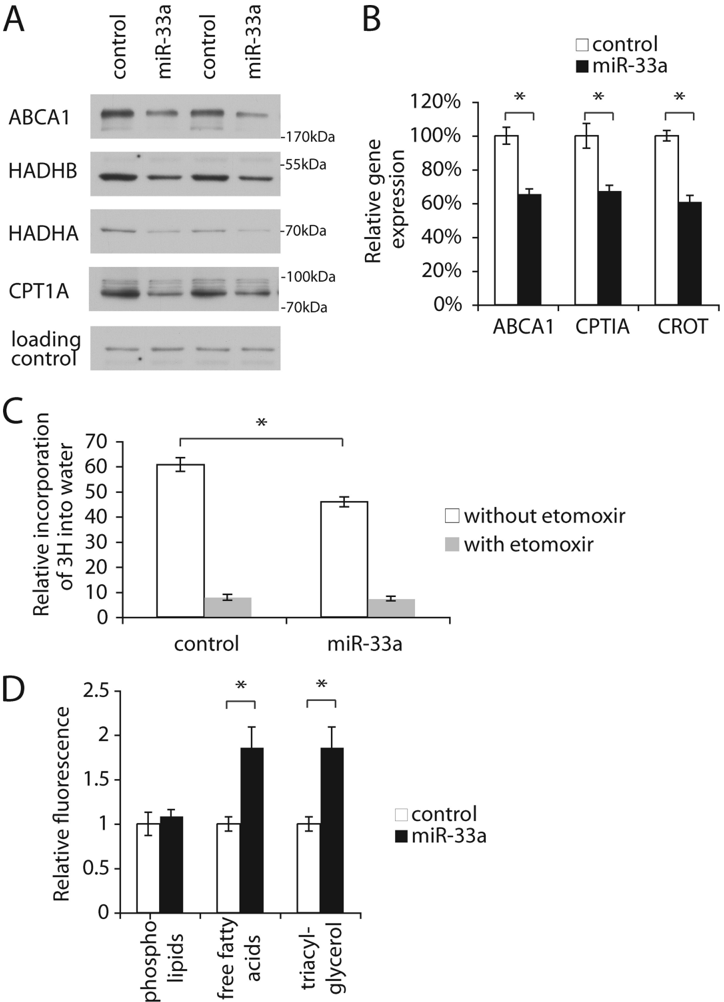
“As shown in Fig. 6A, miR-33 suppresses HADHB and CPT1A protein levels.”
§ Expression of miR-33 from an SREBP2 Intron Inhibits Cholesterol Export and Fatty Acid Oxidation * □ S > miR-33 Inhibits Cellular Fatty Acid
plaindirect- Asserted: passes — The authors put it forward as true.
- Checkable: passes — It can be checked against evidence.
- Load-bearing: passes — The paper’s conclusions depend on it.
- Based: passes — The paper gives a reason why it holds.
- Rests on an assumption: The 500-bp genomic region surrounding miR-33a used in lentiviral vectors specifically expresses miR-33a without affecting other genes or small RNAs.
- Rests on an assumption: The antibodies used for Western blot analysis specifically detect their intended targets (ABCA1, HADHB, CPT1A, HADHA, GAPDH, and β-actin).
A result the paper reports from its own data — it cites no other source for it, so there is none to check. The quote shows it is in the paper.
In the paper
“As shown in Fig. 6C, overexpression of miR-33 is associated with a 20% reduction of mitochondrial -oxidation.”
§ Expression of miR-33 from an SREBP2 Intron Inhibits Cholesterol Export and Fatty Acid Oxidation * □ S > miR-33 Inhibits Cellular Fatty Acid
plaindirect- Asserted: passes — The authors put it forward as true.
- Checkable: passes — It can be checked against evidence.
- Load-bearing: passes — The paper’s conclusions depend on it.
- Based: passes — The paper gives a reason why it holds.
- Rests on an assumption: The 500-bp genomic region surrounding miR-33a used in lentiviral vectors specifically expresses miR-33a without affecting other genes or small RNAs.
A result the paper reports from its own data — it cites no other source for it, so there is none to check. The quote shows it is in the paper.
In the paper
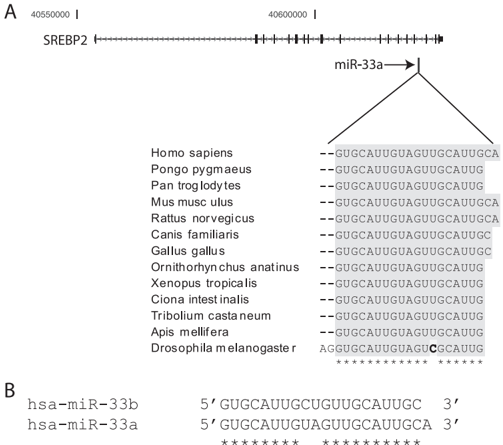
“miR-33a and miR-33b are localized in corresponding introns of the human SREBP2 and SREBP1 genes, respectively (Fig. 1A and supplemental Fig. S3).”
§ Expression of miR-33 from an SREBP2 Intron Inhibits Cholesterol Export and Fatty Acid Oxidation * □ S > miR-33a Is Produced from an Intron of the SREBP2 Gene and
plain- Asserted: passes — The authors put it forward as true.
- Checkable: passes — It can be checked against evidence.
- Load-bearing: passes — The paper’s conclusions depend on it.
- Based: passes — The paper gives a reason why it holds.
A result the paper reports from its own data — it cites no other source for it, so there is none to check. The quote shows it is in the paper.
In the paper
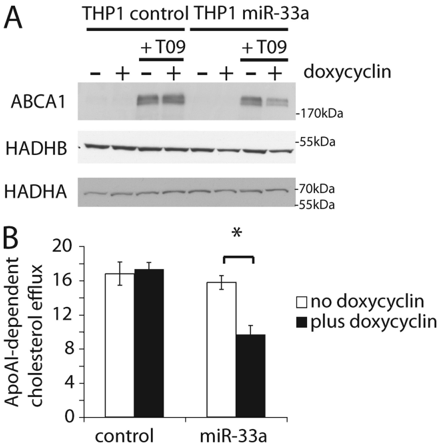
“the cell line transduced with the conditional miR-33a lentivirus shows strong reduction of ABCA1 levels upon treatment with doxycyclin (Fig. 4A, fifth to eighth lanes).”
§ Expression of miR-33 from an SREBP2 Intron Inhibits Cholesterol Export and Fatty Acid Oxidation * □ S > miR-33 in Cholesterol and Fatty Acid Metabolism
boosteddirect- Asserted: passes — The authors put it forward as true.
- Checkable: passes — It can be checked against evidence.
- Load-bearing: passes — The paper’s conclusions depend on it.
- Based: passes — The paper gives a reason why it holds.
- Rests on an assumption: The 500-bp genomic region surrounding miR-33a used in lentiviral vectors specifically expresses miR-33a without affecting other genes or small RNAs.
A result the paper reports from its own data — it cites no other source for it, so there is none to check. The quote shows it is in the paper.
In the paper
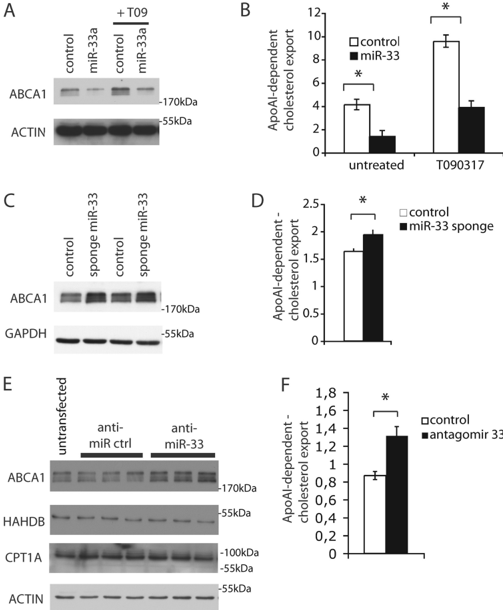
“we loaded cells with radioactively labeled cholesterol, and observed significantly reduced apoAI-dependent cholesterol export in the HepG2 liver cancer cell line (Fig. 3B) and THP1 monocytic leukemia cell line derived from macrophages (Fig. 4B).”
§ Expression of miR-33 from an SREBP2 Intron Inhibits Cholesterol Export and Fatty Acid Oxidation * □ S > miR-33 in Cholesterol and Fatty Acid Metabolism
plaindirect- Asserted: passes — The authors put it forward as true.
- Checkable: passes — It can be checked against evidence.
- Load-bearing: passes — The paper’s conclusions depend on it.
- Based: passes — The paper gives a reason why it holds.
A result the paper reports from its own data — it cites no other source for it, so there is none to check. The quote shows it is in the paper.
In the paper
“As shown in Fig. 6B, CROT mRNA levels were significantly reduced in cell lines overexpressing miR-33 to a degree that is similar to the reduction of ABCA1 and CPT1A”
§ Expression of miR-33 from an SREBP2 Intron Inhibits Cholesterol Export and Fatty Acid Oxidation * □ S > miR-33 Inhibits Cellular Fatty Acid
plaindirect- Asserted: passes — The authors put it forward as true.
- Checkable: passes — It can be checked against evidence.
- Load-bearing: passes — The paper’s conclusions depend on it.
- Based: passes — The paper gives a reason why it holds.
- Rests on an assumption: The 500-bp genomic region surrounding miR-33a used in lentiviral vectors specifically expresses miR-33a without affecting other genes or small RNAs.
A result the paper reports from its own data — it cites no other source for it, so there is none to check. The quote shows it is in the paper.
In the paper
“We observed that miR-33a causes a marked decrease of ABCA1 protein levels (Fig. 3A, lanes 1 and 2) as assessed by immunoblot analysis.”
§ Expression of miR-33 from an SREBP2 Intron Inhibits Cholesterol Export and Fatty Acid Oxidation * □ S > miR-33 in Cholesterol and Fatty Acid Metabolism
plaindirect- Asserted: passes — The authors put it forward as true.
- Checkable: passes — It can be checked against evidence.
- Load-bearing: passes — The paper’s conclusions depend on it.
- Based: passes — The paper gives a reason why it holds.
- Rests on an assumption: The 500-bp genomic region surrounding miR-33a used in lentiviral vectors specifically expresses miR-33a without affecting other genes or small RNAs.
- Rests on an assumption: The antibodies used for Western blot analysis specifically detect their intended targets (ABCA1, HADHB, CPT1A, HADHA, GAPDH, and β-actin).
A result the paper reports from its own data — it cites no other source for it, so there is none to check. The quote shows it is in the paper.
In the paper
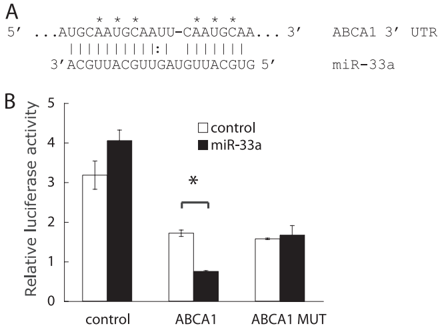
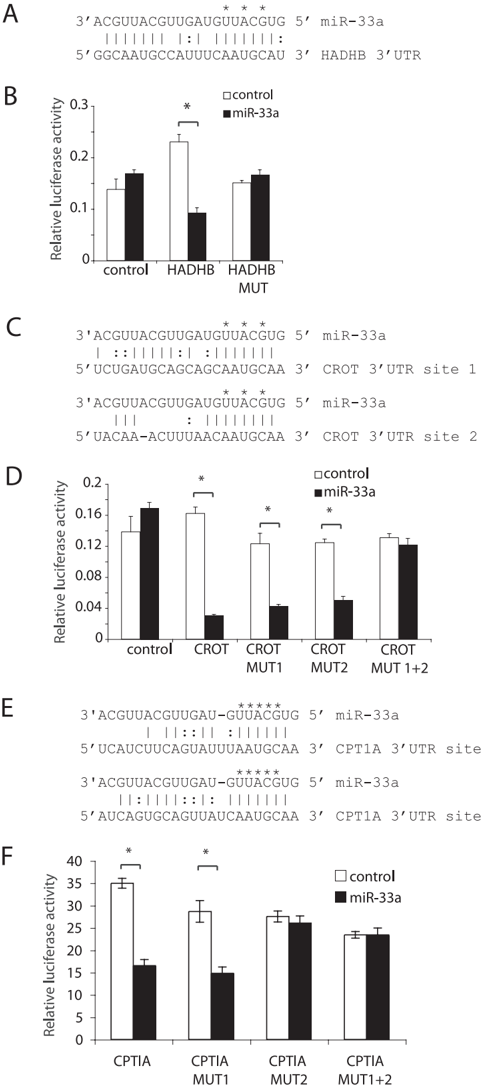
“Cotransfection of preMIR-33a significantly reduced the activity of the reporter construct containing the 3Ј UTR of ABCA1 (Fig. 2B).”
§ Expression of miR-33 from an SREBP2 Intron Inhibits Cholesterol Export and Fatty Acid Oxidation * □ S > miR-33 in Cholesterol and Fatty Acid Metabolism
plaindirect- Asserted: passes — The authors put it forward as true.
- Checkable: passes — It can be checked against evidence.
- Load-bearing: passes — The paper’s conclusions depend on it.
- Based: passes — The paper gives a reason why it holds.
- Probably not a substantial claim. 32
- It may state two separate claims as one. 30
- The quote only partly states this claim. 1
Every source the paper cites for this claim was checked and supports it.
In the paper
“However, SREBPs not only activate cholesterol synthesis but also fatty acid and phospholipid synthesis (2).”
§ Expression of miR-33 from an SREBP2 Intron Inhibits Cholesterol Export and Fatty Acid Oxidation * □ S > miR-33 in Cholesterol and Fatty Acid Metabolism
What the sources say
- Supportedcites [2] Horton, 2002, J. Clin. Invest. source
The Abstract states that SREBPs activate genes involved in the synthesis of cholesterol, fatty acids, and phospholipids. The “SREBPs: two genes, three proteins” section also identifies an SREBP-1c target gene encoding an enzyme involved in phospholipid synthesis. Page numbers are not supplied for these passages. (LLM, conf=0.94)
plaindirect- Asserted: passes — The authors put it forward as true.
- Checkable: passes — It can be checked against evidence.
- Load-bearing: fails — The paper’s conclusions may not depend on it.
- Based: passes — The paper gives a reason why it holds.
Probably not a substantial claim. The paper’s conclusions may not depend on it. It may state two separate claims as one.
- Supported
Every source the paper cites for this claim was checked and supports it.
In the paper
“High levels of low density lipoprotein cholesterol are a major risk factor for the development of arteriosclerosis and death from cardiovascular causes (41).”
§ Expression of miR-33 from an SREBP2 Intron Inhibits Cholesterol Export and Fatty Acid Oxidation * □ S > JOURNAL OF BIOLOGICAL CHEMISTRY 33657
What the sources say
- Supportedcites [41] Nabel, 2003, N. Engl. J. Med. source
The section on elevated LDL cholesterol and coronary artery disease states that LDL is a causal agent in many forms of coronary heart disease. It also reports that people with markedly elevated LDL due to homozygous familial hypercholesterolemia develop severe coronary atherosclerosis and usually die from myocardial infarction. (LLM, conf=0.89)
plaincorrelational- Asserted: passes — The authors put it forward as true.
- Checkable: passes — It can be checked against evidence.
- Load-bearing: fails — The paper’s conclusions may not depend on it.
- Based: passes — The paper gives a reason why it holds.
Probably not a substantial claim. The paper’s conclusions may not depend on it.
- Supported
Every source the paper cites for this claim was checked and supports it.
In the paper
“Genes involved in its synthesis are coordinately up-regulated by the action of SREBP transcription factors (2).”
§ Expression of miR-33 from an SREBP2 Intron Inhibits Cholesterol Export and Fatty Acid Oxidation * □ S > DISCUSSION
What the sources say
- Supportedcites [2] Horton, 2002, J. Clin. Invest. source
The “Function of individual SREBP isoforms in vivo” section reports that overexpressing SREBP-2 increases mRNAs encoding all cholesterol biosynthetic enzymes. The “SREBPs: two genes, three proteins” section also identifies SREBP-2 as preferentially activating cholesterol synthesis. (LLM, conf=0.93)
plaindirect- Asserted: passes — The authors put it forward as true.
- Checkable: passes — It can be checked against evidence.
- Load-bearing: passes — The paper’s conclusions depend on it.
- Based: passes — The paper gives a reason why it holds.
Probably not a substantial claim.
- Supported
The cited sources support only part of this claim — read each source’s verdict below.
In the paper
“It has been previously shown that the homologs of SREBPs do not respond to changes in cholesterol, but rather changes in palmitate and/or phospholipids (39,40).”
§ Expression of miR-33 from an SREBP2 Intron Inhibits Cholesterol Export and Fatty Acid Oxidation * □ S > miR-33 Inhibits Cellular Fatty Acid
What the sources say
- Not checked — no full text of the sourcecites [39] Dobrosotskaya, 2002, Science source
- Partly supportedcites [40] Seegmiller, 2002, Dev. Cell sourceExperimental — accuracy not yet measured
The Results report that palmitate reduced nuclear dSREBP in Drosophila S2 cells, whereas a cholesterol-containing sterol mixture failed to do so. The Discussion proposes that palmitic acid or a lipid derived from it regulates this pathway, but does not establish phospholipids as the signal. The claim also generalizes beyond the Drosophila homolog studied here. (LLM, conf=0.86)
plain- Asserted: passes — The authors put it forward as true.
- Checkable: passes — It can be checked against evidence.
- Load-bearing: fails — The paper’s conclusions may not depend on it.
- Based: passes — The paper gives a reason why it holds.
Probably not a substantial claim. The paper’s conclusions may not depend on it.
The cited sources support only part of this claim — read each source’s verdict below.
In the paper
“It has been previously noted that cellular miR-33 levels are dependent on culture conditions and exogenous lipid supply (36).”
§ Expression of miR-33 from an SREBP2 Intron Inhibits Cholesterol Export and Fatty Acid Oxidation * □ S > miR-33 Inhibits Cellular Fatty Acid
What the sources say
- Partly supportedcites [36] Tsuchiya, 2009, Nucleic Acids Res. sourceExperimental — accuracy not yet measured
The Results (Screening of miRNAs related with differentiation; page unavailable) report that miR-33a increased in T84 cells between culture days 0 and 7, supporting a limited link between its level and culture conditions. The paper does not report that exogenous lipid supply affects miR-33 levels; its cell-culture methods describe serum-containing medium, not a lipid-supply comparison. (LLM, conf=0.87)
plaincorrelational- Asserted: passes — The authors put it forward as true.
- Checkable: passes — It can be checked against evidence.
- Load-bearing: fails — The paper’s conclusions may not depend on it.
- Based: passes — The paper gives a reason why it holds.
Probably not a substantial claim. The paper’s conclusions may not depend on it.
- Partly supported
The cited sources support only part of this claim — read each source’s verdict below.
In the paper
“This process seems to be essential for the formation of HDL particles because liver-and intestine-specific knockout mice for ABCA1 show strong reductions in HDL levels (45)(46)(47).”
§ Expression of miR-33 from an SREBP2 Intron Inhibits Cholesterol Export and Fatty Acid Oxidation * □ S > JOURNAL OF BIOLOGICAL CHEMISTRY 33657
What the sources say
- Not checked — no full text of the sourcecites [45] Brunham, 2009, Arterioscler. Thromb. Vasc. Biol. source
- Partly supportedcites [46] Singaraja, 2006, Arterioscler. Thromb. Vasc. Biol. sourceExperimental — accuracy not yet measured
The Abstract reports an 80% reduction in plasma HDL cholesterol in liver-specific ABCA1 knockout mice, supporting the liver-specific part of the claim. The paper does not report an intestine-specific knockout or its HDL levels. Its Discussion also says low HDL reflects increased catabolism as well as decreased synthesis, so the reduction alone does not establish a defect solely in particle formation. Page numbers are unavailable in our copy. (LLM, conf=0.88)
- Supportedcites [47] Brunham, 2006, J. Clin. Invest. source
The Introduction says ABCA1 promotes cholesterol and phospholipid efflux to apoA-I in the rate-controlling step of HDL particle formation. The Discussion describes hepatic ABCA1 as essential to HDL biogenesis and reports that intestinal ABCA1 deletion significantly reduces plasma HDL; the Results quantify the intestinal-knockout reduction at approximately 30%. (LLM, conf=0.92)
hedgeddirect- Asserted: passes — The authors put it forward as true.
- Checkable: passes — It can be checked against evidence.
- Load-bearing: fails — The paper’s conclusions may not depend on it.
- Based: passes — The paper gives a reason why it holds.
Probably not a substantial claim. The paper’s conclusions may not depend on it. It may state two separate claims as one.
The cited sources support only part of this claim — read each source’s verdict below.
In the paper
“In a process termed reverse cholesterol transport, peripheral tissues export their excess cholesterol to HDL using the cholesterol export pumps ABCA1 and ABCG1 (44).”
§ Expression of miR-33 from an SREBP2 Intron Inhibits Cholesterol Export and Fatty Acid Oxidation * □ S > JOURNAL OF BIOLOGICAL CHEMISTRY 33657
What the sources say
- Partly supportedcites [44] Yvan-Charvet, 2007, J. Clin. Invest. sourceExperimental — accuracy not yet measured
The Introduction (page not provided) describes HDL-mediated cholesterol removal from peripheral tissues and identifies ABCA1 and ABCG1 as cholesterol-efflux transporters. It distinguishes their acceptors, however: ABCA1 exports to lipid-poor apoA-1, not mature HDL particles, whereas ABCG1 exports to HDL. Thus the claim is too broad in saying both pumps export cholesterol to HDL. (LLM, conf=0.86)
plaindirect- Asserted: passes — The authors put it forward as true.
- Checkable: passes — It can be checked against evidence.
- Load-bearing: fails — The paper’s conclusions may not depend on it.
- Based: passes — The paper gives a reason why it holds.
Probably not a substantial claim. The paper’s conclusions may not depend on it.
- Partly supported
The cited sources support only part of this claim — read each source’s verdict below.
In the paper
“Previous studies have shown that reduction of one or the other component in heterozygote knock-out mice leads to a concomitant reduction of the other subunit (31)(32)(33).”
§ Expression of miR-33 from an SREBP2 Intron Inhibits Cholesterol Export and Fatty Acid Oxidation * □ S > miR-33 Inhibits Cellular Fatty Acid
What the sources say
- Supportedcites [31] Ibdah, 2001, J. Clin. Invest. source
The section “Generation and molecular characterization of MTP-deficient mice” reports that heterozygous Mtpa knockout mice had intermediate expression of both α and β subunits. This supports the claim for reduction of the α component in heterozygous mice accompanied by reduction of the β component. (LLM, conf=0.90)
- Partly supportedcites [32] Ibdah, 2005, Gastroenterology sourceExperimental — accuracy not yet measured
The Assessment of the Temporal Relationship section (page unavailable) reports lower hepatic MTP α-subunit expression in α-heterozygous mice than in wild-type mice. The Background & Aims section says α-null homozygotes lack both subunits, but the paper does not show a concomitant reduction of the β-subunit in heterozygotes or examine β-heterozygous knockouts. (LLM, conf=0.85)
- Partly supportedcites [33] Kao, 2006, Hum. Mol. Genet. sourceExperimental — accuracy not yet measured
The Discussion and Western blot and enzyme activity assay section report that both MTP subunits were reduced in affected mice with a mutation in the β-subunit. But the Identification of the mutated gene section identifies the affected mice as homozygous for a missense mutation, not heterozygous knockout mice; the paper therefore does not establish the claim for that genotype. (LLM, conf=0.89)
plaindirect- Asserted: passes — The authors put it forward as true.
- Checkable: passes — It can be checked against evidence.
- Load-bearing: fails — The paper’s conclusions may not depend on it.
- Based: passes — The paper gives a reason why it holds.
Probably not a substantial claim. The paper’s conclusions may not depend on it.
- Supported
The cited sources support only part of this claim — read each source’s verdict below.
In the paper
“The reciprocal relationship also appears to be true in that increased gene dosage of ABCA1 increases plasma HDL levels and protects from arteriosclerosis in animal models of hyperlipidemia (48).”
§ Expression of miR-33 from an SREBP2 Intron Inhibits Cholesterol Export and Fatty Acid Oxidation * □ S > JOURNAL OF BIOLOGICAL CHEMISTRY 33657
What the sources say
- Partly supportedcites [48] Singaraja, 2001, J. Biol. Chem. sourceExperimental — accuracy not yet measured
The Results report significantly higher HDL-C in ABCA1 BAC transgenic mice than in control littermates, including when fed an atherogenic diet. The paper does not report an arteriosclerosis outcome or establish protection from arteriosclerosis in hyperlipidemic animal models; feeding an atherogenic diet does not by itself establish that protection. (LLM, conf=0.88)
hedgeddirect- Asserted: passes — The authors put it forward as true.
- Checkable: passes — It can be checked against evidence.
- Load-bearing: fails — The paper’s conclusions may not depend on it.
- Based: passes — The paper gives a reason why it holds.
Probably not a substantial claim. The paper’s conclusions may not depend on it. It may state two separate claims as one.
- Partly supported
The cited sources support only part of this claim — read each source’s verdict below.
In the paper
“D. melanogaster is a cholesterol auxotroph and activation of SREBP is regulated by reduced levels of palmitate and/or phospholipids.”
§ Expression of miR-33 from an SREBP2 Intron Inhibits Cholesterol Export and Fatty Acid Oxidation * □ S > JOURNAL OF BIOLOGICAL CHEMISTRY 33657
What the sources say
- Not checked — no full text of the sourcecites [39] Dobrosotskaya, 2002, Science source
- Partly supportedcites [40] Seegmiller, 2002, Dev. Cell sourceExperimental — accuracy not yet measured
The paper says insects require dietary sterols, supporting the description of D. melanogaster as a cholesterol auxotroph. The Results and Discussion show that added palmitate inhibits dSREBP processing in cultured Drosophila cells, but the Discussion says it is not clear whether palmitate itself or a more complex lipid, possibly a phospholipid, is responsible. It does not establish that reduced phospholipid levels activate SREBP. (LLM, conf=0.85)
plaindirect- Asserted: passes — The authors put it forward as true.
- Checkable: passes — It can be checked against evidence.
- Load-bearing: fails — The paper’s conclusions may not depend on it.
- Based: passes — The paper gives a reason why it holds.
Probably not a substantial claim. The paper’s conclusions may not depend on it. It may state two separate claims as one.
Every source the paper cites for this claim was checked and supports it.
In the paper
“The mitochondrial trifunctional protein consists of an ␣ subunit (encoded by HADHA) and a  subunit (encoded by HADHB) (31).”
§ Expression of miR-33 from an SREBP2 Intron Inhibits Cholesterol Export and Fatty Acid Oxidation * □ S > miR-33 Inhibits Cellular Fatty Acid
What the sources say
- Supportedcites [31] Ibdah, 2001, J. Clin. Invest. source
The Introduction states that mitochondrial trifunctional protein is a hetero-octamer of α and β subunits and explicitly identifies the genes coding for them as HADHA and HADHB, respectively. (LLM, conf=0.95)
plain- Asserted: passes — The authors put it forward as true.
- Checkable: passes — It can be checked against evidence.
- Load-bearing: fails — The paper’s conclusions may not depend on it.
- Based: passes — The paper gives a reason why it holds.
Probably not a substantial claim. The paper’s conclusions may not depend on it.
- Supported
Every source the paper cites for this claim was checked and supports it.
In the paper
“This was observed both in mice that carry a hypomorphic allele of the HADHB gene and, notably, in mice heterozygote for a null mutation of the HADHA gene (encoding the ␣-subunit) (32,33).”
§ Expression of miR-33 from an SREBP2 Intron Inhibits Cholesterol Export and Fatty Acid Oxidation * □ S > miR-33 in Cholesterol and Fatty Acid Metabolism
What the sources say
- Supportedcites [32] Ibdah, 2005, Gastroenterology source
The Background & Aims identifies the studied mice as heterozygous for an MTP α-subunit null allele, and Evaluation for Nonalcoholic Fatty Liver Disease reports hepatic steatosis in those mice. The finding was in aging mice; the paper reports no steatosis in young heterozygous mice. The separate HADHB example is not attributed to this source alone in the two-citation sentence. (LLM, conf=0.92)
- Supportedcites [33] Kao, 2006, Hum. Mol. Genet. source
The Identification of the mutated gene section identifies a homozygous Hadhb M404K mutation in the affected mice, and the Abstract reports hepatic steatosis in those mice. The enzyme activity results show reduced, rather than absent, activity, consistent with a hypomorphic allele. The HADHA heterozygote clause is accompanied by a separate citation and is not attributed to this paper. (LLM, conf=0.91)
plain- Asserted: passes — The authors put it forward as true.
- Checkable: passes — It can be checked against evidence.
- Load-bearing: unclear — It is unclear whether the paper’s conclusions depend on it.
- Based: passes — The paper gives a reason why it holds.
It may state two separate claims as one.
- Supported
The paper states this without a source or data behind it here, so there is nothing to check it against. The quote shows it is in the paper.
In the paper
“Localization and sequence of this miRNA family is highly conserved down to insects and chordates, but not in worms.”
§ Expression of miR-33 from an SREBP2 Intron Inhibits Cholesterol Export and Fatty Acid Oxidation * □ S > miR-33a Is Produced from an Intron of the SREBP2 Gene and
plain- Asserted: passes — The authors put it forward as true.
- Checkable: passes — It can be checked against evidence.
- Load-bearing: fails — The paper’s conclusions may not depend on it.
- Based: passes — The paper gives a reason why it holds.
Probably not a substantial claim. The paper’s conclusions may not depend on it. It may state two separate claims as one.
A result the paper reports from its own data — it cites no other source for it, so there is none to check. The quote shows it is in the paper.
In the paper
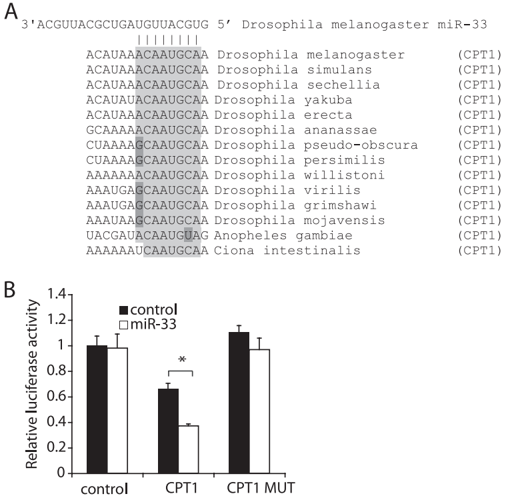
“Cotransfection of these constructs with preMIR-33 significantly reduced activation of constructs containing the wild type 3Ј UTR when compared with transfection with a preMIR control (Fig. 5, B, D, and F).”
§ Expression of miR-33 from an SREBP2 Intron Inhibits Cholesterol Export and Fatty Acid Oxidation * □ S > miR-33 in Cholesterol and Fatty Acid Metabolism
plaindirect- Asserted: passes — The authors put it forward as true.
- Checkable: passes — It can be checked against evidence.
- Load-bearing: passes — The paper’s conclusions depend on it.
- Based: passes — The paper gives a reason why it holds.
It may state two separate claims as one.
A result the paper reports from its own data — it cites no other source for it, so there is none to check. The quote shows it is in the paper.
In the paper
“With regard to their sequence, miR-33a and miR-33b differ only by two nucleotides outside the seed sequence (Fig. 1B).”
§ Expression of miR-33 from an SREBP2 Intron Inhibits Cholesterol Export and Fatty Acid Oxidation * □ S > miR-33a Is Produced from an Intron of the SREBP2 Gene and
plain- Asserted: passes — The authors put it forward as true.
- Checkable: passes — It can be checked against evidence.
- Load-bearing: fails — The paper’s conclusions may not depend on it.
- Based: passes — The paper gives a reason why it holds.
Probably not a substantial claim. The paper’s conclusions may not depend on it.
A result the paper reports from its own data — it cites no other source for it, so there is none to check. The quote shows it is in the paper.
In the paper
“Most species (including the mouse), however, only possess miR-33a in the SREBP2 gene and have lost the sequence of miR-33b within the SREBP1 gene (Fig. 1A and supplemental Fig. S3).”
§ Expression of miR-33 from an SREBP2 Intron Inhibits Cholesterol Export and Fatty Acid Oxidation * □ S > miR-33a Is Produced from an Intron of the SREBP2 Gene and
plain- Asserted: passes — The authors put it forward as true.
- Checkable: passes — It can be checked against evidence.
- Load-bearing: unclear — It is unclear whether the paper’s conclusions depend on it.
- Based: passes — The paper gives a reason why it holds.
It may state two separate claims as one.
A result the paper reports from its own data — it cites no other source for it, so there is none to check. The quote shows it is in the paper.
In the paper
“overexpression of competitive antagonists of miR-33 action (i.e.miRNA sponges) in HepG2 cells led to an up-regulation of ABCA1 protein levels, which was accompanied by a significant increase in apoAI-dependent cellular cholesterol export (Fig. 3, C and D).”
§ Expression of miR-33 from an SREBP2 Intron Inhibits Cholesterol Export and Fatty Acid Oxidation * □ S > miR-33 in Cholesterol and Fatty Acid Metabolism
plaindirect- Asserted: passes — The authors put it forward as true.
- Checkable: passes — It can be checked against evidence.
- Load-bearing: passes — The paper’s conclusions depend on it.
- Based: passes — The paper gives a reason why it holds.
It may state two separate claims as one.
- Rests on an assumption: The miRNA sponges and antagomirs specifically inhibit miR-33 without off-target effects.
The paper states this without a source or data behind it here, so there is nothing to check it against. The quote shows it is in the paper.
In the paper
“Several explanations seem possible to explain why we did not observe an increase in -oxidation and HADHB levels upon inhibition of miR-33.”
§ Expression of miR-33 from an SREBP2 Intron Inhibits Cholesterol Export and Fatty Acid Oxidation * □ S > miR-33 in Cholesterol and Fatty Acid Metabolism
hedged- Asserted: passes — The authors put it forward as true.
- Checkable: passes — It can be checked against evidence.
- Load-bearing: passes — The paper’s conclusions depend on it.
- Based: passes — The paper gives a reason why it holds.
It may state two separate claims as one.
A result the paper reports from its own data — it cites no other source for it, so there is none to check. The quote shows it is in the paper.
In the paper
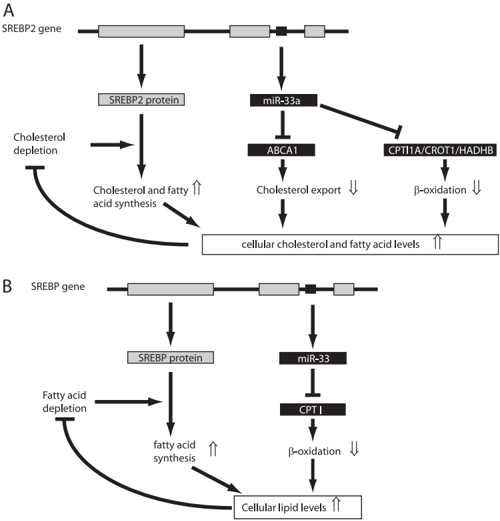
“The discovery that miR-33 inhibits ABCA1 expression and consequentially cellular cholesterol export suggests that one genetic locus increases synthesis and limits export of cholesterol through two distinct mechanisms (Fig. 8A).”
- Also stated in: § miR-33 in Cholesterol and Fatty Acid Metabolism · plain
“miR-33 reduces endogenous ABCA1 protein levels and modulates cellular cholesterol export in HepG2 cells.”
- Also stated in: § miR-33 in Cholesterol and Fatty Acid Metabolism · plain
“miR-33 reduces endogenous ABCA1 protein levels and modulates cellular cholesterol export in THP1 macrophages.”
§ Expression of miR-33 from an SREBP2 Intron Inhibits Cholesterol Export and Fatty Acid Oxidation * □ S > DISCUSSION
plaindirect- Asserted: passes — The authors put it forward as true.
- Checkable: passes — It can be checked against evidence.
- Load-bearing: passes — The paper’s conclusions depend on it.
- Based: passes — The paper gives a reason why it holds.
It may state two separate claims as one.
- Also stated in: § miR-33 in Cholesterol and Fatty Acid Metabolism · plain
A result the paper reports from its own data — it cites no other source for it, so there is none to check. The quote shows it is in the paper.
In the paper
“Inhibition of miR-33 with miRNA sponges or antisense oligonucleotides did not cause a reproducible increase in fatty acid -oxidation or alteration of HADHB and CPT1A protein levels in HepG2 cells (data not shown).”
§ Expression of miR-33 from an SREBP2 Intron Inhibits Cholesterol Export and Fatty Acid Oxidation * □ S > miR-33 Inhibits Cellular Fatty Acid
plain- Asserted: passes — The authors put it forward as true.
- Checkable: passes — It can be checked against evidence.
- Load-bearing: unclear — It is unclear whether the paper’s conclusions depend on it.
- Based: passes — The paper gives a reason why it holds.
It may state two separate claims as one.
- Rests on an assumption: The miRNA sponges and antagomirs specifically inhibit miR-33 without off-target effects.
A result the paper reports from its own data — it cites no other source for it, so there is none to check. The quote shows it is in the paper.
In the paper
“Site-directed mutagenesis of one or two of the predicted seed binding sites completely abolished this response (mutated nucleotides indicated by asterisks).”
§ Expression of miR-33 from an SREBP2 Intron Inhibits Cholesterol Export and Fatty Acid Oxidation * □ S > miR-33 in Cholesterol and Fatty Acid Metabolism
plaindirect- Asserted: passes — The authors put it forward as true.
- Checkable: passes — It can be checked against evidence.
- Load-bearing: passes — The paper’s conclusions depend on it.
- Based: passes — The paper gives a reason why it holds.
The quote only partly states this claim.
A result the paper reports from its own data — it cites no other source for it, so there is none to check. The quote shows it is in the paper.
In the paper
“Culturing cells at high density and/or in lipid-free medium leads to an increase of miR-33 (supplemental Fig. S12A).”
§ Expression of miR-33 from an SREBP2 Intron Inhibits Cholesterol Export and Fatty Acid Oxidation * □ S > miR-33 Inhibits Cellular Fatty Acid
plaindirect- Asserted: passes — The authors put it forward as true.
- Checkable: passes — It can be checked against evidence.
- Load-bearing: unclear — It is unclear whether the paper’s conclusions depend on it.
- Based: passes — The paper gives a reason why it holds.
It may state two separate claims as one.
A result the paper reports from its own data — it cites no other source for it, so there is none to check. The quote shows it is in the paper.
In the paper
“Notably, these two changes lead to a perfect complementarity of miR-33b with the CROT 3Ј UTR over a total of 18 nucleotides, which could allow miR-33b to induce Ago2-dependent cleavage of the CROT transcript (supplemental Fig. S8, B versus C).”
§ Expression of miR-33 from an SREBP2 Intron Inhibits Cholesterol Export and Fatty Acid Oxidation * □ S > miR-33 in Cholesterol and Fatty Acid Metabolism
hedgedconditional- Asserted: passes — The authors put it forward as true.
- Checkable: passes — It can be checked against evidence.
- Load-bearing: passes — The paper’s conclusions depend on it.
- Based: passes — The paper gives a reason why it holds.
It may state two separate claims as one.
A result the paper reports from its own data — it cites no other source for it, so there is none to check. The quote shows it is in the paper.
In the paper
“It should be noted that several prediction algorithms do not recognize CPT1A as a miR-33 target gene.This is due to the fact that these algorithms utilize a short 3Ј UTR generated from an alternative exon (supplemen- tal Fig. S9A).”
§ Expression of miR-33 from an SREBP2 Intron Inhibits Cholesterol Export and Fatty Acid Oxidation * □ S > miR-33 in Cholesterol and Fatty Acid Metabolism
plaindirect- Asserted: passes — The authors put it forward as true.
- Checkable: passes — It can be checked against evidence.
- Load-bearing: fails — The paper’s conclusions may not depend on it.
- Based: passes — The paper gives a reason why it holds.
Probably not a substantial claim. The paper’s conclusions may not depend on it.
A result the paper reports from its own data — it cites no other source for it, so there is none to check. The quote shows it is in the paper.
In the paper
“When analyzing cellular extracts by TLC we observed a significant increase in cellular free fatty acid levels and triacylglycerides (Fig. 6D and supplemental Fig. S11).”
§ Expression of miR-33 from an SREBP2 Intron Inhibits Cholesterol Export and Fatty Acid Oxidation * □ S > miR-33 Inhibits Cellular Fatty Acid
plaindirect- Asserted: passes — The authors put it forward as true.
- Checkable: passes — It can be checked against evidence.
- Load-bearing: passes — The paper’s conclusions depend on it.
- Based: passes — The paper gives a reason why it holds.
It may state two separate claims as one.
A result the paper reports from its own data — it cites no other source for it, so there is none to check. The quote shows it is in the paper.
In the paper
“miR-33 reduces endogenous ABCA1 protein levels and modulates cellular cholesterol export in HepG2 cells.”
§ Expression of miR-33 from an SREBP2 Intron Inhibits Cholesterol Export and Fatty Acid Oxidation * □ S > miR-33 in Cholesterol and Fatty Acid Metabolism
plaindirect- Asserted: passes — The authors put it forward as true.
- Checkable: passes — It can be checked against evidence.
- Load-bearing: passes — The paper’s conclusions depend on it.
- Based: passes — The paper gives a reason why it holds.
It may state two separate claims as one.
A result the paper reports from its own data — it cites no other source for it, so there is none to check. The quote shows it is in the paper.
In the paper
“miR-33 reduces endogenous ABCA1 protein levels and modulates cellular cholesterol export in THP1 macrophages.”
§ Expression of miR-33 from an SREBP2 Intron Inhibits Cholesterol Export and Fatty Acid Oxidation * □ S > miR-33 in Cholesterol and Fatty Acid Metabolism
plaindirect- Asserted: passes — The authors put it forward as true.
- Checkable: passes — It can be checked against evidence.
- Load-bearing: passes — The paper’s conclusions depend on it.
- Based: passes — The paper gives a reason why it holds.
It may state two separate claims as one.
A result the paper reports from its own data — it cites no other source for it, so there is none to check. The quote shows it is in the paper.
In the paper
“miR-33a localization within SREBP2 and sequences are evolutionary conserved.”
§ Expression of miR-33 from an SREBP2 Intron Inhibits Cholesterol Export and Fatty Acid Oxidation * □ S > miR-33 in Cholesterol and Fatty Acid Metabolism
plain- Asserted: passes — The authors put it forward as true.
- Checkable: passes — It can be checked against evidence.
- Load-bearing: unclear — It is unclear whether the paper’s conclusions depend on it.
- Based: passes — The paper gives a reason why it holds.
It may state two separate claims as one.
A result the paper reports from its own data — it cites no other source for it, so there is none to check. The quote shows it is in the paper.
In the paper
“In fact, there was a small, but not significant, trend for reduced miR-33 levels, as one might intuitively expect in a situation of hyperalimentation.”
§ Expression of miR-33 from an SREBP2 Intron Inhibits Cholesterol Export and Fatty Acid Oxidation * □ S > miR-33 in Cholesterol and Fatty Acid Metabolism
plainn = 2- Asserted: passes — The authors put it forward as true.
- Checkable: passes — It can be checked against evidence.
- Load-bearing: fails — The paper’s conclusions may not depend on it.
- Based: passes — The paper gives a reason why it holds.
Probably not a substantial claim. The paper’s conclusions may not depend on it.
A result the paper reports from its own data — it cites no other source for it, so there is none to check. The quote shows it is in the paper.
In the paper
“miR-33 reduces -oxidation and alters cellular fatty acid metabolism.”
§ Expression of miR-33 from an SREBP2 Intron Inhibits Cholesterol Export and Fatty Acid Oxidation * □ S > miR-33 in Cholesterol and Fatty Acid Metabolism
plaindirect- Asserted: passes — The authors put it forward as true.
- Checkable: passes — It can be checked against evidence.
- Load-bearing: passes — The paper’s conclusions depend on it.
- Based: passes — The paper gives a reason why it holds.
It may state two separate claims as one.
In the paper
“CPT1A is the liver-specific isoform of the enzyme that converts acyl-CoA to acylcarnitine and thereby allows fatty acids to enter the mitochondrion where fatty acid -oxidation takes place (27).”
§ Expression of miR-33 from an SREBP2 Intron Inhibits Cholesterol Export and Fatty Acid Oxidation * □ S > miR-33 in Cholesterol and Fatty Acid Metabolism
What the sources say
- Not checked — no full text of the sourcecites [27] Bonnefont, 2004, Mol. Aspects Med. source
plain- Asserted: passes — The authors put it forward as true.
- Checkable: passes — It can be checked against evidence.
- Load-bearing: fails — The paper’s conclusions may not depend on it.
- Based: passes — The paper gives a reason why it holds.
Probably not a substantial claim. The paper’s conclusions may not depend on it.
In the paper
“ABCA1 acts as a cellular cholesterol export pump.Although there are a number of cholesterol efflux pumps, ABCA1 has the unique capability to export cholesterol to lipid-free apolipoprotein AI (apoAI) and is therefore involved in the initial step of high-density lipoprotein particle formation in liver, as well as reverse cholesterol transport (26).”
§ Expression of miR-33 from an SREBP2 Intron Inhibits Cholesterol Export and Fatty Acid Oxidation * □ S > miR-33 in Cholesterol and Fatty Acid Metabolism
What the sources say
- Not checked — no full text of the sourcecites [26] Tall, 2008, Cell Metab. source
plaindirect- Asserted: passes — The authors put it forward as true.
- Checkable: passes — It can be checked against evidence.
- Load-bearing: passes — The paper’s conclusions depend on it.
- Based: passes — The paper gives a reason why it holds.
Probably not a substantial claim. It may state two separate claims as one.
A conclusion the paper draws from its own results — it cites no other source for it, so there is none to check. The quote shows it is in the paper.
In the paper
“The genetic locus encoding SREBP2 and miR-33 therefore contains a protein that increases lipid synthesis and a miRNA that prevents export and degradation of newly synthesized lipids.”
§ Expression of miR-33 from an SREBP2 Intron Inhibits Cholesterol Export and Fatty Acid Oxidation * □ S > Abstract
plaindirect- Asserted: passes — The authors put it forward as true.
- Checkable: passes — It can be checked against evidence.
- Load-bearing: passes — The paper’s conclusions depend on it.
- Based: passes — The paper gives a reason why it holds.
It may state two separate claims as one.
In the paper
“CROT, sometimes abbreviated COT, is a peroxisomal enzyme that couples short chain fatty acids to carnitine and thereby allows their entry in the mitochondrial matrix.”
§ Expression of miR-33 from an SREBP2 Intron Inhibits Cholesterol Export and Fatty Acid Oxidation * □ S > miR-33 in Cholesterol and Fatty Acid Metabolism
What the sources say
- Not checked — no full text of the sourcecites [29] Wanders, 2010, Biochim. Biophys. Acta source
plaindirect- Asserted: passes — The authors put it forward as true.
- Checkable: passes — It can be checked against evidence.
- Load-bearing: fails — The paper’s conclusions may not depend on it.
- Based: passes — The paper gives a reason why it holds.
Probably not a substantial claim. The paper’s conclusions may not depend on it.
In the paper
“Although not strictly an enzyme of the -oxidation, the activity of CPT1A is rate-limiting for oxidation, and is the most highly regulated element in this metabolic pathway (28).”
§ Expression of miR-33 from an SREBP2 Intron Inhibits Cholesterol Export and Fatty Acid Oxidation * □ S > miR-33 in Cholesterol and Fatty Acid Metabolism
What the sources say
- Not checked — no full text of the sourcecites [28] Saggerson, 2008, Annu. Rev. Nutr. source
plaindirect- Asserted: passes — The authors put it forward as true.
- Checkable: passes — It can be checked against evidence.
- Load-bearing: fails — The paper’s conclusions may not depend on it.
- Based: passes — The paper gives a reason why it holds.
Probably not a substantial claim. The paper’s conclusions may not depend on it. It may state two separate claims as one.
A conclusion the paper draws from its own results — it cites no other source for it, so there is none to check. The quote shows it is in the paper.
In the paper
“Taken together, our data suggest that endogenous miR-33 targets and represses translation of ABCA1, and reduces cellular cholesterol export.”
§ Expression of miR-33 from an SREBP2 Intron Inhibits Cholesterol Export and Fatty Acid Oxidation * □ S > miR-33 in Cholesterol and Fatty Acid Metabolism
hedgeddirect- Asserted: passes — The authors put it forward as true.
- Checkable: passes — It can be checked against evidence.
- Load-bearing: passes — The paper’s conclusions depend on it.
- Based: passes — The paper gives a reason why it holds.
It may state two separate claims as one.
In the paper
“It has recently been noted that cancer cell lines and proliferative cells often express transcripts with shorter 3Ј UTRs (51).”
§ Expression of miR-33 from an SREBP2 Intron Inhibits Cholesterol Export and Fatty Acid Oxidation * □ S > miR-33 in Cholesterol and Fatty Acid Metabolism
What the sources say
- Not checked — no full text of the sourcecites [51] Sandberg, 2008, Science source
plaincorrelational- Asserted: passes — The authors put it forward as true.
- Checkable: passes — It can be checked against evidence.
- Load-bearing: passes — The paper’s conclusions depend on it.
- Based: passes — The paper gives a reason why it holds.
Probably not a substantial claim.
A claim is checked only against the cited paper’s full text, never its abstract, and none is available for its sources.
In the paper
“Loss-of-function alleles of ABCA1 are associated with a decrease in HDL levels and might be associated with an increase in cardiovascular mortality (42,49).”
§ Expression of miR-33 from an SREBP2 Intron Inhibits Cholesterol Export and Fatty Acid Oxidation * □ S > JOURNAL OF BIOLOGICAL CHEMISTRY 33657
What the sources say
hedgedcorrelational- Asserted: passes — The authors put it forward as true.
- Checkable: passes — It can be checked against evidence.
- Load-bearing: passes — The paper’s conclusions depend on it.
- Based: passes — The paper gives a reason why it holds.
Probably not a substantial claim. It may state two separate claims as one.
A conclusion the paper draws from its own results — it cites no other source for it, so there is none to check. The quote shows it is in the paper.
In the paper
“Given its preventive effect in mice, increasing ABCA1 protein levels by inhibiting miR-33 might therefore prove useful in the prevention of cardiovascular diseases.”
§ Expression of miR-33 from an SREBP2 Intron Inhibits Cholesterol Export and Fatty Acid Oxidation * □ S > JOURNAL OF BIOLOGICAL CHEMISTRY 33657
hedgedconditional- Asserted: passes — The authors put it forward as true.
- Checkable: passes — It can be checked against evidence.
- Load-bearing: passes — The paper’s conclusions depend on it.
- Based: passes — The paper gives a reason why it holds.
Probably not a substantial claim.
In the paper
“Inactivating mutations in ABCA1 lead to the development of Tangier disease, which is characterized by the absence of HDL and the accumulation of cholesterol in peripheral tissues (42).”
§ Expression of miR-33 from an SREBP2 Intron Inhibits Cholesterol Export and Fatty Acid Oxidation * □ S > JOURNAL OF BIOLOGICAL CHEMISTRY 33657
What the sources say
- Not checked — no full text of the sourcecites [42] Brunham, 2008, JAMA source
plaindirect- Asserted: passes — The authors put it forward as true.
- Checkable: passes — It can be checked against evidence.
- Load-bearing: fails — The paper’s conclusions may not depend on it.
- Based: passes — The paper gives a reason why it holds.
Probably not a substantial claim. The paper’s conclusions may not depend on it.
In the paper
“Although CROT is localized to the peroxisomes, it serves to transfer remnants from peroxisomal -oxidation to the mitochondria and therefore fuels mitochondria with fatty acids independently of CPT1A (29).”
§ Expression of miR-33 from an SREBP2 Intron Inhibits Cholesterol Export and Fatty Acid Oxidation * □ S > miR-33 in Cholesterol and Fatty Acid Metabolism
What the sources say
- Not checked — no full text of the sourcecites [29] Wanders, 2010, Biochim. Biophys. Acta source
plaindirect- Asserted: passes — The authors put it forward as true.
- Checkable: passes — It can be checked against evidence.
- Load-bearing: passes — The paper’s conclusions depend on it.
- Based: passes — The paper gives a reason why it holds.
It may state two separate claims as one.
A conclusion the paper draws from its own results — it cites no other source for it, so there is none to check. The quote shows it is in the paper.
In the paper
“When decreases in cellular cholesterol levels trigger the activation of SREBP transcription factors, the presence of miR-33 prevents cholesterol from leaving the cell by suppressing expression of ABCA1, thus allowing cellular cholesterol levels to be restored (Fig. 8A).”
§ Expression of miR-33 from an SREBP2 Intron Inhibits Cholesterol Export and Fatty Acid Oxidation * □ S > DISCUSSION
plaindirect- Asserted: passes — The authors put it forward as true.
- Checkable: passes — It can be checked against evidence.
- Load-bearing: passes — The paper’s conclusions depend on it.
- Based: passes — The paper gives a reason why it holds.
It may state two separate claims as one.
A claim is checked only against the cited paper’s full text, never its abstract, and none is available for its sources.
In the paper
“On the other hand, elevated levels of high density lipoprotein cholesterol reduces the risk of arteriosclerosis (42,43).”
§ Expression of miR-33 from an SREBP2 Intron Inhibits Cholesterol Export and Fatty Acid Oxidation * □ S > JOURNAL OF BIOLOGICAL CHEMISTRY 33657
What the sources say
plaindirect- Asserted: passes — The authors put it forward as true.
- Checkable: passes — It can be checked against evidence.
- Load-bearing: fails — The paper’s conclusions may not depend on it.
- Based: passes — The paper gives a reason why it holds.
Probably not a substantial claim. The paper’s conclusions may not depend on it.
In the paper
“The gene HADHB encodes for the -subunit of the mitochondrial trifunctional protein that carries out the last three steps of -oxidation (30).”
§ Expression of miR-33 from an SREBP2 Intron Inhibits Cholesterol Export and Fatty Acid Oxidation * □ S > miR-33 in Cholesterol and Fatty Acid Metabolism
What the sources say
- Not checked — no full text of the sourcecites [30] Eaton, 2000, Biochem. Soc. Trans. source
plain- Asserted: passes — The authors put it forward as true.
- Checkable: passes — It can be checked against evidence.
- Load-bearing: fails — The paper’s conclusions may not depend on it.
- Based: passes — The paper gives a reason why it holds.
Probably not a substantial claim. The paper’s conclusions may not depend on it.
In the paper
“Peroxisomal -oxidation is limited to the degradation of long-and medium-chain fatty acids as it is not able to oxidize short chain fatty acids (29).”
§ Expression of miR-33 from an SREBP2 Intron Inhibits Cholesterol Export and Fatty Acid Oxidation * □ S > miR-33 in Cholesterol and Fatty Acid Metabolism
What the sources say
- Not checked — no full text of the sourcecites [29] Wanders, 2010, Biochim. Biophys. Acta source
plain- Asserted: passes — The authors put it forward as true.
- Checkable: passes — It can be checked against evidence.
- Load-bearing: fails — The paper’s conclusions may not depend on it.
- Based: passes — The paper gives a reason why it holds.
Probably not a substantial claim. The paper’s conclusions may not depend on it.
A conclusion the paper draws from its own results — it cites no other source for it, so there is none to check. The quote shows it is in the paper.
In the paper
“Agents that alter HDL cholesterol levels therefore carry the potential to reduce cardiovascular diseases.”
§ Expression of miR-33 from an SREBP2 Intron Inhibits Cholesterol Export and Fatty Acid Oxidation * □ S > JOURNAL OF BIOLOGICAL CHEMISTRY 33657
hedgedconditional- Asserted: passes — The authors put it forward as true.
- Checkable: passes — It can be checked against evidence.
- Load-bearing: fails — The paper’s conclusions may not depend on it.
- Based: passes — The paper gives a reason why it holds.
Probably not a substantial claim. The paper’s conclusions may not depend on it.
In the paper
“Presently, non-alcoholic fatty liver disease (NAFLD) is by far the most common liver ailment (53).”
§ Expression of miR-33 from an SREBP2 Intron Inhibits Cholesterol Export and Fatty Acid Oxidation * □ S > miR-33 in Cholesterol and Fatty Acid Metabolism
What the sources say
- Not checked — no full text of the sourcecites [53] Angulo, 2002, N. Engl. J. Med. source
plain- Asserted: passes — The authors put it forward as true.
- Checkable: passes — It can be checked against evidence.
- Load-bearing: fails — The paper’s conclusions may not depend on it.
- Based: passes — The paper gives a reason why it holds.
Probably not a substantial claim. The paper’s conclusions may not depend on it.
A conclusion the paper draws from its own results — it cites no other source for it, so there is none to check. The quote shows it is in the paper.
In the paper
“Likewise, altering the levels of HADHB might change the potential maximum flux through -oxidation, but might have little influence under most conditions where fatty acid supply in the mitochondria is rate-limiting for -oxidation.”
§ Expression of miR-33 from an SREBP2 Intron Inhibits Cholesterol Export and Fatty Acid Oxidation * □ S > miR-33 in Cholesterol and Fatty Acid Metabolism
hedgedconditional- Asserted: passes — The authors put it forward as true.
- Checkable: passes — It can be checked against evidence.
- Load-bearing: fails — The paper’s conclusions may not depend on it.
- Based: passes — The paper gives a reason why it holds.
Probably not a substantial claim. The paper’s conclusions may not depend on it. It may state two separate claims as one.
A conclusion the paper draws from its own results — it cites no other source for it, so there is none to check. The quote shows it is in the paper.
In the paper
“Protein amounts of SREBPs therefore represent the maximum potential to respond to changes in lipid levels.”
§ Expression of miR-33 from an SREBP2 Intron Inhibits Cholesterol Export and Fatty Acid Oxidation * □ S > miR-33 in Cholesterol and Fatty Acid Metabolism
plaincorrelational- Asserted: passes — The authors put it forward as true.
- Checkable: passes — It can be checked against evidence.
- Load-bearing: fails — The paper’s conclusions may not depend on it.
- Based: passes — The paper gives a reason why it holds.
Probably not a substantial claim. The paper’s conclusions may not depend on it.
A conclusion the paper draws from its own results — it cites no other source for it, so there is none to check. The quote shows it is in the paper.
In the paper
“Interfering with miR-33 function in vivo therefore not only holds promise in increasing HDL cholesterol levels but may also prove beneficial for treatment of NAFLD and NASH.”
§ Expression of miR-33 from an SREBP2 Intron Inhibits Cholesterol Export and Fatty Acid Oxidation * □ S > miR-33 in Cholesterol and Fatty Acid Metabolism
hedgedconditional- Asserted: passes — The authors put it forward as true.
- Checkable: passes — It can be checked against evidence.
- Load-bearing: passes — The paper’s conclusions depend on it.
- Based: passes — The paper gives a reason why it holds.
It may state two separate claims as one.
In the paper
“With the increasing prevalence of obesity, it affects 10 -25% of the general population and up to 75% of obese type II diabetic patients (54).”
§ Expression of miR-33 from an SREBP2 Intron Inhibits Cholesterol Export and Fatty Acid Oxidation * □ S > miR-33 in Cholesterol and Fatty Acid Metabolism
What the sources say
- Not checked — no full text of the sourcecites [54] Marchesini, 2008, J. Clin. Endocrinol. Metab. source
plain- Asserted: passes — The authors put it forward as true.
- Checkable: passes — It can be checked against evidence.
- Load-bearing: fails — The paper’s conclusions may not depend on it.
- Based: passes — The paper gives a reason why it holds.
Probably not a substantial claim. The paper’s conclusions may not depend on it. It may state two separate claims as one.
In the paper
“A recent study of Cabellero and co-workers (55) suggests that SREBP2 transcript levels in NAFLD and NASH are elevated 3-and 7-fold, respectively.”
§ Expression of miR-33 from an SREBP2 Intron Inhibits Cholesterol Export and Fatty Acid Oxidation * □ S > miR-33 in Cholesterol and Fatty Acid Metabolism
What the sources say
- Not checked — no full text of the sourcecites [55] Caballero, 2009, J. Hepatol. source
hedgedcorrelational- Asserted: passes — The authors put it forward as true.
- Checkable: passes — It can be checked against evidence.
- Load-bearing: passes — The paper’s conclusions depend on it.
- Based: passes — The paper gives a reason why it holds.
It may state two separate claims as one.
A conclusion the paper draws from its own results — it cites no other source for it, so there is none to check. The quote shows it is in the paper.
In the paper
“The relevance of targeting HADHB is not quite as apparent, although reduced HADHB concentrations might help maintain adequate intermediary product levels in a situation where the enzyme that supplies the substrates for -oxidation (CPT1A and CROT) is inhibited.”
§ Expression of miR-33 from an SREBP2 Intron Inhibits Cholesterol Export and Fatty Acid Oxidation * □ S > miR-33 in Cholesterol and Fatty Acid Metabolism
hedgedconditional- Asserted: passes — The authors put it forward as true.
- Checkable: passes — It can be checked against evidence.
- Load-bearing: fails — The paper’s conclusions may not depend on it.
- Based: fails — The paper may give no reason why it holds.
Probably not a substantial claim. The paper’s conclusions may not depend on it. The paper may give no reason why it holds.
The paper relies on this without support.
The 500-bp genomic region surrounding miR-33a used in lentiviral vectors specifically expresses miR-33a without affecting other genes or small RNAs.
“we transduced HepG2 cells with a lentiviral expression vector constitutively driving expression of a 500-bp genomic region surrounding the miR-33a sequence.”
The paper relies on this without support.
The antibodies used for Western blot analysis specifically detect their intended targets (ABCA1, HADHB, CPT1A, HADHA, GAPDH, and β-actin).
“Antibodies were used at the following dilutions: ABCA1 at 1:1,000 (AB.H10, Santa Cruz Biotechnologies), HADHB at 1:1,000 (ARP48133, Aviva Systems Biology, San Diego, CA), HADHA at 1:1,000 (HPA015536, Sigma), CPT1 1:1000 (Proteintech, Manchester, UK), GAPDH at 1:2,000 (6C5, Pierce-ThermoFisher), and -actin at 1:10,000 (AC-40, Sigma).”
The paper relies on this without support.
The miRNA sponges and antagomirs specifically inhibit miR-33 without off-target effects.
“miR-33 antagomir denotes a 1:1 mixture of miR-33a and miR-33b antagomir.”
The paper relies on this without support.
D. melanogaster and other Drosophilids are cholesterol auxotrophs (cannot synthesize cholesterol).
“Notably, miR-33 is highly conserved in D. melanogaster (and other Drosophilids), which are auxotrophs for cholesterol, i.e. they cannot synthesize cholesterol.”
The paper relies on this without support.
SREBPs of higher organisms help to coordinately induce genes involved in cholesterol, fatty acid, and phospholipid synthesis.
“As mentioned above, SREBPs of higher organisms help to coordinately induce genes involved in cholesterol, fatty acid, and phospholipid synthesis.”
The paper relies on this without support.
Activation of SREBPs stimulates transcription of several genes involved in fatty acid synthesis.
“Activation of SREBPs stimulates transcription of several genes involved in fatty acid synthesis.”
The paper relies on this without support.
CPT1A is the rate-limiting and most highly regulated step in β-oxidation.
“As mentioned before, CPT1A is the rate-limiting and most highly regulated step in -oxidation.”
The paper relies on this without support.
CROT and CPT1A are enzymes that couple fatty acids to carnitine.
“CROT and CPT1A are enzymes that couple fatty acids to carnitine.”
The paper relies on this without support.
The protein product of the HADHB transcript forms the β-subunit of the mitochondrial trifunctional protein, which carries out three steps of β-oxidation.
“The protein product of the HADHB transcript forms the -subunit of the mitochondrial trifunctional protein, which carries out three steps of -oxidation.”
The paper relies on this without support.
No single mouse model or feeding regimen reliably reproduces the features of NAFLD and NASH.
“Unfortunately, no single mouse model or feeding regimen reliably reproduces the features of NAFLD and NASH.”
Claims other papers make about this one
Each is checked against this paper’s own text: does it say what the citing paper says it does?
The source backs part of the claim, not all of it — or backs it for a different population, condition or comparison.
In the citing paper
“miR-33a and miR-33b help prevent further loss of lipids by targeting genes involved in cholesterol trafficking and efflux”
From Genetic dissection of the impact of miR-33a and miR-33b during the progression of atherosclerosis (2017) · cites this paper as Gerin et al., 2010
Experimental — accuracy not yet measuredThe source backs part of the claim, not all of it — or backs it for a different population, condition or comparison.
In the citing paper
“In miR-33a knockout mice or when miR-33a is suppressed by synthetic nucleic acids such as antagomirs, the expression of ABCA1 in macrophages and the liver is increased 11 - 15) .”
From Critical Role of microRNA-33a/b in Cardiovascular and Metabolic Disease: Molecular Mechanisms and Therapeutic Perspectives (2026) · cites this paper as [15]
Experimental — accuracy not yet measuredThe source backs part of the claim, not all of it — or backs it for a different population, condition or comparison.
In the citing paper
“Two miR-33 genes are present in humans: miR-33b, which is present in intron 17 of the Srebp-1 gene on chromosome 17, and miR-33a, which is located in intron 16 of the Srebp-2 gene on chromosome 22.”
From miR-33a/b contribute to the regulation of fatty acid metabolism and insulin signaling (2011) · cites this paper as [11]
Experimental — accuracy not yet measuredThe source backs part of the claim, not all of it — or backs it for a different population, condition or comparison.
In the citing paper
“In mice, however, there is only one miR-33 gene, which is conserved with human miR-33a and located within intron 15 of the mouse Srebp-2 gene.”
From miR-33a/b contribute to the regulation of fatty acid metabolism and insulin signaling (2011) · cites this paper as [11]
Experimental — accuracy not yet measuredThe cited source says what the claim attributes to it.
In the citing paper
“The most well-known target gene of miR-33a/b is ATP-binding cassette subfamily A member 1 (ABCA1).”
From Critical Role of microRNA-33a/b in Cardiovascular and Metabolic Disease: Molecular Mechanisms and Therapeutic Perspectives (2026) · cites this paper as [15]
The cited source says what the claim attributes to it.
In the citing paper
“MiR-33 suppresses genes involved in mitochondrial β-oxidation, such as carnitine palmitoyltransferase 1A (CPT1A), hydroxyacyl-CoA dehydrogenase trifunctional multienzyme complex subunit b (HADHB), and carnitine O-octanoyltransferase (CROT) 15 , 17 , 34 , 35) .”
From Critical Role of microRNA-33a/b in Cardiovascular and Metabolic Disease: Molecular Mechanisms and Therapeutic Perspectives (2026) · cites this paper as [15]
The cited source says what the claim attributes to it.
In the citing paper
“We and others provided identification of a highly conserved miRNA family, miR-33, within the intronic sequences of the Srebp genes in organisms ranging from Drosophila to humans (11–14).”
From miR-33a/b contribute to the regulation of fatty acid metabolism and insulin signaling (2011) · cites this paper as [11]
Self-check
Percentages, sums and reported differences re-computed from the paper’s own numbers.
Each contradiction between two passages listed here was confirmed by an independent check.
Rated minor: it would not touch a result — a value no result rests on, a p-value that stays on the same side of the significance level, or a conflict that is clerical, resolved elsewhere in the paper, or outside its own findings.
In the paper
§ Expression of miR-33 from an SREBP2 Intron Inhibits Cholesterol Export and Fatty Acid Oxidation * □ S > Acknowledgements
“two articles were presented online describing the effect of miR-33 on ABCA1 and cholesterol metabolism (56 -58).”
§ Expression of miR-33 from an SREBP2 Intron Inhibits Cholesterol Export and Fatty Acid Oxidation * □ S > References
“58. Marquart, T. J., Allen, R. M., Ory, D. S., and Balda ´n, A. (2010) Proc. Natl. Acad. Sci. U.S.A. 107, 12228 -12232”
Rated minor: it would not touch a result — a value no result rests on, a p-value that stays on the same side of the significance level, or a conflict that is clerical, resolved elsewhere in the paper, or outside its own findings.
In the paper
§ Expression of miR-33 from an SREBP2 Intron Inhibits Cholesterol Export and Fatty Acid Oxidation * □ S > EXPERIMENTAL PROCEDURES
“Experiments were performed using 5 to 8 replicates per experimental condition and values shown represent mean Ϯ S.D.”
§ Expression of miR-33 from an SREBP2 Intron Inhibits Cholesterol Export and Fatty Acid Oxidation * □ S > miR-33 in Cholesterol and Fatty Acid Metabolism
“Values represent mean Ϯ S.E. of 6 replicates.”
Citations
Cites
A SIMPLE METHOD FOR THE ISOLATION AND PURIFICATION OF TOTAL LIPIDES FROM ANIMAL TISSUES
Folch, J., Lees, M., & Stanley, G. H. S. (1957) · Journal of Biological Chemistry · doi:10.1016/s0021-9258(18)64849-5 · Cited by 65,189
MicroRNAs: Target Recognition and Regulatory Functions
Bartel, D. P. (2009) · Cell · doi:10.1016/j.cell.2009.01.002 · Cited by 20,068
Lewis, B. P., Burge, C. B., & Bartel, D. P. (2005) · Cell · doi:10.1016/j.cell.2004.12.035 · Cited by 11,855
Nonalcoholic Fatty Liver Disease
Angulo, P. (2002) · New England Journal of Medicine · doi:10.1056/nejmra011775 · Cited by 5,228
SREBPs: activators of the complete program of cholesterol and fatty acid synthesis in the liver
Horton, J. D., Goldstein, J. L., & Brown, M. S. (2002) · Journal of Clinical Investigation · doi:10.1172/jci15593 · Cited by 4,794
Combinatorial microRNA target predictions
Krek, A., Grün, D., Poy, M. N., Wolf, R., Rosenberg, L., Epstein, E. J., MacMenamin, P., da Piedade, I., Gunsalus, K. C., Stoffel, M., et al. (2005) · Nature Genetics · doi:10.1038/ng1536 · Cited by 4,603
SREBPs: activators of the complete program of cholesterol and fatty acid synthesis in the liver
Horton, J. D., Goldstein, J. L., & Brown, M. S. (2002) · Journal of Clinical Investigation · doi:10.1172/jci0215593 · Cited by 4,092
Silencing of microRNAs in vivo with ‘antagomirs’
Krützfeldt, J., Rajewsky, N., Braich, R., Rajeev, K. G., Tuschl, T., Manoharan, M., & Stoffel, M. (2005) · Nature · doi:10.1038/nature04303 · Cited by 3,949
MicroRNA Targeting Specificity in Mammals: Determinants beyond Seed Pairing
Grimson, A., Farh, K. K.-H., Johnston, W. K., Garrett-Engele, P., Lim, L. P., & Bartel, D. P. (2007) · Molecular Cell · doi:10.1016/j.molcel.2007.06.017 · Cited by 3,766
The impact of microRNAs on protein output
Baek, D., Villén, J., Shin, C., Camargo, F. D., Gygi, S. P., & Bartel, D. P. (2008) · Nature · doi:10.1038/nature07242 · Cited by 3,592
Research works printed but not linked: 2
- Marti, 2010, Nucleic Acids Res.
- Yvan-Charvet, 2007, J. Clin. Invest., 117, 3900
Cited by
Sorted by citations
Items 301–383 of 383
MicroRNA-206 as a potential cholesterol-lowering drug is superior to statins in mice
Li, C., Tian, J., Liu, N., Song, D., Steer, C. J., Han, Q., & Song, G. (2024) · Journal of Lipid Research · doi:10.1016/j.jlr.2024.100576 · Cited by 6
“(13 – 16, 54) Considering the potential off-target off-target effects of miRNA Second, miR-206 exhibits low hepatic toxicity.”
BackgroundMicroRNAs in the progression of atherosclerosis: rise and fall of the atherosclerotic plaque
Rampin, A., Mutoli, M., Martelli, M., Settembrini, A. M., Martelli, F., Mitić, T., Sopić, M., Bruno, A., Spinetti, G., & CA, A. C. A. (2024) · European Atherosclerosis Journal · doi:10.56095/eaj.v3i2.63 · Cited by 5
“Furthermore, miR-33-5p modulates fatty acid oxidation by targeting peroxisome proliferator-activated receptor coactivator-1 α (PGC-1 α ) and several of its downstream effectors [65, 66].”
BackgroundTranscriptional Control of Lipid Metabolism
Musselman, L. P., Truong, H. G., & DiAngelo, J. R. (2024) · Advances in experimental medicine and biology · doi:10.1007/5584_2024_808 · Cited by 3
MicroRNA-Linked Heart Disease and Therapeutic Potential
Ono, K. (2016) · Elsevier eBooks · doi:10.1016/b978-0-12-800553-8.00010-x · Cited by 3
MiR-33a and statins collaboratively reduce the proliferative capacity of prostate cancer cells
Karataş, Ö. F., & Ittmann, M. (2018) · The European Research Journal · doi:10.18621/eurj.380619 · Cited by 3
“Several studies demonstrated that overexpression of miR-33a in vitro profoundly suppressed cholesterol export in various cell culture models [15, 44-46].”
BackgroundImplications of microRNA in kidney metabolic disorders
Zhou, Y., & Yang, J. (2020) · ExRNA · doi:10.1186/s41544-019-0042-9 · Cited by 3
“miR-33a, miR-33b and the complementary strand miR-33a-3p has been found to target CROT and therefore affect fatty acid β oxidation [30, 31, 34].”
BackgroundHepatocyte-specific miR-33 deletion attenuates NAFLD-NASH-HCC progressionPreprint
Fernández-Tussy, P., Sun, J., Cardelo, M. P., Price, N., Goedeke, L., Xirouchaki, C. E., Yang, X.-Y., Pastor-Rojo, O., Bennett, A., Tiganis, T., et al. (2023) · bioRxiv · doi:10.1101/2023.01.18.523503 · Cited by 5
Encarnação, M., David, H., Coutinho, M. F., Moreira, L., & Alves, S. (2023) · Biomedicines · doi:10.3390/biomedicines11102615 · Cited by 2
Albanese, F., Harrison, M., Farquhar, M. J., Holcombe, L. J., Atwal, J., Watson, P., & Piccinini, A. M. (2025) · Frontiers in Veterinary Science · doi:10.3389/fvets.2024.1382436 · Cited by 2
Mazza, T., Castellana, S., Andriulli, A., Auffray, C., Vinciguerra, M., & Pazienza, V. (2013) · Biosystems · doi:10.1016/j.biosystems.2013.05.009 · Cited by 2
Ekici, S., & Özmen, Ö. (2020) · Journal of Equine Veterinary Science · doi:10.1016/j.jevs.2020.103218 · Cited by 2
The Changing Face of Atherosclerosis
Meiliana, A., & Wijaya, A. (2023) · The Indonesian Biomedical Journal · doi:10.18585/inabj.v15i3.2347 · Cited by 2
“(197) Hepatic clearance through the scavenger receptor BI, which has been demonstrated to be a target of miR-223, miR-455-5p, miR-96, miR-185, and miR-125a, also regulates the levels of HDL-C in the blood.”
BackgroundNesan, D., & Ng, D. S. (2014) · Critical Reviews in Clinical Laboratory Sciences · doi:10.3109/10408363.2014.937523 · Cited by 2
Therapeutic modulation of microRNAs
Chau, B. N., Esau, C., MacKenna, D. A., Neben, S., & Gibson, N. W. (2013) · Drug Discovery Today Therapeutic Strategies · doi:10.1016/j.ddstr.2013.12.002 · Cited by 2
Vega‐Badillo, J. (2016) · TIP Revista Especializada en Ciencias Químico-Biológicas · doi:10.1016/j.recqb.2016.11.005 · Cited by 2
MicroRNA Regulation of HDL Homeostasis
Sun, X., & Feinberg, M. W. (2017) · Elsevier eBooks · doi:10.1016/b978-0-12-812513-7.00010-0 · Cited by 2
Noncoding RNAs in Cholesterol Metabolism and Atherosclerosis
Price, N. L., & Fernandez-Hernando, C. F. (2017) · Cardiac and vascular biology · doi:10.1007/978-3-319-52945-5_2 · Cited by 2
Lin, X., Xing, Y., Zhang, Y., et al. (2021) · Animal Science Journal · doi:10.1111/asj.13674 · Cited by 2
MicroRNAs in Cardiometabolic Diseases
Meiliana, A., & Wijaya, A. (2013) · The Indonesian Biomedical Journal · doi:10.18585/inabj.v5i2.55 · Cited by 2
MicroRNA-33 regulates the synaptic plasticity-related gene ARC in temporal lobe epilepsy
Xu, Y., Zhang, L., Yan, Y., Xiao, W., Zou, W., Luo, Z., Xiao, B., & Long, H. (2024) · Neuroscience Research · doi:10.1016/j.neures.2024.08.003 · Cited by 2
“Moreover, miR-33 is involved in the regulation of lipid metabolism and mitochondrial function (Gerin et al., 2010; Price and Fernandez-Hernando, 2015; Zhang et al., 2016).”
BackgroundProregenerative MicroRNAs to Repair the Damaged Heart
Olianti, C., & Giacca, M. (2025) · European Cardiology Review · doi:10.15420/ecr.2025.34 · Cited by 1
“…thus collaborating with SREBPs to elevate cellular HDL levels; 105,106 PCK1 and G6PC , thus cooperating with SREBP1 in reducing glucose production in liver cells; CROT , CPT1A , HADHB and AMPKa to reduce fatty acid β oxidation and degradation; 107 and IRS2 and SIRT6 to reduce insulin signalling.”
MicroRNAs and Cardiovascular Diseases
Henderson, J. M., Farina, F. M., & Santovito, D. (2024) · Epigenetics and human health · doi:10.1007/978-3-031-64788-8_9 · Cited by 1
Modern Transcriptomics and Small RNA Diversity
Vickers, K. C. (2015) · Elsevier eBooks · doi:10.1016/b978-0-12-799961-6.00002-0 · Cited by 1
MicroRNAs in the Pathogenesis, Diagnosis, and Treatment of Liver Disease
Madison, B., & Kerr, T. A. (2016) · Elsevier eBooks · doi:10.1016/b978-0-12-800553-8.00004-4 · Cited by 1
Interplay between Cholesterol, Srebps, Microrna-33 in Dyslipidemia
Kandhro, A. H. (2016) · INTERNATIONAL JOURNAL OF ENDORSING HEALTH SCIENCE RESEARCH (IJEHSR) · doi:10.29052/ijehsr.v4.i2.2016.05-10 · Cited by 1
Regazzi, R. (2013) · Wiley eBooks · doi:10.1002/9781118300312.ch30 · Cited by 1
Krause, C., Britsemmer, J. H., Bernecker, M., Molenaar, A., Taege, N., Geißler, C., Kaehler, M., Iben, K., Judycka, A., Wagner, J., et al. (2023) · doi:10.7554/elife.92075.1 · Cited by 1
Novel genes and regulatory systems in epididymal differentiation and sperm maturation of the mouse.
Björkgren, I. (2014) · UTUPub (University of Turku) · Cited by 1
Mulcahy, L. A., & Carter, D. R. F. (2013) · PubMed
Pisonero‐Vaquero, S. (2014) · Dialnet (Universidad de la Rioja)
miR-33 regulates cell proliferation, cell cycle progression and liver regeneration
Cirera‐Salinas, D. (2013) · edoc Publication server (Humboldt University of Berlin) · doi:10.18452/16721
microRNAs, Plasma Lipids, and Cardiovascular Disease
Dávalos, A., & Fernandez-Hernando, C. F. (2010) · Current Cardiovascular Risk Reports · doi:10.1007/s12170-010-0145-1
“... confirmed that miR-33 not only targets proteins involved in RCT, but also inhibits the translation of proteins involved in fatty acid β-oxidation, including the liver carnitine palmitoyltransferase 1A (CPT1A), the carnitine O-octanoyltransferase (CROT), and the hydroxyacyl-coenzyme A dehydrogenase/3ketoacyl-coenzy…”
BackgroundClinical and Biological Aspects of Cardiovascular microRNA
Gidlöf, O. (2013) · Lund University Publications (Lund University)
Identifying Critical Biological Effectors in Glioma Initiating Cells
Wang, H. (2012) · DukeSpace (Duke University)
Physiological effects of Type 2 diabetes on mRNA processing and gene expression
Morrison, F. S., Johnstone, K. A., & Harries, L. W. (2011) · Expert Review of Endocrinology & Metabolism · doi:10.1586/eem.10.76
Epigenetics: An Intermediary of Environmental Regulation of
Pietrzykowski, Z. (2014)
In vitro veritas: 90 years of biochemistry at Saint Louis University.
Eissenberg, J. C., & Di Cera, E. (2013) · Europe PMC (PubMed Central)
Regulation of adipogenesis and inflammation: role(s) of adipose microRNAs
Al-Jabir, M. J. M. H. (2016) · UCL Discovery (University College London)
Modulation of mir-33 and mir-122 by dietary polyphenols
Baselga‐Escudero, L. (2013) · TDX (Tesis Doctorals en Xarxa)
mTORC1 Activates SREBP-2 through Maintenance of Endosomal Cycling and Suppression of Autophagy
Eid, W. (2017) · uO Research (University of Ottawa) · doi:10.20381/ruor-20753
“…within the intron of SREBP is co-transcribed with mature SREBP-1a/2, which negatively regulate cholesterol export by down-regulating the expression of ATP-binding cassette transporter A1 (ABCA1), further maintaining cellular cholesterol homeostasis (Gerin et al. 2010; Ono 2016; Moore et al. 2011).”
BackgroundKarataş, Ö. F., & Ittmann, M. (2017) · The European Research Journal · doi:10.18621/eurj.341363
Martinelli, A. E. M. (2017) · Digital Library of Theses and Dissertations (Universidade de São Paulo) · doi:10.11606/t.5.2017.tde-07082017-084252
Chu, W. H. (2018) · Adelaide Research & Scholarship (AR&S) (University of Adelaide)
Pisonero‐Vaquero, S. (2014) · doi:10.18002/10612/4183
Koumaré, A. K., Compaore, T. R., Soudre, F. M., et al. (2019) · Advances in Biochemistry · doi:10.11648/j.ab.20190704.11
The Mechanisms of miR-638/StarD10 in HDL MetabolismPreprint
Ye, P., Wang, X.-N., Han, J., Cao, R., & Bai, Y.-Y. (2021) · Research Square · doi:10.21203/rs.3.rs-142814/v1
“miR-33b is only present in human SREBP-1 genes and plays a more important role in triglyceride synthesis and metabolism[17,18].”
BackgroundLin, X., Xing, Y., Zhang, Y., et al. (2021) · Research Square · doi:10.21203/rs.3.rs-210181/v1
“Indeed, miR-33 knockdown induces the expression of CROT, CPT1A, HADHB and AMPK, and thus promotes fatty acid oxidation [24].”
BackgroundManaging biological data in pathways and networks
Kutmon, M. (2015) · doi:10.26481/dis.20150122mk
Noncoding RNAs in liver cancer patients
Sanceau, J., & Gougèlet, A. (2022) · Elsevier eBooks · doi:10.1016/b978-0-12-824550-7.00007-2
(2018) · Wiley-VCH eBooks · doi:10.1002/9783527692903.refs
Post-transcriptional gene regulation in metabolic syndrome
Pathak, R., & Kumar, A. (2022) · Elsevier eBooks · doi:10.1016/b978-0-323-91305-8.00003-x · Cited by 1
Krause, C., Britsemmer, J. H., Bernecker, M., Molenaar, A., Taege, N., López‐Alcántara, N., Geißler, C., Kaehler, M., Iben, K., Judycka, A., et al. (2023) · bioRxiv (Cold Spring Harbor Laboratory) · doi:10.1101/2023.10.02.560594
“Target genes of miRNAs were taken from miRTarBase and TarBase [20,21] and integrated into a SQLite database and queried by a function we termed ‘miRNA Nvis’ implemented in MATLAB R2020a (The MathWorks, Natick, US).”
MethodMallén, A., Varela, C., Rotllán, N., Paloschi, V., Mäegdefessel, L., Escolá‐Gil, J. C., Aran, J. M., Navarro, E., & Hueso, M. (2024) · medRxiv · doi:10.1101/2024.03.25.24304874
Ren, J., Tian, W., Jiang, K., et al. (2021) · Figshare · doi:10.6084/m9.figshare.14759529
Ren, J., Tian, W., Jiang, K., et al. (2021) · Figshare · doi:10.6084/m9.figshare.14759538
Krause, C., Britsemmer, J. H., Bernecker, M., Molenaar, A., Taege, N., López‐Alcántara, N., Geißler, C., Kaehler, M., Iben, K., Judycka, A., et al. (2024) · doi:10.7554/elife.92075.2
Saenz‐Pipaon, G., Wacker, B. K., Bi, L., Stamatikos, A., & Dichek, D. A. (2024) · Biology · doi:10.3390/biology13120965 · Cited by 1
Smolka, C., Schlösser, D., Hohnloser, C., Bemtgen, X., Jänich, C., Schneider, L., Martin, J., Pfeifer, D., Moser, M., Hasselblatt, P., et al. (2021) · Figshare · doi:10.6084/m9.figshare.16575482
Ren, J., Tian, W., Jiang, K., et al. (2021) · Figshare · doi:10.6084/m9.figshare.14759544
Ren, J., Tian, W., Jiang, K., et al. (2021) · Figshare · doi:10.6084/m9.figshare.14759535
Smolka, C., Schlösser, D., Hohnloser, C., Bemtgen, X., Jänich, C., Schneider, L., Martin, J., Pfeifer, D., Moser, M., Hasselblatt, P., et al. (2021) · Figshare · doi:10.6084/m9.figshare.16575479
Ren, J., Tian, W., Jiang, K., et al. (2021) · Figshare · doi:10.6084/m9.figshare.14759541
Ren, J., Tian, W., Jiang, K., et al. (2021) · Figshare · doi:10.6084/m9.figshare.14759526
Ren, J., Tian, W., Jiang, K., et al. (2021) · Figshare · doi:10.6084/m9.figshare.14759532
Transcriptional Control of Lipid Metabolism
Musselman, L. P., Truong, H. G., & DiAngelo, J. R. (2024) · Advances in experimental medicine and biology · doi:10.1007/978-3-032-04842-4_808
Homéostasie des céramides et hépatopathies métaboliques
Régnier, M. (2018) · theses.fr (ABES) · doi:10.70675/2fb92711z373cz4b27z8082z7aa3f8930e63
Hardy, L. M. (2019) · theses.fr (ABES) · doi:10.70675/2f5f4b0dzc92fz4cb4z9c5bzeb6d3fd3e791
Influence du sexe dans la susceptibilité aux hépatopathies métaboliques
Smati, S. (2019) · theses.fr (ABES) · doi:10.70675/01997f55za990z41e6z96baz8221de2a6281
Habib, M. (2022) · theses.fr (ABES) · doi:10.70675/e634ffe7zc86dz4e0fzb03dz223ee5589a93
The Role of MicroRNA Networks in Alcohol-associated Liver Disease
Park, S. H., & Seo, W. (2026) · Journal of Digestive Cancer Research · doi:10.52927/jdcr.2026.14.1.67
Sportiello, P., Piccioni, M., Licciulli, F., Cananzi, G., Crispi, S., & Catalano, D. (2026) · International Journal of Molecular Sciences · doi:10.3390/ijms27094134 · Cited by 1
“Other miRNAs linked to obesity are miR-34a, involved in lipid metabolism, whose overexpression resulted in increased triglyceride accumulation [67], and miR-33, implicated in cholesterol export and the inhibition of the expression of proteins involved in fatty acid β -oxidation [68].”
Faulconnier, Y., Pires, J., Ye, T., Pawłowski, K., & Leroux, C. (2026) · Comparative Biochemistry and Physiology - Part D:Genomics and Proteomics · doi:10.1016/j.cbd.2026.101995
Understanding the microRNA signature associated with Reye’s syndrome
Puhan, A., Tripathy, S., Behera, J. K., & Bhattacharya, M. (2026) · PROTOPLASMA · doi:10.1007/s00709-026-02226-6
Citrin, K. M., Huang, Y., Ramos-Perez, A., Castellanos, C., Canfrán‐Duque, A., Zhang, X., Chaube, B., de Urturi, D. S., Gómez‐Coronado, D., Libreros, S., et al. (2026) · Atherosclerosis · doi:10.1016/j.atherosclerosis.2026.120800
Fan, T.-Y., Hsu, Y.-M., Wu, G.-H., Hsiao, J., Wang, H., & Shiah, S. (2026) · Research Square · doi:10.21203/rs.3.rs-9919677/v1
Ahmad, F., Karim, A., Kannan, M., & Qaisar, R. (2026) · Journal of Molecular Medicine · doi:10.1007/s00109-026-02704-7
“…kinases additionally reshape miRNA programs in atherosclerosis. miR-33, located within the SREBF genes and regulated by AMPK and insulin–Akt pathways, down - regulates ABCA1/ABCG1 and inhibits fatty-acid oxidation, thereby promoting lipid accumulation and advancing plaque development [62, 97 ].”
The emerging metabolic role and treatment target of CPT1A in CRC
Zhu, X., Sun, T., Yuan, J., Mao, F., Jin, T., & Yi, C. (2026) · Frontiers in Cell and Developmental Biology · doi:10.3389/fcell.2026.1881073
“…miR-33a and miR-33b, intronic microRNAs encoded within sterol regulatory element-binding protein (SREBP) genes, directly target the 3 ′ -UTR of CPT1A while coordinately repressing multiple genes involved in fatty acid β -oxidation, thereby suppressing FAO (Gerin et al., 2010; Dávalos et al., 2011).”
Uncovering a Conserved miRNA Hallmark Across Diverse SARS-CoV-2-Infected Cellular Models
Murdocca, M., Pepe, G., Latini, A., et al. (2026) · COVID · doi:10.3390/covid6080142
Ramachandran, K., Pilapil, L. A. E., & Atilla‐Gokcumen, G. E. (2026) · ACS Chemical Biology · doi:10.1021/acschembio.6c00590
Metadata
- Authors
- Gerin, I., Clerbaux, L.-A., Haumont, O., Lanthier, N., Das, A. K., Burant, C. F., Leclercq, I. A., MacDougald, O. A., & Bommer, G. T.
- Affiliations
- de Duve Institute (BE)
- UCLouvain (BE)
- Michigan Medicine (US)
- University of Michigan (US)
- Corresponding author
- Bommer, Guido T.
- ORCID
- Venue
- Journal of Biological Chemistry
- Publisher
- Elsevier BV
- Published
- 2010-10
- Volume
- 285
- Issue
- 44
- Pages
- 33652-33661
- ISSN
- 0021-9258 (ISSN-L)
- PMC
- PMC2962463
- OpenAlex
- W2012616814
- Cited by
- 382
- References
- 60
- Citations by year
- 2026: 12 · 2025: 10 · 2024: 14 · 2023: 16 · 2022: 17 · 2021: 29 · 2020: 15 · 2019: 18 · 2018: 24 · 2017: 25 · 2016: 42 · 2015: 28 · 2014: 36 · 2013: 50 · 2012: 23
- FWCI
- 29.85
- Type
- journal article
- Language
- en
- Open access
- hybrid
- doi.org
- Licence
- Locations
- Journal of Biological Chemistry (publishedVersion, cc-by)
- PubMed (publishedVersion)
- Europe PMC (PubMed Central) (submittedVersion)
- PubMed Central (submittedVersion)
- Digital Access to Libraries (submittedVersion)
- Funders
- Fonds pour la Formation à la Recherche dans l’Industrie et dans l’Agriculture
- National Institute of Diabetes and Digestive and Kidney Diseases (5P30DK089503, R01 DK051563, DK-51563, P30 DK089503)
- Michigan Nutrition Obesity Research Center, Medical School, University of Michigan
- Topics
- Life Sciences › Biochemistry, Genetics and Molecular Biology › Biochemistry › Cholesterol and Lipid Metabolism
- Life Sciences › Biochemistry, Genetics and Molecular Biology › Cancer Research › MicroRNA in disease regulation
- Life Sciences › Biochemistry, Genetics and Molecular Biology › Biochemistry › Lipid metabolism and biosynthesis
- Keywords
- miR-33, SREBP2, intronic microRNA, ABCA1, cholesterol export, fatty acid beta-oxidation, CPT1A, HADHB, lipid homeostasis, SREBP, protein synthesis inhibition
- MeSH terms
- Animals, Cholesterol, Fatty Acids, Gene Expression Regulation, Humans, Introns, Male, Mice, Inbred C57BL, Phospholipids, Lentivirus, MicroRNAs, Mice, Sterol Regulatory Element Binding Protein 2
About these checks
Registry, retraction, Cites and statistics results are computed, not judged, with one exception: a printed reference that no index lists is read once by a model before it counts as a citation error. Claims are extracted by a model and kept only when their quote appears verbatim in the text; each cited source is then checked, with a model’s help, for whether it says what the claim relies on. Those verdicts can be wrong — read the claim’s quote and the cited source before relying on one.
A language model drew the claims from the paper on 2026-10-21, under version 3 of the claim definition (model deepseek-v4.1-flash, prompt extract-v3).
A second model labelled each claim on 2026-10-21 (model jev-1.13-20260917, definition revision gold-guideline-v0.2).
Cited sources are checked with a language model’s help (gpt-6-sol).
Statistics and arithmetic are recomputed, not judged.
Confidence bands are shown only for fields calibrated on our annotated test set. None is calibrated yet, so no band is shown.
What counts as a claim ›How we measure confidence ›How we check this ›
Are you an author, or do you see a problem with this page? Request a review
