

The DOI matches its Crossref record; 120 of the 124 references it cites were found in a registry or an index; 1 of the 159 sources its claims cite were checked for support.
Trem2 promotes anti-inflammatory responses in microglia and is suppressed under pro-inflammatory conditions
Open accessPublished version of a preprint
Abstract
Genome-wide association studies have reported that, amongst other microglial genes, variants in TREM2 can profoundly increase the incidence of developing Alzheimer’s disease (AD). We have investigated the role of TREM2 in primary microglial cultures from wild type mice by using siRNA to decrease Trem2 expression, and in parallel from knock-in mice heterozygous or homozygous for the Trem2 R47H AD risk variant. The prevailing phenotype of Trem2 R47H knock-in mice was decreased expression levels of Trem2 in microglia, which resulted in decreased density of microglia in the hippocampus. Overall, primary microglia with reduced Trem2 expression, either by siRNA or from the R47H knock-in mice, displayed a similar phenotype. Comparison of the effects of decreased Trem2 expression under conditions of lipopolysaccharide (LPS) pro-inflammatory or IL-4 anti-inflammatory stimulation revealed the importance of Trem2 in driving a number of the genes up-regulated in the anti-inflammatory phenotype. RNA-seq analysis showed that IL-4 induced the expression of a program of genes including Arg1 and Ap1b1 in microglia, which showed an attenuated response to IL-4 when Trem2 expression was decreased. Genes showing a similar expression profile to Arg1 were enriched for STAT6 transcription factor recognition elements in their promoter, and Trem2 knockdown decreased levels of STAT6. LPS-induced pro-inflammatory stimulation suppressed Trem2 expression, thus preventing TREM2’s anti-inflammatory drive. Given that anti-inflammatory signaling is associated with tissue repair, understanding the signaling mechanisms downstream of Trem2 in coordinating the pro- and anti-inflammatory balance of microglia, particularly mediating effects of the IL-4-regulated anti-inflammatory pathway, has important implications for fighting neurodegenerative disease.
Overview
AI snapshot
Written from the paper’s full text.
TL;DR
Trem2 loss, via siRNA knockdown or the Trem2 R47H knock-in mouse, reduces microglial density/CD68 and impairs IL-4-driven anti-inflammatory gene expression, partly by lowering STAT6. Pro-inflammatory LPS strongly suppresses Trem2 expression, which may limit TREM2’s anti-inflammatory support.
Key findings
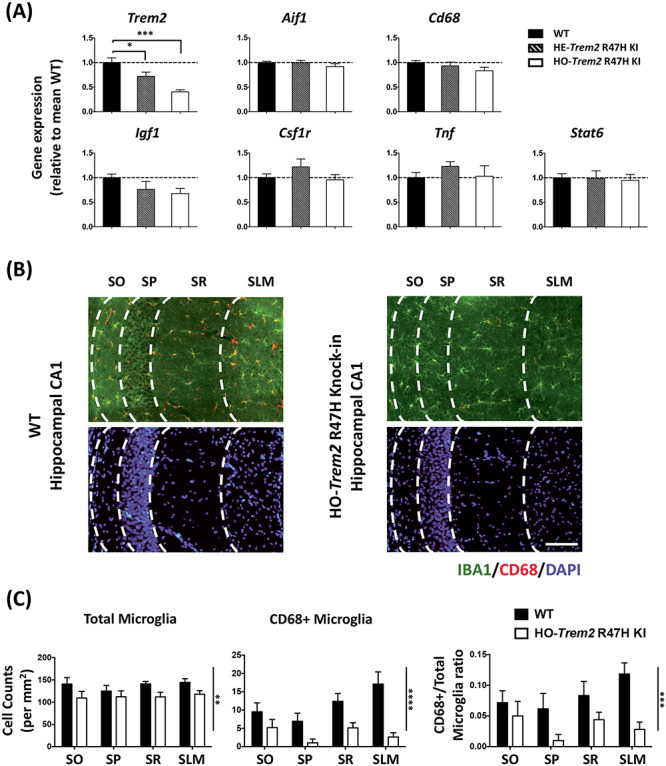
- In 4-month-old homozygous Trem2 R47H KI mice, hippocampal CA1 microglial density was decreased (two-way ANOVA main effect of genotype P < 0.01), CD68-positive microglia were decreased (P < 0.0001), and the proportion of CD68-positive microglia was lower (P < 0.001).
- Acute Trem2 siRNA (sequence 2, ~80% knockdown; sequence 3, 50–60%) reduced phagocytosis of E. coli by 48.1 ± 9.1%, and Trem2 R47H KI microglia showed more apoptosis (14.6% Annexin V-positive/PI-negative) than WT (7.3%).
- LPS suppressed Trem2 expression by more than 85% by 24 h; Trem2 knockdown had little additional effect on LPS-induced Tnf or Il1b.
- IL-4 induced anti-inflammatory genes including Arg1; this response was attenuated with reduced Trem2 (Arg1 one-way ANOVA P = 0.002; WT vs homozygous P = 0.01). Trem2 knockdown decreased total STAT6 protein (two-way ANOVA main effect P < 0.0001) and AKT phosphorylation at Thr308 (P < 0.01) and Ser473 (P < 0.05). RNA-seq found 311 genes decreased and 408 increased in Trem2 R47H KI microglia (DESeq2 FDR < 0.05), and 184 increased/83 decreased with IL-4 (FDR < 0.05).
Methods
- Primary microglial cultures from WT and Trem2 R47H KI mice were used with siRNA-mediated Trem2 knockdown, LPS (1 μg/ml) or IL-4 (20 ng/ml) treatment, plus hippocampal histology from 4-month-old mice.
- Main assays included RT-qPCR, RNA-seq, ELISA, western blot, phagocytosis, Annexin V/PI flow cytometry, and immunohistochemistry.
- RNA-seq analysis used DESeq2 (FDR < 0.05), WGCNA co-expression networks, and i-cisTarget promoter motif enrichment; statistics used ANOVA with Sidak’s post hoc tests, t-tests, and Fisher’s exact test where appropriate.
Limitations
- The paper states that the Trem2 R47H KI mouse’s reduced Trem2 expression is due to a mouse-specific splicing effect not seen in humans, so the study can conclude little about the R47H mutation itself and mainly models Trem2 loss of function.
- The paper states that in vitro LPS/IL-4 polarization may not reflect in vivo microglial activation, which involves mixed cues and single-cell heterogeneity; young Trem2 R47H mice also showed no differences in the studied genes in hippocampal homogenates.
- Evident from the text: findings rely heavily on primary mouse microglial cultures, hippocampal tissue gene expression is diluted by non-microglial cells, and some cell death occurred in culture.
Model-written summary. Check it against the paper before relying on it.
Integrity signals
Registry
Cites
Statistics
Figures
Verification
Claims the paper makes
66 Own result · 56 Not checked yet · 41 Own interpretation · 15 Own method · 3 No basis given · 1 Supported
A result the paper reports from its own data — it cites no other source for it, so there is none to check. The quote shows it is in the paper.
In the paper
“Interestingly, we also observed a significant decrease of CD68 positive microglia in the homozygous Trem2 R47H mice (two-way ANOVA: main effect of genotype P < 0.0001).”
§ Trem2 promotes anti-inflammatory responses in microglia and is suppressed under pro-inflammatory conditions > Results > Decreased microglial density and down-regulated Trem2 expression in the hippocampus of Trem2 R47H knock-in mice
plaincorrelational- Asserted: passes — The authors put it forward as true.
- Checkable: passes — It can be checked against evidence.
- Load-bearing: unclear — It is unclear whether the paper’s conclusions depend on it.
- Based: passes — The paper gives a reason why it holds.
A result the paper reports from its own data — it cites no other source for it, so there is none to check. The quote shows it is in the paper.
In the paper
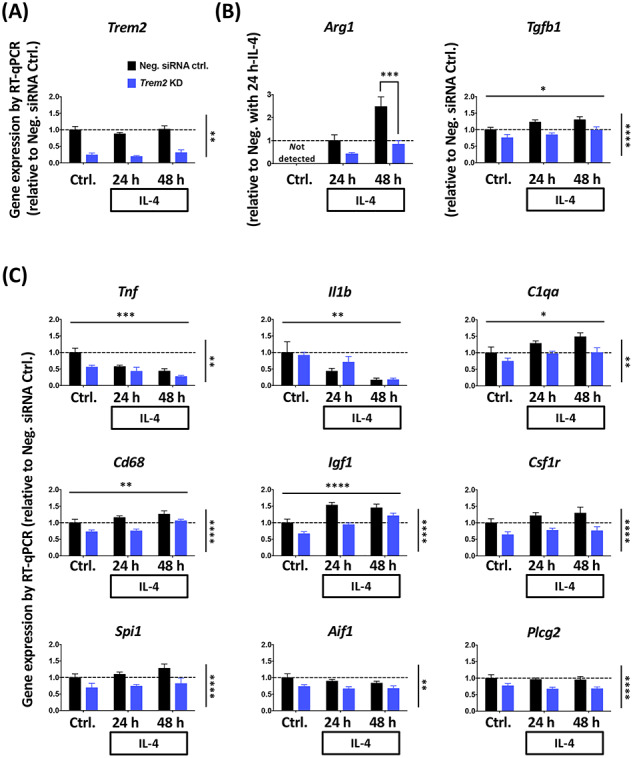
“Overall, acute Trem2 knockdown produced a significant change in the gene expression profile of microglia under non-stimulated conditions, which might result in a shift of the microglial functional phenotype.”
§ Trem2 promotes anti-inflammatory responses in microglia and is suppressed under pro-inflammatory conditions > Results > Reduced Trem2 causes transcriptional changes in primary microglia
plaindirect- Asserted: passes — The authors put it forward as true.
- Checkable: passes — It can be checked against evidence.
- Load-bearing: passes — The paper’s conclusions depend on it.
- Based: passes — The paper gives a reason why it holds.
The paper states this without a source or data behind it here, so there is nothing to check it against. The quote shows it is in the paper.
In the paper
“As expected, considering so little Trem2 remained under these conditions, knockdown of Trem2 by siRNA had little effect on LPS-induced gene expression with up-regulation of Tnf or Il1b being unchanged at the transcriptional level with Trem2 knockdown compared with control cultures (Supplementary Material, Fig. S6).”
§ Trem2 promotes anti-inflammatory responses in microglia and is suppressed under pro-inflammatory conditions > Results > LPS stimulation dramatically suppresses Trem2 gene expression in primary microglia
plain- Asserted: passes — The authors put it forward as true.
- Checkable: passes — It can be checked against evidence.
- Load-bearing: passes — The paper’s conclusions depend on it.
- Based: passes — The paper gives a reason why it holds.
A result the paper reports from its own data — it cites no other source for it, so there is none to check. The quote shows it is in the paper.
In the paper
“We found that microglia with Trem2 knockdown showed a significant reduction (48.1 ± 9.1%) of phagocytosis of Escherichia coli, conjugated to pHrodo (a pH-sensitive fluorescent dye), compared with the non-targeting siRNA treated microglia (Supplementary Material, Fig. S4), confirming previous reports and further validating this cell system.”
§ Trem2 promotes anti-inflammatory responses in microglia and is suppressed under pro-inflammatory conditions > Results > Acute Trem2 knockdown in primary microglia is effective and impairs phagocytosis, validating the preparation
plaindirect- Asserted: passes — The authors put it forward as true.
- Checkable: passes — It can be checked against evidence.
- Load-bearing: passes — The paper’s conclusions depend on it.
- Based: passes — The paper gives a reason why it holds.
A result the paper reports from its own data — it cites no other source for it, so there is none to check. The quote shows it is in the paper.
In the paper
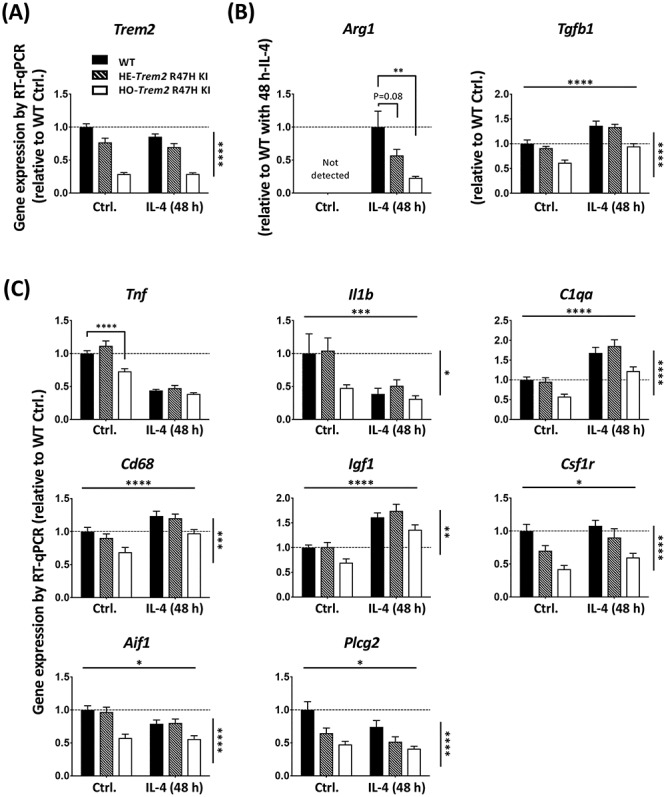
“Similarly to the Trem2 knockdown experiments, genes for which expression was increased in response to IL-4, such as Igf1, Cd68 and C1qa, also showed decreased expression in the homozygous Trem2 R47H microglia, regardless of IL-4-treatment (Fig. 5C; two-way ANOVA: main effect of IL-4-treatment, and main effect of Trem2 genotype, but no interaction for Igf1, Cd68 and C1qa).”
§ Trem2 promotes anti-inflammatory responses in microglia and is suppressed under pro-inflammatory conditions > Results > Trem2 is involved in microglial anti-inflammatory responses with IL-4
plaincorrelational- Asserted: passes — The authors put it forward as true.
- Checkable: passes — It can be checked against evidence.
- Load-bearing: passes — The paper’s conclusions depend on it.
- Based: passes — The paper gives a reason why it holds.
A result the paper reports from its own data — it cites no other source for it, so there is none to check. The quote shows it is in the paper.
In the paper
“Expression of Csf1r, Spi1, Aif1 and Plcg2 were unaffected by IL-4 treatment.”
§ Trem2 promotes anti-inflammatory responses in microglia and is suppressed under pro-inflammatory conditions > Results > Trem2 is involved in microglial anti-inflammatory responses with IL-4
plain- Asserted: passes — The authors put it forward as true.
- Checkable: passes — It can be checked against evidence.
- Load-bearing: unclear — It is unclear whether the paper’s conclusions depend on it.
- Based: passes — The paper gives a reason why it holds.
A result the paper reports from its own data — it cites no other source for it, so there is none to check. The quote shows it is in the paper.
In the paper
“As expected, the anti-inflammatory IL-4 treatment decreased expression of pro-inflammatory marker genes Tnf and Il1b (two-way ANOVA: main effect of IL-4 treatment, P < 0.001 for Tnf, and P < 0.01 for Il1b).”
§ Trem2 promotes anti-inflammatory responses in microglia and is suppressed under pro-inflammatory conditions > Results > Trem2 is involved in microglial anti-inflammatory responses with IL-4
plaindirect- Asserted: passes — The authors put it forward as true.
- Checkable: passes — It can be checked against evidence.
- Load-bearing: unclear — It is unclear whether the paper’s conclusions depend on it.
- Based: passes — The paper gives a reason why it holds.
None of the sources cited for this claim have been checked yet.
In the paper
“Expression of C1qa, Cd68 and Igf1 were all found to be significantly up-regulated with IL-4 treatment, which is similar to what we saw in transgenic mice in correlation with amyloid plaque load (43,44) (www.mouseac.org).”
§ Trem2 promotes anti-inflammatory responses in microglia and is suppressed under pro-inflammatory conditions > Results > Trem2 is involved in microglial anti-inflammatory responses with IL-4
What the sources say
- Not checked yetcites [43] Matarin, 2015, A genome-wide gene-expression analysis and database in transgenic mice during development of amyloid or tau pathology, Cell Rep. source
- Not checked yetcites [44] Salih, 2019, Genetic variability in response to amyloid beta deposition influences Alzheimer's disease risk, Brain Commun. source
plaindirect- Asserted: passes — The authors put it forward as true.
- Checkable: passes — It can be checked against evidence.
- Load-bearing: passes — The paper’s conclusions depend on it.
- Based: passes — The paper gives a reason why it holds.
None of the sources cited for this claim have been checked yet.
In the paper
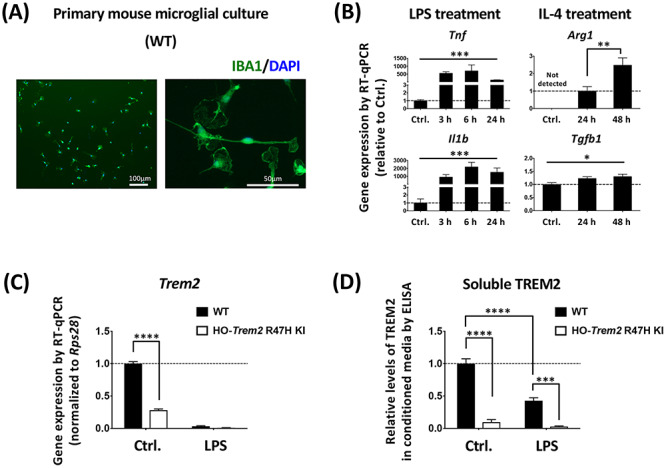
“We first found that, in both the WT and Trem2 R47H KI cells, LPS treatment strongly down-regulated Trem2 expression (Fig. 3C and Supplementary Material, Fig. S6), which was consistent with the previous findings in a variety of cell preparations (16,42).”
§ Trem2 promotes anti-inflammatory responses in microglia and is suppressed under pro-inflammatory conditions > Results > LPS stimulation dramatically suppresses Trem2 gene expression in primary microglia
What the sources say
- Not checked yetcites [16] Schmid, 2002, Heterogeneous expression of the triggering receptor expressed on myeloid cells-2 on adult murine microglia, J. Neurochem. source
- Not checked yetcites [42] Owens, 2017, Divergent Neuroinflammatory regulation of microglial TREM expression and involvement of NF-kappaB, Front. Cell. Neurosci.
boosteddirect- Asserted: passes — The authors put it forward as true.
- Checkable: passes — It can be checked against evidence.
- Load-bearing: passes — The paper’s conclusions depend on it.
- Based: passes — The paper gives a reason why it holds.
A result the paper reports from its own data — it cites no other source for it, so there is none to check. The quote shows it is in the paper.
In the paper
“Overall, at 4 months of age, a number of genes did not show any significant difference in the hippocampus of the Trem2 R47H KI mice compared with WT littermates (Fig. 1A).”
§ Trem2 promotes anti-inflammatory responses in microglia and is suppressed under pro-inflammatory conditions > Results > Decreased microglial density and down-regulated Trem2 expression in the hippocampus of Trem2 R47H knock-in mice
plain- Asserted: passes — The authors put it forward as true.
- Checkable: passes — It can be checked against evidence.
- Load-bearing: unclear — It is unclear whether the paper’s conclusions depend on it.
- Based: passes — The paper gives a reason why it holds.
- Probably not a substantial claim. 29
- It may state two separate claims as one. 62
Every source the paper cites for this claim was checked and supports it.
In the paper
“ITGAX-positive microglia are a source of Igf1 expression (59).”
§ Trem2 promotes anti-inflammatory responses in microglia and is suppressed under pro-inflammatory conditions > Discussion > Trem2 supports an anti-inflammatory program of gene expression by IL-4 stimulation in part by promoting levels of the transcription factor STAT6
What the sources say
- Supportedcites [59] Butovsky, 2018, Microglial signatures and their role in health and disease, Nat. Rev. Neurosci. source
The Neurogenesis section states that an ITGAX-expressing microglial subset was identified as a source of IGF1 in the developing brain. This directly supports the claim, with the developing-brain context noted. (LLM, conf=0.94)
plaincorrelational- Asserted: passes — The authors put it forward as true.
- Checkable: passes — It can be checked against evidence.
- Load-bearing: fails — The paper’s conclusions may not depend on it.
- Based: passes — The paper gives a reason why it holds.
Probably not a substantial claim. The paper’s conclusions may not depend on it.
- Supported
A result the paper reports from its own data — it cites no other source for it, so there is none to check. The quote shows it is in the paper.
In the paper
“In addition, the soluble TREM2 protein level in the conditioned medium in response to LPS was decreased for the microglia from the WT littermates (Fig. 3D), and the level of TREM2 protein in the medium conditioned by cells from the homozygous Trem2 R47H KI mice was also decreased, supporting the transcriptional findings.”
§ Trem2 promotes anti-inflammatory responses in microglia and is suppressed under pro-inflammatory conditions > Results > LPS stimulation dramatically suppresses Trem2 gene expression in primary microglia
plaindirect- Asserted: passes — The authors put it forward as true.
- Checkable: passes — It can be checked against evidence.
- Load-bearing: passes — The paper’s conclusions depend on it.
- Based: passes — The paper gives a reason why it holds.
It may state two separate claims as one.
A result the paper reports from its own data — it cites no other source for it, so there is none to check. The quote shows it is in the paper.
In the paper
“Similar results were seen in microglia from the homozygous Trem2 R47H KI mice with no substantial change to Tnf expression but a decrease in Il1b expression (Supplementary Material, Fig. S7).”
§ Trem2 promotes anti-inflammatory responses in microglia and is suppressed under pro-inflammatory conditions > Results > LPS stimulation dramatically suppresses Trem2 gene expression in primary microglia
plaindirect- Asserted: passes — The authors put it forward as true.
- Checkable: passes — It can be checked against evidence.
- Load-bearing: unclear — It is unclear whether the paper’s conclusions depend on it.
- Based: passes — The paper gives a reason why it holds.
It may state two separate claims as one.
A result the paper reports from its own data — it cites no other source for it, so there is none to check. The quote shows it is in the paper.
In the paper
“The other anti-inflammatory marker Tgfb1 was significantly decreased in homozygous Trem2 R47H microglia independent of IL-4-treatment, and the fold-change in Tgfb1 up-regulation in response to treatment was similar for WT and homozygous Trem2 R47H cells (Fig. 5B).”
§ Trem2 promotes anti-inflammatory responses in microglia and is suppressed under pro-inflammatory conditions > Results > Trem2 is involved in microglial anti-inflammatory responses with IL-4
plaindirect- Asserted: passes — The authors put it forward as true.
- Checkable: passes — It can be checked against evidence.
- Load-bearing: passes — The paper’s conclusions depend on it.
- Based: passes — The paper gives a reason why it holds.
It may state two separate claims as one.
A result the paper reports from its own data — it cites no other source for it, so there is none to check. The quote shows it is in the paper.
In the paper
“Arg1 expression was undetectable in our non-stimulated microglia, but reached levels well above detection threshold at 24 h after IL-4 treatment, and by 48 h expression levels had further doubled.”
§ Trem2 promotes anti-inflammatory responses in microglia and is suppressed under pro-inflammatory conditions > Results > Primary microglial cultures with acute Trem2 knockdown and reduced Trem2 expression in Trem2 R47H microglia
plaindirect- Asserted: passes — The authors put it forward as true.
- Checkable: passes — It can be checked against evidence.
- Load-bearing: unclear — It is unclear whether the paper’s conclusions depend on it.
- Based: passes — The paper gives a reason why it holds.
It may state two separate claims as one.
A result the paper reports from its own data — it cites no other source for it, so there is none to check. The quote shows it is in the paper.
In the paper
“Consistent with the transcriptional results, the protein level of TNF-alpha released from the microglial cells showed that LPS strongly up-regulated TNF-alpha, but there was no significant change caused by Trem2 knockdown (Supplementary Material, Fig. S6).”
§ Trem2 promotes anti-inflammatory responses in microglia and is suppressed under pro-inflammatory conditions > Results > LPS stimulation dramatically suppresses Trem2 gene expression in primary microglia
boosteddirect- Asserted: passes — The authors put it forward as true.
- Checkable: passes — It can be checked against evidence.
- Load-bearing: unclear — It is unclear whether the paper’s conclusions depend on it.
- Based: passes — The paper gives a reason why it holds.
It may state two separate claims as one.
A result the paper reports from its own data — it cites no other source for it, so there is none to check. The quote shows it is in the paper.
In the paper
“The Tgfb1 expression also showed an increase with IL-4 stimulation, however, in contrast to Arg1 the effect of Trem2 knockdown and IL-4 showed no interaction.”
§ Trem2 promotes anti-inflammatory responses in microglia and is suppressed under pro-inflammatory conditions > Results > Trem2 is involved in microglial anti-inflammatory responses with IL-4
plaindirect- Asserted: passes — The authors put it forward as true.
- Checkable: passes — It can be checked against evidence.
- Load-bearing: unclear — It is unclear whether the paper’s conclusions depend on it.
- Based: passes — The paper gives a reason why it holds.
It may state two separate claims as one.
A result the paper reports from its own data — it cites no other source for it, so there is none to check. The quote shows it is in the paper.
In the paper
“Interestingly, the expression of all of these genes was significantly lower in cells with acute Trem2 knockdown, and was not dependent on IL-4 stimulation (no significant interaction of knockdown versus IL-4).”
§ Trem2 promotes anti-inflammatory responses in microglia and is suppressed under pro-inflammatory conditions > Results > Trem2 is involved in microglial anti-inflammatory responses with IL-4
plaindirect- Asserted: passes — The authors put it forward as true.
- Checkable: passes — It can be checked against evidence.
- Load-bearing: passes — The paper’s conclusions depend on it.
- Based: passes — The paper gives a reason why it holds.
It may state two separate claims as one.
A result the paper reports from its own data — it cites no other source for it, so there is none to check. The quote shows it is in the paper.
In the paper
“Upon IL-4 treatment, Arg1 expression showed a time-dependent up-regulation, however, this up-regulation was considerably decreased in the Trem2 knockdown group (two-way ANOVA: interaction between main effects of Trem2 knockdown and IL-4 treatment time, P = 0.05; Sidak’s multiple comparisons: significant difference between the Trem2 knockdown group and the control at 48 h post IL-4 treatment, P < 0”
§ Trem2 promotes anti-inflammatory responses in microglia and is suppressed under pro-inflammatory conditions > Results > Trem2 is involved in microglial anti-inflammatory responses with IL-4
plaindirect- Asserted: passes — The authors put it forward as true.
- Checkable: passes — It can be checked against evidence.
- Load-bearing: passes — The paper’s conclusions depend on it.
- Based: passes — The paper gives a reason why it holds.
It may state two separate claims as one.
A result the paper reports from its own data — it cites no other source for it, so there is none to check. The quote shows it is in the paper.
In the paper
“Our findings were similar in the microglia from the Trem2 R47H KI mice, with Arg1 showing a strong induction by IL-4 treatment and the down-regulation of Trem2 in the microglia from Trem2 R47H KI mice significantly preventing this change in a gene dose-dependent manner (Fig. 5B, one-way ANOVA: P = 0.002, Sidak’s multiple comparisons: P = 0.08 for WT versus heterozygous, and P = 0.01 for WT versus”
§ Trem2 promotes anti-inflammatory responses in microglia and is suppressed under pro-inflammatory conditions > Results > Trem2 is involved in microglial anti-inflammatory responses with IL-4
boosteddirect- Asserted: passes — The authors put it forward as true.
- Checkable: passes — It can be checked against evidence.
- Load-bearing: passes — The paper’s conclusions depend on it.
- Based: passes — The paper gives a reason why it holds.
It may state two separate claims as one.
A result the paper reports from its own data — it cites no other source for it, so there is none to check. The quote shows it is in the paper.
In the paper
“This change was not primarily due to the total microglia number change because the proportion of CD68 positive microglia also showed a substantial decrease (two-way ANOVA: main effect of genotype P < 0.001; Fig. 1B and C).”
§ Trem2 promotes anti-inflammatory responses in microglia and is suppressed under pro-inflammatory conditions > Results > Decreased microglial density and down-regulated Trem2 expression in the hippocampus of Trem2 R47H knock-in mice
plaincorrelational- Asserted: passes — The authors put it forward as true.
- Checkable: passes — It can be checked against evidence.
- Load-bearing: passes — The paper’s conclusions depend on it.
- Based: passes — The paper gives a reason why it holds.
It may state two separate claims as one.
A result the paper reports from its own data — it cites no other source for it, so there is none to check. The quote shows it is in the paper.
In the paper
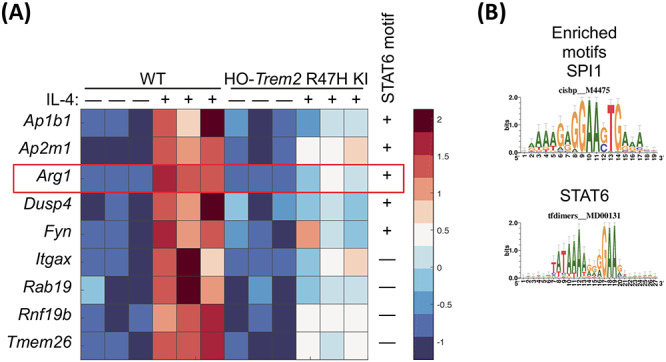
“RNA-seq analysis showed that IL-4 induced the expression of a program of genes including Arg1 and Ap1b1 in microglia, which showed an attenuated response to IL-4 when Trem2 expression was decreased.”
§ Trem2 promotes anti-inflammatory responses in microglia and is suppressed under pro-inflammatory conditions > Abstract
plaindirect- Asserted: passes — The authors put it forward as true.
- Checkable: passes — It can be checked against evidence.
- Load-bearing: passes — The paper’s conclusions depend on it.
- Based: passes — The paper gives a reason why it holds.
It may state two separate claims as one.
A result the paper reports from its own data — it cites no other source for it, so there is none to check. The quote shows it is in the paper.
In the paper
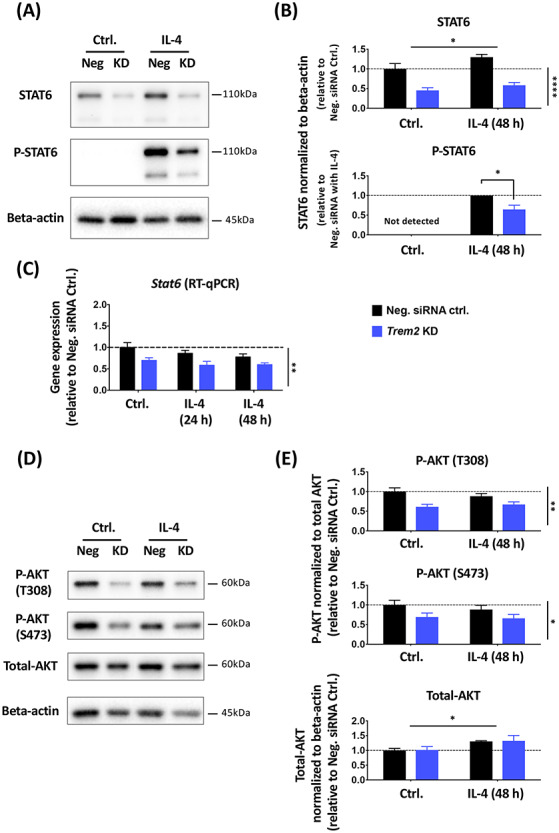
“IL-4 caused robust phosphorylation of STAT6, with phosphorylated STAT6 not detectable in the absence of IL-4 but clearly measurable 48 h after IL-4 treatment.”
§ Trem2 promotes anti-inflammatory responses in microglia and is suppressed under pro-inflammatory conditions > Results > TREM2 is involved in maintaining normal STAT6 levels in microglia
boosteddirect- Asserted: passes — The authors put it forward as true.
- Checkable: passes — It can be checked against evidence.
- Load-bearing: unclear — It is unclear whether the paper’s conclusions depend on it.
- Based: passes — The paper gives a reason why it holds.
It may state two separate claims as one.
A result the paper reports from its own data — it cites no other source for it, so there is none to check. The quote shows it is in the paper.
In the paper
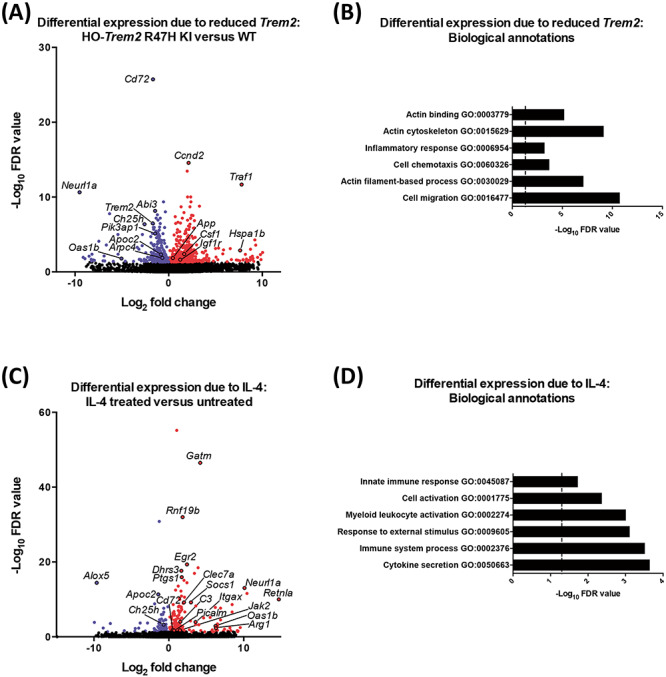
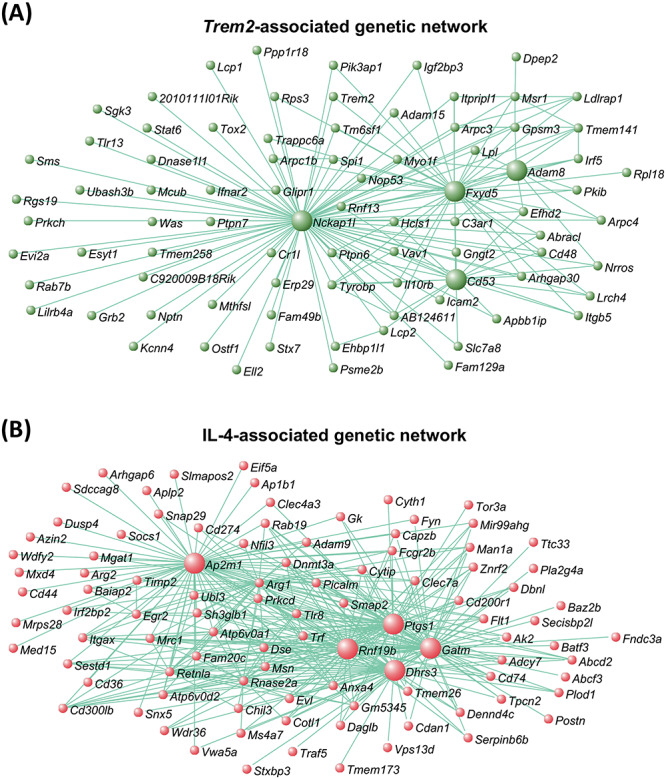
“While there was an overlap of genotype and IL-4 affecting common genes (such as Arg1), we also saw that Trem2 and IL-4 had independent effects. Thus, the strong drive of Trem2 R47H KI genotype and IL-4 meant there was no module that was significant for both genotype and IL-4 treatment.”
§ Trem2 promotes anti-inflammatory responses in microglia and is suppressed under pro-inflammatory conditions > Results > Gene expression profiles regulated by TREM2 and IL-4
plain- Asserted: passes — The authors put it forward as true.
- Checkable: passes — It can be checked against evidence.
- Load-bearing: unclear — It is unclear whether the paper’s conclusions depend on it.
- Based: passes — The paper gives a reason why it holds.
It may state two separate claims as one.
A result the paper reports from its own data — it cites no other source for it, so there is none to check. The quote shows it is in the paper.
In the paper
“both manipulations displayed strong effects on gene expression.”
§ Trem2 promotes anti-inflammatory responses in microglia and is suppressed under pro-inflammatory conditions > Results > Gene expression profiles regulated by TREM2 and IL-4
boostedcorrelational- Asserted: passes — The authors put it forward as true.
- Checkable: passes — It can be checked against evidence.
- Load-bearing: unclear — It is unclear whether the paper’s conclusions depend on it.
- Based: passes — The paper gives a reason why it holds.
It may state two separate claims as one.
A result the paper reports from its own data — it cites no other source for it, so there is none to check. The quote shows it is in the paper.
In the paper
“Genes showing increased expression in the Trem2 R47H KI microglia included App (amyloid precursor protein), Hspa1b (heat-shock 70 kDa protein 1B) and Ccnd2 (cyclin D2) (408 genes with increased expression, DESeq2 FDR < 0.05; Fig. 6A; Supplementary Material, Table S2).”
§ Trem2 promotes anti-inflammatory responses in microglia and is suppressed under pro-inflammatory conditions > Results > Gene expression profiles regulated by TREM2 and IL-4
plaincorrelational- Asserted: passes — The authors put it forward as true.
- Checkable: passes — It can be checked against evidence.
- Load-bearing: passes — The paper’s conclusions depend on it.
- Based: passes — The paper gives a reason why it holds.
It may state two separate claims as one.
A result the paper reports from its own data — it cites no other source for it, so there is none to check. The quote shows it is in the paper.
In the paper
“Igf1 expression was also decreased when Trem2 expression was knocked-down or if the Trem2 R47H variant was carried by the primary microglial cultures.”
§ Trem2 promotes anti-inflammatory responses in microglia and is suppressed under pro-inflammatory conditions > Discussion > siRNA-induced knockdown of Trem2 largely mimics the Trem2 R47H phenotype in non-stimulated conditions
plaindirect- Asserted: passes — The authors put it forward as true.
- Checkable: passes — It can be checked against evidence.
- Load-bearing: passes — The paper’s conclusions depend on it.
- Based: passes — The paper gives a reason why it holds.
It may state two separate claims as one.
A result the paper reports from its own data — it cites no other source for it, so there is none to check. The quote shows it is in the paper.
In the paper
“the total AKT protein level was not significantly affected by Trem2 knockdown, although there was a slight increase in AKT levels in response to IL-4 treatment.”
§ Trem2 promotes anti-inflammatory responses in microglia and is suppressed under pro-inflammatory conditions > Results > TREM2 is involved in maintaining normal STAT6 levels in microglia
plain- Asserted: passes — The authors put it forward as true.
- Checkable: passes — It can be checked against evidence.
- Load-bearing: passes — The paper’s conclusions depend on it.
- Based: passes — The paper gives a reason why it holds.
It may state two separate claims as one.
A result the paper reports from its own data — it cites no other source for it, so there is none to check. The quote shows it is in the paper.
In the paper
“we saw a decrease in the density of microglia in vivo in the hippocampus, and that the remaining microglia had dramatically reduced CD68 protein levels.”
§ Trem2 promotes anti-inflammatory responses in microglia and is suppressed under pro-inflammatory conditions > Discussion > Trem2 R47H knock-in mice can largely be considered a model of in vivo Trem2 down-regulation
plaincorrelational- Asserted: passes — The authors put it forward as true.
- Checkable: passes — It can be checked against evidence.
- Load-bearing: passes — The paper’s conclusions depend on it.
- Based: passes — The paper gives a reason why it holds.
It may state two separate claims as one.
None of the sources cited for this claim have been checked yet.
In the paper
“Our findings, in line with previous studies (59,68–71), show that Igf1 expression is inhibited by pro-inflammatory stimuli and enhanced in anti-inflammatory environments.”
§ Trem2 promotes anti-inflammatory responses in microglia and is suppressed under pro-inflammatory conditions > Discussion > siRNA-induced knockdown of Trem2 largely mimics the Trem2 R47H phenotype in non-stimulated conditions
What the sources say
- Not checked yetcites [59] Butovsky, 2018, Microglial signatures and their role in health and disease, Nat. Rev. Neurosci. source
- Not checked yetcites [68] Arkins, 1995, Interferon-gamma inhibits macrophage insulin-like growth factor-I synthesis at the transcriptional level, Mol. Endocrinol.
- Not checked yetcites [69] Suh, 2013, Insulin-like growth factor 1 and 2 (IGF1, IGF2) expression in human microglia: differential regulation by inflammatory mediators, J. Neuroinflammation source
- Not checked yetcites [70] Wynes, 2003, Induction of macrophage insulin-like growth factor-I expression by the Th2 cytokines IL-4 and IL-13, J. Immunol. source
- Not checked yetcites [71] Barrett, 2015, Involvement of IGF-1 and Akt in M1/M2 activation state in bone marrow-derived macrophages, Exp. Cell Res. source
plaindirect- Asserted: passes — The authors put it forward as true.
- Checkable: passes — It can be checked against evidence.
- Load-bearing: passes — The paper’s conclusions depend on it.
- Based: passes — The paper gives a reason why it holds.
It may state two separate claims as one.
A result the paper reports from its own data — it cites no other source for it, so there is none to check. The quote shows it is in the paper.
In the paper
“In hippocampal homogenates from young adult Trem2 R47H mice, we did not see differences in expression of the genes we studied, including Stat6 and Igf1, despite a slight but significant reduction in the number of microglia.”
§ Trem2 promotes anti-inflammatory responses in microglia and is suppressed under pro-inflammatory conditions > Discussion > Trem2 supports an anti-inflammatory program of gene expression by IL-4 stimulation in part by promoting levels of the transcription factor STAT6
plain- Asserted: passes — The authors put it forward as true.
- Checkable: passes — It can be checked against evidence.
- Load-bearing: passes — The paper’s conclusions depend on it.
- Based: passes — The paper gives a reason why it holds.
It may state two separate claims as one.
A result the paper reports from its own data — it cites no other source for it, so there is none to check. The quote shows it is in the paper.
In the paper
“In the presence of LPS, decrease in expression of Trem2 began as early as 3 h after LPS application and reached more than an 85% decrease by 24 h.”
§ Trem2 promotes anti-inflammatory responses in microglia and is suppressed under pro-inflammatory conditions > Discussion > Pro-inflammatory stimuli prevent the effects of TREM2 by inhibiting its expression, similar to the effect seen in microglia from Trem2 R47H KI mice
plaindirect- Asserted: passes — The authors put it forward as true.
- Checkable: passes — It can be checked against evidence.
- Load-bearing: passes — The paper’s conclusions depend on it.
- Based: passes — The paper gives a reason why it holds.
It may state two separate claims as one.
A result the paper reports from its own data — it cites no other source for it, so there is none to check. The quote shows it is in the paper.
In the paper
“In contrast to IL-4 stimulation, which had little effect on Trem2 expression, LPS largely suppressed Trem2.”
§ Trem2 promotes anti-inflammatory responses in microglia and is suppressed under pro-inflammatory conditions > Discussion > Pro-inflammatory stimuli prevent the effects of TREM2 by inhibiting its expression, similar to the effect seen in microglia from Trem2 R47H KI mice
plaindirect- Asserted: passes — The authors put it forward as true.
- Checkable: passes — It can be checked against evidence.
- Load-bearing: passes — The paper’s conclusions depend on it.
- Based: passes — The paper gives a reason why it holds.
It may state two separate claims as one.
A conclusion the paper draws from its own results — it cites no other source for it, so there is none to check. The quote shows it is in the paper.
In the paper
“These findings suggest that separate mechanisms regulate basal levels of some genes like Tgfb1 (which may be Trem2-dependent at least in part), compared with mechanisms that regulate levels following induction (which can be Trem2-independent).”
§ Trem2 promotes anti-inflammatory responses in microglia and is suppressed under pro-inflammatory conditions > Results > Trem2 is involved in microglial anti-inflammatory responses with IL-4
hedgedconditional- Asserted: passes — The authors put it forward as true.
- Checkable: passes — It can be checked against evidence.
- Load-bearing: passes — The paper’s conclusions depend on it.
- Based: passes — The paper gives a reason why it holds.
It may state two separate claims as one.
What the paper did — it cites no source for this, so there is none to check. The quote shows it is in the paper.
In the paper
“It is important to note that in the hippocampal tissue, the gene expression in microglia is greatly diluted by the much greater contribution of other cell types and so small changes in gene expression will be much more difficult to detect than in enriched microglia.”
§ Trem2 promotes anti-inflammatory responses in microglia and is suppressed under pro-inflammatory conditions > Results > Decreased microglial density and down-regulated Trem2 expression in the hippocampus of Trem2 R47H knock-in mice
plaindirect- Asserted: passes — The authors put it forward as true.
- Checkable: passes — It can be checked against evidence.
- Load-bearing: passes — The paper’s conclusions depend on it.
- Based: passes — The paper gives a reason why it holds.
Probably not a substantial claim.
A conclusion the paper draws from its own results — it cites no other source for it, so there is none to check. The quote shows it is in the paper.
In the paper
“This suggests that pro-inflammatory conditions inhibit microglial Trem2 expression, which might result in a state of temporary or chronic ‘TREM2-deficiency’ in microglia.”
§ Trem2 promotes anti-inflammatory responses in microglia and is suppressed under pro-inflammatory conditions > Results > LPS stimulation dramatically suppresses Trem2 gene expression in primary microglia
hedgedconditional- Asserted: passes — The authors put it forward as true.
- Checkable: passes — It can be checked against evidence.
- Load-bearing: passes — The paper’s conclusions depend on it.
- Based: passes — The paper gives a reason why it holds.
It may state two separate claims as one.
A conclusion the paper draws from its own results — it cites no other source for it, so there is none to check. The quote shows it is in the paper.
In the paper
“TREM2 promotes an anti-inflammatory response via two mechanisms: (i) an IL-4 independent mechanism supporting the expression of common genes, such as Igf1, Cd68 and C1qa, which are induced by IL-4 in control cells and suppressed by Trem2 reduction, but there is lack of interaction between the effects of Trem2 and IL-4 on these genes, and so here TREM2 and IL-4 likely act via independent parallel”
§ Trem2 promotes anti-inflammatory responses in microglia and is suppressed under pro-inflammatory conditions > Results > Trem2 is involved in microglial anti-inflammatory responses with IL-4
hedgeddirect- Asserted: passes — The authors put it forward as true.
- Checkable: passes — It can be checked against evidence.
- Load-bearing: passes — The paper’s conclusions depend on it.
- Based: passes — The paper gives a reason why it holds.
It may state two separate claims as one.
A conclusion the paper draws from its own results — it cites no other source for it, so there is none to check. The quote shows it is in the paper.
In the paper
“(ii) an IL-4-dependent mechanism where the gene expression response to IL-4 depends on TREM2, genes such as Arg1, where there is a significant interaction between the effects of Trem2 and IL-4.”
§ Trem2 promotes anti-inflammatory responses in microglia and is suppressed under pro-inflammatory conditions > Results > Trem2 is involved in microglial anti-inflammatory responses with IL-4
plaindirect- Asserted: passes — The authors put it forward as true.
- Checkable: passes — It can be checked against evidence.
- Load-bearing: passes — The paper’s conclusions depend on it.
- Based: passes — The paper gives a reason why it holds.
It may state two separate claims as one.
None of the sources cited for this claim have been checked yet.
In the paper
“It has been reported to be widely expressed in various cell types derived from the myeloid lineage, such as bone osteoclasts (12,13), and lung and peritoneal macrophages (14).”
§ Trem2 promotes anti-inflammatory responses in microglia and is suppressed under pro-inflammatory conditions > Introduction
What the sources say
- Not checked yetcites [12] Humphrey, 2006, TREM2, a DAP12-associated receptor, regulates osteoclast differentiation and function, J. Bone Miner. Res. source
- Not checked yetcites [13] Paloneva, 2003, DAP12/TREM2 deficiency results in impaired osteoclast differentiation and osteoporotic features, J. Exp. Med. source
- Not checked yetcites [14] Turnbull, 2006, Cutting edge: TREM-2 attenuates macrophage activation, J. Immunol. source
plain- Asserted: passes — The authors put it forward as true.
- Checkable: passes — It can be checked against evidence.
- Load-bearing: fails — The paper’s conclusions may not depend on it.
- Based: passes — The paper gives a reason why it holds.
Probably not a substantial claim. The paper’s conclusions may not depend on it.
In the paper
“The same study also showed that Trem2 knockdown via a lentiviral strategy increased pro-inflammatory gene expression and decreased phagocytosis of labeled apoptotic neuronal membranes in primary microglia stressed with co-culture of apoptosis-induced primary neurons.”
§ Trem2 promotes anti-inflammatory responses in microglia and is suppressed under pro-inflammatory conditions > Introduction
What the sources say
- Not checked yetcites [17] Takahashi, 2005, Clearance of apoptotic neurons without inflammation by microglial triggering receptor expressed on myeloid cells-2, J. Exp. Med. source
plaindirect- Asserted: passes — The authors put it forward as true.
- Checkable: passes — It can be checked against evidence.
- Load-bearing: passes — The paper’s conclusions depend on it.
- Based: passes — The paper gives a reason why it holds.
It may state two separate claims as one.
A conclusion the paper draws from its own results — it cites no other source for it, so there is none to check. The quote shows it is in the paper.
In the paper
“LPS-induced pro-inflammatory stimulation suppressed Trem2 expression, thus preventing TREM2’s anti-inflammatory drive.”
§ Trem2 promotes anti-inflammatory responses in microglia and is suppressed under pro-inflammatory conditions > Abstract
plaindirect- Asserted: passes — The authors put it forward as true.
- Checkable: passes — It can be checked against evidence.
- Load-bearing: passes — The paper’s conclusions depend on it.
- Based: passes — The paper gives a reason why it holds.
It may state two separate claims as one.
None of the sources cited for this claim have been checked yet.
In the paper
“TREM2 was also found to suppress LPS-induced pro-inflammatory markers up-regulated in primary alveolar macrophages in vitro (28), and the BV-2 microglial cell line (29).”
§ Trem2 promotes anti-inflammatory responses in microglia and is suppressed under pro-inflammatory conditions > Introduction
What the sources say
- Not checked yetcites [28] Gao, 2013, Silencing of triggering receptor expressed on myeloid cells-2 enhances the inflammatory responses of alveolar macrophages to lipopolysaccharide, Mol. Med. Rep. source
- Not checked yetcites [29] Zhong, 2015, DAP12 stabilizes the C-terminal fragment of the triggering receptor expressed on myeloid cells-2 (TREM2) and protects against LPS-induced pro-inflammatory response, J. Biol. Chem. source
plaindirectn = 2- Asserted: passes — The authors put it forward as true.
- Checkable: passes — It can be checked against evidence.
- Load-bearing: passes — The paper’s conclusions depend on it.
- Based: passes — The paper gives a reason why it holds.
It may state two separate claims as one.
In the paper
“Interestingly, the effects of IL-4 stimulation on gene expression mimic the changes seen in association with plaque development in transgenic mice (44), where Trem2 levels are also strongly increased, whereas the pro-inflammatory effects of LPS have the opposite effect.”
§ Trem2 promotes anti-inflammatory responses in microglia and is suppressed under pro-inflammatory conditions > Results > Trem2 is involved in microglial anti-inflammatory responses with IL-4
What the sources say
- Not checked yetcites [44] Salih, 2019, Genetic variability in response to amyloid beta deposition influences Alzheimer's disease risk, Brain Commun. source
boostedcorrelational- Asserted: passes — The authors put it forward as true.
- Checkable: passes — It can be checked against evidence.
- Load-bearing: unclear — It is unclear whether the paper’s conclusions depend on it.
- Based: passes — The paper gives a reason why it holds.
It may state two separate claims as one.
None of the sources cited for this claim have been checked yet.
In the paper
“Evidence from in vitro studies has accumulated to support the role of TREM2 in restricting inflammation and promoting phagocytosis.”
§ Trem2 promotes anti-inflammatory responses in microglia and is suppressed under pro-inflammatory conditions > Introduction
plaindirect- Asserted: passes — The authors put it forward as true.
- Checkable: passes — It can be checked against evidence.
- Load-bearing: passes — The paper’s conclusions depend on it.
- Based: passes — The paper gives a reason why it holds.
It may state two separate claims as one.
None of the sources cited for this claim have been checked yet.
In the paper
“TREM2 expression was first observed in macrophages and dendritic cells, but not granulocytes or monocytes (9–11).”
§ Trem2 promotes anti-inflammatory responses in microglia and is suppressed under pro-inflammatory conditions > Introduction
What the sources say
- Not checked yetcites [9] Bouchon, 2000, Cutting edge: inflammatory responses can be triggered by TREM-1, a novel receptor expressed on neutrophils and monocytes, J. Immunol. source
- Not checked yetcites [10] Bouchon, 2001, A DAP12-mediated pathway regulates expression of CC chemokine receptor 7 and maturation of human dendritic cells, J. Exp. Med. source
- Not checked yetcites [11] Daws, 2001, Cloning and characterization of a novel mouse myeloid DAP12-associated receptor family, Eur. J. Immunol. source
plain- Asserted: passes — The authors put it forward as true.
- Checkable: passes — It can be checked against evidence.
- Load-bearing: fails — The paper’s conclusions may not depend on it.
- Based: passes — The paper gives a reason why it holds.
Probably not a substantial claim. The paper’s conclusions may not depend on it. It may state two separate claims as one.
None of the sources cited for this claim have been checked yet.
In the paper
“In addition to the R47H variant, further TREM2 variants have been revealed to be risk factors of AD or other CNS diseases, such as R62H (8,20), H157Y (25), Q33X, T66M and Y38C (26,27).”
§ Trem2 promotes anti-inflammatory responses in microglia and is suppressed under pro-inflammatory conditions > Introduction
What the sources say
- Not checked yetcites [8] Sims, 2017, Rare coding variants in PLCG2, ABI3, and TREM2 implicate microglial-mediated innate immunity in Alzheimer's disease, Nat. Genet. source
- Not checked yetcites [20] Jin, 2014, Coding variants in TREM2 increase risk for Alzheimer's disease, Hum. Mol. Genet. source
- Not checked yetcites [25] Jiang, 2016, A rare coding variant in TREM2 increases risk for Alzheimer's disease in Han Chinese, Neurobiol. Aging source
- Not checked yetcites [26] Guerreiro, 2013, Novel compound heterozygous mutation in TREM2 found in a Turkish frontotemporal dementia-like family, Neurobiol. Aging source
- Not checked yetcites [27] Guerreiro, 2013, Using exome sequencing to reveal mutations in TREM2 presenting as a frontotemporal dementia-like syndrome without bone involvement, JAMA Neurol. source
plaincorrelational- Asserted: passes — The authors put it forward as true.
- Checkable: passes — It can be checked against evidence.
- Load-bearing: fails — The paper’s conclusions may not depend on it.
- Based: passes — The paper gives a reason why it holds.
Probably not a substantial claim. The paper’s conclusions may not depend on it.
In the paper
“It was first reported in a study using primary microglia transduced with flag epitope tagged TREM2 that TREM2 stimulated microglial chemotaxis, and phagocytosis of fluorescent beads (17).”
§ Trem2 promotes anti-inflammatory responses in microglia and is suppressed under pro-inflammatory conditions > Introduction
What the sources say
- Not checked yetcites [17] Takahashi, 2005, Clearance of apoptotic neurons without inflammation by microglial triggering receptor expressed on myeloid cells-2, J. Exp. Med. source
plaindirect- Asserted: passes — The authors put it forward as true.
- Checkable: passes — It can be checked against evidence.
- Load-bearing: unclear — It is unclear whether the paper’s conclusions depend on it.
- Based: passes — The paper gives a reason why it holds.
It may state two separate claims as one.
The paper states this without a source or data behind it here, so there is nothing to check it against. The quote shows it is in the paper.
In the paper
“However, other cellular functions of TREM2, particularly anti-inflammatory or alternative activation, and the molecular mechanisms mediating the actions of TREM2, are not well understood.”
§ Trem2 promotes anti-inflammatory responses in microglia and is suppressed under pro-inflammatory conditions > Introduction
plain- Asserted: passes — The authors put it forward as true.
- Checkable: passes — It can be checked against evidence.
- Load-bearing: passes — The paper’s conclusions depend on it.
- Based: fails — The paper may give no reason why it holds.
Probably not a substantial claim. The paper may give no reason why it holds. It may state two separate claims as one.
A conclusion the paper draws from its own results — it cites no other source for it, so there is none to check. The quote shows it is in the paper.
In the paper
“The expression level of the Stat6 gene was also decreased with reduced Trem2 expression (Fig. 9C), and so confirms the decreased levels of the translated protein.”
§ Trem2 promotes anti-inflammatory responses in microglia and is suppressed under pro-inflammatory conditions > Results > TREM2 is involved in maintaining normal STAT6 levels in microglia
boosteddirect- Asserted: passes — The authors put it forward as true.
- Checkable: passes — It can be checked against evidence.
- Load-bearing: passes — The paper’s conclusions depend on it.
- Based: passes — The paper gives a reason why it holds.
It may state two separate claims as one.
A conclusion the paper draws from its own results — it cites no other source for it, so there is none to check. The quote shows it is in the paper.
In the paper
“the genes down-regulated in cells carrying the Trem2 R47H KI alleles were associated with microglial activation, suggesting down-regulation of genes with reduced Trem2 expression may dampen some states of microglial activation (Supplementary Material, Fig. S12).”
§ Trem2 promotes anti-inflammatory responses in microglia and is suppressed under pro-inflammatory conditions > Results > Gene expression profiles regulated by TREM2 and IL-4
hedgedconditional- Asserted: passes — The authors put it forward as true.
- Checkable: passes — It can be checked against evidence.
- Load-bearing: unclear — It is unclear whether the paper’s conclusions depend on it.
- Based: passes — The paper gives a reason why it holds.
It may state two separate claims as one.
None of the sources cited for this claim have been checked yet.
In the paper
“Recently, it was further shown that apolipoproteins, lipids and Aβ itself acted as ligands of TREM2 to facilitate microglial phagocytosis and clearance of Aβ and apoptotic neurons (32–35).”
§ Trem2 promotes anti-inflammatory responses in microglia and is suppressed under pro-inflammatory conditions > Introduction
What the sources say
- Not checked yetcites [32] Atagi, 2015, Apolipoprotein E is a ligand for triggering receptor expressed on myeloid cells 2 (TREM2), J. Biol. Chem. source
- Not checked yetcites [33] Yeh, 2016, TREM2 binds to apolipoproteins, including APOE and CLU/APOJ, and thereby facilitates uptake of amyloid-Beta by microglia, Neuron source
- Not checked yetcites [34] Zhao, 2018, TREM2 is a receptor for beta-amyloid that mediates microglial function, Neuron source
- Not checked yetcites [35] Nugent, 2020, TREM2 regulates microglial cholesterol metabolism upon chronic phagocytic challenge, Neuron source
plaindirect- Asserted: passes — The authors put it forward as true.
- Checkable: passes — It can be checked against evidence.
- Load-bearing: unclear — It is unclear whether the paper’s conclusions depend on it.
- Based: passes — The paper gives a reason why it holds.
It may state two separate claims as one.
A conclusion the paper draws from its own results — it cites no other source for it, so there is none to check. The quote shows it is in the paper.
In the paper
“These results suggest that TREM2 deficiency leads to a smaller STAT6 pool in microglia, resulting in decreased amount of phosphorylated STAT6 upon IL-4 stimulation.”
§ Trem2 promotes anti-inflammatory responses in microglia and is suppressed under pro-inflammatory conditions > Results > TREM2 is involved in maintaining normal STAT6 levels in microglia
hedgeddirect- Asserted: passes — The authors put it forward as true.
- Checkable: passes — It can be checked against evidence.
- Load-bearing: passes — The paper’s conclusions depend on it.
- Based: passes — The paper gives a reason why it holds.
It may state two separate claims as one.
None of the sources cited for this claim have been checked yet.
In the paper
“In general, these studies suggest that Trem2 deficiency exacerbates microglial pro-inflammatory activation in response to various stimuli, and accompanies impaired phagocytosis.”
§ Trem2 promotes anti-inflammatory responses in microglia and is suppressed under pro-inflammatory conditions > Introduction
hedgeddirect- Asserted: passes — The authors put it forward as true.
- Checkable: passes — It can be checked against evidence.
- Load-bearing: passes — The paper’s conclusions depend on it.
- Based: passes — The paper gives a reason why it holds.
It may state two separate claims as one.
None of the sources cited for this claim have been checked yet.
In the paper
“previous studies have shown that phosphorylation of STAT6 is a key step downstream in the IL-4 cascade that leads to Arg1 expression (49–51).”
§ Trem2 promotes anti-inflammatory responses in microglia and is suppressed under pro-inflammatory conditions > Results > TREM2 is involved in maintaining normal STAT6 levels in microglia
What the sources say
- Not checked yetcites [49] Luzina, 2012, Regulation of inflammation by interleukin-4: a review of "alternatives", J. Leukoc. Biol. source
- Not checked yetcites [50] Nelms, 1999, The IL-4 receptor: signaling mechanisms and biologic functions, Annu. Rev. Immunol. source
- Not checked yetcites [51] Gordon, 2010, Alternative activation of macrophages: mechanism and functions, Immunity source
plaindirect- Asserted: passes — The authors put it forward as true.
- Checkable: passes — It can be checked against evidence.
- Load-bearing: passes — The paper’s conclusions depend on it.
- Based: passes — The paper gives a reason why it holds.
Probably not a substantial claim.
A conclusion the paper draws from its own results — it cites no other source for it, so there is none to check. The quote shows it is in the paper.
In the paper
“Trem2 knockdown also decreased the total levels of phosphorylated STAT6 but this could be explained by a decrease in the overall levels of STAT6 rather than an effect on phosphorylation per se.”
§ Trem2 promotes anti-inflammatory responses in microglia and is suppressed under pro-inflammatory conditions > Results > TREM2 is involved in maintaining normal STAT6 levels in microglia
hedgedconditional- Asserted: passes — The authors put it forward as true.
- Checkable: passes — It can be checked against evidence.
- Load-bearing: unclear — It is unclear whether the paper’s conclusions depend on it.
- Based: passes — The paper gives a reason why it holds.
It may state two separate claims as one.
None of the sources cited for this claim have been checked yet.
In the paper
“Pharmacological blockade of CSF1 receptors has been shown to impair microglial survival and can completely remove microglia from the mouse brain (53–55).”
§ Trem2 promotes anti-inflammatory responses in microglia and is suppressed under pro-inflammatory conditions > Discussion > siRNA-induced knockdown of Trem2 largely mimics the Trem2 R47H phenotype in non-stimulated conditions
What the sources say
- Not checked yetcites [53] Elmore, 2014, Colony-stimulating factor 1 receptor signaling is necessary for microglia viability, unmasking a microglia progenitor cell in the adult brain, Neuron source
- Not checked yetcites [54] Dagher, 2015, Colony-stimulating factor 1 receptor inhibition prevents microglial plaque association and improves cognition in 3xTg-AD mice, J. Neuroinflammation source
- Not checked yetcites [55] Olmos-Alonso, 2016, Pharmacological targeting of CSF1R inhibits microglial proliferation and prevents the progression of Alzheimer's-like pathology, Brain source
plaindirect- Asserted: passes — The authors put it forward as true.
- Checkable: passes — It can be checked against evidence.
- Load-bearing: passes — The paper’s conclusions depend on it.
- Based: passes — The paper gives a reason why it holds.
It may state two separate claims as one.
In the paper
“While this may not affect microglial survival as the IGF1 receptor is found largely on neurons, it could contribute to neurodegeneration, being an important factor in neuronal survival and lifespan across many species (67).”
§ Trem2 promotes anti-inflammatory responses in microglia and is suppressed under pro-inflammatory conditions > Discussion > siRNA-induced knockdown of Trem2 largely mimics the Trem2 R47H phenotype in non-stimulated conditions
What the sources say
- Not checked yetcites [67] Broughton, 2009, Insulin/IGF-like signalling, the central nervous system and aging, Biochem. J. source
hedgedconditional- Asserted: passes — The authors put it forward as true.
- Checkable: passes — It can be checked against evidence.
- Load-bearing: unclear — It is unclear whether the paper’s conclusions depend on it.
- Based: passes — The paper gives a reason why it holds.
It may state two separate claims as one.
- Rests on an assumption: The IGF1 receptor is found largely on neurons.
A conclusion the paper draws from its own results — it cites no other source for it, so there is none to check. The quote shows it is in the paper.
In the paper
“Interestingly no difference in Csf1r expression was seen in the remaining microglia in the brain tissue from the young adult Trem2 R47H KI mice, possibly suggesting different populations of microglia, with loss of those more vulnerable to the effects of Trem2 knockdown than others, at least in whole tissue.”
§ Trem2 promotes anti-inflammatory responses in microglia and is suppressed under pro-inflammatory conditions > Discussion > siRNA-induced knockdown of Trem2 largely mimics the Trem2 R47H phenotype in non-stimulated conditions
hedged- Asserted: passes — The authors put it forward as true.
- Checkable: passes — It can be checked against evidence.
- Load-bearing: unclear — It is unclear whether the paper’s conclusions depend on it.
- Based: passes — The paper gives a reason why it holds.
It may state two separate claims as one.
A conclusion the paper draws from its own results — it cites no other source for it, so there is none to check. The quote shows it is in the paper.
In the paper
“Thus, the Igf1 expression decrease caused by Trem2 deficiency may suggest a microglial phenotype shift towards pro-inflammatory activation and away from non-inflammatory, and a decrease of the pro-survival role of IGF1 on neurons.”
§ Trem2 promotes anti-inflammatory responses in microglia and is suppressed under pro-inflammatory conditions > Discussion > siRNA-induced knockdown of Trem2 largely mimics the Trem2 R47H phenotype in non-stimulated conditions
hedgedconditional- Asserted: passes — The authors put it forward as true.
- Checkable: passes — It can be checked against evidence.
- Load-bearing: passes — The paper’s conclusions depend on it.
- Based: passes — The paper gives a reason why it holds.
It may state two separate claims as one.
A conclusion the paper draws from its own results — it cites no other source for it, so there is none to check. The quote shows it is in the paper.
In the paper
“Hence, we can largely consider these mice as a model of Trem2 down-regulation, validated by our siRNA data in primary microglia.”
§ Trem2 promotes anti-inflammatory responses in microglia and is suppressed under pro-inflammatory conditions > Discussion > Trem2 R47H knock-in mice can largely be considered a model of in vivo Trem2 down-regulation
plaindirect- Asserted: passes — The authors put it forward as true.
- Checkable: passes — It can be checked against evidence.
- Load-bearing: passes — The paper’s conclusions depend on it.
- Based: passes — The paper gives a reason why it holds.
It may state two separate claims as one.
- Rests on an assumption: The Trem2 decrease in R47H KI mice does not occur in human tissue with this mutation but is a mouse-specific effect related to altered splicing.
None of the sources cited for this claim have been checked yet.
In the paper
“considering that PI3K-AKT signaling is downstream of TREM2”
§ Trem2 promotes anti-inflammatory responses in microglia and is suppressed under pro-inflammatory conditions > Results > TREM2 is involved in maintaining normal STAT6 levels in microglia
What the sources say
plaindirect- Asserted: passes — The authors put it forward as true.
- Checkable: passes — It can be checked against evidence.
- Load-bearing: passes — The paper’s conclusions depend on it.
- Based: passes — The paper gives a reason why it holds.
Probably not a substantial claim.
None of the sources cited for this claim have been checked yet.
In the paper
“Igf1 is abundantly expressed by microglia during postnatal development, aging or following brain injuries and plays a vital role in promoting neuronal survival (59,63–66).”
§ Trem2 promotes anti-inflammatory responses in microglia and is suppressed under pro-inflammatory conditions > Discussion > siRNA-induced knockdown of Trem2 largely mimics the Trem2 R47H phenotype in non-stimulated conditions
What the sources say
- Not checked yetcites [59] Butovsky, 2018, Microglial signatures and their role in health and disease, Nat. Rev. Neurosci. source
- Not checked yetcites [63] Ueno, 2013, Layer V cortical neurons require microglial support for survival during postnatal development, Nat. Neurosci. source
- Not checked yetcites [64] Fernandez, 2012, The many faces of insulin-like peptide signalling in the brain, Nat. Rev. Neurosci. source
- Not checked yetcites [65] Kohman, 2012, Wheel running attenuates microglia proliferation and increases expression of a proneurogenic phenotype in the hippocampus of aged mice, Brain Behav. Immun. source
- Not checked yetcites [66] Thored, 2009, Long-term accumulation of microglia with proneurogenic phenotype concomitant with persistent neurogenesis in adult subventricular zone after stroke, Glia source
plaindirect- Asserted: passes — The authors put it forward as true.
- Checkable: passes — It can be checked against evidence.
- Load-bearing: passes — The paper’s conclusions depend on it.
- Based: passes — The paper gives a reason why it holds.
Probably not a substantial claim. It may state two separate claims as one.
None of the sources cited for this claim have been checked yet.
In the paper
“Differences in gene expression profiles of different microglial populations have been recently described using single cell RNA-seq showing some microglial populations are selectively dependent on Trem2 (58–62).”
§ Trem2 promotes anti-inflammatory responses in microglia and is suppressed under pro-inflammatory conditions > Discussion > siRNA-induced knockdown of Trem2 largely mimics the Trem2 R47H phenotype in non-stimulated conditions
What the sources say
- Not checked yetcites [58] Keren-Shaul, 2017, A unique microglia type associated with restricting development of Alzheimer's disease, Cell source
- Not checked yetcites [59] Butovsky, 2018, Microglial signatures and their role in health and disease, Nat. Rev. Neurosci. source
- Not checked yetcites [60] Sala Frigerio, 2019, The major risk factors for Alzheimer's disease: age, sex, and genes modulate the microglia response to Abeta plaques, Cell Rep. source
- Not checked yetcites [61] Zhou, 2020, Human and mouse single-nucleus transcriptomics reveal TREM2-dependent and TREM2-independent cellular responses in Alzheimer's disease, Nat. Med. source
- Not checked yetcites [62] Hammond, 2019, Single-cell RNA sequencing of microglia throughout the mouse lifespan and in the injured brain reveals complex cell-state changes, Immunity source
plaincorrelational- Asserted: passes — The authors put it forward as true.
- Checkable: passes — It can be checked against evidence.
- Load-bearing: fails — The paper’s conclusions may not depend on it.
- Based: passes — The paper gives a reason why it holds.
Probably not a substantial claim. The paper’s conclusions may not depend on it.
In the paper
“IL-33 ameliorated AD-associated phenotypes by promoting anti-inflammatory functions, which included induction of Arg1 (80).”
§ Trem2 promotes anti-inflammatory responses in microglia and is suppressed under pro-inflammatory conditions > Discussion > Trem2 supports an anti-inflammatory program of gene expression by IL-4 stimulation in part by promoting levels of the transcription factor STAT6
What the sources say
- Not checked yetcites [80] Fu, 2016, IL-33 ameliorates Alzheimer's disease-like pathology and cognitive decline, Proc. Natl. Acad. Sci. USA source
plaindirect- Asserted: passes — The authors put it forward as true.
- Checkable: passes — It can be checked against evidence.
- Load-bearing: unclear — It is unclear whether the paper’s conclusions depend on it.
- Based: passes — The paper gives a reason why it holds.
It may state two separate claims as one.
None of the sources cited for this claim have been checked yet.
In the paper
“ARG1 in myeloid cells mainly functions as an enzyme to hydrolyze arginine to produce ornithine as part of the urea cycle, which both promotes tissue repair through generation of polyamines and collagens, and also reduces nitric oxide production from inducible nitric oxide synthase through decreasing intracellular arginine availability (76–78).”
§ Trem2 promotes anti-inflammatory responses in microglia and is suppressed under pro-inflammatory conditions > Discussion > Trem2 supports an anti-inflammatory program of gene expression by IL-4 stimulation in part by promoting levels of the transcription factor STAT6
What the sources say
- Not checked yetcites [76] Yang, 2014, Functions of arginase isoforms in macrophage inflammatory responses: impact on cardiovascular diseases and metabolic disorders, Front. Immunol. source
- Not checked yetcites [77] Mills, 2000, M-1/M-2 macrophages and the Th1/Th2 paradigm, J. Immunol. source
- Not checked yetcites [78] Modolell, 1995, Reciprocal regulation of the nitric oxide synthase/arginase balance in mouse bone marrow-derived macrophages by TH1 and TH2 cytokines, Eur. J. Immunol. source
plaindirect- Asserted: passes — The authors put it forward as true.
- Checkable: passes — It can be checked against evidence.
- Load-bearing: fails — The paper’s conclusions may not depend on it.
- Based: passes — The paper gives a reason why it holds.
Probably not a substantial claim. The paper’s conclusions may not depend on it. It may state two separate claims as one.
In the paper
“Dusp4 null mice show impaired T cell activation (83).”
§ Trem2 promotes anti-inflammatory responses in microglia and is suppressed under pro-inflammatory conditions > Discussion > Trem2 supports an anti-inflammatory program of gene expression by IL-4 stimulation in part by promoting levels of the transcription factor STAT6
What the sources say
- Not checked yetcites [83] Barbour, 2016, MAP kinase phosphatase 2 deficient mice develop attenuated experimental autoimmune encephalomyelitis through regulating dendritic cells and T cells, Sci. Rep. source
plaindirect- Asserted: passes — The authors put it forward as true.
- Checkable: passes — It can be checked against evidence.
- Load-bearing: fails — The paper’s conclusions may not depend on it.
- Based: passes — The paper gives a reason why it holds.
Probably not a substantial claim. The paper’s conclusions may not depend on it.
In the paper
“work with a microglial cell line suggests that Aβ binding to scavenger receptors induces oxidative stress, which then may impair AP1B1-dependent internalization of the Aβ (82).”
§ Trem2 promotes anti-inflammatory responses in microglia and is suppressed under pro-inflammatory conditions > Discussion > Trem2 supports an anti-inflammatory program of gene expression by IL-4 stimulation in part by promoting levels of the transcription factor STAT6
What the sources say
- Not checked yetcites [82] Manzano-Leon, 2006, Beta-adaptin: key molecule for microglial scavenger receptor function under oxidative stress, Biochem. Bioph. Res. Co. source
hedgedconditional- Asserted: passes — The authors put it forward as true.
- Checkable: passes — It can be checked against evidence.
- Load-bearing: fails — The paper’s conclusions may not depend on it.
- Based: passes — The paper gives a reason why it holds.
Probably not a substantial claim. The paper’s conclusions may not depend on it. It may state two separate claims as one.
In the paper
“ARG1-positive microglia have been shown to modify Aβ accumulation (79)”
§ Trem2 promotes anti-inflammatory responses in microglia and is suppressed under pro-inflammatory conditions > Discussion > Trem2 supports an anti-inflammatory program of gene expression by IL-4 stimulation in part by promoting levels of the transcription factor STAT6
What the sources say
- Not checked yetcites [79] Cherry, 2015, Arginase 1+ microglia reduce Abeta plaque deposition during IL-1beta-dependent neuroinflammation, J. Neuroinflammation source
plaindirect- Asserted: passes — The authors put it forward as true.
- Checkable: passes — It can be checked against evidence.
- Load-bearing: fails — The paper’s conclusions may not depend on it.
- Based: passes — The paper gives a reason why it holds.
Probably not a substantial claim. The paper’s conclusions may not depend on it.
A conclusion the paper draws from its own results — it cites no other source for it, so there is none to check. The quote shows it is in the paper.
In the paper
“Lack of gene expression changes in vivo may be due to a supportive environment from healthy neurons and astrocytes, providing regulating input to the microglia in young mice.”
§ Trem2 promotes anti-inflammatory responses in microglia and is suppressed under pro-inflammatory conditions > Discussion > Trem2 supports an anti-inflammatory program of gene expression by IL-4 stimulation in part by promoting levels of the transcription factor STAT6
hedgedconditional- Asserted: passes — The authors put it forward as true.
- Checkable: passes — It can be checked against evidence.
- Load-bearing: fails — The paper’s conclusions may not depend on it.
- Based: passes — The paper gives a reason why it holds.
Probably not a substantial claim. The paper’s conclusions may not depend on it.
None of the sources cited for this claim have been checked yet.
In the paper
“Anti-inflammatory processes are associated with tissue repair, such as those mediated by IL-4, working through microglia and macrophages, and have been shown to provide benefits in models representing the early stages of neurodegenerative conditions, such as AD and amyotrophic lateral sclerosis, and other disorders related to cell death (45,72,73).”
§ Trem2 promotes anti-inflammatory responses in microglia and is suppressed under pro-inflammatory conditions > Discussion > Trem2 supports an anti-inflammatory program of gene expression by IL-4 stimulation in part by promoting levels of the transcription factor STAT6
What the sources say
- Not checked yetcites [45] Rossi, 2018, Interleukin 4 modulates microglia homeostasis and attenuates the early slowly progressive phase of amyotrophic lateral sclerosis, Cell Death Dis. source
- Not checked yetcites [72] Bosurgi, 2017, Macrophage function in tissue repair and remodeling requires IL-4 or IL-13 with apoptotic cells, Science source
- Not checked yetcites [73] Kiyota, 2010, CNS expression of anti-inflammatory cytokine interleukin-4 attenuates Alzheimer's disease-like pathogenesis in APP+PS1 bigenic mice, FASEB J. source
plaindirect- Asserted: passes — The authors put it forward as true.
- Checkable: passes — It can be checked against evidence.
- Load-bearing: fails — The paper’s conclusions may not depend on it.
- Based: passes — The paper gives a reason why it holds.
Probably not a substantial claim. The paper’s conclusions may not depend on it.
In the paper
“AP1B1 is part of the clathrin-associated adaptor protein complex AP-1 and is involved in endocytosis and intracellular trafficking (81).”
§ Trem2 promotes anti-inflammatory responses in microglia and is suppressed under pro-inflammatory conditions > Discussion > Trem2 supports an anti-inflammatory program of gene expression by IL-4 stimulation in part by promoting levels of the transcription factor STAT6
What the sources say
- Not checked yetcites [81] Li, 2019, Developmental heterogeneity of microglia and brain myeloid cells revealed by deep single-cell RNA sequencing, Neuron source
plaincorrelational- Asserted: passes — The authors put it forward as true.
- Checkable: passes — It can be checked against evidence.
- Load-bearing: fails — The paper’s conclusions may not depend on it.
- Based: passes — The paper gives a reason why it holds.
Probably not a substantial claim. The paper’s conclusions may not depend on it. It may state two separate claims as one.
A conclusion the paper draws from its own results — it cites no other source for it, so there is none to check. The quote shows it is in the paper.
In the paper
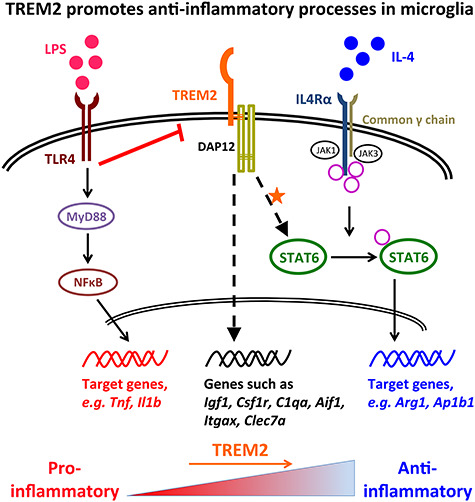
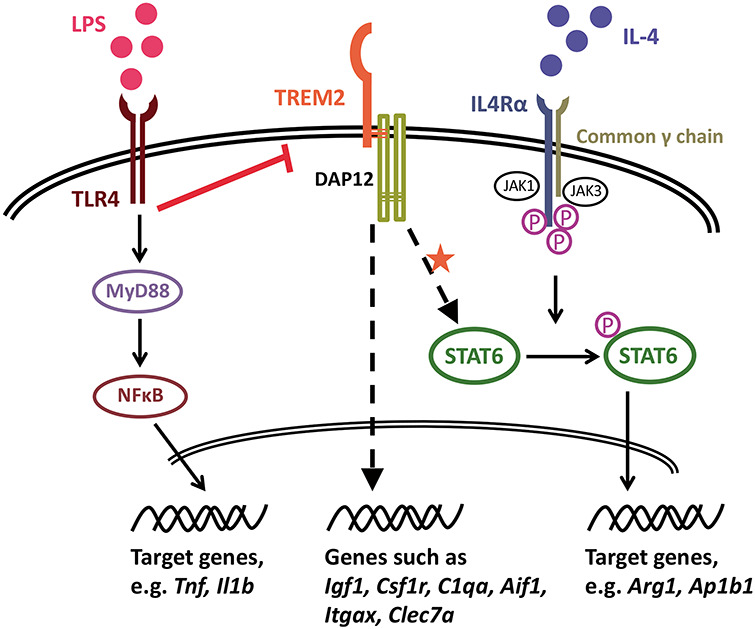
“Our findings in cultured primary microglia suggest an attenuated anti-inflammatory phenotype with reduced expression of Trem2 (Fig. 10), impacting cellular processes involving vesicle function, indicating that genes dependent on both Trem2 and IL-4 affect cytokine release or the response to extracellular cytokines.”
§ Trem2 promotes anti-inflammatory responses in microglia and is suppressed under pro-inflammatory conditions > Discussion > Trem2 supports an anti-inflammatory program of gene expression by IL-4 stimulation in part by promoting levels of the transcription factor STAT6
hedgeddirect- Asserted: passes — The authors put it forward as true.
- Checkable: passes — It can be checked against evidence.
- Load-bearing: passes — The paper’s conclusions depend on it.
- Based: passes — The paper gives a reason why it holds.
It may state two separate claims as one.
None of the sources cited for this claim have been checked yet.
In the paper
“Itgax/CD11C is an integrin or cell surface antigen, and is up-regulated in a number of recent RNA-seq studies in response to amyloid plaques (58,59,61,84).”
§ Trem2 promotes anti-inflammatory responses in microglia and is suppressed under pro-inflammatory conditions > Discussion > Trem2 supports an anti-inflammatory program of gene expression by IL-4 stimulation in part by promoting levels of the transcription factor STAT6
What the sources say
- Not checked yetcites [58] Keren-Shaul, 2017, A unique microglia type associated with restricting development of Alzheimer's disease, Cell source
- Not checked yetcites [59] Butovsky, 2018, Microglial signatures and their role in health and disease, Nat. Rev. Neurosci. source
- Not checked yetcites [61] Zhou, 2020, Human and mouse single-nucleus transcriptomics reveal TREM2-dependent and TREM2-independent cellular responses in Alzheimer's disease, Nat. Med. source
- Not checked yetcites [84] Krasemann, 2017, The TREM2-APOE pathway drives the transcriptional phenotype of dysfunctional microglia in neurodegenerative diseases, Immunity source
plaincorrelational- Asserted: passes — The authors put it forward as true.
- Checkable: passes — It can be checked against evidence.
- Load-bearing: fails — The paper’s conclusions may not depend on it.
- Based: passes — The paper gives a reason why it holds.
Probably not a substantial claim. The paper’s conclusions may not depend on it. It may state two separate claims as one.
In the paper
“As the IL-4-induced up-regulation of a number of genes including Arg1 is critically dependent on phosphorylation of STAT6 (75)”
§ Trem2 promotes anti-inflammatory responses in microglia and is suppressed under pro-inflammatory conditions > Discussion > Trem2 supports an anti-inflammatory program of gene expression by IL-4 stimulation in part by promoting levels of the transcription factor STAT6
What the sources say
- Not checked yetcites [75] Gray, 2005, Induction of arginase I transcription by IL-4 requires a composite DNA response element for STAT6 and C/EBPbeta, Gene source
boosteddirect- Asserted: passes — The authors put it forward as true.
- Checkable: passes — It can be checked against evidence.
- Load-bearing: passes — The paper’s conclusions depend on it.
- Based: passes — The paper gives a reason why it holds.
Probably not a substantial claim.
None of the sources cited for this claim have been checked yet.
In the paper
“This finding is consistent with previous studies showing that LPS/IFNγ stimulation down-regulated Trem2 expression via TLR4 receptors in cell lines and primary cultures of microglia/macrophages and also in mouse brains (14,16,42,88,89).”
§ Trem2 promotes anti-inflammatory responses in microglia and is suppressed under pro-inflammatory conditions > Discussion > Pro-inflammatory stimuli prevent the effects of TREM2 by inhibiting its expression, similar to the effect seen in microglia from Trem2 R47H KI mice
What the sources say
- Not checked yetcites [14] Turnbull, 2006, Cutting edge: TREM-2 attenuates macrophage activation, J. Immunol. source
- Not checked yetcites [16] Schmid, 2002, Heterogeneous expression of the triggering receptor expressed on myeloid cells-2 on adult murine microglia, J. Neurochem. source
- Not checked yetcites [42] Owens, 2017, Divergent Neuroinflammatory regulation of microglial TREM expression and involvement of NF-kappaB, Front. Cell. Neurosci.
- Not checked yetcites [88] Zheng, 2016, Opposing roles of the triggering receptor expressed on myeloid cells 2 and triggering receptor expressed on myeloid cells-like transcript 2 in microglia activation, Neurobiol. Aging source
- Not checked yetcites [89] Zhou, 2019, Imbalance of microglial TLR4/TREM2 in LPS-treated APP/PS1 transgenic mice: a potential Link between Alzheimer's disease and systemic inflammation, Neurochem. Res. source
plaindirect- Asserted: passes — The authors put it forward as true.
- Checkable: passes — It can be checked against evidence.
- Load-bearing: passes — The paper’s conclusions depend on it.
- Based: passes — The paper gives a reason why it holds.
It may state two separate claims as one.
A conclusion the paper draws from its own results — it cites no other source for it, so there is none to check. The quote shows it is in the paper.
In the paper
“The effects seen in the primary cultured microglia probably reflect a different mean activation state from microglia in the brain environment, although there remains a significant overlap with microglia expression profiles in vivo that are dependent on Trem2 levels and IL-4 simulation.”
§ Trem2 promotes anti-inflammatory responses in microglia and is suppressed under pro-inflammatory conditions > Discussion > Trem2 supports an anti-inflammatory program of gene expression by IL-4 stimulation in part by promoting levels of the transcription factor STAT6
hedgedcorrelational- Asserted: passes — The authors put it forward as true.
- Checkable: passes — It can be checked against evidence.
- Load-bearing: passes — The paper’s conclusions depend on it.
- Based: passes — The paper gives a reason why it holds.
It may state two separate claims as one.
A conclusion the paper draws from its own results — it cites no other source for it, so there is none to check. The quote shows it is in the paper.
In the paper
“in microglia originating from Trem2 R47H KI mice with a similar level of Trem2 down-regulation, there was about a 39% decrease in the activation of Il1b compared with WT mice possibly suggesting that the Trem2 R47H mutation underlies this effect.”
§ Trem2 promotes anti-inflammatory responses in microglia and is suppressed under pro-inflammatory conditions > Discussion > Pro-inflammatory stimuli prevent the effects of TREM2 by inhibiting its expression, similar to the effect seen in microglia from Trem2 R47H KI mice
hedgedconditional- Asserted: passes — The authors put it forward as true.
- Checkable: passes — It can be checked against evidence.
- Load-bearing: unclear — It is unclear whether the paper’s conclusions depend on it.
- Based: passes — The paper gives a reason why it holds.
It may state two separate claims as one.
- Rests on an assumption: The down-regulation of Trem2 in Trem2 R47H KI mice is present throughout life.
A conclusion the paper draws from its own results — it cites no other source for it, so there is none to check. The quote shows it is in the paper.
In the paper
“There are, however, other possible explanations for this difference, as the down-regulation of Trem2 in these mice is present throughout life and so these microglia may have a different state when isolated than those in which Trem2 is knocked down acutely.”
§ Trem2 promotes anti-inflammatory responses in microglia and is suppressed under pro-inflammatory conditions > Discussion > Pro-inflammatory stimuli prevent the effects of TREM2 by inhibiting its expression, similar to the effect seen in microglia from Trem2 R47H KI mice
hedgedconditional- Asserted: passes — The authors put it forward as true.
- Checkable: passes — It can be checked against evidence.
- Load-bearing: fails — The paper’s conclusions may not depend on it.
- Based: passes — The paper gives a reason why it holds.
Probably not a substantial claim. The paper’s conclusions may not depend on it. It may state two separate claims as one.
- Rests on an assumption: The down-regulation of Trem2 in Trem2 R47H KI mice is present throughout life.
In the paper
“This might be one of the major mechanisms underlying various neurodegenerative diseases with advanced age by suppression of WT TREM2 in many sporadic cases, considering that TREM2 variants associated with loss-of-function are extremely rare in frequency in humans (2).”
§ Trem2 promotes anti-inflammatory responses in microglia and is suppressed under pro-inflammatory conditions > Discussion > Pro-inflammatory stimuli prevent the effects of TREM2 by inhibiting its expression, similar to the effect seen in microglia from Trem2 R47H KI mice
What the sources say
- Not checked yetcites [2] Guerreiro, 2013, TREM2 variants in Alzheimer's disease, N. Engl. J. Med. source
hedgedconditional- Asserted: passes — The authors put it forward as true.
- Checkable: passes — It can be checked against evidence.
- Load-bearing: passes — The paper’s conclusions depend on it.
- Based: passes — The paper gives a reason why it holds.
It may state two separate claims as one.
None of the sources cited for this claim have been checked yet.
In the paper
“Recent important studies have also shown that impaired/absent Trem2 function attenuates the microglial response to amyloid pathology by regulating microglial number around plaques, regulating microglial activity, and restricting neuritic damage (37,61,84–87,95–99).”
§ Trem2 promotes anti-inflammatory responses in microglia and is suppressed under pro-inflammatory conditions > Discussion > Functions of TREM2 in Alzheimer’s disease and the effect of the R47H mutation
What the sources say
- Not checked yetcites [37] Cheng-Hathaway, 2018, The Trem2 R47H variant confers loss-of-function-like phenotypes in Alzheimer's disease, Mol. Neurodegener. source
- Not checked yetcites [61] Zhou, 2020, Human and mouse single-nucleus transcriptomics reveal TREM2-dependent and TREM2-independent cellular responses in Alzheimer's disease, Nat. Med. source
- Not checked yetcites [84] Krasemann, 2017, The TREM2-APOE pathway drives the transcriptional phenotype of dysfunctional microglia in neurodegenerative diseases, Immunity source
- Not checked yetcites [85] Song, 2018, Humanized TREM2 mice reveal microglia-intrinsic and -extrinsic effects of R47H polymorphism, J. Exp. Med. source
- Not checked yetcites [86] Griciuc, 2019, TREM2 acts downstream of CD33 in modulating microglial pathology in Alzheimer's disease, Neuron source
- Not checked yetcites [87] Linnartz-Gerlach, 2019, TREM2 triggers microglial density and age-related neuronal loss, Glia source
- Not checked yetcites [95] Leyns, 2019, TREM2 function impedes tau seeding in neuritic plaques, Nat. Neurosci. source
- Not checked yetcites [96] Prokop, 2019, Impact of TREM2 risk variants on brain region-specific immune activation and plaque microenvironment in Alzheimer's disease patient brain samples, Acta Neuropathol. source
- Not checked yetcites [97] Sayed, 2018, Differential effects of partial and complete loss of TREM2 on microglial injury response and tauopathy, Proc. Natl. Acad. Sci. USA source
- Not checked yetcites [98] Meilandt, 2020, Trem2 deletion reduces late-stage amyloid plaque accumulation, elevates the Abeta42:Abeta40 ratio, and exacerbates axonal dystrophy and dendritic spine loss in the PS2APP Alzheimer's mouse model, J. Neurosci. source
boosteddirect- Asserted: passes — The authors put it forward as true.
- Checkable: passes — It can be checked against evidence.
- Load-bearing: unclear — It is unclear whether the paper’s conclusions depend on it.
- Based: passes — The paper gives a reason why it holds.
It may state two separate claims as one.
A conclusion the paper draws from its own results — it cites no other source for it, so there is none to check. The quote shows it is in the paper.
In the paper
“This might reflect a mechanism for microglia to perform specific functional requirements under pro-inflammatory conditions.”
§ Trem2 promotes anti-inflammatory responses in microglia and is suppressed under pro-inflammatory conditions > Discussion > Pro-inflammatory stimuli prevent the effects of TREM2 by inhibiting its expression, similar to the effect seen in microglia from Trem2 R47H KI mice
hedgedconditional- Asserted: passes — The authors put it forward as true.
- Checkable: fails — It may be too vague to check against evidence.
- Load-bearing: fails — The paper’s conclusions may not depend on it.
- Based: passes — The paper gives a reason why it holds.
Probably not a substantial claim. It may be too vague to check against evidence. The paper’s conclusions may not depend on it.
None of the sources cited for this claim have been checked yet.
In the paper
“accumulated pro-inflammation and oxidative stress in the brain, which is often observed in aged brains and aged microglia (90–94), could cause sustained suppression of Trem2 expression and thus an impairment of TREM2-dependent microglial functions.”
§ Trem2 promotes anti-inflammatory responses in microglia and is suppressed under pro-inflammatory conditions > Discussion > Pro-inflammatory stimuli prevent the effects of TREM2 by inhibiting its expression, similar to the effect seen in microglia from Trem2 R47H KI mice
What the sources say
- Not checked yetcites [90] Prolla, 2002, DNA microarray analysis of the aging brain, Chem. Senses source
- Not checked yetcites [91] Godbout, 2005, Exaggerated neuroinflammation and sickness behavior in aged mice following activation of the peripheral innate immune system, FASEB J. source
- Not checked yetcites [92] Lee, 2000, Gene-expression profile of the ageing brain in mice, Nat. Genet. source
- Not checked yetcites [93] Verbitsky, 2004, Altered hippocampal transcript profile accompanies an age-related spatial memory deficit in mice, Learn. Mem. source
- Not checked yetcites [94] Sierra, 2007, Microglia derived from aging mice exhibit an altered inflammatory profile, Glia source
hedgedconditional- Asserted: passes — The authors put it forward as true.
- Checkable: passes — It can be checked against evidence.
- Load-bearing: passes — The paper’s conclusions depend on it.
- Based: passes — The paper gives a reason why it holds.
It may state two separate claims as one.
A conclusion the paper draws from its own results — it cites no other source for it, so there is none to check. The quote shows it is in the paper.
In the paper
“Taken together, pro-inflammatory mediators, either locally produced, or infiltrating into the CNS from the periphery following blood–brain barrier breakdown, could induce down-regulation of microglial Trem2 expression and subsequently induce a microglial state with low TREM2-signaling (Fig. 10).”
§ Trem2 promotes anti-inflammatory responses in microglia and is suppressed under pro-inflammatory conditions > Discussion > Pro-inflammatory stimuli prevent the effects of TREM2 by inhibiting its expression, similar to the effect seen in microglia from Trem2 R47H KI mice
hedgedconditional- Asserted: passes — The authors put it forward as true.
- Checkable: passes — It can be checked against evidence.
- Load-bearing: passes — The paper’s conclusions depend on it.
- Based: passes — The paper gives a reason why it holds.
It may state two separate claims as one.
A conclusion the paper draws from its own results — it cites no other source for it, so there is none to check. The quote shows it is in the paper.
In the paper
“In contrast to populations of microglia polarized with purified LPS or IL-4 stimuli in vitro, microglia in vivo probably never receive such simple stimuli to govern their activation state or at least not across the whole population.”
§ Trem2 promotes anti-inflammatory responses in microglia and is suppressed under pro-inflammatory conditions > Discussion > Functions of TREM2 in Alzheimer’s disease and the effect of the R47H mutation
hedged- Asserted: passes — The authors put it forward as true.
- Checkable: passes — It can be checked against evidence.
- Load-bearing: passes — The paper’s conclusions depend on it.
- Based: passes — The paper gives a reason why it holds.
It may state two separate claims as one.
What the paper did — it cites no source for this, so there is none to check. The quote shows it is in the paper.
In the paper
“Cells pre-incubated with 10 μm cytochalasin-D for 30 min prior to the phagocytosis assay were used as a negative control.”
§ Trem2 promotes anti-inflammatory responses in microglia and is suppressed under pro-inflammatory conditions > Materials and Methods > Phagocytosis assay
plain- Asserted: passes — The authors put it forward as true.
- Checkable: passes — It can be checked against evidence.
- Load-bearing: fails — The paper’s conclusions may not depend on it.
- Based: passes — The paper gives a reason why it holds.
Probably not a substantial claim. The paper’s conclusions may not depend on it.
What the paper did — it cites no source for this, so there is none to check. The quote shows it is in the paper.
In the paper
“All RT-qPCR reactions were checked for a single peak with the melt-curve analysis reflecting a single PCR product.”
§ Trem2 promotes anti-inflammatory responses in microglia and is suppressed under pro-inflammatory conditions > Materials and Methods > RT-qPCR
plain- Asserted: passes — The authors put it forward as true.
- Checkable: passes — It can be checked against evidence.
- Load-bearing: fails — The paper’s conclusions may not depend on it.
- Based: passes — The paper gives a reason why it holds.
Probably not a substantial claim. The paper’s conclusions may not depend on it.
What the paper did — it cites no source for this, so there is none to check. The quote shows it is in the paper.
In the paper
“Unstained cells, and cells treated with 50 nM staurosporine for 24 h were used as negative and positive controls respectively to allow correct gating.”
§ Trem2 promotes anti-inflammatory responses in microglia and is suppressed under pro-inflammatory conditions > Materials and Methods > Cell survival
plain- Asserted: passes — The authors put it forward as true.
- Checkable: passes — It can be checked against evidence.
- Load-bearing: fails — The paper’s conclusions may not depend on it.
- Based: passes — The paper gives a reason why it holds.
Probably not a substantial claim. The paper’s conclusions may not depend on it.
What the paper did — it cites no source for this, so there is none to check. The quote shows it is in the paper.
In the paper
“Expression levels of the housekeeping genes Arf1, H3f3b and Rps28 were shown to be stable between the different experimental samples when higher molecular weight RNA was measured (Supplementary Material, Figs S9 and S10).”
§ Trem2 promotes anti-inflammatory responses in microglia and is suppressed under pro-inflammatory conditions > Materials and Methods > RT-qPCR
plain- Asserted: passes — The authors put it forward as true.
- Checkable: passes — It can be checked against evidence.
- Load-bearing: fails — The paper’s conclusions may not depend on it.
- Based: passes — The paper gives a reason why it holds.
Probably not a substantial claim. The paper’s conclusions may not depend on it.
What the paper did — it cites no source for this, so there is none to check. The quote shows it is in the paper.
In the paper
“To account for the differences in the cell number between different wells of microglia, cell lysates were collected in parallel with the supernatants from the same wells and then tested for levels of a housekeeping protein beta-actin (Ab8227, Abcam, RRID: AB_2305186) by western blot, which was used for normalization of TNF-alpha levels.”
§ Trem2 promotes anti-inflammatory responses in microglia and is suppressed under pro-inflammatory conditions > Materials and Methods > ELISA of TREM2 and TNF-alpha by primary microglia
plaindirect- Asserted: passes — The authors put it forward as true.
- Checkable: passes — It can be checked against evidence.
- Load-bearing: passes — The paper’s conclusions depend on it.
- Based: passes — The paper gives a reason why it holds.
Probably not a substantial claim.
What the paper did — it cites no source for this, so there is none to check. The quote shows it is in the paper.
In the paper
“Primers were designed to span at least two exons and tested for specificity against the entire mouse transcriptome using Primer-BLAST (NCBI) and supplied by Eurofins MWG Operon.”
§ Trem2 promotes anti-inflammatory responses in microglia and is suppressed under pro-inflammatory conditions > Materials and Methods > Primer design and test
plain- Asserted: passes — The authors put it forward as true.
- Checkable: passes — It can be checked against evidence.
- Load-bearing: fails — The paper’s conclusions may not depend on it.
- Based: passes — The paper gives a reason why it holds.
Probably not a substantial claim. The paper’s conclusions may not depend on it. It may state two separate claims as one.
What the paper did — it cites no source for this, so there is none to check. The quote shows it is in the paper.
In the paper
“Experimenter was blind to the genotype of the samples during quantification and analysis.”
§ Trem2 promotes anti-inflammatory responses in microglia and is suppressed under pro-inflammatory conditions > Materials and Methods > Hippocampal histology
plain- Asserted: passes — The authors put it forward as true.
- Checkable: passes — It can be checked against evidence.
- Load-bearing: fails — The paper’s conclusions may not depend on it.
- Based: passes — The paper gives a reason why it holds.
Probably not a substantial claim. The paper’s conclusions may not depend on it.
What the paper did — it cites no source for this, so there is none to check. The quote shows it is in the paper.
In the paper
“Typical RNA Integrity values (RIN) around 9.0 from 10.0 were obtained regardless of siRNA, genotype of mice or treatment type.”
§ Trem2 promotes anti-inflammatory responses in microglia and is suppressed under pro-inflammatory conditions > Materials and Methods > RNA purification and cDNA preparation
plain- Asserted: passes — The authors put it forward as true.
- Checkable: passes — It can be checked against evidence.
- Load-bearing: fails — The paper’s conclusions may not depend on it.
- Based: passes — The paper gives a reason why it holds.
Probably not a substantial claim. The paper’s conclusions may not depend on it.
The paper relies on this without support.
The Trem2 R47H knock-in mouse phenotype is effectively a model of down-regulation of TREM2 activity, with changes in microglial number and activation due to a combination of partial Trem2 knockdown and any effect of the R47H mutation.
“The changes in microglial number and activation in this mouse will thus be a combination of the partial knockdown of Trem2 and any effect of the R47H mutation. Hence this is effectively an in vivo model of down regulation of TREM2 activity, through the combination of these two factors.”
The paper relies on this without support.
Anti-inflammatory signaling is associated with tissue repair.
“Given that anti-inflammatory signaling is associated with tissue repair, understanding the signaling mechanisms downstream of Trem2 in coordinating the pro- and anti-inflammatory balance of microglia, particularly mediating effects of the IL-4-regulated anti-inflammatory pathway, has important implications for fighting neurodegenerative disease.”
The paper relies on this without support.
The Trem2 decrease in R47H KI mice does not occur in human tissue with this mutation but is a mouse-specific effect related to altered splicing.
“This does not occur in human tissue with this mutation but appears to be a mouse specific effect related to altered splicing.”
The paper relies on this without support.
ARG1 is an important anti-inflammatory marker induced upon IL-4 stimulation.
“ARG1 is an important anti-inflammatory marker induced upon IL-4 stimulation.”
The paper relies on this without support.
DUSP4 is a phosphatase for a number of MAPK family members, also known as MKP-2.
“DUSP4 is a phosphatase for a number of mitogen-activated protein kinase (MAPK) family members, also known as MAPK phosphatase 2 (MKP-2).”
The paper relies on this without support.
Hub genes drive the response of the entire network.
“Hub genes are those with the highest connectivity within a co-expression network, and are postulated to drive the response of the entire network.”
The paper relies on this without support.
TREM2 variants have high odds ratios for AD risk and R47H is the most common.
“Of the many genes that have been revealed in GWAS to increase the risk of AD, variants of TREM2 have high odds ratios. The most common of these is the R47H mutation.”
The paper relies on this without support.
The down-regulation of Trem2 in Trem2 R47H KI mice is present throughout life.
“the down-regulation of Trem2 in these mice is present throughout life”
The paper relies on this without support.
The IGF1 receptor is found largely on neurons.
“the IGF1 receptor is found largely on neurons”
The paper relies on this without support.
Anti-inflammatory signaling was not studied.
“However anti-inflammatory signaling was not studied.”
The paper relies on this without support.
The down-regulation of Trem2 expression in Trem2 R47H KI mice is not reflected in humans with the R47H mutation.
“the down-regulation of Trem2 expression in the Trem2 R47H KI mice which is not reflected in humans with this mutation”
Claims other papers make about this one
Each is checked against this paper’s own text: does it say what the citing paper says it does?
The source backs part of the claim, not all of it — or backs it for a different population, condition or comparison.
In the citing paper
“in microglia, signalling through TREM2 typically dampens this pro-inflammatory response [33, 34]”
From TREM2/PLCγ2 signalling in immune cells: function, structural insight, and potential therapeutic modulation (2021) · cites this paper as [33]
Experimental — accuracy not yet measuredThe cited source says what the claim attributes to it.
In the citing paper
“investigations in microglia suggested that the TREM2 pathway promotes anti-inflammatory responses [33]”
From TREM2/PLCγ2 signalling in immune cells: function, structural insight, and potential therapeutic modulation (2021) · cites this paper as [33]
In the citing paper
“Regarding the relation of TREM2 with OS, it has been supposed that a down-regulation of microglial TREM2 expression and signaling might be one of the major pathogenetic mechanisms in sporadic cases of AD in which advanced age, OS, neuroinflammation contribute to the suppression of wild-type TREM2, considering that TREM2 mutation is rare in humans [123].”
From Role of Oxidative Damage in Alzheimer’s Disease and Neurodegeneration: From Pathogenic Mechanisms to Biomarker Discovery (2021) · cites this paper as [123]
Citations
Cites
Moderated estimation of fold change and dispersion for RNA-seq data with DESeq2
Love, M. I., Huber, W., & Anders, S. (2014) · Genome Biology · doi:10.1186/s13059-014-0550-8 · Cited by 95,106 · cited 1×
“RNA-seq read counts were analyzed for differential expression using the DESeq2 package (113).”
WGCNA: an R package for weighted correlation network analysis
Langfelder, P., & Horvath, S. (2008) · BMC Bioinformatics · doi:10.1186/1471-2105-9-559 · Cited by 27,252
Salmon provides fast and bias-aware quantification of transcript expression
Patro, R., Duggal, G., Love, M. I., Irizarry, R. A., & Kingsford, C. (2017) · Nature Methods · doi:10.1038/nmeth.4197 · Cited by 12,700
KEGG as a reference resource for gene and protein annotation
Kanehisa, M., Sato, Y., Kawashima, M., Furumichi, M., & Tanabe, M. (2016) · Nucleic Acids Research · doi:10.1093/nar/gkv1070 · Cited by 7,387
The Reactome pathway Knowledgebase
Fabregat, A., Sidiropoulos, K., Garapati, P., Gillespie, M., Hausmann, K., Haw, R., Jassal, B., Jupe, S., Korninger, F., McKay, S., et al. (2016) · Nucleic Acids Research · doi:10.1093/nar/gkv1351 · Cited by 5,605
A Unique Microglia Type Associated with Restricting Development of Alzheimer’s Disease
Keren-Shaul, H., Spinrad, A., Weiner, A., Matcovitch-Natan, O., Dvir-Szternfeld, R., Ulland, T. K., David, E., Baruch, K., Lara-Astaiso, D., Toth, B., et al. (2017) · Cell · doi:10.1016/j.cell.2017.05.018 · Cited by 5,493
Raudvere, U., Kolberg, L., Kuzmin, I., Arak, T., Adler, P., Peterson, H., & Vilo, J. (2019) · Nucleic Acids Research · doi:10.1093/nar/gkz369 · Cited by 5,045 · cited 1×
“Biological annotations using Gene Ontology, REACTOME (114) and KEGG (115) databases were identified using gProfileR2 (116), using genes with FDR < 0.”
MethodAlternative activation of macrophages: mechanism and functions
Gordon, S., & Martinez, F. O. (2010) · Immunity · doi:10.1016/j.immuni.2010.05.007 · Cited by 4,197 · cited 1×
“The phosphorylation of the transcription factor STAT6 is a key step downstream in the IL4 cascade that leads to Arg1 expression (Gordon and Martinez 2010; Luzina et al. 2012; Nelms et al. 1999).”
BackgroundDifferential analyses for RNA-seq: transcript-level estimates improve gene-level inferences
Soneson, C., Love, M. I., & Robinson, M. D. (2015) · F1000Research · doi:10.12688/f1000research.7563.1 · Cited by 3,929
M-1/M-2 Macrophages and the Th1/Th2 Paradigm
Mills, C. D., Kincaid, K., Alt, J. M., Heilman, M. J., & Hill, A. M. (2000) · The Journal of Immunology · doi:10.4049/jimmunol.164.12.6166 · Cited by 3,287 · cited 1×
“…to produce ornithine, which both promotes tissue repair through generation of polyamines and collagens, and also reduces nitric oxide production from inducible nitric oxide synthase through decreasing intracellular arginine availability (Mills et al. 2000; Modolell et al. 1995; Yang and Ming 2014).”
Background
Research works printed but not linked: 1
- Benitez, 2013, TREM2 and neurodegenerative disease, N. Engl. J. Med., 369, 1567
Cited by
Sorted by citations
Microglia Phenotypes in Aging and Neurodegenerative Diseases
Wendimu, M. Y., & Hooks, S. B. (2022) · Cells · doi:10.3390/cells11132091 · Cited by 336
Microglia in Alzheimer’s disease: pathogenesis, mechanisms, and therapeutic potentials
Miao, J., Ma, H., Yang, Y., Liao, Y., Lin, C., Zheng, J., Yu, M., & Lan, J. (2023) · Frontiers in Aging Neuroscience · doi:10.3389/fnagi.2023.1201982 · Cited by 293
“TREM2 (Liu et al., 2020; Hardy and Salih, 2021) rare coding LOF variants: R47H, R62H, T66M, H157Y Binds anionic/lipophilic ligands; triggers DAP12 ITAM to recruit kinase Syk ITAM signaling; Phagocytosis; inflammation”
BackgroundBuccellato, F. R., D’Anca, M., Fenoglio, C., Scarpini, E., & Galimberti, D. (2021) · Antioxidants · doi:10.3390/antiox10091353 · Cited by 179
Lau, V. Z., Ramer, L. M., & Tremblay, M. (2023) · Nature Communications · doi:10.1038/s41467-023-37304-3 · Cited by 175
TREM2: Potential therapeutic targeting of microglia for Alzheimer's disease
Li, Y., Xu, H., Wang, H., Yang, K., Luan, J., & Wang, S. (2023) · Biomedicine & Pharmacotherapy · doi:10.1016/j.biopha.2023.115218 · Cited by 133
A genetic link between risk for Alzheimer's disease and severe COVID-19 outcomes via the OAS1 gene
Magusali, N., Graham, A. C., Piers, T. M., Panichnantakul, P., Yaman, U., Shoai, M., Reynolds, R. H., Botia, J. A., Brookes, K. J., Guetta-Baranes, T., et al. (2021) · Brain · doi:10.1093/brain/awab337 · Cited by 111
Self-citationSingle-cell RNA-Seq reveals changes in immune landscape in post-traumatic osteoarthritis
Sebastian, A., Hum, N. R., McCool, J. L., Wilson, S. P., Murugesh, D. K., Martin, K. A., Rios‐Arce, N. D., Amiri, B., Christiansen, B., & Loots, G. G. (2022) · Frontiers in Immunology · doi:10.3389/fimmu.2022.938075 · Cited by 112
“TREM2 (triggering receptor expressed on myeloid cells 2) is a cell surface receptor expressed in myeloid lineage cells such as monocytes, macrophages and dendritic cells and microglia in brain (66, 67).”
BackgroundHuang, P., Zhang, Z., Zhang, P., Feng, J., Xie, J., Zheng, Y., Liang, X., Zhu, B., Chen, Z., Feng, S., et al. (2024) · Molecular Neurobiology · doi:10.1007/s12035-023-03713-0 · Cited by 111
Li, T., Lu, L., Pember, E., Li, X., Zhang, B., & Zhu, Z. (2022) · Cells · doi:10.3390/cells11121925 · Cited by 109
“The anti-inflammatory function of TREM2 is associated with the IL-4 stimulation pathway by promoting levels of the transcription factor STAT6, involving genes such as Arg1, Ap1b1, and Dusp4 [115].”
BackgroundYolk sac cell atlas reveals multiorgan functions during human early development
Goh, I., Botting, R. A., Rose, A., Webb, S., Engelbert, J., Gitton, Y., Stephenson, E., Londoño, M. Q., Mather, M., Mende, N., et al. (2023) · Science · doi:10.1126/science.add7564 · Cited by 111
“TREM2 is implicated in lipid sensing by anti-inflammatory tissue macrophages in the adult human and mouse (23–25), but we observed the highest expression of TREM2 in macrophages bearing a “microglia-like” signature in developing tissues including YS, skin (as previously reported (49)), gonads (as…”
A Richer and More Diverse Future for Microglia Phenotype
Wang, J., He, W., & Zhang, J. (2022) · Heliyon · doi:10.1016/j.heliyon.2023.e14713 · Cited by 113
“In many model studies, the level of M1 microglia was found to increase when bacterial components such as lipopolysaccharide (LPS) or infection-related signals such as IFN-γ increase [23 – 25].”
Neuroplasticity related to chronic pain and its modulation by microglia
Hiraga, S.-I., Itokazu, T., Nishibe, M., & Yamashita, T. (2022) · Inflammation and Regeneration · doi:10.1186/s41232-022-00199-6 · Cited by 101
“It has been shown IL-10 is released from TREM2regulated anti-inflammatory microglia [74, 75].”
BackgroundDas, T. K., & Ganesh, B. P. (2023) · Gut Microbes · doi:10.1080/19490976.2023.2206504 · Cited by 102
“The expression of TREM2 on the microglial cell surface increases the phagocytic activity and causes ROS production.(51) During the phagocytosis activity microglia produce ROS like O2.”
BackgroundFracassi, A., Marcatti, M., Tumurbaatar, B., Woltjer, R., Moreno, S., & Taglialatela, G. (2023) · Brain Pathology · doi:10.1111/bpa.13108 · Cited by 92
“In this regard, it is worth noticing that TREM2 signaling has anti-inflammatory consequences and has been shown to antagonize Toll-like receptor (TLR-4) mediated inflammation by modulating the JNK and suppressing NFκB signaling pathways [23, 38].”
BackgroundPathological mechanisms and treatment progression of Alzheimer’s disease
Zhang, J., Kong, G., Yang, J., Pang, L., & Li, X. (2025) · European journal of medical research · doi:10.1186/s40001-025-02886-9 · Cited by 111
“TREM2 normally functions as a negative regulator of neuroinflammation, suppressing pro-inflammatory cytokine secretion while promoting clearance of toxic aggregates [103].”
Filipello, F., You, S.-F., Mirfakhar, F. S., Mahali, S., Bollman, B., Acquarone, M., Korvatska, O., Marsh, J. A., Sivaraman, A., Martinez, R., et al. (2023) · Acta Neuropathologica · doi:10.1007/s00401-023-02568-y · Cited by 81
Fruhwürth, S., Zetterberg, H., & Paludan, S. R. (2024) · Journal of Neuroimmunology · doi:10.1016/j.jneuroim.2024.578342 · Cited by 77
“TREM2 controls key cellular functions in microglia such as phagocytosis (Kleinberger et al., 2014), migration (Mazaheri et al., 2017), and modulates inflammatory signaling (Liu et al., 2020).”
Diorio, C. J., Shraim, R., Myers, R. M., Behrens, E. M., Canna, S., Bassiri, H., Aplenc, R., Burudpakdee, C., Chen, F., DiNofia, A. M., et al. (2022) · Clinical Cancer Research · doi:10.1158/1078-0432.ccr-22-0822 · Cited by 75
Microglia, Trem2, and Neurodegeneration
Shi, Q., Gutierrez, R. A., & Bhat, M. A. (2025) · The Neuroscientist · doi:10.1177/10738584241254118 · Cited by 69
Magno, L., Bunney, T. D., Mead, E., Svensson, F., & Bictash, M. N. (2021) · Molecular Neurodegeneration · doi:10.1186/s13024-021-00436-5 · Cited by 64
“Indeed, in microglia, signalling through TREM2 typically dampens this pro-inflammatory response [33, 34].”
BackgroundThe Participation of Microglia in Neurogenesis: A Review
Pérez-Rodríguez, D. R., Blanco‐Luquin, I., & Mendióroz, M. (2021) · Brain Sciences · doi:10.3390/brainsci11050658 · Cited by 74
“Indeed, low TREM2 levels are associated with neurodegeneration [74].”
BackgroundKong, W., Frouard, J., Xie, G., Corley, M. J., Helmy, E. W., Zhang, G., Schwarzer, R., Montaño, M., Sohn, P., Roan, N. R., et al. (2024) · PNAS Nexus · doi:10.1093/pnasnexus/pgae179 · Cited by 71
“TREM2 deficiency enhances inflammation and impairs phagocytosis (42).”
BackgroundPlaque contact and unimpaired Trem2 is required for the microglial response to amyloid pathology
Wood, J. I., Wong, E., Joghee, R., Balbaa, A., Vitanova, K. S., Stringer, K. M., VanSchoiack, A., Phelan, S.-L. J., Launchbury, F., Desai, S., et al. (2022) · Cell Reports · doi:10.1016/j.celrep.2022.111686 · Cited by 65
“It has previously been reported that the Jackson Laboratories Trem2 KI mice show a substantial decrease in Trem2 expression in young mice to about 50% compared with WTmice and an even greater loss of protein in both whole brain or whole hippocampus.(4,23,24) We thus initially considered this to be a study of decreasin…”
BackgroundSelf-citationTREM2 Insufficiency Protects against Pulmonary Fibrosis by Inhibiting M2 Macrophage Polarization
Luo, Q., Deng, D., Li, Y., Shi, H., Zhao, J., Qian, Q., Wang, W., Cai, J., Yu, W., & Liu, J. (2023) · International Immunopharmacology · doi:10.1016/j.intimp.2023.110070 · Cited by 64
Inflammation: major denominator of obesity, Type 2 diabetes and Alzheimer’s disease-like pathology?
Kacířová, M., Zmeškalová, A., Kořínková, L., Železná, B., Kuneš, J., & Maletı́nská, L. (2020) · Clinical Science · doi:10.1042/cs20191313 · Cited by 56
Naler, L. B., Hsieh, Y.-P., Geng, S., Zhou, Z., Li, L., & Lu, C. (2022) · Communications Biology · doi:10.1038/s42003-022-03035-2 · Cited by 55
Khodadadi, H., Salles, É. L., Jarrahi, A., Costigliola, V., Khan, M. B., Yu, J. C.-K., Morgan, J. C., Hess, D. C., Vaibhav, K., Dhandapani, K. M., et al. (2021) · Journal of Alzheimer s Disease · doi:10.3233/jad-210026 · Cited by 52
“Inthebrain,TREM2ismainlyexpressed bymicrogliaandparticipatesintauandamyloid-(cid:2) pathogenesis [14, 15].”
Crosstalk between Microglia and Neurons in Neurotrauma: An Overview of the Underlying Mechanisms
Shaito, A. A., Kobeissy, F. H., Haidar, M. A., Ibeh, S., Shakkour, Z., Reslan, M. A., Nwaiwu, J. I., Moqidem, Y. A., Sader, G., Nickles, R. G., et al. (2021) · Current Neuropharmacology · doi:10.2174/1570159x19666211202123322 · Cited by 51
“These TREM-2 therapeutic effects can be explained by the recent discovery that Trem-2 triggers antiinflammatory effects in microglia and this function is inhibited under proinflammatory states, like in neuroinflammation, due to brain injury or disease [157].”
Alzheimer’s genes in microglia: a risk worth investigating
Sudwarts, A., & Thinakaran, G. (2023) · Molecular Neurodegeneration · doi:10.1186/s13024-023-00679-4 · Cited by 52
“Concordantly, Picalm expression in microglia is induced by anti-inflammatory IL4 treat-ment [81].”
BackgroundTranscriptional Networks of Microglia in Alzheimer’s Disease and Insights into Pathogenesis
Chew, G., & Petretto, E. G. (2019) · Genes · doi:10.3390/genes10100798 · Cited by 46
Tajbakhsh, A., Read, M. I., Barreto, G. E., Ávila-Rodriguez, M., Hayat, S. M. G., & Sahebkar, A. (2021) · European Journal of Pharmacology · doi:10.1016/j.ejphar.2021.173873 · Cited by 41
TPM1 mediates inflammation downstream of TREM2 via the PKA/CREB signaling pathway
Li, R., Zhang, J., Wang, Q., Cheng, M., & Lin, B. (2022) · Journal of Neuroinflammation · doi:10.1186/s12974-022-02619-3 · Cited by 41
“As an important innate immune receptor in the brain, TREM2 has previously been shown to promote proliferation, phagocytosis, and migration of microglia by induction and maintenance of microglial activation [12, 29, 33].”
BackgroundResultInfluentialRusso, C., Valle, M. S., Russo, A., & Malaguarnera, L. (2022) · International Journal of Molecular Sciences · doi:10.3390/ijms232113432 · Cited by 40
“Moreover, injured neurons promote the phagocytosis of apoptotic cells through the release of milk fat globule–epidermal growth factor 8 (MFG-E8) and the activation of CD47 [58].”
BackgroundTargeting Systemic Innate Immune Cells as a Therapeutic Avenue for Alzheimer Disease
Pons, V., & Rivest, S. (2022) · Pharmacological Reviews · doi:10.1124/pharmrev.121.000400 · Cited by 41
“This protein can complex with TREM2/DAP12 complex, which is strongly involved in the phagocytic response and the regulation of inflammation (Hayashi et al., 2004; Lanier 2009; W. Liu et al., 2020; Butler et al., 2021).”
BackgroundBarbalho, S. M., Boaro, B. L., Oliveira, J. D. S. C., Patočka, J., Lamas, C. B., Tanaka, M., & Laurindo, L. F. (2025) · Pharmaceuticals · doi:10.3390/ph18010133 · Cited by 46
“In addition to these receptors, others participate in this regulation, such as phosphatidylserine, scavenger, and Fc receptors [150–153].”
Jiang, W., Liu, F., Li, H., Wang, K., Cao, X., Xu, X., Zhou, Y., Zou, J., Zhang, X., & Cui, X. (2022) · NeuroToxicology · doi:10.1016/j.neuro.2022.04.005 · Cited by 38
Modulating Neuroinflammation as a Prospective Therapeutic Target in Alzheimer’s Disease
Lee, E., & Chang, Y. (2025) · Cells · doi:10.3390/cells14030168 · Cited by 39
“In particular, the anti-inflammatory response induced by IL-4 is weakened due to the reduction in TREM2 expression [194].”
Lu, Y., Hao, R., Hu, Y., Wei, Y., Xie, Y., Shen, Y., Rui, Q., & Yu, G. (2021) · Chemico-Biological Interactions · doi:10.1016/j.cbi.2021.109653 · Cited by 35
Microglial TREM2 in amyotrophic lateral sclerosis
Xie, M., Zhao, S., Bosco, D. B., Nguyen, A. T., & Wu, L. (2021) · Developmental Neurobiology · doi:10.1002/dneu.22864 · Cited by 35
He, C., Chen, B., Yang, H., & Zhou, X. (2025) · Frontiers in Aging Neuroscience · doi:10.3389/fnagi.2025.1554398 · Cited by 40
Pang, X., Chu, Y., Zhou, L., Chen, M., You, Y., Tang, Y., Yang, S., Zhang, H., Xiao, J., Deng, G., et al. (2023) · Journal of Neurochemistry · doi:10.1111/jnc.15987 · Cited by 33
“Trem2 is a membrane-traversing protein from the immunoglobulin superfamily, expressed on macrophages, dendritic cells, and other cell types derived from the myeloid lineage (Liu et al., 2020).”
BackgroundClinical impact of anti-inflammatory microglia and macrophage phenotypes at glioblastoma margins
Noorani, I., Šidlauskas, K., Pellow, S., Savage, R., Norman, J. L., Chatelet, D. S., Fabian, M., Grundy, P., Ching, J., Nicoll, J. A. R., et al. (2023) · Brain Communications · doi:10.1093/braincomms/fcad176 · Cited by 31
“28,56 CD163 and CD206 are more specific for perivascular macrophages in the brain and associated with an anti-inflammatory profile.”
Bhusal, A., Kim, J., Kim, S.-C., Hwang, E. M., Ryu, H., Ali, M. S., Park, S., Lee, W., & Suk, K. (2024) · Cell Reports · doi:10.1016/j.celrep.2024.113813 · Cited by 29
Impaired microglial phagocytosis promotes seizure development
Bosco, D. B., Křemen, V., Haruwaka, K., Zhao, S., Wang, L., Ebner, B. A., Zheng, J., Xie, M., Dheer, A., Perry, J. F., et al. (2024) · Brain Behavior and Immunity · doi:10.1016/j.bbi.2024.09.034 · Cited by 31
Lish, A. M., Ashour, N., Pearse, R. V., Galle, P. C., Orme, G. A., Heuer, S. E., Benoit, C. R., Alexander, K. D., Grogan, E. F. L., Terzioğlu, G., et al. (2025) · Cell Reports · doi:10.1016/j.celrep.2025.115777 · Cited by 35
“Given the dynamic nature of TREM2 in vivo and its response to inflammatory signals, 56,57 we determined whether enhancing astrocyte reactivity could affect TREM2 expression.”
Microglia in ALS: Insights into Mechanisms and Therapeutic Potential
Bond, S., Saxena, S., & Sierra-Delgado, J. A. (2025) · Cells · doi:10.3390/cells14060421 · Cited by 32
“Studies have shown that TREM2-deficient mice exhibit increased motor neuron degeneration, heightened neuroinflammation, and enhanced microglial activation, suggesting that TREM2 may play a protective role in ALS [76].”
Hypothalamic Microglial Heterogeneity and Signature under High Fat Diet–Induced Inflammation
Mendes, N. F., Jara, C. P., Zanesco, A. M., & ARAUJO, E. P. D. (2021) · International Journal of Molecular Sciences · doi:10.3390/ijms22052256 · Cited by 28
Mali, A. S., & Novotný, J. (2022) · Molecular and Cellular Neuroscience · doi:10.1016/j.mcn.2022.103744 · Cited by 28
Lipid metabolism and neuroinflammation: What is the link?
Tiwari, V., & Simons, M. (2025) · The Journal of Experimental Medicine · doi:10.1084/jem.20241232 · Cited by 39
Roles of TREM2 in Alzheimer’s disease
Qi, X., Zhu, K., Ke, W., Wang, J., Mao, S., & Chen, G. (2025) · Translational Neurodegeneration · doi:10.1186/s40035-025-00515-3 · Cited by 38
“3) [107, 120, 121].”
Hu, Y., Li, C., Wang, X., Chen, W., Yu, Q., & Dai, X. (2021) · Frontiers in Cell and Developmental Biology · doi:10.3389/fcell.2021.693342 · Cited by 27
“Strikingly, it has also been reported that the anti-inflammation effect of TREM2 in microglia could be partly suppressed by lipopolysaccharide (LPS) administration (Liu et al., 2020).”
BackgroundChen, W.-F., Shih, Y., Liu, H.-C., Cheng, C., Chang, C., Chen, C., Lin, I.-P., Lin, M.-Y., & Lee, C. (2022) · Phytomedicine · doi:10.1016/j.phymed.2022.154025 · Cited by 27
TREM2 regulates microglial phagocytosis of synapses in innate immune tolerance
Meng, J., Han, L., Xu, H., Zhang, L., Liu, Z., Zhou, Y., Zhang, X., Luo, H., & Zhang, Y. (2023) · International Immunopharmacology · doi:10.1016/j.intimp.2023.111445 · Cited by 25
Orchestration of antiviral responses within the infected central nervous system
Pavlou, A., Mulenge, F., Gern, O. L., Busker, L. M., Greimel, E., Waltl, I., & Kalinke, U. (2024) · Cellular and Molecular Immunology · doi:10.1038/s41423-024-01181-7 · Cited by 24
Sideris-Lampretsas, G., Oggero, S., Zeboudj, L., Silva, R., Bajpai, A., Dharmalingam, G., Collier, D. A., & Malcangio, M. (2023) · Nature Communications · doi:10.1038/s41467-023-39077-1 · Cited by 26
Gallo, C., Manzo, E., Barra, G., Fioretto, L., Ziaco, M., Nuzzo, G., d’Ippolito, G., Ferrera, F., Contini, P., Castiglia, D., et al. (2022) · Cellular and Molecular Life Sciences · doi:10.1007/s00018-022-04297-z · Cited by 23
“At this concentration, the level of the detectable receptor was as low as the levels observed after treatment of DCs by the TLR-4 agonist LPS, which is known to induce TREM2 suppression in microglia [35].”
BackgroundLee, J. H., Lee, B. H., Jeong, S., Joh, C. S.-Y., Nam, H. J., Choi, H. S., Sserwadda, H., Oh, J. W., Park, C., Jin, S., et al. (2023) · Genomics & Informatics · doi:10.5808/gi.23009 · Cited by 23
Zhang, X., Chen, X., Zhang, L., Sun, Y., Liang, Y., Li, H., & Zhang, Y. (2023) · Neurochemistry International · doi:10.1016/j.neuint.2023.105639 · Cited by 23
Liu, C., & Zhou, X. (2024) · Cell Biochemistry and Biophysics · doi:10.1007/s12013-024-01520-5 · Cited by 22
“The current academic views have supported the protective role of TREM2 in proin fl ammatory signaling in microglia [31, 32].”
Essex, A. L., Huot, J. R., Deosthale, P. J., Wagner, A., Figueras, J. H., Davis, A., Damrath, J. G., Pin, F., Wallace, J. M., Bonetto, A., et al. (2020) · Journal of Bone and Mineral Research · doi:10.1002/jbmr.4572 · Cited by 20
“TREM2 is used by microglia for synaptic pruning and in macrophages to aid in phagocytosis and inflammatory response.((17-19)) Additionally, TREM2 has been shown to contribute to the neuroinflammation that occurs during AD by altering microglial function.”
MethodYang, X., Wang, J., Jia, X.-T., Yang, Y., Fang, Y., Ying, X., Li, H., Zhang, M., Wei, J., & Pan, Y. (2025) · Journal of Alzheimer s Disease · doi:10.1177/13872877241313223 · Cited by 22
Marsland, P., Vore, A. S., DaPrano, E. M., Paluch, J. M., Blackwell, A. A., Varlinskaya, E. I., & Deak, T. (2022) · Alcohol · doi:10.1016/j.alcohol.2022.08.013 · Cited by 19
iPSC-derived PSEN2 (N141I) astrocytes and microglia exhibit a primed inflammatory phenotype
Sullivan, M. A., Lane, S. D., McKenzie, A. D. J., Ball, S. R., Sunde, M., Neely, G. G., Moreno, C. L., Maximova, A., Werry, E. L., & Kassiou, M. (2024) · Journal of Neuroinflammation · doi:10.1186/s12974-023-02951-2 · Cited by 23
“Altered expression of IBA1 and TREM2 within microglia play a role in regulating cellular activation and inflammatory cytokine release [36, 37].”
BackgroundTian, Y., Xiao, X., Liu, W., Cheng, S., Qian, N., Wang, L., Liu, Y., Ai, R., & Zhu, X. (2024) · Molecular Brain · doi:10.1186/s13041-024-01081-x · Cited by 20
“Liu et al. reported that the knockdown of TREM2 weakened the response of microglia to IL-4, and TREM2 participated in the pathological process of Alzheimer’s disease by promoting the phenotype polarization of microglia to anti-inflammatory phenotype [24].”
BackgroundSelf-citationDecoding NLRP3 Inflammasome Activation in Alzheimer’s Disease: A Focus on Receptor Dynamics
Maurya, R., Sharma, A., & Naqvi, S. (2025) · Molecular Neurobiology · doi:10.1007/s12035-025-04918-1 · Cited by 22
“However, in the absence of functional TREM2, unchecked TLR activation leads to excessive inflammation and contributes to AD pathology [97, 106, 107].”
Mitochondrial immunometabolism in sepsis: orchestrating macrophage polarization and dysfunction
Yang, K., Zhao, Q., Sun, Y., Li, L., & Han, X. (2025) · European journal of medical research · doi:10.1186/s40001-025-03590-4 · Cited by 28
“Surface receptors such as triggering receptor expressed on myeloid cells 2 (TREM2) and intracellular factors like sirtuin 3 (SIRT3) and peroxisome proliferator-activated receptor γ (PPARγ) shift macrophages toward a more anti-inflammatory or suppressive phenotype [31, 32].”
Regulation of TREM2 on BV2 inflammation through PI3K/AKT/mTOR pathway
Li, L., Chen, Q., Qin, Y., Yu, G., Qi, T., Sui, H., Qi, X., & Huang, L. (2023) · Biotechnology and Genetic Engineering Reviews · doi:10.1080/02648725.2023.2204719 · Cited by 18
“In the primary microglia of mice, the expression of TREM2 is reduced under the stimulation of lipopolysaccharide (LPS) (W. Liu et al., 2020), but there are also literatures that the induction of LPS can increase the expression of TREM2 (Fang et al., 2020).”
Piper, J. A., Hammouri, N. A., Jansen, M. I., et al. (2023) · Molecules · doi:10.3390/molecules28124808 · Cited by 16
“Additionally, we also investigated the expression levels of TREM2 mRNAs, whose expression is repressed in microglia upon exposure to pro-inflammatory stimuli [25].”
BackgroundPeng, X., Guo, H.-S., Zhang, X., Wu, X., Ruganzu, J. B., Wu, S., Zhao, M.-T., Li, L., Yang, Y., Ji, S., et al. (2025) · Experimental Neurology · doi:10.1016/j.expneurol.2025.115205 · Cited by 17
Martínez-Meza, S., Premeaux, T. A., Cirigliano, S. M., Friday, C., Michael, S., Mediouni, S., Valente, S. T., Ndhlovu, L. C., Fine, H. A., O’Brien, R. L. F., et al. (2025) · Journal of Neuroinflammation · doi:10.1186/s12974-025-03375-w · Cited by 16
“As TREM2 expression is known to be very dynamic, this heterogeneity is not unexpected [65].”
Yu, T., Fu, H. Q., Sun, J., Ding, D., & Wang, H. (2021) · Experimental Brain Research · doi:10.1007/s00221-021-06208-3 · Cited by 16
Liang, N., Harsch, B. A., Zhou, S., Borkowska, A. G., Shearer, G. C., Kaddurah‐Daouk, R., Newman, J. W. I., & Borkowski, K. (2023) · Progress in Lipid Research · doi:10.1016/j.plipres.2023.101265 · Cited by 15
Jain, S., Bhushan, B., Mishra, A. K., & Singh, R. (2024) · Journal of Drug Delivery Science and Technology · doi:10.1016/j.jddst.2024.106413 · Cited by 17
Lee, C.-Y., Riffle, D., Xiong, Y., Momtaz, N., Lei, Y., Pariser, J. M., Sikdar, D., Hwang, A., Duan, Z., & Zhang, J. (2024) · BMC Neuroscience · doi:10.1186/s12868-024-00867-y · Cited by 17
“TREM2 expression in microglia and macrophages results in decreased phagocytosis of apoptotic neurons, increasing Aβ accumulation in AD Phenotype [46, 64, 65].”
BackgroundThe triggering receptor expressed on myeloid cells 2–apolipoprotein E signaling pathway in diseases
Lyu, S., Lan, Z., & Li, C. (2023) · Chinese Medical Journal · doi:10.1097/cm9.0000000000002167 · Cited by 13
“Triggering receptor expressed on myeloid cells 2 (TREM2) plays an important role in the regulation of life activities of many cells, including survival,([1,2]) proliferation,([3,4]) differentiation, phagocytosis,([1,5-7]) and inflammatory response.([8-10]) TREM2 can recognize different ligands of apoptotic cells, phos…”
BackgroundLuo, H., Zhang, C., He, L., Lin, Z., Zhang, J., Qi, Q., Chen, J., & Yao, W. (2023) · Psychopharmacology · doi:10.1007/s00213-023-06415-6 · Cited by 14
“Elevated expression of TREM2 could promote the expression of anti-inflammatory microglia (He et al. 2022; Liu et al. 2020).”
BackgroundRare variant aggregation in 148,508 exomes identifies genes associated with proxy dementia
Wightman, D. P., Savage, J. E., de Leeuw, C., Jansen, I. E., & Posthuma, D. (2023) · Scientific Reports · doi:10.1038/s41598-023-29108-8 · Cited by 12
Lok, H. C., Katzeff, J. S., Hodges, J. R., Piguet, O., Fu, Y., Halliday, G. M., & Kim, W. S. (2023) · Scientific Reports · doi:10.1038/s41598-023-35945-4 · Cited by 12
Nef mediates neuroimmune response, myelin impairment, and neuronal injury in EcoHIV-infected mice
Schenck, J. K., Paredes, C. C., Pushkarsky, T., Wang, Y., Miller, R. H., & Bukrinsky, M. (2024) · Life Science Alliance · doi:10.26508/lsa.202402879 · Cited by 13
Farzan, M., Rounkian, M. S., Rizi, A. A., Heidari, Z., Farzan, M., Fathi, M., Aghaei, A., Azadegan‐Dehkordi, F., & Bagheri, N. (2024) · Experimental Neurology · doi:10.1016/j.expneurol.2024.115071 · Cited by 15
Galizzi, G., Deidda, I., Amato, A., Calvi, P., Terzo, S., Caruana, L., Scoglio, S., Mulè, F., & Carlo, M. D. (2023) · International Journal of Molecular Sciences · doi:10.3390/ijms24054731 · Cited by 14
“Several studies have demonstrated that TREM2 protects against neurodegeneration by controlling neuroinflammation closely related to the pathogenesis of AD and obesity [50].”
BackgroundAshford, B., Simpson, J. E., Dawson, C., Boche, D., Cooper‐Knock, J., Heath, P. R., Fillingham, D. J., Appleby‐Mallinder, C., Wei, W., Dunning, M., et al. (2025) · Brain Pathology · doi:10.1111/bpa.70019 · Cited by 13
Vasilopoulou, F., Piers, T. M., Wei, J., Hardy, J., & Pocock, J. M. (2024) · FEBS Journal · doi:10.1111/febs.17353 · Cited by 17
“…pro-inflammatory conditions, such as LPS/IFN-c stimulation, have been previously shown to reduce TREM2 expression — resulting in decreased sTREM2 release and detection [59] — we further evaluated sTREM2 shedding after blocking glycolysis with 2-DG and found that its levels correspondingly increased.”
Self-citationBuchman, A. S., Yu, L., Klein, H., Zammit, A. R., Oveisgharan, S., Grodstein, F., Tasaki, S., Levey, A. I., Seyfried, N. T., & Bennett, D. A. (2022) · The Journals of Gerontology Series A · doi:10.1093/gerona/glac105 · Cited by 13
Metabolic Flexibility of Microglia: Energy Substrate Utilization and Impact on Neuronal Metabolism
Westi, E. W., Carlsen, R. B., Andersen, J. V., Kilic, Z., Alnajar, D., Holmgaard, N. K., Sintes, B. G., Cota-Coronado, A., Muñoz, S. S., Galvagnion, C., et al. (2025) · Journal of Neurochemistry · doi:10.1111/jnc.70304 · Cited by 12
“Interestingly, lower amounts of GABA and taurine were detected in LPS-stimulated microglia compared to control microglia, while no changes were observed in the amounts of glutamate and glutamine (Table 2).”
Monoallelic TYROBP deletion is a novel risk factor for Alzheimer’s disease
Martiskainen, H., Willman, R.-M., Harju, P., Heikkinen, S., Heiskanen, M., Müller, S. A., Sinisalo, R., Takalo, M., Mäkinen, P. M., Kuulasmaa, T., et al. (2025) · Molecular Neurodegeneration · doi:10.1186/s13024-025-00830-3 · Cited by 14
“One of the functions of TREM2-DAP12 pathway in microglia is to promote anti-inflammatory signaling [56].”
Shin, H. J., Jin, Z. H., An, H. S., Park, K. A., Lee, J. Y., Lee, S. J., Jang, H. M., Jeong, E. A., Kim, K. E., Lee, J. W., et al. (2022) · Brain Sciences · doi:10.3390/brainsci12070878 · Cited by 11
“However, TREM2 signaling appears to have both pro- and antiinflammatory effects in AD [36].”
Backgroundde Sousa, J. A. C., Azul, F. V. C. S., de Araújo, A. B., Tomé, R. C., Silva, F. R. M., Vasconcelos, S. M. M., Rios, F. J. O., & Leal, L. K. A. M. (2023) · Oxidative Medicine and Cellular Longevity · doi:10.1155/2023/4752502 · Cited by 10
Avalos, B., Kulbe, J. R., Ford, M. K., Laird, A. E., Walter, K., Mante, M., Florio, J. B., Boustani, A., Chaillon, A., Schlachetzki, J. C. M., et al. (2024) · Viruses · doi:10.3390/v16101509 · Cited by 11
“Moreover, CBD treatment mitigated the IL1B-induced downregulation of TREM2, which may reduce the impact of inflammatory stimuli in the brain [124].”
BackgroundLi, X., Wang, J., Liao, C., Yang, X., Zhao, Z., Liu, Y., Xue, Q., Luo, Y., Liu, X., & Liu, Z. (2024) · The FASEB Journal · doi:10.1096/fj.202300152rr · Cited by 9
“22,23 Next, we included anti- IL-6 antibodies and APTSTAT3-9R to assess their impact on GLUT3 and TREM2.”
MethodSchwarz, H., Bässler, S., Balta, D., Socher, E., Zunke, F., & Arnold, P. (2022) · Behavioural Brain Research · doi:10.1016/j.bbr.2022.113977 · Cited by 8
Mikolášková, I., Zvarík, M., Szabóová, K., Tibenská, E., Ďurmanová, V., Suchánková, M., Kollárik, B., Hesko, P., Palacka, P., Bucová, M., et al. (2024) · International Journal of Molecular Sciences · doi:10.3390/ijms252312765 · Cited by 10
Targeting Gene C9orf72 Pathogenesis for Amyotrophic Lateral Sclerosis
Chong, Z. Z., & Souayah, N. (2025) · International Journal of Molecular Sciences · doi:10.3390/ijms26094276 · Cited by 11
“IL-1 β can activate A Disintegrin and Metallopro-teinase 10 (ADAM10) to increase the cleavage of triggering receptors expressed in myeloid cells 2 (TREM2) [61], which plays an important role in the anti-inflammatory response in microglia [62].”
Decoding of the Role of TREM2 in Neuropathic Pain: Molecular Pathway and Neuroinflammatory Mechanism
Vijayan, N., Veeraveedu, P. T., & Patel, S. (2025) · Drug Development Research · doi:10.1002/ddr.70111 · Cited by 10
“Microglia were stimulated with LPS to promote a pro ‐ inflammatory response or with IL ‐ 4 to induce an anti ‐ inflammatory state (Liu, Taso et al. 2020; Erdener et al. 2021).”
Cosma, N. C., Eren, N., Üsekes, B., Gerike, S., Heuser, I., Peters, O., & Hellmann‐Regen, J. (2023) · Cellular and Molecular Neurobiology · doi:10.1007/s10571-023-01351-7 · Cited by 10
Unveiling the impact of TREM-2+ Macrophages in metabolic disorders
Contreras, M., Matos, A. D. O., Dantas, P. H. D. S., Neto, J. R. D. C., Silva‐Sales, M., & Sales‐Campos, H. (2024) · Cellular Immunology · doi:10.1016/j.cellimm.2024.104882 · Cited by 10
Qiu, Z., Wang, H., Qu, M., Zhu, S., Zhang, H., Liao, Q., & Miao, C. (2023) · Brain Sciences · doi:10.3390/brainsci13010126 · Cited by 8
“Notably, TREM2 was able to promote the expression of M2 markers, such as Arg-1, and promote the polarization of microglia towards the M2 phenotype [13].”
BackgroundInfluentialAlonaizan, R., Alotaibi, W. K., Alsulami, A., Alkhulaifi, F. M., & Alomar, S. Y. (2024) · Immunological Investigations · doi:10.1080/08820139.2024.2440006 · Cited by 8
“The M2 also can impair synaptic plasticity, including long-318 term potentiation, leading to learning and memory deficits characteristic of Perioperative Neurocognitive deficits (Wang et al., 2020).”
Jang, B.-K., Shin, S. J., Park, H. H., Kumar, V., Park, Y., Kim, J. Y., Kang, H., Park, S. Y., Kwon, Y., Shin, S.-E., et al. (2024) · Pharmaceutics · doi:10.3390/pharmaceutics17010013 · Cited by 7
“The upregulation of TREM2 observed during the transition of microglia from the M1 to the M2 phenotype indicates that TREM2 may serve as a potential marker for identifying the M2 phenotype of microglia [57].”
Prókai-Tátrai, K., Zaman, K., Kapic, A., Hogan, K., Sánchez-Rodríguez, G., Silverio, A. E., Nguyen, V., Prókai, L., & Feola, A. (2025) · International Journal of Molecular Sciences · doi:10.3390/ijms26051846 · Cited by 7
“…IPA ® , protein–interaction network, upregulation of anti-inflammatory proteins, such as triggering receptor expressed on myeloid cells 2 (TREM2), dihydropyrimidinase-related protein 3 (DPYSL3), and signal transducer and activator of transcription 3 (STAT3), was regulated by E2 [72–74] (Figure 5a).”
Metadata
- Authors
- Liu, W., Taso, O., Wang, R., Bayram, S., Graham, A. C., Garcia-Reitboeck, P., Mallach, A., Andrews, W. D., Piers, T. M., Botia, J. A., Pocock, J. M., Cummings, D. M., Hardy, J., Edwards, F. A., & Salih, D. A.
- Affiliations
- University College London (GB)
- UK Dementia Research Institute (GB)
- Hitachi Rail Europe Ltd, London EC1N 2PB, UK
- UCL Queen Square Institute of Neurology (GB)
- Department of Information and Communications Engineering, Universidad de Murcia, Murcia E-30100, Spain
- Corresponding author
- Salih, Dervis A
- ORCID
- Venue
- Human Molecular Genetics
- Publisher
- Oxford University Press (OUP)
- Published
- 2020-09-22
- Volume
- 29
- Issue
- 19
- Pages
- 3224-3248
- ISSN
- 0964-6906 (ISSN-L)
- 1460-2083
- PMC
- PMC7689298
- OpenAlex
- W3087562324
- Semantic Scholar
- 5497aa312aaaa12d27ea668158ff648a6d0d0ead
- Cited by
- 214
- References
- 124
- Citations by year
- 2026: 35 · 2025: 61 · 2024: 31 · 2023: 33 · 2022: 32 · 2021: 19 · 2020: 2
- FWCI
- 8.41
- Type
- journal article
- Language
- en
- Open access
- hybrid
- doi.org
- Licence
- Locations
- Human Molecular Genetics (publishedVersion, cc-by)
- bioRxiv (Cold Spring Harbor Laboratory) (acceptedVersion)
- PubMed Central (publishedVersion, cc-by)
- PubMed (publishedVersion)
- UCL Discovery (University College London) (submittedVersion)
- Funders
- Alzheimer's Research Foundation (ARUK-SRF2013-7, ARUK-PG2019B-018)
- Biotechnology and Biological Sciences Research Council (BB/M009513/1)
- Topics
- Life Sciences › Neuroscience › Neurology › Neuroinflammation and Neurodegeneration Mechanisms
- Life Sciences › Immunology and Microbiology › Immunology › Phagocytosis and Immune Regulation
- Life Sciences › Neuroscience › Cellular and Molecular Neuroscience › Alzheimer's disease research and treatments
- Keywords
- TREM2, microglia, anti-inflammatory response, pro-inflammatory response, IL-4 signaling, lipopolysaccharide, STAT6, Arg1, microglial density, hippocampus, neuroinflammation, neurodegeneration
- MeSH terms
- RNA-Seq, Animals, Animals, Newborn, Gene Expression Regulation, Inflammation, Membrane Glycoproteins, Mice, Inbred C57BL, Mutation, Receptors, Immunologic, Microglia, Mice, Knockout, Inflammation Mediators, STAT6 Transcription Factor, Mice, Transcriptome
About these checks
Registry, retraction, Cites and statistics results are computed, not judged, with one exception: a printed reference that no index lists is read once by a model before it counts as a citation error. Claims are extracted by a model and kept only when their quote appears verbatim in the text; each cited source is then checked, with a model’s help, for whether it says what the claim relies on. Those verdicts can be wrong — read the claim’s quote and the cited source before relying on one.
A language model drew the claims from the paper on 2026-10-10, under version 3 of the claim definition (model deepseek-v4.1-flash, prompt extract-v3).
A second model labelled each claim on 2026-10-10 (model jev-1.13-20260917, definition revision gold-guideline-v0.2).
Cited sources are checked with a language model’s help (gpt-6-sol).
Statistics and arithmetic are recomputed, not judged.
Confidence bands are shown only for fields calibrated on our annotated test set. None is calibrated yet, so no band is shown.
What counts as a claim ›How we measure confidence ›How we check this ›
Are you an author, or do you see a problem with this page? Request a review
