

The DOI matches its Crossref record; 50 of the 51 references it cites were found in a registry or an index.
Pharos 2023: an integrated resource for the understudied human proteome
Open accessAbstract
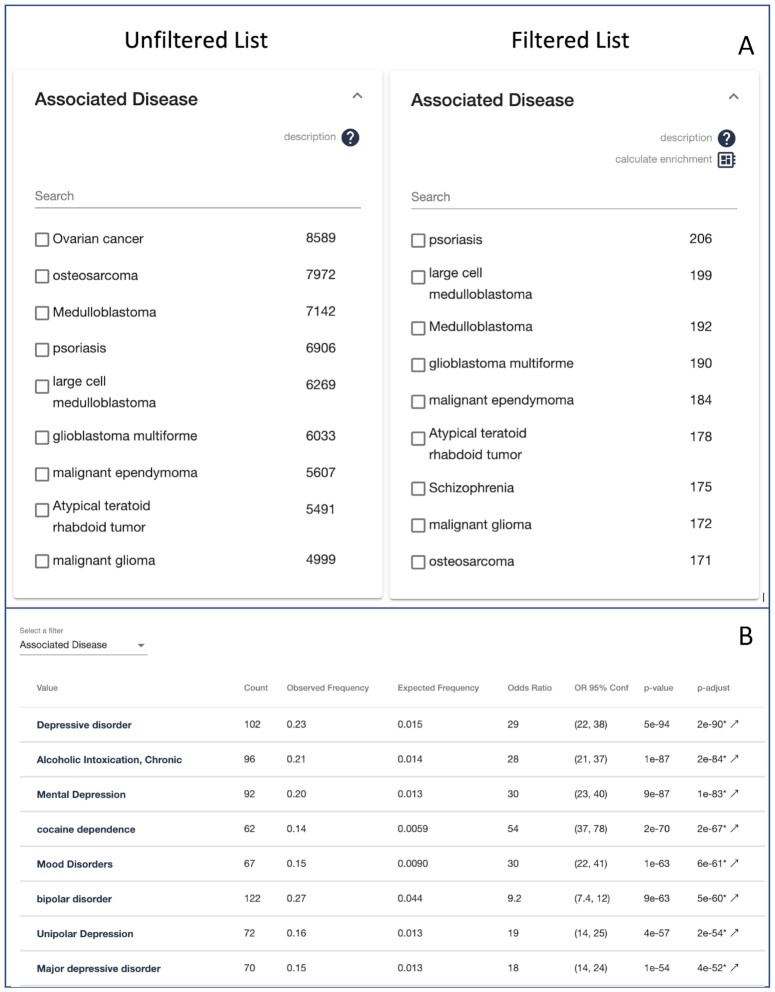
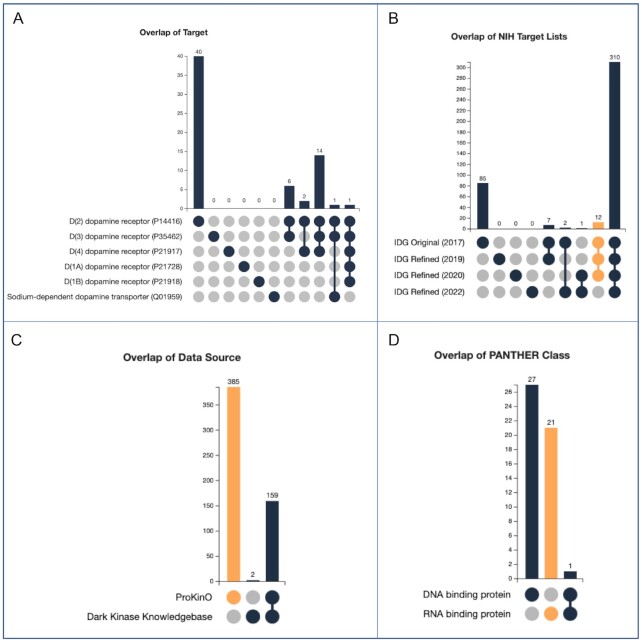
The Illuminating the Druggable Genome (IDG) project aims to improve our understanding of understudied proteins and our ability to study them in the context of disease biology by perturbing them with small molecules, biologics, or other therapeutic modalities. Two main products from the IDG effort are the Target Central Resource Database (TCRD) (http://juniper.health.unm.edu/tcrd/), which curates and aggregates information, and Pharos (https://pharos.nih.gov/), a web interface for users to extract and visualize data from TCRD. Since the 2021 release, TCRD/Pharos has focused on developing visualization and analysis tools that help reveal higher-level patterns in the underlying data. The current iterations of TCRD and Pharos enable users to perform enrichment calculations based on subsets of targets, diseases, or ligands and to create interactive heat maps and UpSet charts of many types of annotations. Using several examples, we show how to address disease biology and drug discovery questions through enrichment calculations and UpSet charts.
Overview
The claims and statistics of this paper haven’t been checked yet.
Run the check — free, no account needed. It reads the open-access text and checks the sources it cites.
Integrity signals
Registry
Cites
Statistics
Figures
Verification
Claims the paper makes
The claims and statistics of this paper haven’t been checked yet.
Run the check — free, no account needed. It reads the open-access text and checks the sources it cites.
Claims other papers make about this one
Each is checked against this paper’s own text: does it say what the citing paper says it does?
The source backs part of the claim, not all of it — or backs it for a different population, condition or comparison.
In the citing paper
“Combined with AI-based systems that predict protein structures, such as AlphaFold (23) and RoseTTafold (24), these resources are poised to accelerate AI4DD.”
From Artificial Intelligence for Drug Discovery: Are We There Yet? (2024) · cites this paper as [23]
Experimental — accuracy not yet measured
Self-check
Percentages, sums and reported differences re-computed from the paper’s own numbers.
The self-check needs the paper’s full text.
Citations
Cites
Basic local alignment search tool
Altschul, S. F., Gish, W., Miller, W., Myers, E. W., & Lipman, D. J. (1990) · Journal of Molecular Biology · doi:10.1006/jmbi.1990.9999 · Cited by 98,669
Highly accurate protein structure prediction with AlphaFold
Jumper, J., Evans, R., Pritzel, A., Green, T., Figurnov, M., Ronneberger, O., Tunyasuvunakool, K., Bates, R., Žídek, A., Potapenko, A., et al. (2021) · Nature · doi:10.1038/s41586-021-03819-2 · Cited by 43,764
Gene Ontology: tool for the unification of biology
Ashburner, M., Ball, C. A., Blake, J. A., Botstein, D., Butler, H., Cherry, J. M., Davis, A. P., Dolinski, K., Dwight, S. S., Eppig, J. T., et al. (2000) · Nature Genetics · doi:10.1038/75556 · Cited by 43,206
Berman, H. M. (2000) · Nucleic Acids Research · doi:10.1093/nar/28.1.235 · Cited by 40,196
Szklarczyk, D., Gable, A. L., Lyon, D., Junge, A., Wyder, S., Huerta-Cepas, J., Simonovic, M., Doncheva, N. T., Morris, J. H., Bork, P., et al. (2019) · Nucleic Acids Research · doi:10.1093/nar/gky1131 · Cited by 17,749
Self-citationHuang, D. W., Sherman, B. T., & Lempicki, R. A. (2009) · Nucleic Acids Research · doi:10.1093/nar/gkn923 · Cited by 14,108
Varadi, M., Anyango, S., Deshpande, M., Nair, S., Natassia, C., Yordanova, G., Yuan, D., Stroe, O., Wood, G., Laydon, A., et al. (2022) · Nucleic Acids Research · doi:10.1093/nar/gkab1061 · Cited by 7,850
UniProt: the universal protein knowledgebase in 2021
The UniProt Consortium, Bateman, A., Martin, M.-J., Orchard, S., Magrane, M., Agivetova, R., Ahmad, S., Alpi, E., Bowler-Barnett, E. H., Britto, R., et al. (2021) · Nucleic Acids Research · doi:10.1093/nar/gkaa1100 · Cited by 6,372
The Reactome pathway Knowledgebase
Fabregat, A., Sidiropoulos, K., Garapati, P., Gillespie, M., Hausmann, K., Haw, R., Jassal, B., Jupe, S., Korninger, F., McKay, S., et al. (2016) · Nucleic Acids Research · doi:10.1093/nar/gkv1351 · Cited by 5,605
The GTEx Consortium atlas of genetic regulatory effects across human tissues
The GTEx Consortium, Aguet, F., Anand, S., Ardlie, K. G., Gabriel, S., Getz, G. A., Graubert, A., Hadley, K., Handsaker, R. E., Huang, K. H., et al. (2020) · Science · doi:10.1126/science.aaz1776 · Cited by 5,547
The unified medical language system (UMLS): integrating biomedical terminology
Bodenreider, O. (2004) · Nucleic Acids Research · doi:10.1093/nar/gkh061 · Cited by 4,356
Buniello, A., MacArthur, J. A. L., Cerezo, M., Harris, L. W., Hayhurst, J., Malangone, C., McMahon, A., Morales, J., Mountjoy, E., Sollis, E., et al. (2019) · Nucleic Acids Research · doi:10.1093/nar/gky1120 · Cited by 4,000
The Gene Ontology resource: enriching a GOld mine
The Gene Ontology Consortium, Carbon, S., Douglass, E., Good, B. M., Unni, D. R., Harris, N. L., Mungall, C. J., Basu, S., Chisholm, R. L., Dodson, R. J., et al. (2021) · Nucleic Acids Research · doi:10.1093/nar/gkaa1113 · Cited by 3,555
KEGG: integrating viruses and cellular organisms
Kanehisa, M., Furumichi, M., Sato, Y., Ishiguro-Watanabe, M., & Tanabe, M. (2021) · Nucleic Acids Research · doi:10.1093/nar/gkaa970 · Cited by 3,436
A comprehensive map of molecular drug targets
Santos, R., Ursu, O., Gaulton, A., Bento, A. P., Donadi, R. S., Bologa, C. G., Karlsson, A., Al-Lazikani, B., Hersey, A., Oprea, T. I., et al. (2017) · Nature Reviews Drug Discovery · doi:10.1038/nrd.2016.230 · Cited by 2,427
Self-citationGaulton, A., Hersey, A., Nowotka, M., Bento, A. P., Chambers, J. K., Méndez, D., Mutowo, P., Atkinson, F. L., Bellis, L. J., Cibrián–Uhalte, E., et al. (2016) · Nucleic Acids Research · doi:10.1093/nar/gkw1074 · Cited by 2,394
UpSet: Visualization of Intersecting Sets
Lex, A., Gehlenborg, N., Strobelt, H., Vuillemot, R., & Pfister, H. (2014) · IEEE Transactions on Visualization and Computer Graphics · doi:10.1109/tvcg.2014.2346248 · Cited by 2,340
A draft map of the human proteome
Kim, M.-S., Pinto, S. M., Getnet, D., Nirujogi, R. S., Manda, S. S., Chaerkady, R., Madugundu, A. K., Kelkar, D. S., Isserlin, R., Jain, S., et al. (2014) · Nature · doi:10.1038/nature13302 · Cited by 2,198
The reactome pathway knowledgebase
Jassal, B., Matthews, L. R., Viteri, G., Gong, C., Lorente, P., Fabregat, A., Sidiropoulos, K., Cook, J., Gillespie, M. E., Haw, R., et al. (2019) · Nucleic Acids Research · doi:10.1093/nar/gkz1031 · Cited by 2,183
Why is Tanimoto index an appropriate choice for fingerprint-based similarity calculations?
Bajusz, D., Rácz, A., & Héberger, K. (2015) · Journal of Cheminformatics · doi:10.1186/s13321-015-0069-3 · Cited by 1,646
The human protein atlas: a spatial map of the human proteome
Thul, P. J., & Lindskog, C. (2018) · Protein Science · doi:10.1002/pro.3307 · Cited by 1,299 · cited 1×
“…the last update include: • Expression data: A streamlined, up-to-date dataset (see Methods) is displayed, and distinctions are made between data sources that report protein expression (32,33), RNA expression (32,34), and an aggregate score based on a mix of literature and expression data (35).”
High-throughput discovery of novel developmental phenotypes
The International Mouse Phenotyping Consortium, Dickinson, M. E., Flenniken, A. M., Ji, X., Teboul, L., Wong, M. D., White, J. K., Meehan, T. F., Weninger, W. J., Westerberg, H., et al. (2016) · Nature · doi:10.1038/nature19356 · Cited by 1,196
Disease Ontology: a backbone for disease semantic integration
Schriml, L. M., Arze, C., Nadendla, S., Chang, Y.-W. W., Mazaitis, M., Felix, V., Feng, G., & Kibbe, W. A. (2012) · Nucleic Acids Research · doi:10.1093/nar/gkr972 · Cited by 929
McKusick, V. A. (1998) · Johns Hopkins University Press eBooks · doi:10.56021/9780801857423 · Cited by 762
Yekutieli, D., & Benjamini, Y. (1999) · Journal of Statistical Planning and Inference · doi:10.1016/s0378-3758(99)00041-5 · Cited by 738
Uberon, an integrative multi-species anatomy ontology
Mungall, C. J., Torniai, C., Gkoutos, G. V., Lewis, S. E., & Haendel, M. A. (2012) · Genome biology · doi:10.1186/gb-2012-13-1-r5 · Cited by 732 · cited 1×
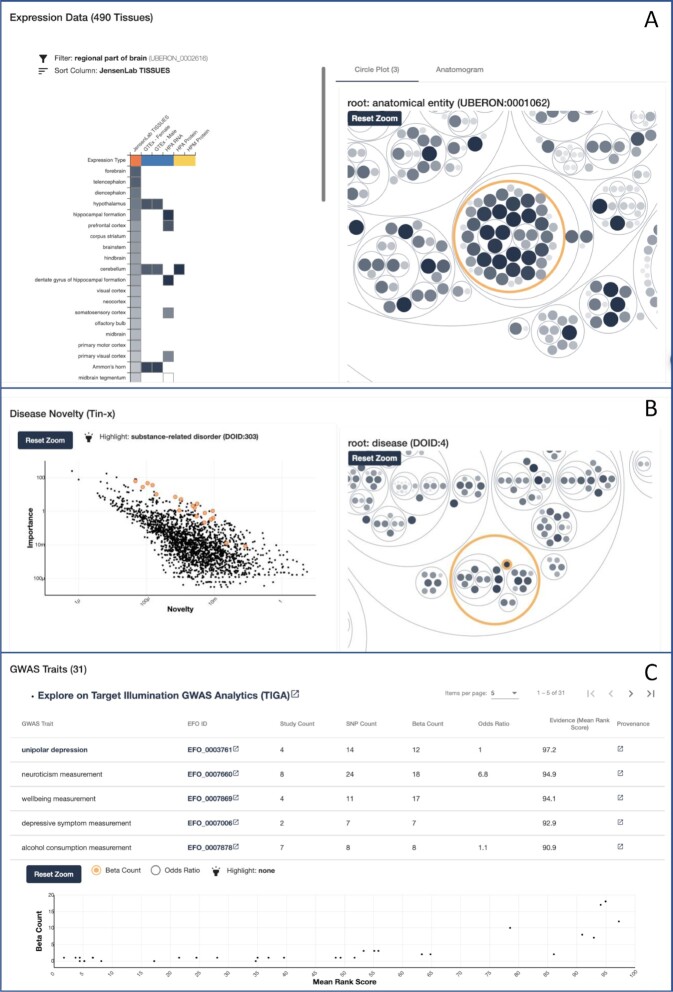
“A heat map of tissues expressing the current target vs. the data sources reporting the expression is shown, as well as a circular treemap that groups the tissue expression values according to the hierarchy defined by the UBERON ontology, an anatomy-based ontology (44) (Figure 2A).”
Hutchins, B. I., Yuan, X., Anderson, J. M., & Santangelo, G. M. (2016) · PLoS Biology · doi:10.1371/journal.pbio.1002541 · Cited by 500
Mungall, C. J., McMurry, J. A., Köhler, S., Balhoff, J. P., Borromeo, C., Brush, M., Carbon, S., Conlin, T., Dunn, N., Engelstad, M., et al. (2017) · Nucleic Acids Research · doi:10.1093/nar/gkw1128 · Cited by 441
Edwards, A. M., Isserlin, R., Bader, G. D., Frye, S. V., Willson, T. M., & Yu, F. H. (2011) · Nature · doi:10.1038/470163a · Cited by 411
Pharos: collating protein information to shed light on the druggable genome
Nguyen, D.-T., Mathias, S., Bologa, C., Brunak, S., Fernandez, N., Gaulton, A., Hersey, A., Holmes, J., Jensen, L. J., Karlsson, A., et al. (2017) · Nucleic Acids Research · doi:10.1093/nar/gkw1072 · Cited by 279
Self-citationLarge-scale investigation of the reasons why potentially important genes are ignored
Stoeger, T., Gerlach, M., Morimoto, R. I., & Nunes Amaral, L. A. (2018) · PLOS Biology · doi:10.1371/journal.pbio.2006643 · Cited by 261
Unexpected features of the dark proteome
Perdigão, N., Heinrich, J., Stolte, C., Sabir, K. S., Buckley, M. J., Tabor, B., Signal, B., Gloss, B., Hammang, C. J., Rost, B., et al. (2015) · Proceedings of the National Academy of Sciences · doi:10.1073/pnas.1508380112 · Cited by 210
Wang, J., Al‐Ouran, R., Hu, Y., Kim, S., Wan, Y., Wangler, M. F., Yamamoto, S., Chao, H., Comjean, A., Mohr, S. E., et al. (2017) · The American Journal of Human Genetics · doi:10.1016/j.ajhg.2017.04.010 · Cited by 204
GlyGen: Computational and Informatics Resources for Glycoscience
York, W. S., Mazumder, R., Ranzinger, R., et al. (2019) · Glycobiology · doi:10.1093/glycob/cwz080 · Cited by 189
TISSUES 2.0: an integrative web resource on mammalian tissue expression
Palasca, O., Santos, A., Stolte, C., Gorodkin, J., & Jensen, L. J. (2018) · Database · doi:10.1093/database/bay003 · Cited by 182
Self-citationTCRD and pharos 2021: mining the human proteome for disease biology
Sheils, T. K., Mathias, S. L., Kelleher, K. J., Siramshetty, V. B., Nguyen, D.-T., Bologa, C. G., Jensen, L. J., Vidović, D., Koleti, A., Schürer, S. C., et al. (2021) · Nucleic Acids Research · doi:10.1093/nar/gkaa993 · Cited by 160
Self-citationHarding, S. D., Armstrong, J. F., Faccenda, E., Southan, C., Alexander, S. P. H., Davenport, A. P., Pawson, A. J., Spedding, M., Davies, J. A., & NC-IUPHAR (2022) · Nucleic Acids Research · doi:10.1093/nar/gkab1010 · Cited by 149
Antibodypedia, a Portal for Sharing Antibody and Antigen Validation Data
Björling, E., & Uhlén, M. (2008) · Molecular & Cellular Proteomics · doi:10.1074/mcp.m800264-mcp200 · Cited by 147
Ursu, O., Holmes, J., Bologa, C., Yang, J. J., Mathias, S. L., Stathias, V., Nguyễn, Ð.-T., Schürer, S. C., & Oprea, T. I. (2018) · Nucleic Acids Research · doi:10.1093/nar/gky963 · Cited by 145
Self-citationGrissa, D., Junge, A., Oprea, T. I., & Jensen, L. J. (2022) · Database · doi:10.1093/database/baac019 · Cited by 144
Self-citation[Orphanet: a European database for rare diseases].
Weinreich, S. S., Mangon, R., Sikkens, J. J., et al. (2008) · PubMed · Cited by 138
Mondo: Unifying diseases for the world, by the world
Vasilevsky, N. A., Matentzoglu, N. A., Toro, S., Flack, J. E., Hegde, H., Unni, D. R., Alyea, G. F., Amberger, J. S., Babb, L., Balhoff, J. P., et al. (2022) · doi:10.1101/2022.04.13.22273750 · Cited by 107
Self-citationZakharov, A. V., Zhao, T., Nguyễn, Ð.-T., Peryea, T., Sheils, T. K., Yasgar, A., Huang, R., Southall, N. T., & Simeonov, A. M. (2019) · Journal of Chemical Information and Modeling · doi:10.1021/acs.jcim.9b00526 · Cited by 80
Self-citationProtVista: visualization of protein sequence annotations
Watkins, X., Garcia, L. J., Pundir, S., & Martin, M. J. (2017) · Bioinformatics · doi:10.1093/bioinformatics/btx120 · Cited by 69
How to Illuminate the Druggable Genome Using Pharos
Sheils, T. K., Mathias, S. L., Siramshetty, V. B., Bocci, G., Bologa, C., Yang, J. J., Waller, A., Southall, N. T., Nguyễn, Ð.-T., & Oprea, T. I. (2020) · Current Protocols in Bioinformatics · doi:10.1002/cpbi.92 · Cited by 45
Self-citationTIN-X: target importance and novelty explorer
Cannon, D. C., Yang, J. J., Mathias, S. L., Ursu, O., Mani, S., Waller, A., Schürer, S. C., Jensen, L. J., Sklar, L. A., Bologa, C. G., et al. (2017) · Bioinformatics · doi:10.1093/bioinformatics/btx200 · Cited by 34
Self-citationTIGA: target illumination GWAS analytics
Yang, J. J., Grissa, D., Lambert, C. G., Bologa, C., Mathias, S. L., Waller, A., Wild, D. J., Jensen, L. J., & Oprea, T. I. (2021) · Bioinformatics · doi:10.1093/bioinformatics/btab427 · Cited by 16
Self-citationAvram, S., Halip, L., Curpan, R., & Oprea, T. I. (2022) · Nature Reviews Drug Discovery · doi:10.1038/d41573-022-00057-7 · Cited by 15
Self-citationGetting Started with the IDG KMC Datasets and Tools
Kropiwnicki, E., Binder, J., Yang, J. J., Holmes, J., Lachmann, A., Clarke, D. J. B., Sheils, T. K., Kelleher, K. J., Metzger, V. T., Bologa, C., et al. (2022) · Current Protocols · doi:10.1002/cpz1.355 · Cited by 12
Self-citationRavanmehr, V., Blau, H., Cappelletti, L., Fontana, T., Carmody, L., Coleman, B., George, J., Reese, J., Joachimiak, M. P., Bocci, G., et al. (2021) · NAR Genomics and Bioinformatics · doi:10.1093/nargab/lqab113 · Cited by 7
Self-citation
Research works printed but not linked: 1
- Fisher, 1934, Statistical Methods for Research Workers … Fifth Edition - Revised and Enlarged Edinburgh
Cited by
Sorted by citations
Kim, S., Chen, J., Cheng, T., Gindulytė, A., He, J., He, S., Li, Q., Shoemaker, B. A., Thiessen, P. A., Yu, B., et al. (2024) · Nucleic Acids Research · doi:10.1093/nar/gkae1059 · Cited by 1,432
Artificial Intelligence for Drug Discovery: Are We There Yet?
Hasselgren, C., & Oprea, T. I. (2024) · Annual Review of Pharmacology and Toxicology · doi:10.1146/annurev-pharmtox-040323-040828 · Cited by 236
“The ATG-specific meta-path XGBoost model used 103 ATG-associated (positive) genes and 3468 negatives (not ATG-associated genes), collating data from Pharos.”
BackgroundMethodInfluentialSelf-citationMutational landscape of cancer-driver genes across human cancers
Sinkala, M. (2023) · Scientific Reports · doi:10.1038/s41598-023-39608-2 · Cited by 154
Illuminating the druggable genome: Pathways to progress
Sharma, K. R., Colvis, C. M., Rodgers, G. P., & Sheeley, D. M. (2023) · Drug Discovery Today · doi:10.1016/j.drudis.2023.103805 · Cited by 36
Self-citationThe 2023 Nucleic Acids Research Database Issue and the online molecular biology database collection
Rigden, D., & Fernández, X. M. (2023) · Nucleic Acids Res. · doi:10.1093/nar/gkac1186 · Cited by 27
Metadata
- Authors
- Kelleher, K. J., Sheils, T. K., Mathias, S. L., Yang, J. J., Metzger, V. T., Siramshetty, V. B., Nguyen, D.-T., Jensen, L. J., Vidović, D., Schürer, S. C., Holmes, J., Sharma, K. R., Pillai, A., Bologa, C. G., Edwards, J. S., Mathé, E. A., & Oprea, T. I.
- Affiliations
- National Center for Advancing Translational Sciences (US)
- University of New Mexico (US)
- National Center for Advancing Translational Science , 9800 Medical Center Drive , Rockville , MD 20850, USA
- University of Copenhagen (DK)
- University of Miami (US)
- Corresponding author
- Edwards, Jeremy S
- Mathé, Ewy A
- ORCID
- Venue
- Nucleic Acids Research
- Publisher
- Oxford University Press (OUP)
- Published
- 2022-11-29
- Volume
- 51
- Issue
- D1
- Pages
- D1405-D1416
- ISSN
- 0305-1048 (ISSN-L)
- 1362-4962
- PMC
- PMC9825581
- OpenAlex
- W4310240482
- Cited by
- 137
- References
- 51
- Citations by year
- 2026: 39 · 2025: 42 · 2024: 46 · 2023: 10
- FWCI
- 13.80
- Type
- journal article
- Language
- en
- Open access
- gold
- doi.org
- Licence
- Locations
- Nucleic Acids Research (publishedVersion, cc-by-nc)
- PubMed Central (publishedVersion, cc-by-nc)
- PubMed (publishedVersion)
- Research at the University of Copenhagen (University of Copenhagen) (publishedVersion, cc-by-nc)
- Funders
- National Institutes of Health (U24 CA224370, U24 TR002278)
- Novo Nordisk Foundation (NNF14CC0001)
- Intramural Research Program, NCATS
- Intramural/Extramural research program of the NCATS, NIH: Knowledge Management Center for Illuminating the Druggable Genome (ZIA TR000057-08)
- Topics
- Life Sciences › Pharmacology, Toxicology and Pharmaceutics › Drug Discovery › Computational Drug Discovery Methods
- Life Sciences › Biochemistry, Genetics and Molecular Biology › Molecular Biology › Bioinformatics and Genomic Networks
- Health Sciences › Medicine › Health Informatics › Biomedical Text Mining and Ontologies
- Keywords
- Pharo, human proteome, disease biology, drug discovery, small molecule perturbations
- MeSH terms
- Biological Products, Humans, Databases, Factual, Internet, Proteome, Drug Discovery, Molecular Targeted Therapy
About these checks
Registry, retraction, Cites and statistics results are computed, not judged, with one exception: a printed reference that no index lists is read once by a model before it counts as a citation error. Claims are extracted by a model and kept only when their quote appears verbatim in the text; each cited source is then checked, with a model’s help, for whether it says what the claim relies on. Those verdicts can be wrong — read the claim’s quote and the cited source before relying on one.
Statistics and arithmetic are recomputed, not judged.
Confidence bands are shown only for fields calibrated on our annotated test set. None is calibrated yet, so no band is shown.
What counts as a claim ›How we measure confidence ›How we check this ›
Are you an author, or do you see a problem with this page? Request a review
