

The DOI matches its Crossref record; 73 of the 73 references it cites were found in a registry or an index; 4 of the 61 sources its claims cite were checked for support.
limma powers differential expression analyses for RNA-sequencing and microarray studies
Open accessAbstract
limma is an R/Bioconductor software package that provides an integrated solution for analysing data from gene expression experiments. It contains rich features for handling complex experimental designs and for information borrowing to overcome the problem of small sample sizes. Over the past decade, limma has been a popular choice for gene discovery through differential expression analyses of microarray and high-throughput PCR data. The package contains particularly strong facilities for reading, normalizing and exploring such data. Recently, the capabilities of limma have been significantly expanded in two important directions. First, the package can now perform both differential expression and differential splicing analyses of RNA sequencing (RNA-seq) data. All the downstream analysis tools previously restricted to microarray data are now available for RNA-seq as well. These capabilities allow users to analyse both RNA-seq and microarray data with very similar pipelines. Second, the package is now able to go past the traditional gene-wise expression analyses in a variety of ways, analysing expression profiles in terms of co-regulated sets of genes or in terms of higher-order expression signatures. This provides enhanced possibilities for biological interpretation of gene expression differences. This article reviews the philosophy and design of the limma package, summarizing both new and historical features, with an emphasis on recent enhancements and features that have not been previously described.
Overview
AI snapshot
Written from the paper’s full text.
TL;DR
limma is an R/Bioconductor package that provides an integrated linear-model and empirical Bayes framework for differential expression analysis across microarray, PCR, protein array, and RNA-seq data. The article reviews its statistical design and recent extensions, including voom-based RNA-seq analysis, differential splicing, and higher-level gene-set/signature analyses.
Key findings
- limma now performs both differential expression and differential splicing for RNA-seq data, with all downstream tools previously restricted to microarrays available for RNA-seq; the same pipeline can be used for RNA-seq and microarray data after preprocessing.
- Empirical Bayes methods borrow information between genes to moderate variances, improving inference in small-sample experiments; recent enhancements include a mean-variance trend and robust empirical Bayes with gene-wise shrinkage factors.
- Higher-level analyses include gene-set testing functions such as `goana`, `geneSetTest`, `camera`, `roast`, and `romer`, plus `genas` for estimating biological correlation between contrasts and `propTrueNull` for estimating the proportion of true null hypotheses.
- The package is freely available in Bioconductor; more than 120 other Bioconductor packages made use of limma as of March 2014, and the user’s guide is over 120 pages with 10 fully worked case studies.
Methods
- This is a review/software description article, not a primary experimental study; it summarizes limma’s philosophy, design, and features, with example diagnostic and DE plots generated from previously published datasets.
- Example data sources include RNA-seq data from Pickrell et al. analysed as described by Law et al., two-colour microarray quality-control data from Ritchie et al., two-colour microarray data from GEO series GSE2593, and RNA-seq data from GEO series GSE52870 analysed as described in Liu et al.
- The core analysis framework uses gene-wise linear models, design matrices, contrasts, empirical Bayes moderated t- and F-statistics, quantitative quality weights, `duplicateCorrelation` for blocking/random effects, and `voom` precision weights for RNA-seq counts.
Limitations
- The paper states that limma does not perform permutation or re-sampling-based inference and discusses disadvantages of permutation for complex designs, small replicate numbers, correlated samples, and unequal precision.
- The paper states that parametric distributions “can never be perfectly correct” but argues that modelling the variance structure more realistically outweighs these compromises in small, complex experiments.
- Evident from the text: the article is a software review summarizing existing and recent features, not a new empirical benchmark; performance claims are largely qualitative or cite prior work, and no new head-to-head numerical comparisons are reported in this article.
Model-written summary. Check it against the paper before relying on it.
Integrity signals
Registry
Cites
Statistics
Figures
Verification
Claims the paper makes
82 No basis given · 41 Not checked yet · 25 Own interpretation · 3 Own result · 1 Supported · 1 Supported so far
The sources with a verdict support this claim; the rest weren’t checked yet, have no full text we could read, or their verdicts aren’t rated yet.
In the paper
“First, the global variance estimate can now incorporate a mean-variance trend (10,17,18).”
§ limma powers differential expression analyses for RNA-sequencing and microarray studies > RESULTS > Statistical principles
What the sources say
- Supportedcites [10] Law, 2014, Voom: precision weights unlock linear model analysis tools for RNA-seq read counts, Genome Biol. source
In Results, ‘Using log-cpm in a limma pipeline,’ the paper says it modified limma’s empirical Bayes procedure so gene-wise variances are shrunk toward a global mean-variance trend curve rather than a constant pooled variance. This directly supports the claim. (LLM, conf=0.94)
- Supportedcites [17] Sartor, 2006, Intensity-based hierarchical bayes method improves testing for differentially expressed genes in microarray experiments, BMC Bioinformatics source
The Intensity-based Bayesian model section describes modeling prior variance as a function of average log-expression level. The Estimation of hyperparameters section says local regression of gene log-variances on average log-expression levels provides predicted variances for each gene. Together, these passages support incorporating a mean–variance trend into the variance estimate; page numbers are not available in our copy. (LLM, conf=0.88)
- Not checked yetcites [18] Phipson, 2013, Empirical Bayes in the presence of exceptional cases, with application to microarray data
plain- Asserted: passes — The authors put it forward as true.
- Checkable: passes — It can be checked against evidence.
- Load-bearing: passes — The paper’s conclusions depend on it.
- Based: passes — The paper gives a reason why it holds.
- Rests on an assumption: Many gene expression technologies produce data that are less reliable at lower intensities or abundances.
- Supported
Every source the paper cites for this claim was checked and supports it.
In the paper
“Alternatively, voom has the ability to respect normalization factors computed outside of limma by methods such as trimmed mean of M-values (41) or conditional quantile normalization (42).”
§ limma powers differential expression analyses for RNA-sequencing and microarray studies > RESULTS > Preprocessing microarray data
What the sources say
- Supportedcites [41] Robinson, 2010, A scaling normalization method for differential expression analysis of RNA-seq data, Genome Biol. source
Citation (41) is attached to “trimmed mean of M-values,” not to the separate claim about voom’s capabilities. The Results and discussion section identifies this paper’s method as trimmed mean of M-values (TMM) normalization and describes how its factors are calculated. (LLM, conf=0.93)
- Supportedcites [42] Hansen, 2012, Removing technical variability in RNA-seq data using conditional quantile normalization, Biostatistics source
Citation (42) identifies conditional quantile normalization as an external normalization method, rather than establishing voom’s capabilities. The Methods describe CQN and its normalization offsets; the Discussion states that CQN returns sample- and gene-specific offsets for use with downstream analysis frameworks. (LLM, conf=0.92)
plaindirect- Asserted: passes — The authors put it forward as true.
- Checkable: passes — It can be checked against evidence.
- Load-bearing: unclear — It is unclear whether the paper’s conclusions depend on it.
- Based: passes — The paper gives a reason why it holds.
- Supported
The paper states this without a source or data behind it here, so there is nothing to check it against. The quote shows it is in the paper.
In the paper
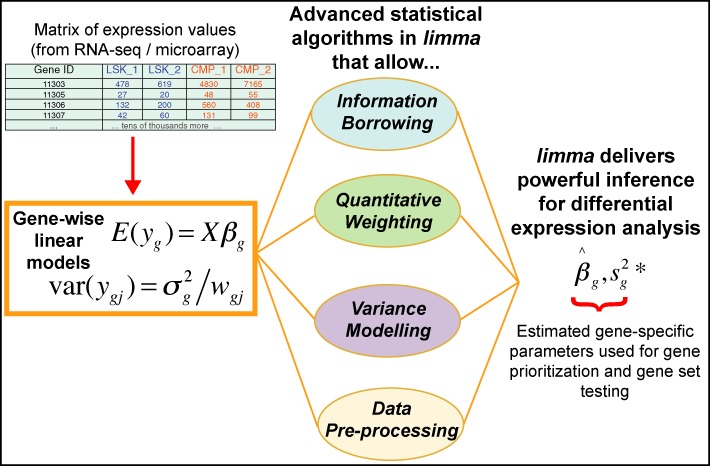
“(ii) incorporate observation weights (wgj where j refers to sample) to allow for variations in data quality”
§ limma powers differential expression analyses for RNA-sequencing and microarray studies > RESULTS > Statistical principles
plaindirect- Asserted: passes — The authors put it forward as true.
- Checkable: passes — It can be checked against evidence.
- Load-bearing: unclear — It is unclear whether the paper’s conclusions depend on it.
- Based: passes — The paper gives a reason why it holds.
The paper states this without a source or data behind it here, so there is nothing to check it against. The quote shows it is in the paper.
In the paper
“Second, the package is now able to go past the traditional gene-wise expression analyses in a variety of ways, analysing expression profiles in terms of co-regulated sets of genes or in terms of higher-order expression signatures.”
§ limma powers differential expression analyses for RNA-sequencing and microarray studies > Abstract
plaindirect- Asserted: passes — The authors put it forward as true.
- Checkable: passes — It can be checked against evidence.
- Load-bearing: passes — The paper’s conclusions depend on it.
- Based: passes — The paper gives a reason why it holds.
The paper states this without a source or data behind it here, so there is nothing to check it against. The quote shows it is in the paper.
In the paper
“The limma package includes statistical methods that (i) facilitate information borrowing using empirical Bayes methods to obtain posterior variance estimators”
§ limma powers differential expression analyses for RNA-sequencing and microarray studies > RESULTS > Statistical principles
plaindirect- Asserted: passes — The authors put it forward as true.
- Checkable: passes — It can be checked against evidence.
- Load-bearing: passes — The paper’s conclusions depend on it.
- Based: passes — The paper gives a reason why it holds.
The paper states this without a source or data behind it here, so there is nothing to check it against. The quote shows it is in the paper.
In the paper
“The hallmark of the limma approach is the use of linear models to analyse entire experiments as an integrated whole rather than making piece-meal comparisons between pairs of treatments.”
§ limma powers differential expression analyses for RNA-sequencing and microarray studies > RESULTS > Statistical principles
plain- Asserted: passes — The authors put it forward as true.
- Checkable: passes — It can be checked against evidence.
- Load-bearing: passes — The paper’s conclusions depend on it.
- Based: passes — The paper gives a reason why it holds.
The paper states this without a source or data behind it here, so there is nothing to check it against. The quote shows it is in the paper.
In the paper
“These capabilities allow users to analyse both RNA-seq and microarray data with very similar pipelines.”
§ limma powers differential expression analyses for RNA-sequencing and microarray studies > Abstract
plaindirect- Asserted: passes — The authors put it forward as true.
- Checkable: passes — It can be checked against evidence.
- Load-bearing: passes — The paper’s conclusions depend on it.
- Based: passes — The paper gives a reason why it holds.
The paper states this without a source or data behind it here, so there is nothing to check it against. The quote shows it is in the paper.
In the paper
“All the downstream analysis tools previously restricted to microarray data are now available for RNA-seq as well.”
§ limma powers differential expression analyses for RNA-sequencing and microarray studies > Abstract
plain- Asserted: passes — The authors put it forward as true.
- Checkable: passes — It can be checked against evidence.
- Load-bearing: passes — The paper’s conclusions depend on it.
- Based: unclear — It is unclear why the paper says it holds.
The paper states this without a source or data behind it here, so there is nothing to check it against. The quote shows it is in the paper.
In the paper
“(iii) allow variance modelling to accommodate technical or biological heterogeneity that may be present”
§ limma powers differential expression analyses for RNA-sequencing and microarray studies > RESULTS > Statistical principles
hedgeddirect- Asserted: passes — The authors put it forward as true.
- Checkable: passes — It can be checked against evidence.
- Load-bearing: passes — The paper’s conclusions depend on it.
- Based: passes — The paper gives a reason why it holds.
The paper states this without a source or data behind it here, so there is nothing to check it against. The quote shows it is in the paper.
In the paper
“A particular feature of rotation tests is the ability to incorporate prior information about the direction and strength with which each gene is expected to contribute to the statistical signature.”
§ limma powers differential expression analyses for RNA-sequencing and microarray studies > RESULTS > Statistical principles
plaindirect- Asserted: passes — The authors put it forward as true.
- Checkable: passes — It can be checked against evidence.
- Load-bearing: passes — The paper’s conclusions depend on it.
- Based: passes — The paper gives a reason why it holds.
- It may state two separate claims as one. 41
- Probably not a substantial claim. 58
- The quote only partly states this claim. 1
The paper states this without a source or data behind it here, so there is nothing to check it against. The quote shows it is in the paper.
In the paper
“It contains rich features for handling complex experimental designs and for information borrowing to overcome the problem of small sample sizes.”
§ limma powers differential expression analyses for RNA-sequencing and microarray studies > Abstract
plain- Asserted: passes — The authors put it forward as true.
- Checkable: passes — It can be checked against evidence.
- Load-bearing: passes — The paper’s conclusions depend on it.
- Based: passes — The paper gives a reason why it holds.
It may state two separate claims as one.
- Rests on an assumption: Gene expression studies often involve only a small number of biological replicates.
The paper states this without a source or data behind it here, so there is nothing to check it against. The quote shows it is in the paper.
In the paper
“All the features of the statistical models can be accessed not just for gene-wise expression analyses but also for higher level analyses of gene expression signatures.”
§ limma powers differential expression analyses for RNA-sequencing and microarray studies > RESULTS > Statistical principles
plain- Asserted: passes — The authors put it forward as true.
- Checkable: passes — It can be checked against evidence.
- Load-bearing: fails — The paper’s conclusions may not depend on it.
- Based: fails — The paper may give no reason why it holds.
Probably not a substantial claim. The paper’s conclusions may not depend on it. The paper may give no reason why it holds.
The paper states this without a source or data behind it here, so there is nothing to check it against. The quote shows it is in the paper.
In the paper
“The package is designed in such a way that, after initial pre-processing and normalization, the same analysis pipeline is used for data from all technologies.”
§ limma powers differential expression analyses for RNA-sequencing and microarray studies > INTRODUCTION
plain- Asserted: passes — The authors put it forward as true.
- Checkable: passes — It can be checked against evidence.
- Load-bearing: passes — The paper’s conclusions depend on it.
- Based: passes — The paper gives a reason why it holds.
Probably not a substantial claim.
None of the sources cited for this claim have been checked yet.
In the paper
“It has proven a popular choice for the analysis of data from experiments involving microarrays (3,4), high-throughput polymerase chain reaction (PCR) (5), protein arrays (6) and other platforms.”
§ limma powers differential expression analyses for RNA-sequencing and microarray studies > INTRODUCTION
What the sources say
- Not checked yetcites [3] Peart, 2005, Identification and functional significance of genes regulated by structurally different histone deacetylase inhibitors, Proc. Natl. Acad. Sci. U.S.A. source
- Not checked yetcites [4] Caiazzo, 2011, Direct generation of functional dopaminergic neurons from mouse and human fibroblasts, Nature source
- Not checked yetcites [5] Hubert, 2009, Aire-deficient c57bl/6 mice mimicking the common human 13-base pair deletion mutation present with only a mild autoimmune phenotype, J. Immunol. source
plain- Asserted: passes — The authors put it forward as true.
- Checkable: passes — It can be checked against evidence.
- Load-bearing: fails — The paper’s conclusions may not depend on it.
- Based: passes — The paper gives a reason why it holds.
Probably not a substantial claim. The paper’s conclusions may not depend on it.
None of the sources cited for this claim have been checked yet.
In the paper
“First, the package can now perform both differential expression and differential splicing analyses of RNA sequencing (RNA-seq) data.”
- Also stated in: § INTRODUCTION · plain
“First, the package can now perform both differential expression (DE) and differential splicing analyses of RNA sequencing (RNA-seq) data (7,8).”
§ limma powers differential expression analyses for RNA-sequencing and microarray studies > Abstract
What the sources say
- Not checked yetcites [7] Liu, 2014, Pax5 loss imposes a reversible differentiation block in B progenitor acute lymphoblastic leukemia, Genes Dev. source
- Not checked yetcites [8] Su, 2014, A comprehensive assessment of RNA-seq accuracy, reproducibility and information content by the Sequencing Quality Control Consortium, Nat. Biotechnol. source
plaindirect- Asserted: passes — The authors put it forward as true.
- Checkable: passes — It can be checked against evidence.
- Load-bearing: passes — The paper’s conclusions depend on it.
- Based: passes — The paper gives a reason why it holds.
It may state two separate claims as one.
- Also stated in: § INTRODUCTION · plain
The paper states this without a source or data behind it here, so there is nothing to check it against. The quote shows it is in the paper.
In the paper
“(iv) pre-processing methods such as variance stabilization to reduce noise.”
§ limma powers differential expression analyses for RNA-sequencing and microarray studies > RESULTS > Statistical principles
plaindirect- Asserted: passes — The authors put it forward as true.
- Checkable: passes — It can be checked against evidence.
- Load-bearing: fails — The paper’s conclusions may not depend on it.
- Based: passes — The paper gives a reason why it holds.
Probably not a substantial claim. The paper’s conclusions may not depend on it.
The paper states this without a source or data behind it here, so there is nothing to check it against. The quote shows it is in the paper.
In the paper
“The mean-variance trend is converted by the voom function into precision weights, which are incorporated into the analysis of log-transformed RNA-seq counts using the same linear modelling commands as for microarrays.”
§ limma powers differential expression analyses for RNA-sequencing and microarray studies > RESULTS > Statistical principles
plaindirect- Asserted: passes — The authors put it forward as true.
- Checkable: passes — It can be checked against evidence.
- Load-bearing: passes — The paper’s conclusions depend on it.
- Based: passes — The paper gives a reason why it holds.
It may state two separate claims as one.
The paper states this without a source or data behind it here, so there is nothing to check it against. The quote shows it is in the paper.
In the paper
“Output in other formats can be read if the appropriate column names are supplied.”
§ limma powers differential expression analyses for RNA-sequencing and microarray studies > RESULTS > Preprocessing microarray data
plainconditional- Asserted: passes — The authors put it forward as true.
- Checkable: passes — It can be checked against evidence.
- Load-bearing: fails — The paper’s conclusions may not depend on it.
- Based: fails — The paper may give no reason why it holds.
Probably not a substantial claim. The paper’s conclusions may not depend on it. The paper may give no reason why it holds.
The paper states this without a source or data behind it here, so there is nothing to check it against. The quote shows it is in the paper.
In the paper
“Weights can be used to give more emphasis to control probes during normalization, or can be used to down-weight measurements or samples that are less reliable in a gene expression analysis.”
§ limma powers differential expression analyses for RNA-sequencing and microarray studies > RESULTS > Statistical principles
plaindirect- Asserted: passes — The authors put it forward as true.
- Checkable: passes — It can be checked against evidence.
- Load-bearing: unclear — It is unclear whether the paper’s conclusions depend on it.
- Based: passes — The paper gives a reason why it holds.
It may state two separate claims as one.
The paper states this without a source or data behind it here, so there is nothing to check it against. The quote shows it is in the paper.
In the paper
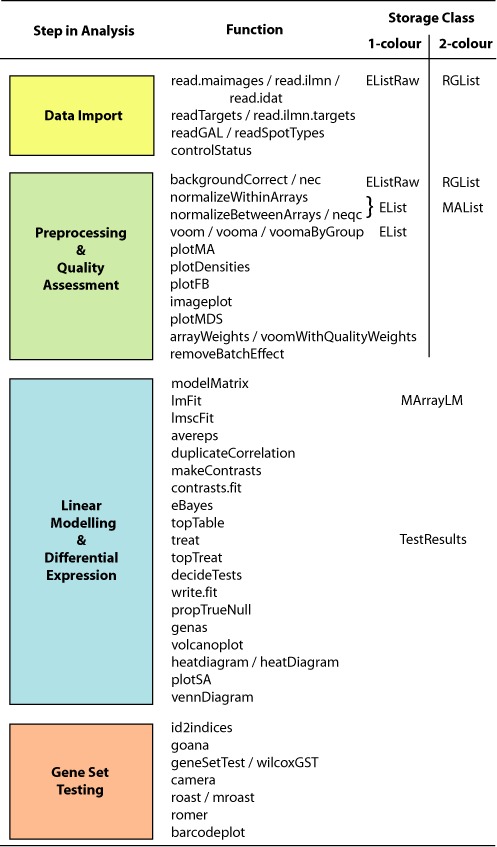
“This function directly supports formats written by many different image analysis programs including GenePix, Agilent Feature Extraction, ArrayVision, BlueFuse, ImaGene, QuantArray and SPOT (Table 1).”
§ limma powers differential expression analyses for RNA-sequencing and microarray studies > RESULTS > Preprocessing microarray data
plaindirect- Asserted: passes — The authors put it forward as true.
- Checkable: passes — It can be checked against evidence.
- Load-bearing: fails — The paper’s conclusions may not depend on it.
- Based: passes — The paper gives a reason why it holds.
Probably not a substantial claim. The paper’s conclusions may not depend on it.
The paper states this without a source or data behind it here, so there is nothing to check it against. The quote shows it is in the paper.
In the paper
“The logCPM values can be normalized between samples by the voom function or can be pre-normalized by adding normalization factors within edgeR.”
§ limma powers differential expression analyses for RNA-sequencing and microarray studies > RESULTS > Pre-processing RNA-seq and other sequencing data
plaindirect- Asserted: passes — The authors put it forward as true.
- Checkable: passes — It can be checked against evidence.
- Load-bearing: fails — The paper’s conclusions may not depend on it.
- Based: fails — The paper may give no reason why it holds.
Probably not a substantial claim. The paper’s conclusions may not depend on it. The paper may give no reason why it holds. It may state two separate claims as one.
None of the sources cited for this claim have been checked yet.
In the paper
“Raw read counts are assembled outside limma using tools such as featureCounts (29), HTSeq-counts (30) or RSEM (31).”
§ limma powers differential expression analyses for RNA-sequencing and microarray studies > RESULTS > Pre-processing RNA-seq and other sequencing data
What the sources say
- Not checked yetcites [29] Liao, 2014, featureCounts: an efficient general-purpose read summarization program, Bioinformatics source
- Not checked yetcites [30] Anders, 2015, HTSeq—a Python framework to work with high-throughput sequencing data, Bioinformatics source
- Not checked yetcites [31] Li, 2011, RSEM: accurate transcript quantification from RNA-Seq data with or without a reference genome, BMC Bioinformatics source
plain- Asserted: passes — The authors put it forward as true.
- Checkable: passes — It can be checked against evidence.
- Load-bearing: fails — The paper’s conclusions may not depend on it.
- Based: passes — The paper gives a reason why it holds.
Probably not a substantial claim. The paper’s conclusions may not depend on it.
The paper states this without a source or data behind it here, so there is nothing to check it against. The quote shows it is in the paper.
In the paper
“It also supports the Stanford Microarray Database format.”
§ limma powers differential expression analyses for RNA-sequencing and microarray studies > RESULTS > Preprocessing microarray data
plain- Asserted: passes — The authors put it forward as true.
- Checkable: passes — It can be checked against evidence.
- Load-bearing: fails — The paper’s conclusions may not depend on it.
- Based: passes — The paper gives a reason why it holds.
Probably not a substantial claim. The paper’s conclusions may not depend on it.
The paper states this without a source or data behind it here, so there is nothing to check it against. The quote shows it is in the paper.
In the paper
“These ideas were part of the original limma package submitted to Bioconductor in 2003.”
§ limma powers differential expression analyses for RNA-sequencing and microarray studies > RESULTS > Statistical principles
plain- Asserted: passes — The authors put it forward as true.
- Checkable: passes — It can be checked against evidence.
- Load-bearing: fails — The paper’s conclusions may not depend on it.
- Based: fails — The paper may give no reason why it holds.
Probably not a substantial claim. The paper’s conclusions may not depend on it. The paper may give no reason why it holds.
The paper states this without a source or data behind it here, so there is nothing to check it against. The quote shows it is in the paper.
In the paper
“Linear models permit very general analyses. Researchers can adjust for the effects of multiple experimental factors or can adjust for batch effects. The linear model might include time course effects or regression splines. The linear model could even include the expression values themselves of one or more genes as covariates, allowing researchers to test for inter-gene dependencies. Linear models”
§ limma powers differential expression analyses for RNA-sequencing and microarray studies > RESULTS > Statistical principles
hedged- Asserted: passes — The authors put it forward as true.
- Checkable: passes — It can be checked against evidence.
- Load-bearing: passes — The paper’s conclusions depend on it.
- Based: passes — The paper gives a reason why it holds.
It may state two separate claims as one.
The paper states this without a source or data behind it here, so there is nothing to check it against. The quote shows it is in the paper.
In the paper
“Weights can be applied to genes or to RNA samples or to individual expression values.”
§ limma powers differential expression analyses for RNA-sequencing and microarray studies > RESULTS > Statistical principles
plain- Asserted: passes — The authors put it forward as true.
- Checkable: passes — It can be checked against evidence.
- Load-bearing: passes — The paper’s conclusions depend on it.
- Based: passes — The paper gives a reason why it holds.
It may state two separate claims as one.
The paper states this without a source or data behind it here, so there is nothing to check it against. The quote shows it is in the paper.
In the paper
“limma generalized the concept of an MA-plot in two ways. First, the idea was extended to apply to sets of single-channel expression values. In this case, the plot is used to compare each sample to the average of all other samples. A virtual array is constructed by averaging the log-expression value for all the samples other than the sample of interest, and then a mean-difference plot is made”
§ limma powers differential expression analyses for RNA-sequencing and microarray studies > RESULTS > Statistical principles
plaindirect- Asserted: passes — The authors put it forward as true.
- Checkable: passes — It can be checked against evidence.
- Load-bearing: unclear — It is unclear whether the paper’s conclusions depend on it.
- Based: passes — The paper gives a reason why it holds.
It may state two separate claims as one. The quote only partly states this claim.
The paper states this without a source or data behind it here, so there is nothing to check it against. The quote shows it is in the paper.
In the paper
“A closely related statistical approach implemented in limma is to fit global covariance models, either to estimate correlations between genes or to estimate the relatedness between the DE profiles resulting from difference comparisons.”
§ limma powers differential expression analyses for RNA-sequencing and microarray studies > RESULTS > Statistical principles
plaindirect- Asserted: passes — The authors put it forward as true.
- Checkable: passes — It can be checked against evidence.
- Load-bearing: unclear — It is unclear whether the paper’s conclusions depend on it.
- Based: passes — The paper gives a reason why it holds.
It may state two separate claims as one.
The paper states this without a source or data behind it here, so there is nothing to check it against. The quote shows it is in the paper.
In the paper
“Two-colour and single-channel data are both supported.”
§ limma powers differential expression analyses for RNA-sequencing and microarray studies > RESULTS > Preprocessing microarray data
plain- Asserted: passes — The authors put it forward as true.
- Checkable: passes — It can be checked against evidence.
- Load-bearing: fails — The paper’s conclusions may not depend on it.
- Based: passes — The paper gives a reason why it holds.
Probably not a substantial claim. The paper’s conclusions may not depend on it. It may state two separate claims as one.
In the paper
“The nec function implements normexp background correction for Illumina BeadChips making special use of the control probes that are specific to these arrays (24).”
§ limma powers differential expression analyses for RNA-sequencing and microarray studies > RESULTS > Preprocessing microarray data
What the sources say
- Not checked yetcites [24] Shi, 2010, Optimizing the noise versus bias trade-off for Illumina Whole Genome Expression Beadchips, Nucleic Acids Res. source
plaindirect- Asserted: passes — The authors put it forward as true.
- Checkable: passes — It can be checked against evidence.
- Load-bearing: fails — The paper’s conclusions may not depend on it.
- Based: passes — The paper gives a reason why it holds.
Probably not a substantial claim. The paper’s conclusions may not depend on it.
The paper states this without a source or data behind it here, so there is nothing to check it against. The quote shows it is in the paper.
In the paper
“This strategy allows the gene-wise models to incorporate such things as correlations between duplicate probes for the same gene, or correlations between related RNA samples, or variations in quality between the RNA samples.”
§ limma powers differential expression analyses for RNA-sequencing and microarray studies > RESULTS > Statistical principles
plaindirect- Asserted: passes — The authors put it forward as true.
- Checkable: passes — It can be checked against evidence.
- Load-bearing: passes — The paper’s conclusions depend on it.
- Based: passes — The paper gives a reason why it holds.
It may state two separate claims as one.
In the paper
“Notable are the maximum likelihood implementation of the normal-exponential convolution model for background correction (22) and the implementation of loess curves and normalization using quantitative weights.”
§ limma powers differential expression analyses for RNA-sequencing and microarray studies > RESULTS > Statistical principles
What the sources say
- Not checked yetcites [22] Silver, 2009, Microarray background correction: maximum likelihood estimation for the normal–exponential convolution, Biostatistics source
plain- Asserted: passes — The authors put it forward as true.
- Checkable: passes — It can be checked against evidence.
- Load-bearing: unclear — It is unclear whether the paper’s conclusions depend on it.
- Based: passes — The paper gives a reason why it holds.
It may state two separate claims as one.
In the paper
“One way is through estimating a mean-variance trend, which can either be incorporated into the empirical Bayes procedure as mentioned above or used to generate observation weights (10).”
§ limma powers differential expression analyses for RNA-sequencing and microarray studies > RESULTS > Statistical principles
What the sources say
- Not checked yetcites [10] Law, 2014, Voom: precision weights unlock linear model analysis tools for RNA-seq read counts, Genome Biol. source
plain- Asserted: passes — The authors put it forward as true.
- Checkable: passes — It can be checked against evidence.
- Load-bearing: unclear — It is unclear whether the paper’s conclusions depend on it.
- Based: passes — The paper gives a reason why it holds.
It may state two separate claims as one.
The paper states this without a source or data behind it here, so there is nothing to check it against. The quote shows it is in the paper.
In the paper
“The main limma function to read image output files is read.maimages.”
§ limma powers differential expression analyses for RNA-sequencing and microarray studies > RESULTS > Preprocessing microarray data
plain- Asserted: passes — The authors put it forward as true.
- Checkable: passes — It can be checked against evidence.
- Load-bearing: fails — The paper’s conclusions may not depend on it.
- Based: passes — The paper gives a reason why it holds.
Probably not a substantial claim. The paper’s conclusions may not depend on it.
The paper states this without a source or data behind it here, so there is nothing to check it against. The quote shows it is in the paper.
In the paper
“A separate model is fitted for each gene, but the gene-wise models can be linked by global parameters or global hyper-parameters.”
§ limma powers differential expression analyses for RNA-sequencing and microarray studies > RESULTS > Statistical principles
plaincorrelational- Asserted: passes — The authors put it forward as true.
- Checkable: passes — It can be checked against evidence.
- Load-bearing: passes — The paper’s conclusions depend on it.
- Based: passes — The paper gives a reason why it holds.
It may state two separate claims as one.
The paper states this without a source or data behind it here, so there is nothing to check it against. The quote shows it is in the paper.
In the paper
“The read counts are processed by the voom function in limma to convert them into log2 counts per million (logCPM) with associated precision weights.”
§ limma powers differential expression analyses for RNA-sequencing and microarray studies > RESULTS > Pre-processing RNA-seq and other sequencing data
plaindirect- Asserted: passes — The authors put it forward as true.
- Checkable: passes — It can be checked against evidence.
- Load-bearing: fails — The paper’s conclusions may not depend on it.
- Based: passes — The paper gives a reason why it holds.
Probably not a substantial claim. The paper’s conclusions may not depend on it.
The paper states this without a source or data behind it here, so there is nothing to check it against. The quote shows it is in the paper.
In the paper
“The use of global parameters is a simple means of sharing information between genes that can be used even for the smallest experiments, because the global parameters can be estimated from the entire data set involving all the genes at once.”
§ limma powers differential expression analyses for RNA-sequencing and microarray studies > RESULTS > Statistical principles
plaindirect- Asserted: passes — The authors put it forward as true.
- Checkable: passes — It can be checked against evidence.
- Load-bearing: passes — The paper’s conclusions depend on it.
- Based: passes — The paper gives a reason why it holds.
It may state two separate claims as one.
None of the sources cited for this claim have been checked yet.
In the paper
“This allows a sophisticated robust empirical Bayes procedure in which hyper-variable genes are identified and treated separately (18,19).”
§ limma powers differential expression analyses for RNA-sequencing and microarray studies > RESULTS > Statistical principles
What the sources say
- Not checked yetcites [18] Phipson, 2013, Empirical Bayes in the presence of exceptional cases, with application to microarray data
- Not checked yetcites [19] Phipson, 2013, Empirical Bayes modelling of expression profiles and their associations
plaindirect- Asserted: passes — The authors put it forward as true.
- Checkable: passes — It can be checked against evidence.
- Load-bearing: passes — The paper’s conclusions depend on it.
- Based: passes — The paper gives a reason why it holds.
It may state two separate claims as one.
The paper states this without a source or data behind it here, so there is nothing to check it against. The quote shows it is in the paper.
In the paper
“For example, RNA-seq data can be explored using boxplots or mean-difference plots, similarly to single-channel microarray data.”
§ limma powers differential expression analyses for RNA-sequencing and microarray studies > RESULTS > Pre-processing RNA-seq and other sequencing data
plain- Asserted: passes — The authors put it forward as true.
- Checkable: passes — It can be checked against evidence.
- Load-bearing: fails — The paper’s conclusions may not depend on it.
- Based: fails — The paper may give no reason why it holds.
Probably not a substantial claim. The paper’s conclusions may not depend on it. The paper may give no reason why it holds.
The paper states this without a source or data behind it here, so there is nothing to check it against. The quote shows it is in the paper.
In the paper
“Illumina BeadChips need special treatment: output from Illumina's GenomeStudio can be read by read.ilmn if exported as a text file or by read.idat if in binary format.”
§ limma powers differential expression analyses for RNA-sequencing and microarray studies > RESULTS > Preprocessing microarray data
plain- Asserted: passes — The authors put it forward as true.
- Checkable: passes — It can be checked against evidence.
- Load-bearing: fails — The paper’s conclusions may not depend on it.
- Based: fails — The paper may give no reason why it holds.
Probably not a substantial claim. The paper’s conclusions may not depend on it. The paper may give no reason why it holds. It may state two separate claims as one.
The paper states this without a source or data behind it here, so there is nothing to check it against. The quote shows it is in the paper.
In the paper
“Alternatively it can accept a DGEList object from the edgeR package.”
§ limma powers differential expression analyses for RNA-sequencing and microarray studies > RESULTS > Pre-processing RNA-seq and other sequencing data
plain- Asserted: passes — The authors put it forward as true.
- Checkable: passes — It can be checked against evidence.
- Load-bearing: fails — The paper’s conclusions may not depend on it.
- Based: passes — The paper gives a reason why it holds.
Probably not a substantial claim. The paper’s conclusions may not depend on it.
In the paper
“The use of weights increases power to detect differentially expressed genes, and having a model based approach avoids the need for ad hoc decisions about which observations or samples to filter out (11).”
§ limma powers differential expression analyses for RNA-sequencing and microarray studies > RESULTS > Statistical principles
What the sources say
- Not checked yetcites [11] Ritchie, 2006, Empirical array quality weights in the analysis of microarray data, BMC Bioinformatics source
plaindirect- Asserted: passes — The authors put it forward as true.
- Checkable: passes — It can be checked against evidence.
- Load-bearing: passes — The paper’s conclusions depend on it.
- Based: passes — The paper gives a reason why it holds.
It may state two separate claims as one.
The paper states this without a source or data behind it here, so there is nothing to check it against. The quote shows it is in the paper.
In the paper
“limma accepts RNA-seq data in the form of a matrix of read counts, with rows for genomic features and columns for RNA samples.”
§ limma powers differential expression analyses for RNA-sequencing and microarray studies > RESULTS > Pre-processing RNA-seq and other sequencing data
plain- Asserted: passes — The authors put it forward as true.
- Checkable: passes — It can be checked against evidence.
- Load-bearing: fails — The paper’s conclusions may not depend on it.
- Based: passes — The paper gives a reason why it holds.
Probably not a substantial claim. The paper’s conclusions may not depend on it.
None of the sources cited for this claim have been checked yet.
In the paper
“The resulting pipeline gives comparable performance to the best of the negative binomial-based software packages but with greater speed and reliability for large data sets (10,21).”
§ limma powers differential expression analyses for RNA-sequencing and microarray studies > RESULTS > Statistical principles
What the sources say
plain- Asserted: passes — The authors put it forward as true.
- Checkable: passes — It can be checked against evidence.
- Load-bearing: passes — The paper’s conclusions depend on it.
- Based: passes — The paper gives a reason why it holds.
It may state two separate claims as one.
The paper states this without a source or data behind it here, so there is nothing to check it against. The quote shows it is in the paper.
In the paper
“This has the effect of sharing information between samples. Analysing the data as a whole also allows us to model correlations that may exist between samples due to repeated measures or other causes.”
§ limma powers differential expression analyses for RNA-sequencing and microarray studies > RESULTS > Statistical principles
hedgeddirect- Asserted: passes — The authors put it forward as true.
- Checkable: passes — It can be checked against evidence.
- Load-bearing: passes — The paper’s conclusions depend on it.
- Based: passes — The paper gives a reason why it holds.
It may state two separate claims as one.
The paper states this without a source or data behind it here, so there is nothing to check it against. The quote shows it is in the paper.
In the paper
“The weights can be preset based on external quality information, or may be estimated from the expression data itself.”
§ limma powers differential expression analyses for RNA-sequencing and microarray studies > RESULTS > Statistical principles
hedged- Asserted: passes — The authors put it forward as true.
- Checkable: passes — It can be checked against evidence.
- Load-bearing: unclear — It is unclear whether the paper’s conclusions depend on it.
- Based: passes — The paper gives a reason why it holds.
It may state two separate claims as one.
The paper states this without a source or data behind it here, so there is nothing to check it against. The quote shows it is in the paper.
In the paper
“limma is the only software package to provide methods for error rate control across multiple contrasts and genes simultaneously.”
§ limma powers differential expression analyses for RNA-sequencing and microarray studies > RESULTS > Finding differentially expressed genes
plain- Asserted: passes — The authors put it forward as true.
- Checkable: passes — It can be checked against evidence.
- Load-bearing: fails — The paper’s conclusions may not depend on it.
- Based: fails — The paper may give no reason why it holds.
Probably not a substantial claim. The paper’s conclusions may not depend on it. The paper may give no reason why it holds.
A result the paper reports from its own data — it cites no other source for it, so there is none to check. The quote shows it is in the paper.
In the paper
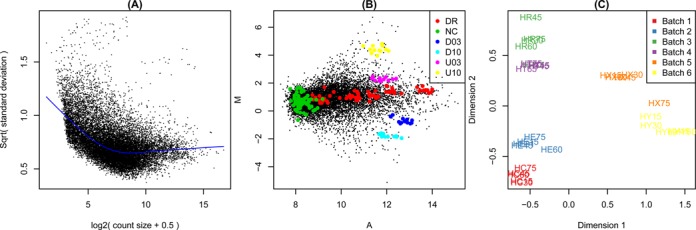
“Total variability asymptotes to biological variability as count sizes increases.”
§ limma powers differential expression analyses for RNA-sequencing and microarray studies > RESULTS > Graphical exploration of data quality
plaincorrelational- Asserted: passes — The authors put it forward as true.
- Checkable: passes — It can be checked against evidence.
- Load-bearing: fails — The paper’s conclusions may not depend on it.
- Based: passes — The paper gives a reason why it holds.
Probably not a substantial claim. The paper’s conclusions may not depend on it.
In the paper
“The propexpr function compares intensities to those of negative control probes to estimate the total proportion of probes on each array that correspond to expressed genes (34).”
§ limma powers differential expression analyses for RNA-sequencing and microarray studies > RESULTS > Preprocessing microarray data
What the sources say
- Not checked yetcites [34] Shi, 2010, Estimating the proportion of microarray probes expressed in an RNA sample, Nucleic Acids Res. source
plaindirect- Asserted: passes — The authors put it forward as true.
- Checkable: passes — It can be checked against evidence.
- Load-bearing: fails — The paper’s conclusions may not depend on it.
- Based: passes — The paper gives a reason why it holds.
Probably not a substantial claim. The paper’s conclusions may not depend on it.
The paper states this without a source or data behind it here, so there is nothing to check it against. The quote shows it is in the paper.
In the paper
“Many limma functions are generic or operate appropriately on objects of different classes.”
§ limma powers differential expression analyses for RNA-sequencing and microarray studies > RESULTS > User-interface
plain- Asserted: passes — The authors put it forward as true.
- Checkable: passes — It can be checked against evidence.
- Load-bearing: fails — The paper’s conclusions may not depend on it.
- Based: fails — The paper may give no reason why it holds.
Probably not a substantial claim. The paper’s conclusions may not depend on it. The paper may give no reason why it holds.
The paper states this without a source or data behind it here, so there is nothing to check it against. The quote shows it is in the paper.
In the paper
“limma also provides the possibility of analysing two-colour microarrays as if they were single channel microarrays with two separate samples hybridized to each physical array. This provides a very powerful type of analysis in which intensities can be directly compared between microarrays.”
§ limma powers differential expression analyses for RNA-sequencing and microarray studies > RESULTS > Finding differentially expressed genes
plaindirect- Asserted: passes — The authors put it forward as true.
- Checkable: passes — It can be checked against evidence.
- Load-bearing: unclear — It is unclear whether the paper’s conclusions depend on it.
- Based: passes — The paper gives a reason why it holds.
It may state two separate claims as one.
In the paper
“the treat function can be used to test whether the log2-fold-change is greater than a threshold rather than merely different to zero (45). This can be effective for prioritizing results that are biologically as well as statistically significant.”
§ limma powers differential expression analyses for RNA-sequencing and microarray studies > RESULTS > Finding differentially expressed genes
What the sources say
- Not checked yetcites [45] McCarthy, 2009, Testing significance relative to a fold-change threshold is a TREAT, Bioinformatics source
plain- Asserted: passes — The authors put it forward as true.
- Checkable: passes — It can be checked against evidence.
- Load-bearing: unclear — It is unclear whether the paper’s conclusions depend on it.
- Based: passes — The paper gives a reason why it holds.
It may state two separate claims as one.
The paper states this without a source or data behind it here, so there is nothing to check it against. The quote shows it is in the paper.
In the paper
“All the linear model fits, whether using lmFit or lmscFit, produce a fitted model object with the same structure.”
- Also stated in: § Finding differentially expressed genes · plain
“This consistency allows the same framework for DE to be used for all experimental designs and platform technologies.”
§ limma powers differential expression analyses for RNA-sequencing and microarray studies > RESULTS > Finding differentially expressed genes
plaindirect- Asserted: passes — The authors put it forward as true.
- Checkable: passes — It can be checked against evidence.
- Load-bearing: passes — The paper’s conclusions depend on it.
- Based: passes — The paper gives a reason why it holds.
It may state two separate claims as one.
- Also stated in: § Finding differentially expressed genes · plain
In the paper
“The neqc function implements quantile normalization for Illumina BeadChips making special use of the control probes specific to these arrays (24).”
§ limma powers differential expression analyses for RNA-sequencing and microarray studies > RESULTS > Preprocessing microarray data
What the sources say
- Not checked yetcites [24] Shi, 2010, Optimizing the noise versus bias trade-off for Illumina Whole Genome Expression Beadchips, Nucleic Acids Res. source
plaindirect- Asserted: passes — The authors put it forward as true.
- Checkable: passes — It can be checked against evidence.
- Load-bearing: fails — The paper’s conclusions may not depend on it.
- Based: passes — The paper gives a reason why it holds.
Probably not a substantial claim. The paper’s conclusions may not depend on it.
None of the sources cited for this claim have been checked yet.
In the paper
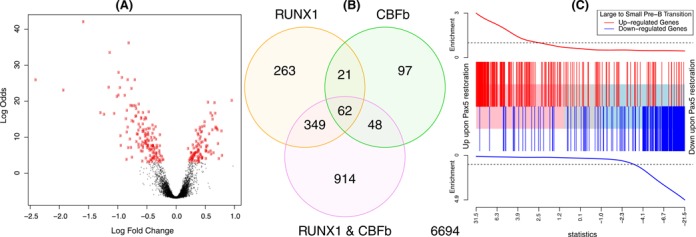
“The plot shows a strong positive concordance between Pax5 restoration and the large to small cell transition.”
§ limma powers differential expression analyses for RNA-sequencing and microarray studies > RESULTS > Finding differentially expressed genes
What the sources say
boostedcorrelational- Asserted: passes — The authors put it forward as true.
- Checkable: passes — It can be checked against evidence.
- Load-bearing: fails — The paper’s conclusions may not depend on it.
- Based: passes — The paper gives a reason why it holds.
Probably not a substantial claim. The paper’s conclusions may not depend on it.
The paper states this without a source or data behind it here, so there is nothing to check it against. The quote shows it is in the paper.
In the paper
“The memory requirements are linear in the number of genes and the number of samples.”
§ limma powers differential expression analyses for RNA-sequencing and microarray studies > RESULTS > User-interface
plaincorrelational- Asserted: passes — The authors put it forward as true.
- Checkable: passes — It can be checked against evidence.
- Load-bearing: fails — The paper’s conclusions may not depend on it.
- Based: fails — The paper may give no reason why it holds.
Probably not a substantial claim. The paper’s conclusions may not depend on it. The paper may give no reason why it holds.
In the paper
“Barcodeplot is similar to the set location plot introduced by Subramanian et al. (63), with a number of enhancements, especially the ability to incorporate genes with positive and negative prior directions.”
§ limma powers differential expression analyses for RNA-sequencing and microarray studies > RESULTS > Higher-level analyses
What the sources say
- Not checked yetcites [63] Subramanian, 2005, Gene set enrichment analysis: a knowledge-based approach for interpreting genome-wide expression profiles, Proc. Natl. Acad. Sci. U.S.A. source
plaincorrelational- Asserted: passes — The authors put it forward as true.
- Checkable: passes — It can be checked against evidence.
- Load-bearing: fails — The paper’s conclusions may not depend on it.
- Based: passes — The paper gives a reason why it holds.
Probably not a substantial claim. The paper’s conclusions may not depend on it.
The paper states this without a source or data behind it here, so there is nothing to check it against. The quote shows it is in the paper.
In the paper
“The propTrueNull function estimates the number of truly differentially expressed genes that remain to be identified. Mathematically, it estimates the proportion of true null hypotheses in a collection of hypothesis tests given a vector of P-values.”
§ limma powers differential expression analyses for RNA-sequencing and microarray studies > RESULTS > Higher-level analyses
plain- Asserted: passes — The authors put it forward as true.
- Checkable: passes — It can be checked against evidence.
- Load-bearing: fails — The paper’s conclusions may not depend on it.
- Based: passes — The paper gives a reason why it holds.
Probably not a substantial claim. The paper’s conclusions may not depend on it.
The paper states this without a source or data behind it here, so there is nothing to check it against. The quote shows it is in the paper.
In the paper
“The romer function in limma implements a GSEA approach that is based on rotation instead of permutation.”
§ limma powers differential expression analyses for RNA-sequencing and microarray studies > RESULTS > Higher-level analyses
plain- Asserted: passes — The authors put it forward as true.
- Checkable: passes — It can be checked against evidence.
- Load-bearing: fails — The paper’s conclusions may not depend on it.
- Based: passes — The paper gives a reason why it holds.
Probably not a substantial claim. The paper’s conclusions may not depend on it.
The paper states this without a source or data behind it here, so there is nothing to check it against. The quote shows it is in the paper.
In the paper
“Like camera and mroast, it can be used with a battery of gene sets and with any linear model.”
§ limma powers differential expression analyses for RNA-sequencing and microarray studies > RESULTS > Higher-level analyses
plain- Asserted: passes — The authors put it forward as true.
- Checkable: passes — It can be checked against evidence.
- Load-bearing: fails — The paper’s conclusions may not depend on it.
- Based: passes — The paper gives a reason why it holds.
Probably not a substantial claim. The paper’s conclusions may not depend on it. It may state two separate claims as one.
In the paper
“limma includes a robustified shrinkage strategy that allows for gene-wise shrinkage factors to be estimated (18). This ensures unusually large variances are not squeezed too heavily, reducing the chance that they will appear statistically significant, while more consistently expressed genes are squeezed more severely towards the common variance.”
§ limma powers differential expression analyses for RNA-sequencing and microarray studies > RESULTS > Finding differentially expressed genes
What the sources say
- Not checked yetcites [18] Phipson, 2013, Empirical Bayes in the presence of exceptional cases, with application to microarray data
plaindirect- Asserted: passes — The authors put it forward as true.
- Checkable: passes — It can be checked against evidence.
- Load-bearing: passes — The paper’s conclusions depend on it.
- Based: passes — The paper gives a reason why it holds.
It may state two separate claims as one.
A result the paper reports from its own data — it cites no other source for it, so there is none to check. The quote shows it is in the paper.
In the paper
“This plot shows that technical variability decreases with count size.”
§ limma powers differential expression analyses for RNA-sequencing and microarray studies > RESULTS > Graphical exploration of data quality
plaindirect- Asserted: passes — The authors put it forward as true.
- Checkable: passes — It can be checked against evidence.
- Load-bearing: fails — The paper’s conclusions may not depend on it.
- Based: passes — The paper gives a reason why it holds.
Probably not a substantial claim. The paper’s conclusions may not depend on it.
In the paper
“The limma authors maintain mouse and human versions of the Molecular Signatures Database collections (64) in R binary format that can be conveniently used with camera, mroast or romer”
§ limma powers differential expression analyses for RNA-sequencing and microarray studies > RESULTS > Higher-level analyses
What the sources say
- Not checked yetcites [64] Liberzon, 2011, Molecular signatures database (MSigDB) 3.0, Bioinformatics source
plain- Asserted: passes — The authors put it forward as true.
- Checkable: passes — It can be checked against evidence.
- Load-bearing: fails — The paper’s conclusions may not depend on it.
- Based: passes — The paper gives a reason why it holds.
Probably not a substantial claim. The paper’s conclusions may not depend on it.
The paper states this without a source or data behind it here, so there is nothing to check it against. The quote shows it is in the paper.
In the paper
“The limma software is freely available online as part of the Bioconductor project (http://www.bioconductor.org).”
§ limma powers differential expression analyses for RNA-sequencing and microarray studies > RESULTS > User-interface
plain- Asserted: passes — The authors put it forward as true.
- Checkable: passes — It can be checked against evidence.
- Load-bearing: fails — The paper’s conclusions may not depend on it.
- Based: passes — The paper gives a reason why it holds.
Probably not a substantial claim. The paper’s conclusions may not depend on it.
The paper states this without a source or data behind it here, so there is nothing to check it against. The quote shows it is in the paper.
In the paper
“Most estimation procedures finish in a few seconds on a standard desktop computer and virtually all in less than a minute.”
§ limma powers differential expression analyses for RNA-sequencing and microarray studies > RESULTS > User-interface
plain- Asserted: passes — The authors put it forward as true.
- Checkable: passes — It can be checked against evidence.
- Load-bearing: fails — The paper’s conclusions may not depend on it.
- Based: fails — The paper may give no reason why it holds.
Probably not a substantial claim. The paper’s conclusions may not depend on it. The paper may give no reason why it holds. It may state two separate claims as one.
In the paper
“The simplest approach is implemented in the geneSetTest and wilcoxGST functions, which perform rank-based tests (13). These tests assess whether the specified set of genes is more highly ranked in an ordered list of all genes than would be expected by chance.”
§ limma powers differential expression analyses for RNA-sequencing and microarray studies > RESULTS > Higher-level analyses
What the sources say
- Not checked yetcites [13] Michaud, 2008, Integrative analysis of runx1 downstream pathways and target genes, BMC Genomics source
plain- Asserted: passes — The authors put it forward as true.
- Checkable: passes — It can be checked against evidence.
- Load-bearing: fails — The paper’s conclusions may not depend on it.
- Based: passes — The paper gives a reason why it holds.
Probably not a substantial claim. The paper’s conclusions may not depend on it. It may state two separate claims as one.
The paper states this without a source or data behind it here, so there is nothing to check it against. The quote shows it is in the paper.
In the paper
“First, each function has its own documentation page that concisely but completely specifies the input data, options and output format of the function.”
§ limma powers differential expression analyses for RNA-sequencing and microarray studies > RESULTS > User-interface
plain- Asserted: passes — The authors put it forward as true.
- Checkable: passes — It can be checked against evidence.
- Load-bearing: fails — The paper’s conclusions may not depend on it.
- Based: passes — The paper gives a reason why it holds.
Probably not a substantial claim. The paper’s conclusions may not depend on it.
The paper states this without a source or data behind it here, so there is nothing to check it against. The quote shows it is in the paper.
In the paper
“All of these data classes obey many analogies with matrices.”
§ limma powers differential expression analyses for RNA-sequencing and microarray studies > RESULTS > User-interface
plain- Asserted: passes — The authors put it forward as true.
- Checkable: passes — It can be checked against evidence.
- Load-bearing: fails — The paper’s conclusions may not depend on it.
- Based: fails — The paper may give no reason why it holds.
Probably not a substantial claim. The paper’s conclusions may not depend on it. The paper may give no reason why it holds.
In the paper
“Camera has been used successfully in a number of biomedical projects (57).”
§ limma powers differential expression analyses for RNA-sequencing and microarray studies > RESULTS > Higher-level analyses
What the sources say
- Not checked yetcites [57] Wu, 2013, Gene-expression data integration to squamous cell lung cancer subtypes reveals drug sensitivity, Br. J. Cancer source
plain- Asserted: passes — The authors put it forward as true.
- Checkable: passes — It can be checked against evidence.
- Load-bearing: fails — The paper’s conclusions may not depend on it.
- Based: passes — The paper gives a reason why it holds.
Probably not a substantial claim. The paper’s conclusions may not depend on it.
The paper states this without a source or data behind it here, so there is nothing to check it against. The quote shows it is in the paper.
In the paper
“The plotMDS function uses multi-dimensional scaling to plot differences in expression profiles between different samples (Figure 3C). Distances between samples on the plot represent ‘leading fold change’, which is defined as the root-mean-square average of the log-fold-changes for the genes best distinguishing each pair of samples.”
§ limma powers differential expression analyses for RNA-sequencing and microarray studies > RESULTS > Finding differentially expressed genes
plain- Asserted: passes — The authors put it forward as true.
- Checkable: passes — It can be checked against evidence.
- Load-bearing: fails — The paper’s conclusions may not depend on it.
- Based: passes — The paper gives a reason why it holds.
Probably not a substantial claim. The paper’s conclusions may not depend on it. It may state two separate claims as one.
The paper states this without a source or data behind it here, so there is nothing to check it against. The quote shows it is in the paper.
In the paper
“All the between-arrays normalization methods are accessible for RNA-seq data from within the voom function.”
§ limma powers differential expression analyses for RNA-sequencing and microarray studies > RESULTS > Preprocessing microarray data
plain- Asserted: passes — The authors put it forward as true.
- Checkable: passes — It can be checked against evidence.
- Load-bearing: fails — The paper’s conclusions may not depend on it.
- Based: fails — The paper may give no reason why it holds.
Probably not a substantial claim. The paper’s conclusions may not depend on it. The paper may give no reason why it holds.
The paper states this without a source or data behind it here, so there is nothing to check it against. The quote shows it is in the paper.
In the paper
“More than 120 other Bioconductor packages make use of limma (as of March 2014).”
§ limma powers differential expression analyses for RNA-sequencing and microarray studies > RESULTS > User-interface
plain- Asserted: passes — The authors put it forward as true.
- Checkable: passes — It can be checked against evidence.
- Load-bearing: fails — The paper’s conclusions may not depend on it.
- Based: fails — The paper may give no reason why it holds.
Probably not a substantial claim. The paper’s conclusions may not depend on it. The paper may give no reason why it holds.
The paper states this without a source or data behind it here, so there is nothing to check it against. The quote shows it is in the paper.
In the paper
“Other enhancements include the ability to replace the loess curve with a spline curve that has high robustness breakdown properties, and the ability to apply empirical Bayes moderation to the spline curves for multiple regions within the same array (robust-spline normalization).”
§ limma powers differential expression analyses for RNA-sequencing and microarray studies > RESULTS > Preprocessing microarray data
plain- Asserted: passes — The authors put it forward as true.
- Checkable: passes — It can be checked against evidence.
- Load-bearing: unclear — It is unclear whether the paper’s conclusions depend on it.
- Based: passes — The paper gives a reason why it holds.
It may state two separate claims as one.
In the paper
“Camera computes a variance inflation factor from the inter-gene correlation and uses this to adjust the variance of the summary statistics. This avoids optimistic P-values in the test results, but also reduces statistical power.”
§ limma powers differential expression analyses for RNA-sequencing and microarray studies > RESULTS > Higher-level analyses
What the sources say
- Not checked yetcites [56] Wu, 2012, Camera: a competitive gene set test accounting for inter-gene correlation, Nucleic Acids Res. source
plaindirect- Asserted: passes — The authors put it forward as true.
- Checkable: passes — It can be checked against evidence.
- Load-bearing: unclear — It is unclear whether the paper’s conclusions depend on it.
- Based: passes — The paper gives a reason why it holds.
It may state two separate claims as one.
In the paper
“The limma package is implemented primarily in R (65) and includes some C code to speed up computationally intensive steps.”
§ limma powers differential expression analyses for RNA-sequencing and microarray studies > RESULTS > User-interface
What the sources say
- Not checked yetcites [65] R Development Core Team, 2014
plain- Asserted: passes — The authors put it forward as true.
- Checkable: passes — It can be checked against evidence.
- Load-bearing: fails — The paper’s conclusions may not depend on it.
- Based: passes — The paper gives a reason why it holds.
Probably not a substantial claim. The paper’s conclusions may not depend on it. It may state two separate claims as one.
The paper states this without a source or data behind it here, so there is nothing to check it against. The quote shows it is in the paper.
In the paper
“The limma package provides three levels of documentation.”
§ limma powers differential expression analyses for RNA-sequencing and microarray studies > RESULTS > User-interface
plain- Asserted: passes — The authors put it forward as true.
- Checkable: passes — It can be checked against evidence.
- Load-bearing: fails — The paper’s conclusions may not depend on it.
- Based: passes — The paper gives a reason why it holds.
Probably not a substantial claim. The paper’s conclusions may not depend on it.
The paper states this without a source or data behind it here, so there is nothing to check it against. The quote shows it is in the paper.
In the paper
“limma defines a number of classes that have been tailored to handle both microarray and RNA-seq data.”
§ limma powers differential expression analyses for RNA-sequencing and microarray studies > RESULTS > User-interface
plain- Asserted: passes — The authors put it forward as true.
- Checkable: passes — It can be checked against evidence.
- Load-bearing: fails — The paper’s conclusions may not depend on it.
- Based: fails — The paper may give no reason why it holds.
Probably not a substantial claim. The paper’s conclusions may not depend on it. The paper may give no reason why it holds.
None of the sources cited for this claim have been checked yet.
In the paper
“Applications of limma's linear modelling strategy beyond the intended analysis of gene expression data have been made in a variety of applications, including the analysis of data from Nuclear Magnetic Resonance spectroscopy, PCR (including Nanostring), quantitative proteomics (80), DNA methylation arrays and comparative ChIP-seq (81).”
§ limma powers differential expression analyses for RNA-sequencing and microarray studies > DISCUSSION
What the sources say
- Not checked yetcites [80] Brusniak, 2008, Corra: computational framework and tools for LC-MS discovery and targeted mass spectrometry-based proteomics, BMC Bioinformatics source
- Not checked yetcites [81] Lun, 2014, De novo detection of differentially bound regions for ChIP-seq data using peaks and windows: controlling error rates correctly, Nucleic Acids Res. source
plain- Asserted: passes — The authors put it forward as true.
- Checkable: passes — It can be checked against evidence.
- Load-bearing: fails — The paper’s conclusions may not depend on it.
- Based: passes — The paper gives a reason why it holds.
Probably not a substantial claim. The paper’s conclusions may not depend on it.
The paper states this without a source or data behind it here, so there is nothing to check it against. The quote shows it is in the paper.
In the paper
“Similarly, each data class has a documentation page explaining all the required and optional components of objects of that class.”
§ limma powers differential expression analyses for RNA-sequencing and microarray studies > RESULTS > User-interface
plain- Asserted: passes — The authors put it forward as true.
- Checkable: passes — It can be checked against evidence.
- Load-bearing: fails — The paper’s conclusions may not depend on it.
- Based: fails — The paper may give no reason why it holds.
Probably not a substantial claim. The paper’s conclusions may not depend on it. The paper may give no reason why it holds.
The paper states this without a source or data behind it here, so there is nothing to check it against. The quote shows it is in the paper.
In the paper
“Third, the package comes with an extensive user's guide of over 120 pages, available from the drop-down menu in Windows or alternatively launched by the limmaUsersGuide command.”
§ limma powers differential expression analyses for RNA-sequencing and microarray studies > RESULTS > User-interface
plain- Asserted: passes — The authors put it forward as true.
- Checkable: passes — It can be checked against evidence.
- Load-bearing: fails — The paper’s conclusions may not depend on it.
- Based: passes — The paper gives a reason why it holds.
Probably not a substantial claim. The paper’s conclusions may not depend on it.
The paper states this without a source or data behind it here, so there is nothing to check it against. The quote shows it is in the paper.
In the paper
“It also includes 10 fully worked case studies for which full data and code are provided.”
§ limma powers differential expression analyses for RNA-sequencing and microarray studies > RESULTS > User-interface
plainn = 10- Asserted: passes — The authors put it forward as true.
- Checkable: passes — It can be checked against evidence.
- Load-bearing: fails — The paper’s conclusions may not depend on it.
- Based: passes — The paper gives a reason why it holds.
Probably not a substantial claim. The paper’s conclusions may not depend on it.
The paper states this without a source or data behind it here, so there is nothing to check it against. The quote shows it is in the paper.
In the paper
“The support site archives answers to many common questions, including many queries about experimental design and setting up appropriate design matrices.”
§ limma powers differential expression analyses for RNA-sequencing and microarray studies > RESULTS > User-interface
plain- Asserted: passes — The authors put it forward as true.
- Checkable: passes — It can be checked against evidence.
- Load-bearing: fails — The paper’s conclusions may not depend on it.
- Based: fails — The paper may give no reason why it holds.
Probably not a substantial claim. The paper’s conclusions may not depend on it. The paper may give no reason why it holds.
The paper states this without a source or data behind it here, so there is nothing to check it against. The quote shows it is in the paper.
In the paper
“Second, a series of more general subject help pages serve to link together functions and classes that are used for related purposes.”
§ limma powers differential expression analyses for RNA-sequencing and microarray studies > RESULTS > User-interface
plaincorrelational- Asserted: passes — The authors put it forward as true.
- Checkable: passes — It can be checked against evidence.
- Load-bearing: fails — The paper’s conclusions may not depend on it.
- Based: passes — The paper gives a reason why it holds.
Probably not a substantial claim. The paper’s conclusions may not depend on it.
The paper states this without a source or data behind it here, so there is nothing to check it against. The quote shows it is in the paper.
In the paper
“The user's guide gives detailed advice on how to analyse a variety of common study designs.”
§ limma powers differential expression analyses for RNA-sequencing and microarray studies > RESULTS > User-interface
plain- Asserted: passes — The authors put it forward as true.
- Checkable: passes — It can be checked against evidence.
- Load-bearing: fails — The paper’s conclusions may not depend on it.
- Based: passes — The paper gives a reason why it holds.
Probably not a substantial claim. The paper’s conclusions may not depend on it.
None of the sources cited for this claim have been checked yet.
In the paper
“The limma package is a core component of Bioconductor, an R-based open-source software development project in statistical genomics (1,2).”
§ limma powers differential expression analyses for RNA-sequencing and microarray studies > INTRODUCTION
What the sources say
plain- Asserted: passes — The authors put it forward as true.
- Checkable: passes — It can be checked against evidence.
- Load-bearing: fails — The paper’s conclusions may not depend on it.
- Based: passes — The paper gives a reason why it holds.
Probably not a substantial claim. The paper’s conclusions may not depend on it.
In the paper
“Simply subtracting background from foreground intensities is too heavy-handed (23).”
§ limma powers differential expression analyses for RNA-sequencing and microarray studies > RESULTS > Preprocessing microarray data
What the sources say
- Not checked yetcites [23] Ritchie, 2007, A comparison of background correction methods for two-colour microarrays, Bioinformatics source
plain- Asserted: passes — The authors put it forward as true.
- Checkable: fails — It may be too vague to check against evidence.
- Load-bearing: fails — The paper’s conclusions may not depend on it.
- Based: passes — The paper gives a reason why it holds.
Probably not a substantial claim. It may be too vague to check against evidence. The paper’s conclusions may not depend on it.
A conclusion the paper draws from its own results — it cites no other source for it, so there is none to check. The quote shows it is in the paper.
In the paper
“The limma backgroundCorrect function offers a range of more sophisticated alternatives, most unique to the package.”
§ limma powers differential expression analyses for RNA-sequencing and microarray studies > RESULTS > Preprocessing microarray data
plain- Asserted: passes — The authors put it forward as true.
- Checkable: passes — It can be checked against evidence.
- Load-bearing: fails — The paper’s conclusions may not depend on it.
- Based: passes — The paper gives a reason why it holds.
Probably not a substantial claim. The paper’s conclusions may not depend on it.
In the paper
“Traditionally, RNA-seq data require specialized software based on the negative binomial or similar distributions (20).”
§ limma powers differential expression analyses for RNA-sequencing and microarray studies > RESULTS > Statistical principles
What the sources say
- Not checked yetcites [20] Robinson, 2010, edgeR: a Bioconductor package for differential expression analysis of digital gene expression data, Bioinformatics source
plain- Asserted: passes — The authors put it forward as true.
- Checkable: passes — It can be checked against evidence.
- Load-bearing: passes — The paper’s conclusions depend on it.
- Based: passes — The paper gives a reason why it holds.
Probably not a substantial claim.
A conclusion the paper draws from its own results — it cites no other source for it, so there is none to check. The quote shows it is in the paper.
In the paper
“If permutation is applied to all the samples in a multi-factor experiment, then the composite null hypothesis being testing is an uninteresting one and the power to reject it may be highly dependent on the existence of DE between treatment conditions that are not of primary interest.”
§ limma powers differential expression analyses for RNA-sequencing and microarray studies > RESULTS > Statistical principles
hedgedconditional- Asserted: passes — The authors put it forward as true.
- Checkable: passes — It can be checked against evidence.
- Load-bearing: passes — The paper’s conclusions depend on it.
- Based: passes — The paper gives a reason why it holds.
It may state two separate claims as one.
A conclusion the paper draws from its own results — it cites no other source for it, so there is none to check. The quote shows it is in the paper.
In the paper
“This provides a type of unsupervised clustering of the samples. It is useful for examining how different are the profiles produced by different experimental factors and for identifying unexpected patterns, such as batch effects, that should be adjusted for during the linear model analysis.”
§ limma powers differential expression analyses for RNA-sequencing and microarray studies > RESULTS > Finding differentially expressed genes
plaincorrelational- Asserted: passes — The authors put it forward as true.
- Checkable: passes — It can be checked against evidence.
- Load-bearing: fails — The paper’s conclusions may not depend on it.
- Based: passes — The paper gives a reason why it holds.
Probably not a substantial claim. The paper’s conclusions may not depend on it. It may state two separate claims as one.
A conclusion the paper draws from its own results — it cites no other source for it, so there is none to check. The quote shows it is in the paper.
In the paper
“giving it the ability to downweigh less reliable probes or to give higher priority to control probes or house-keeping genes.”
§ limma powers differential expression analyses for RNA-sequencing and microarray studies > RESULTS > Preprocessing microarray data
plaindirect- Asserted: passes — The authors put it forward as true.
- Checkable: passes — It can be checked against evidence.
- Load-bearing: unclear — It is unclear whether the paper’s conclusions depend on it.
- Based: passes — The paper gives a reason why it holds.
It may state two separate claims as one.
A conclusion the paper draws from its own results — it cites no other source for it, so there is none to check. The quote shows it is in the paper.
In the paper
“The flexibility of the linear modelling approach allows almost any experimental design to be handled. Experiments with two or more groups, factorial and time-course designs, and internal controls such as dye-swaps can all be modelled and summarized using the lmFit function.”
§ limma powers differential expression analyses for RNA-sequencing and microarray studies > RESULTS > Finding differentially expressed genes
plaindirect- Asserted: passes — The authors put it forward as true.
- Checkable: passes — It can be checked against evidence.
- Load-bearing: passes — The paper’s conclusions depend on it.
- Based: passes — The paper gives a reason why it holds.
It may state two separate claims as one.
A conclusion the paper draws from its own results — it cites no other source for it, so there is none to check. The quote shows it is in the paper.
In the paper
“This robust strategy offers the benefits of shrinkage to the majority of the genes, whilst negating the effects of outliers.”
§ limma powers differential expression analyses for RNA-sequencing and microarray studies > RESULTS > Finding differentially expressed genes
plaindirect- Asserted: passes — The authors put it forward as true.
- Checkable: passes — It can be checked against evidence.
- Load-bearing: passes — The paper’s conclusions depend on it.
- Based: passes — The paper gives a reason why it holds.
It may state two separate claims as one.
A conclusion the paper draws from its own results — it cites no other source for it, so there is none to check. The quote shows it is in the paper.
In the paper
“which reduces the number of false positives for genes with very small variances and improves power to detect DE for genes with larger variances.”
§ limma powers differential expression analyses for RNA-sequencing and microarray studies > RESULTS > Finding differentially expressed genes
plaindirect- Asserted: passes — The authors put it forward as true.
- Checkable: passes — It can be checked against evidence.
- Load-bearing: passes — The paper’s conclusions depend on it.
- Based: passes — The paper gives a reason why it holds.
It may state two separate claims as one.
A conclusion the paper draws from its own results — it cites no other source for it, so there is none to check. The quote shows it is in the paper.
In the paper
“This approach is considerably faster than alternative approaches to differential splicing, making large-scale surveys of differential exon usage feasible.”
§ limma powers differential expression analyses for RNA-sequencing and microarray studies > RESULTS > Finding differentially expressed genes
plaindirect- Asserted: passes — The authors put it forward as true.
- Checkable: passes — It can be checked against evidence.
- Load-bearing: passes — The paper’s conclusions depend on it.
- Based: fails — The paper may give no reason why it holds.
Probably not a substantial claim. The paper may give no reason why it holds. It may state two separate claims as one.
A conclusion the paper draws from its own results — it cites no other source for it, so there is none to check. The quote shows it is in the paper.
In the paper
“Different technology platforms introduce different biases and so require different normalization methods.”
§ limma powers differential expression analyses for RNA-sequencing and microarray studies > RESULTS > Preprocessing microarray data
plaindirect- Asserted: passes — The authors put it forward as true.
- Checkable: passes — It can be checked against evidence.
- Load-bearing: passes — The paper’s conclusions depend on it.
- Based: fails — The paper may give no reason why it holds.
Probably not a substantial claim. The paper may give no reason why it holds. It may state two separate claims as one.
In the paper
“but they implicitly assume that the expression level of each gene is conditionally independent of other genes and hence give optimistic P-values (55).”
§ limma powers differential expression analyses for RNA-sequencing and microarray studies > RESULTS > Higher-level analyses
What the sources say
- Not checked yetcites [55] Wu, 2010, ROAST: rotation gene set tests for complex microarray experiments, Bioinformatics source
plaindirect- Asserted: passes — The authors put it forward as true.
- Checkable: passes — It can be checked against evidence.
- Load-bearing: passes — The paper’s conclusions depend on it.
- Based: passes — The paper gives a reason why it holds.
It may state two separate claims as one.
- The authors state this as an assumption: The geneSetTest and wilcoxGST rank-based tests assume that the expression level of each gene is conditionally independent of other genes.
A conclusion the paper draws from its own results — it cites no other source for it, so there is none to check. The quote shows it is in the paper.
In the paper
“Although originally developed with microarray data in mind, the development of the voom methodology unlocks the majority of analysis methods for use on RNA-seq data, such as random effects modelling and gene set testing.”
§ limma powers differential expression analyses for RNA-sequencing and microarray studies > DISCUSSION
plaindirect- Asserted: passes — The authors put it forward as true.
- Checkable: passes — It can be checked against evidence.
- Load-bearing: passes — The paper’s conclusions depend on it.
- Based: fails — The paper may give no reason why it holds.
Probably not a substantial claim. The paper may give no reason why it holds.
The paper relies on this without support.
Gene expression studies often involve only a small number of biological replicates.
“Despite the complexity, gene expression studies often involve only a small number of biological replicates.”
The paper relies on this without support.
Many gene expression technologies produce data that are less reliable at lower intensities or abundances.
“This is important because many gene expression technologies produce data that are less reliable at lower intensities or abundances.”
The paper relies on this without support.
Permutation assumes that all samples are independent and identically distributed under the null hypothesis, and these assumptions are frequently unrealistic.
“Even more importantly, permutation assumes that all samples are independent and identically distributed under the null hypothesis, and these assumptions are frequently, usually perhaps, unrealistic.”
The authors state this as an assumption.
The geneSetTest and wilcoxGST rank-based tests assume that the expression level of each gene is conditionally independent of other genes.
“but they implicitly assume that the expression level of each gene is conditionally independent of other genes”
The paper relies on this without support.
Most gene expression studies have false negatives: truly differentially expressed genes that are not detected because the study did not have enough statistical power.
“However, for most studies, there are likely to be false negatives: truly differentially expressed genes that are not detected as differentially expressed because the study did not have enough statistical power to identify them with confidence.”
The paper relies on this without support.
Gene symbols change over time.
“Gene symbols change over time”
The paper relies on this without support.
The use of gene sets requires that gene symbols and annotation be matched between different databases and studies.
“The use of gene sets require that gene symbols and annotation be matched between different databases and studies.”
Claims other papers make about this one
Each is checked against this paper’s own text: does it say what the citing paper says it does?
The source backs part of the claim, not all of it — or backs it for a different population, condition or comparison.
In the citing paper
“Batch effects were corrected using limma R package (79).”
From A mouse tissue atlas of small noncoding RNA (2020) · cites this paper as [79]
Experimental — accuracy not yet measuredThe cited source says what the claim attributes to it.
In the citing paper
“Given the significant increase of data size and complexities of the taxonomy, we re-implemented this method that provides essentially identical results, but drastically improves performance and scalability.”
From A high-resolution transcriptomic and spatial atlas of cell types in the whole mouse brain (2023) · cites this paper as [133]
The cited source says what the claim attributes to it.
In the citing paper
“Peaks that were differentially enriched in deletion strains (relative to the WT strain) were detected via linear modeling and empirical Bayes smoothing in limma package (Ritchie et al. 2015), with P value < 0.05.”
From Mitochondrial retrograde control of transcription evolves with respiratory stress, metabolic adaptation, and virulence in budding yeasts (2026) · cites this paper as Ritchie et al. 2015
The cited source says what the claim attributes to it.
In the citing paper
“Within each tissue configuration, expressions of the CMs were normalized using R package Linnorm (version 2.16.0),55 and batch effect was corrected with removeBatchEffect function from R package Limma (version3.48.3).56”
From Single-cell RNA sequencing reveals maturation trajectory in human pluripotent stem cell-derived cardiomyocytes in engineered tissues (2023) · cites this paper as [56]
The cited source says what the claim attributes to it.
In the citing paper
“Differential expression analysis was performed in Limma v3.34.9 (Ritchie et al., 2015), where strain (HON, FW) and time (0, 1, 6, 24, 72 and 168 h) were specified as fixed main effects, and strain×time as an interaction term, including false discovery rate adjustment of P-values.”
From Genomic and physiological mechanisms underlying skin plasticity during water to air transition in an amphibious fish (2020) · cites this paper as Ritchie et al., 2015
The cited source says what the claim attributes to it.
In the citing paper
“Differential expression analyses of discovery proteomes were carried out via the LIMMA R package [50], and multiple test correction was performed by Benjamini-Hochberg (BH) procedure [51].”
From Integrated analysis of ultra-deep proteomes in cortex, cerebrospinal fluid and serum reveals a mitochondrial signature in Alzheimer’s disease (2020) · cites this paper as [50]
The cited source says what the claim attributes to it.
In the citing paper
“To analyze significant gene regulation, we applied a linear regression model with the Limma package (Ritchie et al., 2015). Gene expression values yi were modeled to be explained by time frames t (early, intermediate and late) and condition c (IL-6 and control). The significance threshold of Benjamini–Hochberg adjusted p < 0.01 was implemented.”
From Model Based Targeting of IL-6-Induced Inflammatory Responses in Cultured Primary Hepatocytes to Improve Application of the JAK Inhibitor Ruxolitinib (2017) · cites this paper as Ritchie et al., 2015
The cited source says what the claim attributes to it.
In the citing paper
“Normalized expression data for astrocytes (GFAP), neurons (NeuN), and microglia (Iba1) were batch corrected separately using removeBatchEffect from Limma version 3.52.4 (Ritchie, Phipson et al. 2015) using brain regions collected as batches.”
From SORLA up-regulation suppresses pathological effects in aged tauopathy mouse brain (2026) · cites this paper as Ritchie, Phipson et al. 2015
The check wasn’t confident either way, so it gives no verdict — never disputed.
In the citing paper
“However, these studies relied almost entirely on synthetic data, supplemented by a few illustrative case studies.”
From Confronting false discoveries in single-cell differential expression (2021) · cites this paper as [34]
Experimental — accuracy not yet measuredIn the citing paper
“Differentially expressed metabolites in each condition were identified using moderate t-statistic implemented in the R/Bioconductor package limma 46 , using sex as a covariate.”
From Healthspan and lifespan extension by fecal microbiota transplantation into progeroid mice (2019) · cites this paper as [46]
Self-check
Percentages, sums and reported differences re-computed from the paper’s own numbers.
Each contradiction between two passages listed here was confirmed by an independent check.
Rated minor: it would not touch a result — a value no result rests on, a p-value that stays on the same side of the significance level, or a conflict that is clerical, resolved elsewhere in the paper, or outside its own findings.
In the paper
§ limma powers differential expression analyses for RNA-sequencing and microarray studies > RESULTS > Preprocessing microarray data
“The plotFB function plots foreground against background intensities for each array and is useful for choosing an appropriate correction method.”
§ limma powers differential expression analyses for RNA-sequencing and microarray studies > RESULTS > Graphical exploration of data quality
“Plots for individual arrays include the foreground–background plots mentioned above (plotFG)”
Citations
Cites
Controlling the False Discovery Rate: A Practical and Powerful Approach to Multiple Testing
Benjamini, Y., & Hochberg, Y. (1995) · Journal of the Royal Statistical Society Series B: Statistical Methodology · doi:10.1111/j.2517-6161.1995.tb02031.x · Cited by 109,482
Subramanian, A., Tamayo, P., Mootha, V. K., Mukherjee, S., Ebert, B. L., Gillette, M. A., Paulovich, A., Pomeroy, S. L., Golub, T. R., Lander, E. S., et al. (2005) · Proceedings of the National Academy of Sciences · doi:10.1073/pnas.0506580102 · Cited by 53,625
STATISTICAL METHODS FOR ASSESSING AGREEMENT BETWEEN TWO METHODS OF CLINICAL MEASUREMENT
Martin Bland, J., & Altman, D. (1986) · The Lancet · doi:10.1016/s0140-6736(86)90837-8 · Cited by 47,965
Gene Ontology: tool for the unification of biology
Ashburner, M., Ball, C. A., Blake, J. A., Botstein, D., Butler, H., Cherry, J. M., Davis, A. P., Dolinski, K., Dwight, S. S., Eppig, J. T., et al. (2000) · Nature Genetics · doi:10.1038/75556 · Cited by 43,206
Robinson, M. D., McCarthy, D. J., & Smyth, G. K. (2010) · Bioinformatics · doi:10.1093/bioinformatics/btp616 · Cited by 41,364
Self-citationfeatureCounts: an efficient general purpose program for assigning sequence reads to genomic features
Liao, Y., Smyth, G. K., & Shi, W. (2014) · Bioinformatics · doi:10.1093/bioinformatics/btt656 · Cited by 27,219
Self-citationRSEM: accurate transcript quantification from RNA-Seq data with or without a reference genome
Li, B., & Dewey, C. N. (2011) · BMC Bioinformatics · doi:10.1186/1471-2105-12-323 · Cited by 22,179
HTSeq—a Python framework to work with high-throughput sequencing data
Anders, S., Pyl, P. T., & Huber, W. (2015) · Bioinformatics · doi:10.1093/bioinformatics/btu638 · Cited by 21,464
Bioconductor: open software development for computational biology and bioinformatics
Gentleman, R. C., Carey, V. J., Bates, D. M., Bolstad, B., Dettling, M., Dudoit, S., Ellis, B., Gautier, L., Ge, Y., Gentry, J., et al. (2004) · Genome biology · doi:10.1186/gb-2004-5-10-r80 · Cited by 12,082
Self-citationSmyth, G. K. (2004) · Statistical Applications in Genetics and Molecular Biology · doi:10.2202/1544-6115.1027 · Cited by 11,829
Self-citation
Research works printed but not linked: 9
- Efron, 1973, Stein's estimation rule and its competitors—an empirical Bayes approach, J. Am. Stat. Assoc., 68, 117
- Phipson, 2013, Empirical Bayes in the presence of exceptional cases, with application to microarray data
- Phipson, 2013, Empirical Bayes modelling of expression profiles and their associations
- Cleveland, 1993, Visualizing Data
- Dudoit, 2002, Statistical methods for identifying differentially expressed genes in replicated cDNA microarray experiments, Stat. Sin., 12, 111
- Ritchie, 2004, Quantitative quality control and background correction for two-colour microarray data
- R Development Core Team, 2014, R: A Language and Environment for Statistical Computing
- Leisch, 2002, Sweave: dynamic generation of statistical reports using literate data analysis, 575
- Xie, 2013, Dynamic Documents with R and knitr
Cited by
Sorted by citations
Integrating single-cell transcriptomic data across different conditions, technologies, and species
Butler, A., Hoffman, P., Smibert, P., Papalexi, E., & Satija, R. (2018) · Nature Biotechnology · doi:10.1038/nbt.4096 · Cited by 13,174
Fast, sensitive and accurate integration of single-cell data with Harmony
Korsunsky, I., Millard, N., Fan, J., Slowikowski, K., Zhang, F., Wei, K., Baglaenko, Y., Brenner, M., Loh, P.-R., & Raychaudhuri, S. (2019) · Nature Methods · doi:10.1038/s41592-019-0619-0 · Cited by 10,488
Scenic: single-cell regulatory network inference and clustering.
Aibar, S., González-Blas, C. B., Moerman, T., Huynh-Thu, V. A., Imrichova, H., Hulselmans, G., Rambow, F., Marine, J.-C., Geurts, P., Aerts, J., et al. (2017) · Nature Methods · doi:10.1038/nmeth.4463 · Cited by 6,520
Search-and-replace genome editing without double-strand breaks or donor DNA
Anzalone, A. V., Randolph, P. B., Davis, J. R., Sousa, A. A., Koblan, L. W., Levy, J. M., Chen, P. J., Wilson, C., Newby, G. A., Raguram, A., et al. (2019) · Nature · doi:10.1038/s41586-019-1711-4 · Cited by 4,767
Differential analyses for RNA-seq: transcript-level estimates improve gene-level inferences
Soneson, C., Love, M. I., & Robinson, M. D. (2015) · F1000Research · doi:10.12688/f1000research.7563.1 · Cited by 3,929
Next-generation characterization of the Cancer Cell Line Encyclopedia
Ghandi, M., Huang, F. W., Jané-Valbuena, J., Kryukov, G. V., Lo, C. C., McDonald, E. R., Barretina, J., Gelfand, E. T., Bielski, C. M., Li, H., et al. (2019) · Nature · doi:10.1038/s41586-019-1186-3 · Cited by 3,394
Rosenberg, J. E., Hoffman-Censits, J., Powles, T., van der Heijden, M. S., Balar, A. V., Necchi, A., Dawson, N., O'Donnell, P. H., Balmanoukian, A., Loriot, Y., et al. (2016) · The Lancet · doi:10.1016/s0140-6736(16)00561-4 · Cited by 3,669
Multi-omics of the gut microbial ecosystem in inflammatory bowel diseases
Lloyd-Price, J., Arze, C., Ananthakrishnan, A. N., Schirmer, M., Avila-Pacheco, J., Poon, T. W., Andrews, E., Ajami, N. J., Bonham, K. S., Brislawn, C. J., et al. (2019) · Nature · doi:10.1038/s41586-019-1237-9 · Cited by 3,143
Single-cell transcriptomic analysis of Alzheimer’s disease
Mathys, H., Davila-Velderrain, J., Peng, Z., Gao, F., Mohammadi, S., Young, J. Z., Menon, M., He, L., Abdurrob, F., Jiang, X., et al. (2019) · Nature · doi:10.1038/s41586-019-1195-2 · Cited by 2,568
B cells and tertiary lymphoid structures promote immunotherapy response
Helmink, B. A., Reddy, S. M., Gao, J., Zhang, S., Basar, R., Thakur, R., Yizhak, K., Sade-Feldman, M., Blando, J., Han, G., et al. (2020) · Nature · doi:10.1038/s41586-019-1922-8 · Cited by 2,731
“The Limma R software package 44 was used to identify DEGs from normalized microarray data for the RCC cohort.”
Desai, M. S., Seekatz, A. M., Koropatkin, N. M., Kamada, N., Hickey, C. A., Wolter, M., Pudlo, N. A., Kitamoto, S., Terrapon, N., Muller, A., et al. (2016) · Cell · doi:10.1016/j.cell.2016.10.043 · Cited by 2,805
Multivariable association discovery in population-scale meta-omics studies
Mallick, H., Rahnavard, A., McIver, L. J., Ma, S., Zhang, Y., Nguyen, L. H., Tickle, T. L., Weingart, G., Ren, B., Schwager, E. H., et al. (2021) · PLOS Computational Biology · doi:10.1371/journal.pcbi.1009442 · Cited by 2,596
Opportunities and challenges in long-read sequencing data analysis
Amarasinghe, S. L., Su, S., Dong, X., Zappia, L., Ritchie, M. E., & Gouil, Q. (2020) · Genome Biology · doi:10.1186/s13059-020-1935-5 · Cited by 2,530
Self-citationBatch effects in single-cell RNA-sequencing data are corrected by matching mutual nearest neighbors
Haghverdi, L., Lun, A. T. L., Morgan, M. D., & Marioni, J. C. (2018) · Nature Biotechnology · doi:10.1038/nbt.4091 · Cited by 2,416
Expanded encyclopaedias of DNA elements in the human and mouse genomes
The ENCODE Project Consortium, Abascal, F., Acosta, R., Addleman, N. J., Adrian, J., Afzal, V., Ai, R., Aken, B., Akiyama, J. A., Jammal, O. A., et al. (2020) · Nature · doi:10.1038/s41586-020-2493-4 · Cited by 2,378
NicheNet: Modeling intercellular communication by linking ligands to target genes
Browaeys, R., Saelens, W., & Saeys, Y. (2020) · Nature Methods · doi:10.1038/s41592-019-0667-5 · Cited by 2,192
Current best practices in single-cell RNA-seq analysis: a tutorial
Luecken, M. D., & Theis, F. J. (2019) · Molecular Systems Biology · doi:10.15252/msb.20188746 · Cited by 2,231
Shared and distinct transcriptomic cell types across neocortical areas
Tasic, B., Yao, Z., Graybuck, L. T., Smith, K. A., Nguyen, T. N., Bertagnolli, D., Goldy, J., Garren, E., Economo, M. N., Viswanathan, S., et al. (2018) · Nature · doi:10.1038/s41586-018-0654-5 · Cited by 1,746
McCarthy, D. J., Campbell, K. R., Lun, A. T. L., & Wills, Q. F. (2017) · Bioinformatics · doi:10.1093/bioinformatics/btw777 · Cited by 1,852
Siddiqui, I., Schaeuble, K., Chennupati, V., Fuertes Marraco, S. A., Calderon-Copete, S., Pais Ferreira, D., Carmona, S. J., Scarpellino, L., Gfeller, D., Pradervand, S., et al. (2019) · Immunity · doi:10.1016/j.immuni.2018.12.021 · Cited by 1,679
Landscape and Dynamics of Single Immune Cells in Hepatocellular Carcinoma
Zhang, Q., He, Y., Luo, N., Patel, S. J., Han, Y., Gao, R., Modak, M., Carotta, S., Haslinger, C., Kind, D., et al. (2019) · Cell · doi:10.1016/j.cell.2019.10.003 · Cited by 1,624
Adult mouse cortical cell taxonomy revealed by single cell transcriptomics
Tasic, B., Menon, V., Nguyen, T. N., Kim, T. K., Jarsky, T., Yao, Z., Levi, B., Gray, L. T., Sorensen, S. A., Dolbeare, T., et al. (2016) · Nature Neuroscience · doi:10.1038/nn.4216 · Cited by 1,714
Comparative Analysis of Single-Cell RNA Sequencing Methods
Ziegenhain, C., Vieth, B., Parekh, S., Reinius, B., Guillaumet-Adkins, A., Smets, M., Leonhardt, H., Heyn, H., Hellmann, I., & Enard, W. (2017) · Molecular Cell · doi:10.1016/j.molcel.2017.01.023 · Cited by 1,494
Global characterization of T cells in non-small-cell lung cancer by single-cell sequencing
Guo, X., Zhang, Y., Zheng, L., Zheng, C., Song, J., Zhang, Q., Kang, B., Liu, Z., Jin, L., Xing, R., et al. (2018) · Nature Medicine · doi:10.1038/s41591-018-0045-3 · Cited by 1,651
Koyama, S., Akbay, E. A., Li, Y. Y., Herter-Sprie, G. S., Buczkowski, K. A., Richards, W. G., Gandhi, L., Redig, A. J., Rodig, S. J., Asahina, H., et al. (2016) · Nature Communications · doi:10.1038/ncomms10501 · Cited by 1,580
Pidsley, R., Zotenko, E., Peters, T. J., Lawrence, M. G., Risbridger, G. P., Molloy, P., Van Djik, S., Muhlhausler, B., Stirzaker, C., & Clark, S. J. (2016) · Genome biology · doi:10.1186/s13059-016-1066-1 · Cited by 1,480
Designer matrices for intestinal stem cell and organoid culture
Gjorevski, N., Sachs, N., Manfrin, A., Giger, S., Bragina, M. E., Ordóñez-Morán, P., Clevers, H., & Lutolf, M. P. (2016) · Nature · doi:10.1038/nature20168 · Cited by 1,426
Conserved pan-cancer microenvironment subtypes predict response to immunotherapy
Bagaev, A., Kotlov, N., Nomie, K., Svekolkin, V., Gafurov, A., Isaeva, O., Osokin, N., Kozlov, I., Frenkel, F., Gancharova, O., et al. (2021) · Cancer Cell · doi:10.1016/j.ccell.2021.04.014 · Cited by 1,302
Transcriptome-scale spatial gene expression in the human dorsolateral prefrontal cortex
Maynard, K. R., Collado-Torres, L., Weber, L. M., Uytingco, C., Barry, B. K., Williams, S. R., Catallini, J. L., Tran, M. N., Besich, Z., Tippani, M., et al. (2021) · Nature Neuroscience · doi:10.1038/s41593-020-00787-0 · Cited by 1,222
Prioritization of cancer therapeutic targets using CRISPR–Cas9 screens
Behan, F. M., Iorio, F., Picco, G., Gonçalves, E., Beaver, C. M., Migliardi, G., Santos, R., Rao, Y., Sassi, F., Pinnelli, M., et al. (2019) · Nature · doi:10.1038/s41586-019-1103-9 · Cited by 1,338
NASH limits anti-tumour surveillance in immunotherapy-treated HCC
Pfister, D., Núñez, N. G., Pinyol, R., Govaere, O., Pinter, M., Szydlowska, M., Gupta, R., Qiu, M., Deczkowska, A., Weiner, A., et al. (2021) · Nature · doi:10.1038/s41586-021-03362-0 · Cited by 1,294
Cysteine depletion induces pancreatic tumor ferroptosis in mice
Badgley, M. A., Kremer, D. M., Maurer, H. C., DelGiorno, K. E., Lee, H.-J., Purohit, V., Sagalovskiy, I. R., Ma, A., Kapilian, J., Firl, C. E. M., et al. (2020) · Science · doi:10.1126/science.aaw9872 · Cited by 1,294
McDermott, D. F., Huseni, M. A., Atkins, M. B., Motzer, R. J., Rini, B. I., Escudier, B., Fong, L., Joseph, R. W., Pal, S. K., Reeves, J. A., et al. (2018) · Nature Medicine · doi:10.1038/s41591-018-0053-3 · Cited by 1,260
Landscape of X chromosome inactivation across human tissues
GTEx Consortium, Tukiainen, T., Villani, A.-C., Yen, A., Rivas, M. A., Marshall, J. L., Satija, R., Aguirre, M., Gauthier, L., Fleharty, M., et al. (2017) · Nature · doi:10.1038/nature24265 · Cited by 1,138
A high-resolution transcriptomic and spatial atlas of cell types in the whole mouse brain
Yao, Z., van Velthoven, C. T. J., Kunst, M., Zhang, M., McMillen, D., Lee, C., Jung, W., Goldy, J., Abdelhak, A., Aitken, M., et al. (2023) · Nature · doi:10.1038/s41586-023-06812-z · Cited by 1,203
Systems biological assessment of immunity to mild versus severe COVID-19 infection in humans
Arunachalam, P. S., Wimmers, F., Mok, C. K. P., Perera, R. A. P. M., Scott, M., Hagan, T., Sigal, N., Feng, Y., Bristow, L., Tak-Yin Tsang, O., et al. (2020) · Science · doi:10.1126/science.abc6261 · Cited by 1,186
Best practices for single-cell analysis across modalities
Heumos, L., Schaar, A. C., Lance, C., Litinetskaya, A., Drost, F., Zappia, L., Lücken, M. D., Strobl, D. C., Henao, J., Curion, F., et al. (2023) · Nature Reviews Genetics · doi:10.1038/s41576-023-00586-w · Cited by 1,051
“3).”
An atlas of the protein-coding genes in the human, pig, and mouse brain
Sjöstedt, E., Zhong, W., Fagerberg, L., Karlsson, M., Mitsios, N., Adori, C., Oksvold, P., Edfors, F., Limiszewska, A., Hikmet, F., et al. (2020) · Science · doi:10.1126/science.aay5947 · Cited by 1,151
Deep learning-based multi-omics integration robustly predicts survival in liver cancer
Chaudhary, K., Poirion, O. B., Lu, L., & Garmire, L. X. (2018) · Clinical Cancer Research · doi:10.1158/1078-0432.ccr-17-0853 · Cited by 1,091
Shared molecular neuropathology across major psychiatric disorders parallels polygenic overlap
Gandal, M. J., Haney, J. R., Parikshak, N. N., Leppa, V., Ramaswami, G., Hartl, C., Schork, A. J., Appadurai, V., Buil, A., Werge, T. M., et al. (2018) · Science · doi:10.1126/science.aad6469 · Cited by 1,095
Gene co-expression analysis for functional classification and gene–disease predictions
van Dam, S., Võsa, U., van der Graaf, A., Franke, L., & de Magalhães, J. P. (2017) · Briefings in Bioinformatics · doi:10.1093/bib/bbw139 · Cited by 995
RETRACTED ARTICLE: Microbiome analyses of blood and tissues suggest cancer diagnostic approach
Poore, G. D., Kopylova, E., Zhu, Q., Carpenter, C., Fraraccio, S., Wandro, S., Kosciolek, T., Janssen, S., Metcalf, J., Song, S. J., et al. (2020) · Nature · doi:10.1038/s41586-020-2095-1 · Cited by 989
RetractedJavierre, B. M., Burren, O. S., Wilder, S. P., Kreuzhuber, R., Hill, S. M., Sewitz, S., Cairns, J., Wingett, S. W., Várnai, C., Thiecke, M. J., et al. (2016) · Cell · doi:10.1016/j.cell.2016.09.037 · Cited by 1,046
Kathleen Cuningham Foundation Consortium for Research into Familial Breast Cancer (kConFab), Savas, P., Virassamy, B., Ye, C., Salim, A., Mintoff, C. P., Caramia, F., Salgado, R., Byrne, D. J., Teo, Z. L., et al. (2018) · Nature Medicine · doi:10.1038/s41591-018-0078-7 · Cited by 992
Thomas, A. M., Manghi, P., Asnicar, F., Pasolli, E., Armanini, F., Zolfo, M., Beghini, F., Manara, S., Karcher, N., Pozzi, C., et al. (2019) · Nature Medicine · doi:10.1038/s41591-019-0405-7 · Cited by 1,030
Differential abundance testing on single-cell data using k-nearest neighbor graphs
Dann, E., Henderson, N. C., Teichmann, S. A., Morgan, M. D., & Marioni, J. C. (2022) · Nature Biotechnology · doi:10.1038/s41587-021-01033-z · Cited by 938
Confronting false discoveries in single-cell differential expression
Squair, J. W., Gautier, M., Kathe, C., Anderson, M. A., James, N. D., Hutson, T. H., Hudelle, R., Qaiser, T., Matson, K. J. E., Barraud, Q., et al. (2021) · doi:10.1101/2021.03.12.435024 · Cited by 1,086
Innate immune memory in the brain shapes neurological disease hallmarks
Wendeln, A.-C., Degenhardt, K., Kaurani, L., Gertig, M., Ulas, T., Jain, G., Wagner, J., Häsler, L. M., Wild, K., Skodras, A., et al. (2018) · Nature · doi:10.1038/s41586-018-0023-4 · Cited by 956
Hobit and Blimp1 instruct a universal transcriptional program of tissue residency in lymphocytes
Mackay, L. K., Minnich, M., Kragten, N. A. M., Liao, Y., Nota, B., Seillet, C., Zaid, A., Man, K., Preston, S., Freestone, D., et al. (2016) · Science · doi:10.1126/science.aad2035 · Cited by 1,010
Self-citationZeng, D., Li, M., Zhou, R., Zhang, J., Sun, H., Shi, M., Bin, J., Liao, Y., Rao, J., & Liao, W. (2019) · Cancer Immunology Research · doi:10.1158/2326-6066.cir-18-0436 · Cited by 986
Co-expression of CD39 and CD103 identifies tumor-reactive CD8 T cells in human solid tumors
Duhen, T., Duhen, R., Montler, R., Moses, J., Moudgil, T., de Miranda, N. F., Goodall, C. P., Blair, T. C., Fox, B. A., McDermott, J. E., et al. (2018) · Nature Communications · doi:10.1038/s41467-018-05072-0 · Cited by 938
Farge, T., Saland, E., de Toni, F., Aroua, N., Hosseini, M., Perry, R., Bosc, C., Sugita, M., Stuani, L., Fraisse, M., et al. (2017) · Cancer Discovery · doi:10.1158/2159-8290.cd-16-0441 · Cited by 912
Monaco, G., Lee, B., Xu, W., Mustafah, S., Hwang, Y. Y., Carré, C., Burdin, N., Visan, L., Ceccarelli, M., Poidinger, M., et al. (2019) · Cell Reports · doi:10.1016/j.celrep.2019.01.041 · Cited by 958
Daigle, T. L., Madisen, L., Hage, T. A., Valley, M. T., Knoblich, U., Larsen, R. S., Takeno, M. M., Huang, L., Gu, H., Larsen, R., et al. (2018) · Cell · doi:10.1016/j.cell.2018.06.035 · Cited by 817
Orchestrating single-cell analysis with Bioconductor
Amezquita, R. A., Lun, A. T. L., Becht, E., Carey, V. J., Carpp, L. N., Geistlinger, L., Marini, F., Rue-Albrecht, K., Risso, D., Soneson, C., et al. (2020) · Nature Methods · doi:10.1038/s41592-019-0654-x · Cited by 945
Spangenberg, E., Severson, P. L., Hohsfield, L. A., Crapser, J., Zhang, J., Burton, E. A., Zhang, Y., Spevak, W., Lin, J., Phan, N. Y., et al. (2019) · Nature Communications · doi:10.1038/s41467-019-11674-z · Cited by 939
Discovering the anticancer potential of non-oncology drugs by systematic viability profiling
Corsello, S. M., Nagari, R. T., Spangler, R. D., Rossen, J., Kocak, M., Bryan, J. G., Humeidi, R., Peck, D., Wu, X., Tang, A. A., et al. (2020) · Nature Cancer · doi:10.1038/s43018-019-0018-6 · Cited by 878
A 17-gene stemness score for rapid determination of risk in acute leukaemia
Ng, S. W. K., Mitchell, A., Kennedy, J. A., Chen, W. C., McLeod, J., Ibrahimova, N., Arruda, A., Popescu, A., Gupta, V., Schimmer, A. D., et al. (2016) · Nature · doi:10.1038/nature20598 · Cited by 912
The Immunology of Multisystem Inflammatory Syndrome in Children with COVID-19
Consiglio, C. R., Cotugno, N., Sardh, F., Pou, C., Amodio, D., Rodriguez, L., Tan, Z., Zicari, S., Ruggiero, A., Pascucci, G. R., et al. (2020) · Cell · doi:10.1016/j.cell.2020.09.016 · Cited by 919
Dominguez, C. X., Müller, S., Keerthivasan, S., Koeppen, H., Hung, J., Gierke, S., Breart, B., Foreman, O., Bainbridge, T. W., Castiglioni, A., et al. (2020) · Cancer Discovery · doi:10.1158/2159-8290.cd-19-0644 · Cited by 857
Winkler, E. S., Bailey, A. L., Kafai, N. M., Nair, S., McCune, B. T., Yu, J., Fox, J. M., Chen, R. E., Earnest, J. T., Keeler, S. P., et al. (2020) · Nature Immunology · doi:10.1038/s41590-020-0778-2 · Cited by 901
Autophagy maintains the metabolism and function of young and old stem cells
Ho, T. T., Warr, M. R., Adelman, E. R., Lansinger, O. M., Flach, J., Verovskaya, E. V., Figueroa, M. E., & Passegué, E. (2017) · Nature · doi:10.1038/nature21388 · Cited by 896
NR4A transcription factors limit CAR T cell function in solid tumours
Chen, J., López-Moyado, I. F., Seo, H., Lio, C.-W. J., Hempleman, L. J., Sekiya, T., Yoshimura, A., Scott-Browne, J. P., & Rao, A. (2019) · Nature · doi:10.1038/s41586-019-0985-x · Cited by 874
Quirós, P. M., Prado, M. A., Zamboni, N., D’Amico, D., Williams, R. W., Finley, D., Gygi, S. P., & Auwerx, J. (2017) · Journal of Cell Biology · doi:10.1083/jcb.201702058 · Cited by 832
Proteogenomic Characterization Reveals Therapeutic Vulnerabilities in Lung Adenocarcinoma
Gillette, M. A., Satpathy, S., Cao, S., Dhanasekaran, S. M., Vasaikar, S. V., Krug, K., Petralia, F., Li, Y., Liang, W.-W., Reva, B., et al. (2020) · Cell · doi:10.1016/j.cell.2020.06.013 · Cited by 820
Self-citationBrain cell type–specific enhancer–promoter interactome maps and disease - risk association
Nott, A., Holtman, I. R., Coufal, N. G., Schlachetzki, J. C. M., Yu, M., Hu, R., Han, C. Z., Pena, M., Xiao, J., Wu, Y., et al. (2019) · Science · doi:10.1126/science.aay0793 · Cited by 699
House, I. G., Savas, P., Lai, J., Chen, A. X. Y., Oliver, A. J., Teo, Z. L., Todd, K. L., Henderson, M. A., Giuffrida, L., Petley, E. V., et al. (2020) · Clinical Cancer Research · doi:10.1158/1078-0432.ccr-19-1868 · Cited by 790
Zhang, Y., Chen, H., Mo, H., Hu, X., Gao, R., Zhao, Y., Liu, B., Niu, L., Sun, X., Yu, X., et al. (2021) · Cancer Cell · doi:10.1016/j.ccell.2021.09.010 · Cited by 783
Peripheral T cell expansion predicts tumour infiltration and clinical response
Wu, T. D., Madireddi, S., de Almeida, P. E., Banchereau, R., Chen, Y.-J. J., Chitre, A. S., Chiang, E. Y., Iftikhar, H., O’Gorman, W. E., Au-Yeung, A., et al. (2020) · Nature · doi:10.1038/s41586-020-2056-8 · Cited by 770
Decoding myofibroblast origins in human kidney fibrosis
Kuppe, C., Ibrahim, M. M., Kranz, J., Zhang, X., Ziegler, S., Perales-Patón, J., Jansen, J., Reimer, K. C., Smith, J. R., Dobie, R., et al. (2021) · Nature · doi:10.1038/s41586-020-2941-1 · Cited by 769
Development of a primary human Small Intestine-on-a-Chip using biopsy-derived organoids
Kasendra, M., Tovaglieri, A., Sontheimer-Phelps, A., Jalili-Firoozinezhad, S., Bein, A., Chalkiadaki, A., Scholl, W., Zhang, C., Rickner, H., Richmond, C. A., et al. (2018) · Scientific Reports · doi:10.1038/s41598-018-21201-7 · Cited by 754
Readhead, B., Haure-Mirande, J.-V., Funk, C. C., Richards, M. A., Shannon, P., Haroutunian, V., Sano, M., Liang, W. S., Beckmann, N. D., Price, N. D., et al. (2018) · Neuron · doi:10.1016/j.neuron.2018.05.023 · Cited by 708
Transcriptomic analysis of purified human cortical microglia reveals age-associated changes
Galatro, T. F., Holtman, I. R., Lerario, A. M., Vainchtein, I. D., Brouwer, N., Sola, P. R., Veras, M. M., Pereira, T. F., Leite, R. E. P., Möller, T., et al. (2017) · Nature Neuroscience · doi:10.1038/nn.4597 · Cited by 741
Patient-derived xenografts undergo mouse-specific tumor evolution
Ben-David, U., Ha, G., Tseng, Y.-Y., Greenwald, N. F., Oh, C., Shih, J., McFarland, J. M., Wong, B., Boehm, J. S., Beroukhim, R., et al. (2017) · Nature Genetics · doi:10.1038/ng.3967 · Cited by 716
McDonald, E. R., de Weck, A., Schlabach, M. R., Billy, E., Mavrakis, K. J., Hoffman, G. R., Belur, D., Castelletti, D., Frias, E., Gampa, K., et al. (2017) · Cell · doi:10.1016/j.cell.2017.07.005 · Cited by 658
Electrophilic properties of itaconate and derivatives regulate the IκBζ–ATF3 inflammatory axis
Bambouskova, M., Gorvel, L., Lampropoulou, V., Sergushichev, A., Loginicheva, E., Johnson, K., Korenfeld, D., Mathyer, M. E., Kim, H., Huang, L.-H., et al. (2018) · Nature · doi:10.1038/s41586-018-0052-z · Cited by 713
Xu, C., Lopez, R., Mehlman, E., Regier, J., Jordan, M. I., & Yosef, N. (2021) · Molecular Systems Biology · doi:10.15252/msb.20209620 · Cited by 691
“A wide range of methods have already been developed for this fundamental problem, initially for Microarrays and later on for bulk RNA sequencing, such as ComBat [15] and limma [16] which rely on generalized linear models with empirical Bayes shrinkage to avoid over-correction.”
MethodA microfluidics-based in vitro model of the gastrointestinal human–microbe interface
Shah, P., Fritz, J. V., Glaab, E., Desai, M. S., Greenhalgh, K., Frachet, A., Niegowska, M., Estes, M., Jäger, C., Seguin-Devaux, C., et al. (2016) · Nature Communications · doi:10.1038/ncomms11535 · Cited by 660
Honeybee gut microbiota promotes host weight gain via bacterial metabolism and hormonal signaling
Zheng, H., Powell, J. E., Steele, M. I., Dietrich, C., & Moran, N. A. (2017) · Proceedings of the National Academy of Sciences · doi:10.1073/pnas.1701819114 · Cited by 664
Healthspan and lifespan extension by fecal microbiota transplantation into progeroid mice
Bárcena, C., Valdés-Mas, R., Mayoral, P., Garabaya, C., Durand, S., Rodríguez, F., Fernández-García, M. T., Salazar, N., Nogacka, A. M., Garatachea, N., et al. (2019) · Nature Medicine · doi:10.1038/s41591-019-0504-5 · Cited by 661
A genome-wide transcriptomic analysis of protein-coding genes in human blood cells
Uhlen, M., Karlsson, M. J., Zhong, W., Tebani, A., Pou, C., Mikes, J., Lakshmikanth, T., Forsström, B., Edfors, F., Odeberg, J., et al. (2019) · Science · doi:10.1126/science.aax9198 · Cited by 594
Keap1 loss promotes Kras-driven lung cancer and results in dependence on glutaminolysis
Romero, R., Sayin, V. I., Davidson, S. M., Bauer, M. R., Singh, S. X., LeBoeuf, S. E., Karakousi, T. R., Ellis, D. C., Bhutkar, A., Sánchez-Rivera, F. J., et al. (2017) · Nature Medicine · doi:10.1038/nm.4407 · Cited by 652
Mitochondrial metabolism promotes adaptation to proteotoxic stress
Tsvetkov, P., Detappe, A., Cai, K., Keys, H. R., Brune, Z., Ying, W., Thiru, P., Reidy, M., Kugener, G., Rossen, J., et al. (2019) · Nature Chemical Biology · doi:10.1038/s41589-019-0291-9 · Cited by 645
Interferon-γ Drives Treg Fragility to Promote Anti-tumor Immunity
Overacre-Delgoffe, A. E., Chikina, M., Dadey, R. E., Yano, H., Brunazzi, E. A., Shayan, G., Horne, W., Moskovitz, J. M., Kolls, J. K., Sander, C., et al. (2017) · Cell · doi:10.1016/j.cell.2017.05.005 · Cited by 627
Single-nucleus and single-cell transcriptomes compared in matched cortical cell types
Bakken, T. E., Hodge, R. D., Miller, J. A., Yao, Z., Nguyen, T. N., Aevermann, B., Barkan, E., Bertagnolli, D., Casper, T., Dee, N., et al. (2018) · PLoS ONE · doi:10.1371/journal.pone.0209648 · Cited by 608
Fumarate is an epigenetic modifier that elicits epithelial-to-mesenchymal transition
Sciacovelli, M., Gonçalves, E., Johnson, T. I., Zecchini, V. R., da Costa, A. S. H., Gaude, E., Drubbel, A. V., Theobald, S. J., Abbo, S. R., Tran, M. G. B., et al. (2016) · Nature · doi:10.1038/nature19353 · Cited by 584
Rodig, S. J., Gusenleitner, D., Jackson, D. G., Gjini, E., Giobbie-Hurder, A., Jin, C., Chang, H., Lovitch, S. B., Horak, C., Weber, J. S., et al. (2018) · Science Translational Medicine · doi:10.1126/scitranslmed.aar3342 · Cited by 579
Chromatin accessibility profiling by ATAC-seq
Grandi, F. C., Modi, H., Kampman, L., & Corces, M. R. (2022) · Nature Protocols · doi:10.1038/s41596-022-00692-9 · Cited by 557
Plasticity in binding confers selectivity in ligand-induced protein degradation
Nowak, R. P., DeAngelo, S. L., Buckley, D., He, Z., Donovan, K. A., An, J., Safaee, N., Jedrychowski, M. P., Ponthier, C. M., Ishoey, M., et al. (2018) · Nature Chemical Biology · doi:10.1038/s41589-018-0055-y · Cited by 615
Neuronal regulation of type 2 innate lymphoid cells via neuromedin U
Cardoso, V., Chesné, J., Ribeiro, H., García-Cassani, B., Carvalho, T., Bouchery, T., Shah, K., Barbosa-Morais, N. L., Harris, N., & Veiga-Fernandes, H. (2017) · Nature · doi:10.1038/nature23469 · Cited by 592
Microbiome–host systems interactions: protective effects of propionate upon the blood–brain barrier
Hoyles, L., Snelling, T., Umlai, U.-K., Nicholson, J. K., Carding, S. R., Glen, R. C., & McArthur, S. (2018) · Microbiome · doi:10.1186/s40168-018-0439-y · Cited by 591
Genetic diagnosis of Mendelian disorders via RNA sequencing
Kremer, L. S., Bader, D. M., Mertes, C., Kopajtich, R., Pichler, G., Iuso, A., Haack, T. B., Graf, E., Schwarzmayr, T., Terrile, C., et al. (2017) · Nature Communications · doi:10.1038/ncomms15824 · Cited by 590
Rosser, E. C., Piper, C. J. M., Matei, D. E., Blair, P. A., Rendeiro, A. F., Orford, M., Alber, D. G., Krausgruber, T., Catalan, D., Klein, N., et al. (2020) · Cell Metabolism · doi:10.1016/j.cmet.2020.03.003 · Cited by 579
Common genetic variation drives molecular heterogeneity in human iPSCs
Kilpinen, H., Goncalves, A., Leha, A., Afzal, V., Alasoo, K., Ashford, S., Bala, S., Bensaddek, D., Casale, F. P., Culley, O. J., et al. (2017) · Nature · doi:10.1038/nature22403 · Cited by 586
Spatially resolved cell atlas of the mouse primary motor cortex by MERFISH
Zhang, M., Eichhorn, S. W., Zingg, B., Yao, Z., Cotter, K., Zeng, H., Dong, H., & Zhuang, X. (2021) · Nature · doi:10.1038/s41586-021-03705-x · Cited by 498
A test metric for assessing single-cell RNA-seq batch correction
Büttner, M., Miao, Z., Wolf, F. A., Teichmann, S. A., & Theis, F. J. (2019) · Nature Methods · doi:10.1038/s41592-018-0254-1 · Cited by 511
Rapid non-uniform adaptation to conformation-specific KRAS(G12C) inhibition
Xue, J. Y., Zhao, Y., Aronowitz, J., Mai, T. T., Vides, A., Qeriqi, B., Kim, D., Li, C., de Stanchina, E., Mazutis, L., et al. (2020) · Nature · doi:10.1038/s41586-019-1884-x · Cited by 543
The cGAS–STING pathway drives type I IFN immunopathology in COVID-19
Domizio, J. D., Gulen, M. F., Saidoune, F., Thacker, V. V., Yatim, A., Sharma, K., Nass, T., Guenova, E., Schaller, M., Conrad, C., et al. (2022) · Nature · doi:10.1038/s41586-022-04421-w · Cited by 538
Johnson, E. C. B., Carter, E. K., Dammer, E. B., Duong, D. M., Gerasimov, E. S., Liu, Y., Liu, J., Betarbet, R., Ping, L., Yin, L., et al. (2022) · Nature Neuroscience · doi:10.1038/s41593-021-00999-y · Cited by 561
Anti-tumor efficacy of a potent and selective non-covalent KRASG12D inhibitor
Hallin, J., Bowcut, V., Calinisan, A., Briere, D. M., Hargis, L., Engstrom, L. D., Laguer, J., Medwid, J., Vanderpool, D., Lifset, E., et al. (2022) · Nature Medicine · doi:10.1038/s41591-022-02007-7 · Cited by 553
Metadata
- Authors
- Ritchie, M. E., Phipson, B., Wu, D., Hu, Y., Law, C. W., Shi, W., & Smyth, G. K.
- Affiliations
- The University of Melbourne (AU)
- Royal Children's Hospital (AU)
- Harvard University (US)
- Walter and Eliza Hall Institute of Medical Research (AU)
- University of Zurich (CH)
- Corresponding author
- Smyth, Gordon K.
- Venue
- Nucleic Acids Research
- Publisher
- Oxford University Press (OUP)
- Published
- 2015-01-20
- Volume
- 43
- Issue
- 7
- Pages
- e47-e47
- ISSN
- 0305-1048 (ISSN-L)
- 1362-4962
- PMC
- PMC4402510
- OpenAlex
- W2146512944
- Cited by
- 40,458
- References
- 73
- Citations by year
- 2026: 4544 · 2025: 5451 · 2024: 5748 · 2023: 5274 · 2022: 5276 · 2021: 4686 · 2020: 3473 · 2019: 2299 · 2018: 1588 · 2017: 1200 · 2016: 684 · 2015: 206
- FWCI
- 532.21
- Type
- journal article
- Language
- en
- Open access
- gold
- doi.org
- Locations
- Nucleic Acids Research (publishedVersion, cc-by)
- PubMed Central (publishedVersion, cc-by)
- PubMed (publishedVersion)
- Zurich Open Repository and Archive (University of Zurich) (acceptedVersion, cc-by)
- reroDoc Digital Library (submittedVersion)
- Minerva Access (University of Melbourne) (submittedVersion, cc-by)
- Digital Access to Scholarship at Harvard (DASH) (Harvard University) (submittedVersion, cc-by)
- Figshare (submittedVersion, cc-by)
- Zurich Open Repository and Archive (University of Zurich) (submittedVersion, cc-by)
- La Trobe University (cc-by)
- Zurich Open Repository and Archive (University of Zurich)
- Funders
- Australian Government
- Medical Research Council
- National Health and Medical Research Council (1054618, 1050661, 1023454)
- Topics
- Life Sciences › Biochemistry, Genetics and Molecular Biology › Molecular Biology › Gene expression and cancer classification
- Life Sciences › Biochemistry, Genetics and Molecular Biology › Molecular Biology › Genomics and Phylogenetic Studies
- Life Sciences › Biochemistry, Genetics and Molecular Biology › Molecular Biology › Bioinformatics and Genomic Networks
- Keywords
- limma, differential expression analysis, RNA-seq, microarray data, differential splicing, gene expression normalization, information borrowing, small sample size, gene expression signatures, Bioconductor, R software
- MeSH terms
- Gene Expression Regulation, Software, Sequence Analysis, RNA, Oligonucleotide Array Sequence Analysis
About these checks
Registry, retraction, Cites and statistics results are computed, not judged, with one exception: a printed reference that no index lists is read once by a model before it counts as a citation error. Claims are extracted by a model and kept only when their quote appears verbatim in the text; each cited source is then checked, with a model’s help, for whether it says what the claim relies on. Those verdicts can be wrong — read the claim’s quote and the cited source before relying on one.
A language model drew the claims from the paper on 2026-10-06, under version 3 of the claim definition (model deepseek-v4.1-flash, prompt extract-v3).
A second model labelled each claim on 2026-10-06 (model jev-1.13-20260917, definition revision gold-guideline-v0.2).
Cited sources are checked with a language model’s help (gpt-6-sol).
Statistics and arithmetic are recomputed, not judged.
Confidence bands are shown only for fields calibrated on our annotated test set. None is calibrated yet, so no band is shown.
What counts as a claim ›How we measure confidence ›How we check this ›
Are you an author, or do you see a problem with this page? Request a review
