

The DOI matches its Crossref record; 148 of the 148 references it cites were found in a registry or an index.
Cellular plasticity balances the metabolic and proliferation dynamics of a regenerating liver
Open accessPublished version of a preprint
Abstract
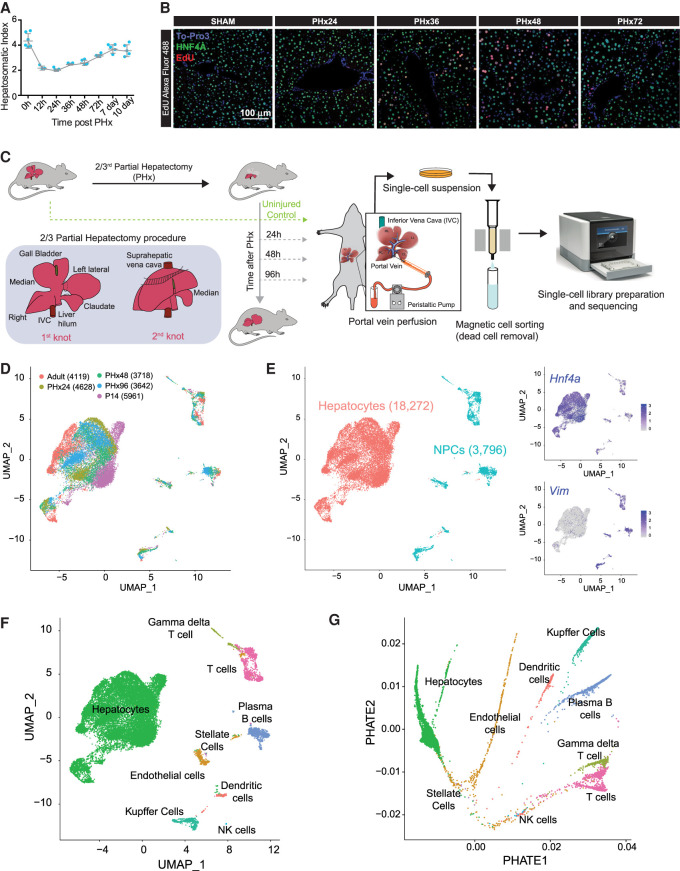
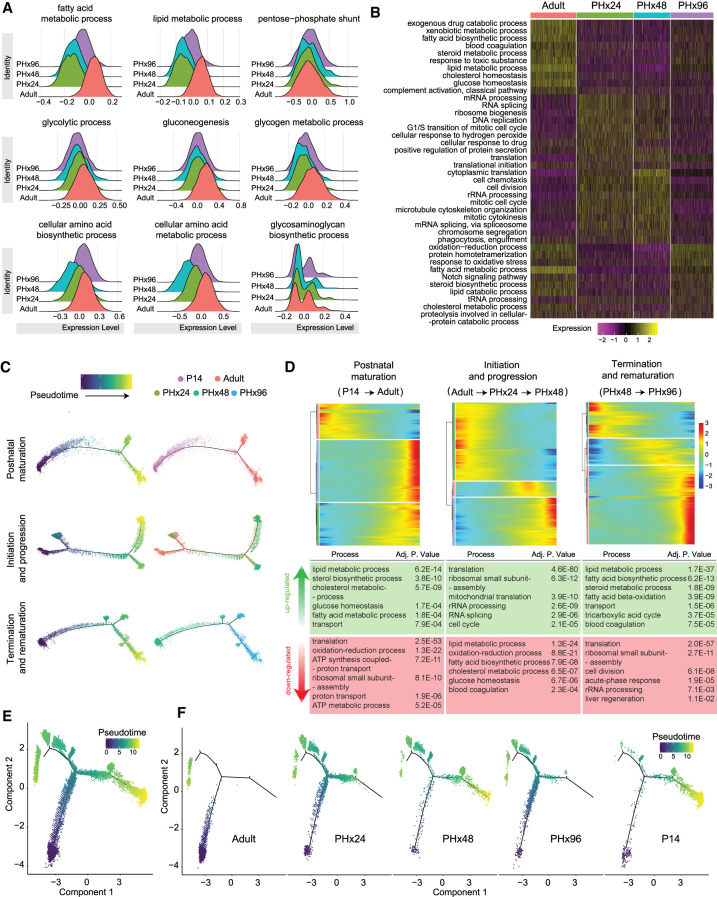
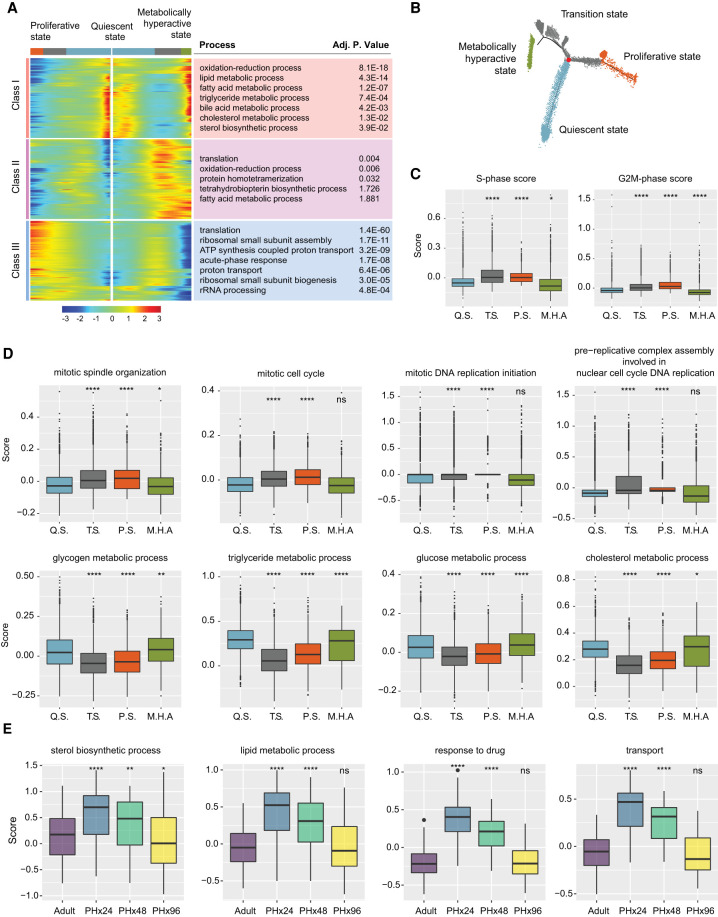
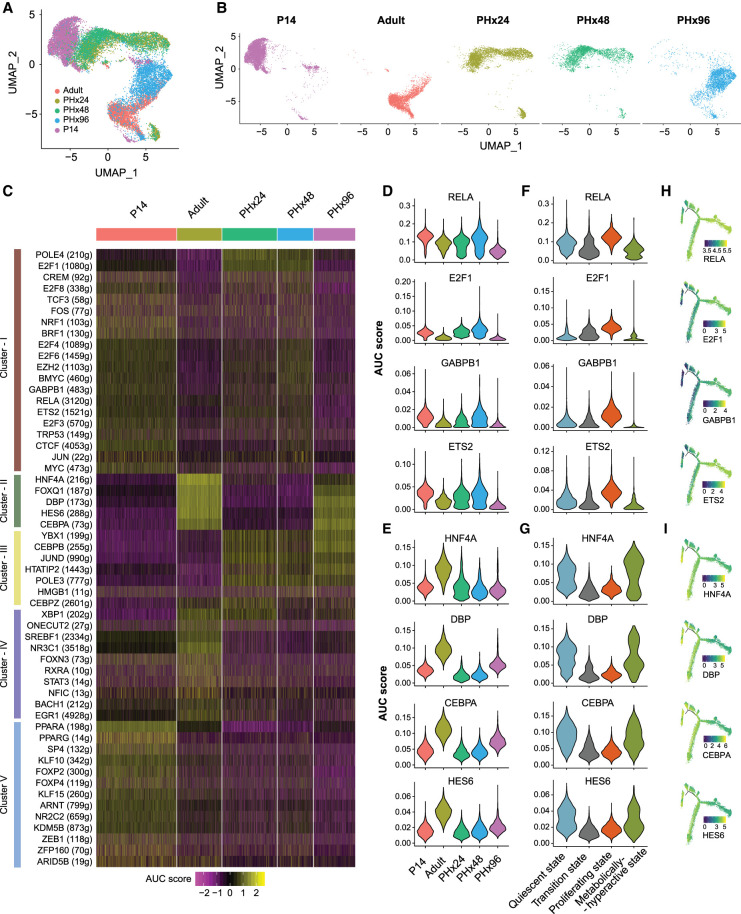
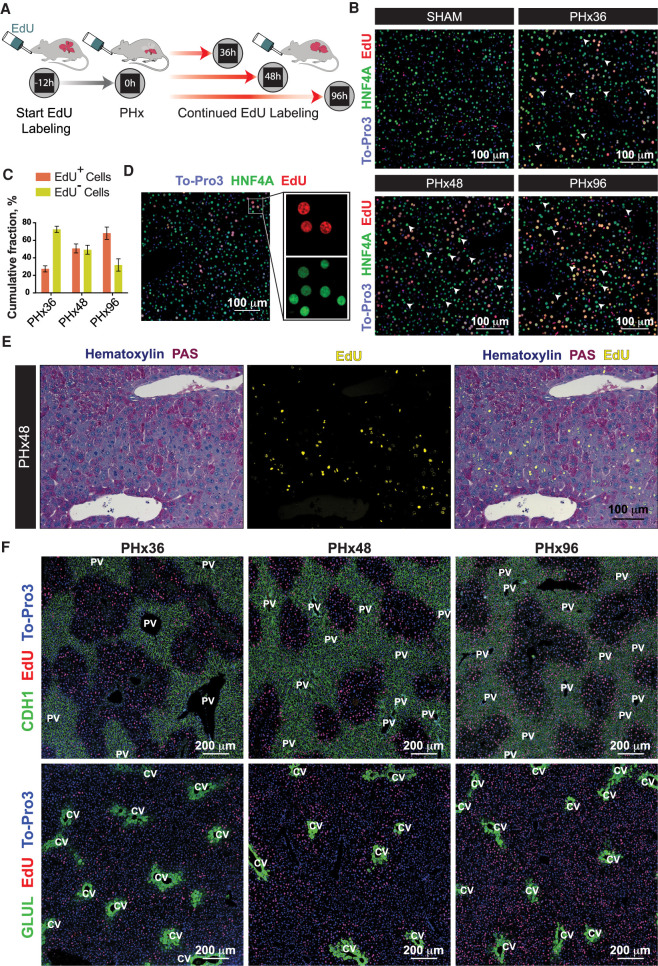
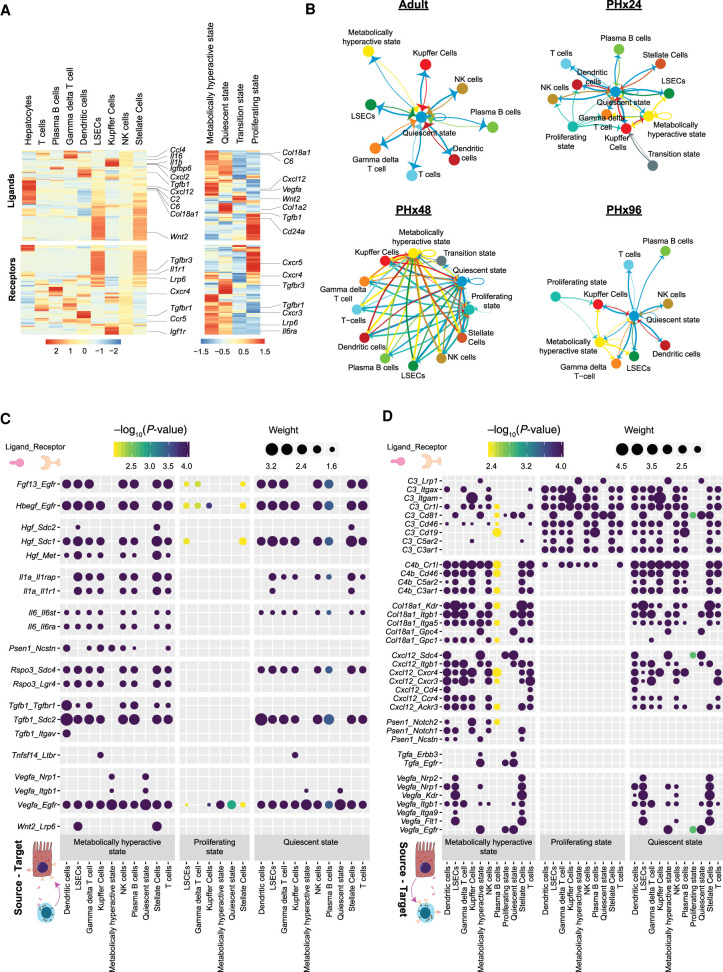
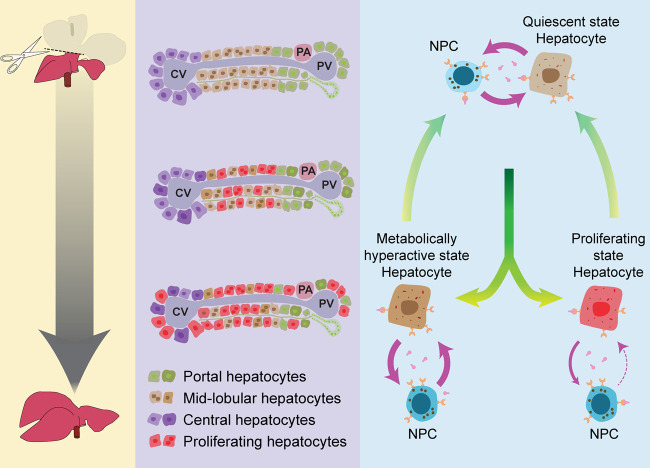
The adult liver has an exceptional ability to regenerate, but how it maintains its specialized functions during regeneration is unclear. Here, we used partial hepatectomy (PHx) in tandem with single-cell transcriptomics to track cellular transitions and heterogeneities of ∼22,000 liver cells through the initiation, progression, and termination phases of mouse liver regeneration. Our results uncovered that, following PHx, a subset of hepatocytes transiently reactivates an early-postnatal-like gene expression program to proliferate, while a distinct population of metabolically hyperactive cells appears to compensate for any temporary deficits in liver function. Cumulative EdU labeling and immunostaining of metabolic, portal, and central vein–specific markers revealed that hepatocyte proliferation after PHx initiates in the midlobular region before proceeding toward the periportal and pericentral areas. We further demonstrate that portal and central vein proximal hepatocytes retain their metabolically active state to preserve essential liver functions while midlobular cells proliferate nearby. Through combined analysis of gene regulatory networks and cell–cell interaction maps, we found that regenerating hepatocytes redeploy key developmental regulons, which are guided by extensive ligand-receptor-mediated signaling events between hepatocytes and nonparenchymal cells. Altogether, our study offers a detailed blueprint of the intercellular crosstalk and cellular reprogramming that balances the metabolic and proliferative requirements of a regenerating liver.
Overview
The claims and statistics of this paper haven’t been checked yet.
Run the check — free, no account needed. It reads the open-access text and checks the sources it cites.
Integrity signals
Registry
Cites
Statistics
Figures
Verification
Claims the paper makes
The claims and statistics of this paper haven’t been checked yet.
Run the check — free, no account needed. It reads the open-access text and checks the sources it cites.
Claims other papers make about this one
Each is checked against this paper’s own text: does it say what the citing paper says it does?
The source backs part of the claim, not all of it — or backs it for a different population, condition or comparison.
In the citing paper
“Numerous changes in mRNA abundance and splicing occur within the first 3 weeks of life (Bhate et al. 2015; Chembazhi et al. 2021; Liang et al. 2022), as hematopoiesis and proliferative activity are reduced, and gene products involved in metabolism are induced (Zaret 2002; Gordillo et al. 2015).”
From ESRP2–microRNA-122 axis promotes the postnatal onset of liver polyploidization and maturation (2025) · cites this paper as Chembazhi et al. 2021
Experimental — accuracy not yet measuredThe source backs part of the claim, not all of it — or backs it for a different population, condition or comparison.
In the citing paper
“Several studies suggest that hepatocyte proliferation leads to metabolic remodelling and that hepatocytes across the liver can adapt dynamically to changes during regeneration106,107,[131], [132], [133], [134], [135]”
From Distinct hepatocyte identities in liver homeostasis and regeneration (2023) · cites this paper as [106]
Experimental — accuracy not yet measuredThe source backs part of the claim, not all of it — or backs it for a different population, condition or comparison.
In the citing paper
“During pan-zonal regeneration induced by partial hepatectomy, hepatocytes across the liver underwent transient fetal reprogramming to acquire proliferative potential.106,107”
From Distinct hepatocyte identities in liver homeostasis and regeneration (2023) · cites this paper as [106]
Experimental — accuracy not yet measuredThe source backs part of the claim, not all of it — or backs it for a different population, condition or comparison.
In the citing paper
“Transient changes in hepatocyte identity are required when hepatocytes re-enter the cell cycle in response to injury, while others increase metabolic function to maintain hepatic metabolism.25,104,106,107,134”
From Distinct hepatocyte identities in liver homeostasis and regeneration (2023) · cites this paper as [106]
Experimental — accuracy not yet measuredThe source backs part of the claim, not all of it — or backs it for a different population, condition or comparison.
In the citing paper
“Importantly, single-cell transcriptomic analysis identified distinct clusters among 18,272 hepatocytes corresponding to quiescent (5328 hepatocytes), transition (5137 hepatocytes), proliferating (6769 hepatocytes), and hypermetabolic (1038 hepatocytes) states after PHx.6”
From Constitutive Androstane Receptor Regulates Bile Acid Homeostasis and Metabolism During Liver Regeneration (2026) · cites this paper as [6]
Experimental — accuracy not yet measured
The source backs part of the claim, not all of it — or backs it for a different population, condition or comparison.
In the citing paper
“Taken together, our data indicate that CAR coordinates metabolic adaptation, particularly by constraining BA homeostasis, and is an important factor for the hypermetabolic hepatocytes, which support regeneration by meeting increased metabolic demands.6”
From Constitutive Androstane Receptor Regulates Bile Acid Homeostasis and Metabolism During Liver Regeneration (2026) · cites this paper as [6]
Experimental — accuracy not yet measuredThe cited source says what the claim attributes to it.
In the citing paper
“Following partial hepatectomy, a subset of hepatocytes transiently acquired an early-postnatal-like gene expression programme to proliferate, while other hepatocytes became metabolically hyperactive to compensate for any temporary deficits in liver function.106”
From Distinct hepatocyte identities in liver homeostasis and regeneration (2023) · cites this paper as [106]
The cited source says what the claim attributes to it.
In the citing paper
“A recent single-cell study characterized the functional heterogeneity within hepatocytes after PHx and identified a subset of hypermetabolic hepatocytes that compensate for the transient loss of metabolic function during regeneration.6”
From Constitutive Androstane Receptor Regulates Bile Acid Homeostasis and Metabolism During Liver Regeneration (2026) · cites this paper as [6]
Self-check
Percentages, sums and reported differences re-computed from the paper’s own numbers.
The self-check needs the paper’s full text.
Citations
Cites
Integrating single-cell transcriptomic data across different conditions, technologies, and species
Butler, A., Hoffman, P., Smibert, P., Papalexi, E., & Satija, R. (2018) · Nature Biotechnology · doi:10.1038/nbt.4096 · Cited by 13,174
Fast, sensitive and accurate integration of single-cell data with Harmony
Korsunsky, I., Millard, N., Fan, J., Slowikowski, K., Zhang, F., Wei, K., Baglaenko, Y., Brenner, M., Loh, P.-R., & Raychaudhuri, S. (2019) · Nature Methods · doi:10.1038/s41592-019-0619-0 · Cited by 10,488
DAVID: Database for Annotation, Visualization, and Integrated Discovery
Dennis, G., Sherman, B. T., Hosack, D. A., Yang, J., Gao, W., Lane, H. C., & Lempicki, R. A. (2003) · Genome Biology · doi:10.1186/gb-2003-4-5-p3 · Cited by 9,327
Massively parallel digital transcriptional profiling of single cells
Zheng, G. X. Y., Terry, J. M., Belgrader, P., Ryvkin, P., Bent, Z. W., Wilson, R., Ziraldo, S. B., Wheeler, T. D., McDermott, G. P., Zhu, J., et al. (2017) · Nature Communications · doi:10.1038/ncomms14049 · Cited by 7,353
Trapnell, C., Cacchiarelli, D., Grimsby, J., Pokharel, P., Li, S., Morse, M., Lennon, N. J., Livak, K. J., Mikkelsen, T. S., & Rinn, J. L. (2014) · Nature Biotechnology · doi:10.1038/nbt.2859 · Cited by 7,314
Scenic: single-cell regulatory network inference and clustering.
Aibar, S., González-Blas, C. B., Moerman, T., Huynh-Thu, V. A., Imrichova, H., Hulselmans, G., Rambow, F., Marine, J.-C., Geurts, P., Aerts, J., et al. (2017) · Nature Methods · doi:10.1038/nmeth.4463 · Cited by 6,520
Reversed graph embedding resolves complex single-cell trajectories
Qiu, X., Mao, Q., Tang, Y., Wang, L., Chawla, R., Pliner, H. A., & Trapnell, C. (2017) · Nature Methods · doi:10.1038/nmeth.4402 · Cited by 5,070
Burden of liver diseases in the world
Asrani, S. K., Devarbhavi, H., Eaton, J., & Kamath, P. S. (2019) · Journal of Hepatology · doi:10.1016/j.jhep.2018.09.014 · Cited by 3,783
Organoid Models and Applications in Biomedical Research
Xinaris, C., Brizi, V., & Remuzzi, G. (2015) · The Nephron journals/Nephron journals · doi:10.1159/000433566 · Cited by 3,519
Slingshot: cell lineage and pseudotime inference for single-cell transcriptomics
Street, K., Risso, D., Fletcher, R. B., Das, D., Ngai, J., Yosef, N., Purdom, E., & Dudoit, S. (2018) · BMC Genomics · doi:10.1186/s12864-018-4772-0 · Cited by 3,159
Michalopoulos, G. K., & DeFrances, M. C. (1997) · Science · doi:10.1126/science.276.5309.60 · Cited by 2,828
Batch effects in single-cell RNA-sequencing data are corrected by matching mutual nearest neighbors
Haghverdi, L., Lun, A. T. L., Morgan, M. D., & Marioni, J. C. (2018) · Nature Biotechnology · doi:10.1038/nbt.4091 · Cited by 2,416
Single-cell reconstruction of the early maternal–fetal interface in humans
Vento-Tormo, R., Efremova, M., Botting, R. A., Turco, M. Y., Vento-Tormo, M., Meyer, K. B., Park, J.-E., Stephenson, E., Polański, K., Goncalves, A., et al. (2018) · Nature · doi:10.1038/s41586-018-0698-6 · Cited by 2,358
Single-cell mRNA quantification and differential analysis with Census
Qiu, X., Hill, A. J., Packer, J. S., Lin, D., Ma, Y.-A., & Trapnell, C. (2017) · Nature Methods · doi:10.1038/nmeth.4150 · Cited by 1,904
Recovering Gene Interactions from Single-Cell Data Using Data Diffusion
van Dijk, D., Sharma, R., Nainys, J., Yim, K., Kathail, P., Carr, A. J., Burdziak, C., Moon, K. R., Chaffer, C. L., Pattabiraman, D., et al. (2018) · Cell · doi:10.1016/j.cell.2018.05.061 · Cited by 1,829
Resolving the fibrotic niche of human liver cirrhosis at single-cell level
Ramachandran, P., Dobie, R., Wilson-Kanamori, J. R., Dora, E. F., Henderson, B. E. P., Luu, N. T., Portman, J. R., Matchett, K. P., Brice, M., Marwick, J. A., et al. (2019) · Nature · doi:10.1038/s41586-019-1631-3 · Cited by 1,784
A comparison of single-cell trajectory inference methods
Saelens, W., Cannoodt, R., Todorov, H., & Saeys, Y. (2019) · Nature Biotechnology · doi:10.1038/s41587-019-0071-9 · Cited by 1,670
Liver regeneration: from myth to mechanism
Taub, R. (2004) · Nature Reviews Molecular Cell Biology · doi:10.1038/nrm1489 · Cited by 1,567
In vitro expansion of single Lgr5+ liver stem cells induced by Wnt-driven regeneration
Huch, M., Dorrell, C., Boj, S. F., van Es, J. H., Li, V. S. W., van de Wetering, M., Sato, T., Hamer, K., Sasaki, N., Finegold, M. J., et al. (2013) · Nature · doi:10.1038/nature11826 · Cited by 1,555
Single cell RNA sequencing of human liver reveals distinct intrahepatic macrophage populations
MacParland, S. A., Liu, J. C., Ma, X.-Z., Innes, B. T., Bartczak, A. M., Gage, B. K., Manuel, J., Khuu, N., Echeverri, J., Linares, I., et al. (2018) · Nature Communications · doi:10.1038/s41467-018-06318-7 · Cited by 1,552
Diffusion pseudotime robustly reconstructs lineage branching
Haghverdi, L., Büttner, M., Wolf, F. A., Buettner, F., & Theis, F. J. (2016) · Nature Methods · doi:10.1038/nmeth.3971 · Cited by 1,385
Michalopoulos, G. K. (2007) · Journal of Cellular Physiology · doi:10.1002/jcp.21172 · Cited by 1,384
Fausto, N., Campbell, J. S., & Riehle, K. J. (2006) · Hepatology · doi:10.1002/hep.20969 · Cited by 1,378
Bayesian approach to single-cell differential expression analysis
Kharchenko, P. V., Silberstein, L., & Scadden, D. T. (2014) · Nature Methods · doi:10.1038/nmeth.2967 · Cited by 1,348
Seitz, H. K., Bataller, R., Cortez-Pinto, H., Gao, B., Gual, A., Lackner, C., Mathurin, P., Mueller, S., Szabo, G., & Tsukamoto, H. (2018) · Nature Reviews Disease Primers · doi:10.1038/s41572-018-0014-7 · Cited by 1,271
A human liver cell atlas reveals heterogeneity and epithelial progenitors
Aizarani, N., Saviano, A., Sagar, Mailly, L., Durand, S., Herman, J. S., Pessaux, P., Baumert, T. F., & Grün, D. (2019) · Nature · doi:10.1038/s41586-019-1373-2 · Cited by 1,147
CORRELATED MORPHOMETRIC AND BIOCHEMICAL STUDIES ON THE LIVER CELL
Weibel, E. R., Stäubli, W., Gnägi, H. R., & Hess, F. A. (1969) · The Journal of Cell Biology · doi:10.1083/jcb.42.1.68 · Cited by 1,142
A benchmark of batch-effect correction methods for single-cell RNA sequencing data
Tran, H. T. N., Ang, K. S., Chevrier, M., Zhang, X., Lee, N. Y. S., Goh, M., & Chen, J. (2020) · Genome Biology · doi:10.1186/s13059-019-1850-9 · Cited by 1,113
Hayhurst, G. P., Lee, Y.-H., Lambert, G., Ward, J. M., & Gonzalez, F. J. (2001) · Molecular and Cellular Biology · doi:10.1128/mcb.21.4.1393-1403.2001 · Cited by 1,107
Visualizing structure and transitions in high-dimensional biological data
Moon, K. R., van Dijk, D., Wang, Z., Gigante, S., Burkhardt, D. B., Chen, W. S., Yim, K., Elzen, A. V. D., Hirn, M. J., Coifman, R. R., et al. (2019) · Nature Biotechnology · doi:10.1038/s41587-019-0336-3 · Cited by 1,065
Single-cell spatial reconstruction reveals global division of labour in the mammalian liver
Halpern, K. B., Shenhav, R., Matcovitch-Natan, O., Tóth, B., Lemze, D., Golan, M., Massasa, E. E., Baydatch, S., Landen, S., Moor, A. E., et al. (2017) · Nature · doi:10.1038/nature21065 · Cited by 1,059
Alcoholic liver disease: mechanisms of injury and targeted treatment
Louvet, A., & Mathurin, P. (2015) · Nature Reviews Gastroenterology & Hepatology · doi:10.1038/nrgastro.2015.35 · Cited by 867
Inductive angiocrine signals from sinusoidal endothelium are required for liver regeneration
Ding, B., Nolan, D. J., Butler, J. M., James, D., Babazadeh, A. O., Rosenwaks, Z., Mittal, V., Kobayashi, H., Shido, K., Lyden, D. C., et al. (2010) · Nature · doi:10.1038/nature09493 · Cited by 853
Xiong, X., Kuang, H., Ansari, S., Liu, T., Gong, J., Wang, S., Zhao, X.-Y., Ji, Y., Li, C., Guo, L., et al. (2019) · Molecular Cell · doi:10.1016/j.molcel.2019.07.028 · Cited by 784
Classification of low quality cells from single-cell RNA-seq data
Ilicic, T., Kim, J. K., Kolodziejczyk, A. A., Bagger, F. O., McCarthy, D. J., Marioni, J. C., & Teichmann, S. A. (2016) · Genome Biology · doi:10.1186/s13059-016-0888-1 · Cited by 693
Angiogenesis-Independent Endothelial Protection of Liver: Role of VEGFR-1
LeCouter, J. E., Moritz, D. R., Li, B., Phillips, G. D. L., Liang, X. H., Gerber, H., Hillan, K. J., & Ferrara, N. (2003) · Science · doi:10.1126/science.1079562 · Cited by 677
Self-renewing diploid Axin2+ cells fuel homeostatic renewal of the liver
Wang, B., Zhao, L., Fish, M., Logan, C. Y., & Nusse, R. (2015) · Nature · doi:10.1038/nature14863 · Cited by 674
Parviz, F., Matullo, C., Garrison, W. D., Savatski, L., Adamson, J. W., Ning, G., Kaestner, K. H., Rossi, J. M., Zaret, K. S., & Duncan, S. A. (2003) · Nature Genetics · doi:10.1038/ng1175 · Cited by 588
A reproducible and well-tolerated method for 2/3 partial hepatectomy in mice
Mitchell, C., & Willenbring, H. (2008) · Nature Protocols · doi:10.1038/nprot.2008.80 · Cited by 577
Farbehi, N., Patrick, R., Dorison, A., Xaymardan, M., Janbandhu, V. C., Wystub-Lis, K., Ho, J. W. K., Nordon, R. E., & Harvey, R. P. (2019) · eLife · doi:10.7554/elife.43882 · Cited by 570
Stem/progenitor cells in liver development, homeostasis, regeneration, and reprogramming
Miyajima, A., Tanaka, M., & Itoh, T. (2014) · Cell Stem Cell · doi:10.1016/j.stem.2014.04.010 · Cited by 570
Wishbone identifies bifurcating developmental trajectories from single-cell data
Setty, M., Tadmor, M. D., Reich-Zeliger, S., Angel, O., Salame, T. M., Kathail, P., Choi, K., Bendall, S., Friedman, N., & Pe'er, D. (2016) · Nature Biotechnology · doi:10.1038/nbt.3569 · Cited by 558
Marcellin, P., & Kutala, B. K. (2018) · Liver International · doi:10.1111/liv.13682 · Cited by 540
Mead, J. E., & Fausto, N. (1989) · Proceedings of the National Academy of Sciences · doi:10.1073/pnas.86.5.1558 · Cited by 535
Cholangiocytes act as facultative liver stem cells during impaired hepatocyte regeneration
Raven, A., Lu, W.-Y., Man, T. Y., Ferreira-Gonzalez, S., O’Duibhir, E., Dwyer, B. J., Thomson, J. P., Meehan, R. R., Bogorad, R., Koteliansky, V., et al. (2017) · Nature · doi:10.1038/nature23015 · Cited by 533
Hybrid Periportal Hepatocytes Regenerate the Injured Liver without Giving Rise to Cancer
Font-Burgada, J., Shalapour, S., Ramaswamy, S., Hsueh, B., Rossell, D., Umemura, A., Taniguchi, K., Nakagawa, H., Valasek, M. A., Ye, L., et al. (2015) · Cell · doi:10.1016/j.cell.2015.07.026 · Cited by 486
Richardson, M. M., Jonsson, J. R., Powell, E. E., Brunt, E. M., Neuschwander–Tetri, B. A., Bhathal, P. S., Dixon, J. B., Weltman, M. D., Tilg, H., Moschen, A. R., et al. (2007) · Gastroenterology · doi:10.1053/j.gastro.2007.05.012 · Cited by 482
Braun, L., Mead, J. E., Panzica, M. A., Mikumo, R., Bell, G. I., & Fausto, N. (1988) · Proceedings of the National Academy of Sciences · doi:10.1073/pnas.85.5.1539 · Cited by 479
Hepatic progenitor cells of biliary origin with liver repopulation capacity
Lu, W.-Y., Bird, T. G., Boulter, L., Tsuchiya, A., Cole, A. M., Hay, T., Guest, R. V., Wojtacha, D., Man, T. Y., Mackinnon, A., et al. (2015) · Nature Cell Biology · doi:10.1038/ncb3203 · Cited by 479
Wnt/β-Catenin Signaling in Liver Development, Homeostasis, and Pathobiology
Russell, J. O., & Monga, S. P. (2018) · Annual Review of Pathology: Mechanisms of Disease · doi:10.1146/annurev-pathol-020117-044010 · Cited by 471
Hypertrophy and Unconventional Cell Division of Hepatocytes Underlie Liver Regeneration
Miyaoka, Y., Ebato, K., Kato, H., Arakawa, S., Shimizu, S., & Miyajima, A. (2012) · Current Biology · doi:10.1016/j.cub.2012.05.016 · Cited by 461
An HNF4α-miRNA Inflammatory Feedback Circuit Regulates Hepatocellular Oncogenesis
Hatziapostolou, M., Polytarchou, C., Aggelidou, E., Drakaki, A., Poultsides, G. A., Jaeger, S. A., Ogata, H., Karin, M., Struhl, K., Hadzopoulou‐Cladaras, M., et al. (2011) · Cell · doi:10.1016/j.cell.2011.10.043 · Cited by 454
Metabolic flux and the regulation of mammalian cell growth
Locasale, J. W., & Cantley, L. C. (2011) · Cell Metabolism · doi:10.1016/j.cmet.2011.07.014 · Cited by 449
NFkappaB prevents apoptosis and liver dysfunction during liver regeneration.
Iimuro, Y., Nishiura, T., Hellerbrand, C., Behrns, K. E., Schoonhoven, R., Grisham, J. W., & Brenner, D. A. (1998) · Journal of Clinical Investigation · doi:10.1172/jci483 · Cited by 447
Hepatostat: Liver regeneration and normal liver tissue maintenance
Michalopoulos, G. K. (2017) · Hepatology · doi:10.1002/hep.28988 · Cited by 444
The proinflammatory mediators C3a and C5a are essential for liver regeneration
Strey, C. W., Markiewski, M., Mastellos, D., Tudoran, R., Spruce, L. A., Greenbaum, L. E., & Lambris, J. D. (2003) · The Journal of Experimental Medicine · doi:10.1084/jem.20030374 · Cited by 436
Adult Hepatocytes Are Generated by Self-Duplication Rather than Stem Cell Differentiation
Yanger, K., Knigin, D., Zong, Y., Maggs, L., Gu, G., Akiyama, H., Pikarsky, E., & Stanger, B. Z. (2014) · Cell Stem Cell · doi:10.1016/j.stem.2014.06.003 · Cited by 426
Single-cell transcriptomics uncovers zonation of function in the mesenchyme during liver fibrosis
Dobie, R., Wilson-Kanamori, J. R., Henderson, B. E. P., Smith, J. R., Matchett, K. P., Portman, J. R., Wallenborg, K., Picelli, S., Zagorska, A., Pendem, S. V., et al. (2019) · Cell Reports · doi:10.1016/j.celrep.2019.10.024 · Cited by 420
Bissell, D. M., Wang, S. S., Jarnagin, W. R., & Roll, F. J. (1995) · Journal of Clinical Investigation · doi:10.1172/jci118055 · Cited by 419
Liver regeneration — mechanisms and models to clinical application
Forbes, S. J., & Newsome, P. N. (2016) · Nature Reviews Gastroenterology & Hepatology · doi:10.1038/nrgastro.2016.97 · Cited by 415
Met receptor tyrosine kinase: enhanced signaling through adapter proteins
Furge, K. A., Zhang, Y.-W., & Woude, G. F. V. (2000) · Oncogene · doi:10.1038/sj.onc.1203859 · Cited by 412
Paired-cell sequencing enables spatial gene expression mapping of liver endothelial cells
Halpern, K. B., Shenhav, R., Massalha, H., Toth, B., Egozi, A., Massasa, E. E., Medgalia, C., David, E., Giladi, A., Moor, A. E., et al. (2018) · Nature Biotechnology · doi:10.1038/nbt.4231 · Cited by 368
Isolation and Culture of Adult Mouse Hepatocytes
Li, W., Ralphs, K. L., & Tosh, D. (2010) · Methods in molecular biology · doi:10.1007/978-1-59745-019-5_13 · Cited by 303
DNA Binding Specificity of the CCAAT/Enhancer-binding Protein Transcription Factor Family
Osada, S., Yamamoto, H., Nishihara, T., & Imagawa, M. (1996) · Journal of Biological Chemistry · doi:10.1074/jbc.271.7.3891 · Cited by 295
Joint analysis of heterogeneous single-cell RNA-seq dataset collections
Barkas, N., Petukhov, V., Nikolaeva, D., Lozinsky, Y., Demharter, S., Khodosevich, K., & Kharchenko, P. V. (2019) · Nature Methods · doi:10.1038/s41592-019-0466-z · Cited by 292
Kyrmizi, I., Hatzis, P., Katrakili, N., Tronche, F., Gonzalez, F. J., & Talianidis, I. (2006) · Genes & Development · doi:10.1101/gad.390906 · Cited by 285
Schrem, H., Klempnauer, J., & Borlak, J. (2002) · Pharmacological Reviews · doi:10.1124/pr.54.1.129 · Cited by 283
Impaired liver regeneration in Nrf2 knockout mice: role of ROS‐mediated insulin/IGF‐1 resistance
Beyer, T. A., Xu, W., Teupser, D., Keller, U. A. D., Bugnon, P., Hildt, E., Thiery, J., Kan, Y. W., & Werner, S. (2007) · The EMBO Journal · doi:10.1038/sj.emboj.7601950 · Cited by 270
Greenbaum, L. E., Li, W., Cressman, D. E., Peng, Y., Ciliberto, G., Poli, V, & Taub, R. (1998) · Journal of Clinical Investigation · doi:10.1172/jci3135 · Cited by 270
Pepe-Mooney, B. J., Dill, M. T., Alemany, A., Ordovas-Montanes, J., Matsushita, Y., Rao, A., Sen, A., Miyazaki, M., Anakk, S., Dawson, P. A., et al. (2019) · Cell Stem Cell · doi:10.1016/j.stem.2019.04.004 · Cited by 266
Schaub, J. R., Malato, Y., Gormond, C., & Willenbring, H. (2014) · Cell Reports · doi:10.1016/j.celrep.2014.07.003 · Cited by 254 · cited 1×
“Several cell-fate and lineage-tracing studies have determined that—under normal circumstances—the majority of new hepatocytes are derived from pre-existing hepatocytes instead of hepatic stem cells (Font-Burgada et al., 2015; Schaub et al., 2014; Yanger et al., 2014).”
BackgroundBeta-catenin signaling in murine liver zonation and regeneration: A Wnt-Wnt situation!
Yang, J., Mowry, L. E., Nejak‐Bowen, K. N., Okabe, H., Diegel, C. R., Lang, R. A., Williams, B. O., & Monga, S. P. (2014) · Hepatology · doi:10.1002/hep.27082 · Cited by 244
Distributed hepatocytes expressing telomerase repopulate the liver in homeostasis and injury
Lin, S., Nascimento, E. M., Gajera, C. R., Chen, L., Neuhöfer, P., Garbuzov, A., Wang, S., & Artandi, S. E. (2018) · Nature · doi:10.1038/s41586-018-0004-7 · Cited by 241
The Role of Complement in Liver Injury, Regeneration, and Transplantation
Thorgersen, E. B., Barratt‐Due, A., Haugaa, H., Harboe, M., Pischke, S. E., Nilsson, P. H., & Mollnes, T. E. (2019) · Hepatology · doi:10.1002/hep.30508 · Cited by 240
Broad Distribution of Hepatocyte Proliferation in Liver Homeostasis and Regeneration
Chen, F., Jimenez, R. J., Sharma, K., Luu, H. Y., Hsu, B. Y., Ravindranathan, A., Stohr, B. A., & Willenbring, H. (2020) · Cell Stem Cell · doi:10.1016/j.stem.2019.11.001 · Cited by 236
The balancing act of the liver: tissue regeneration versus fibrosis
Cordero-Espinoza, L., & Huch, M. (2018) · Journal of Clinical Investigation · doi:10.1172/jci93562 · Cited by 233
c-Jun/AP-1 controls liver regeneration by repressing p53/p21 and p38 MAPK activity
Stepniak, E., Ricci, R., Eferl, R., Sumara, G., Sumara, I., Rath, M., Hui, L., & Wagner, E. F. (2006) · Genes & Development · doi:10.1101/gad.390506 · Cited by 232
Single-cell connectomic analysis of adult mammalian lungs
Raredon, M. S. B., Adams, T. S., Suhail, Y., Schupp, J. C., Poli, S., Neumark, N., Leiby, K. L., Greaney, A. M., Yuan, Y., Horien, C. L., et al. (2019) · Science Advances · doi:10.1126/sciadv.aaw3851 · Cited by 221
Schirmacher, P., Geerts, A. E., Pietrangelo, A., Dienes, H. P., & Rogler, C. E. (1992) · Hepatology · doi:10.1002/hep.1840150103 · Cited by 212
Gene expression during the priming phase of liver regeneration after partial hepatectomy in mice
Su, A. I., Guidotti, L. G., Pezacki, J. P., Chisari, F. V., & Schultz, P. G. (2002) · Proceedings of the National Academy of Sciences · doi:10.1073/pnas.122359899 · Cited by 212
Regulation of Hepatocyte Nuclear Factor 4α-mediated Transcription
Gonzalez, F. J. (2008) · Drug Metabolism and Pharmacokinetics · doi:10.2133/dmpk.23.2 · Cited by 199
Matsumoto, T., Wakefield, L., Tarlow, B. D., & Grompe, M. (2020) · Cell Stem Cell · doi:10.1016/j.stem.2019.11.014 · Cited by 194
Suppression of Hepatocyte Proliferation by Hepatocyte Nuclear Factor 4α in Adult Mice
Bonzo, J. A., Ferry, C. H., Matsubara, T., Kim, J.-H., & Gonzalez, F. J. (2012) · Journal of Biological Chemistry · doi:10.1074/jbc.m111.334599 · Cited by 193
Temporal and tissue-specific expression of mouse ets genes.
Bhat, N. K., Fisher, R. J., Fujiwara, S., Ascione, R., & Papas, T. S. (1987) · Proceedings of the National Academy of Sciences · doi:10.1073/pnas.84.10.3161 · Cited by 181
Chaisson, M. L., Brooling, J. T., Ladiges, W., Tsai, S. Y., & Fausto, N. (2002) · Journal of Clinical Investigation · doi:10.1172/jci15295 · Cited by 181
Maher, J. J. (1993) · Journal of Clinical Investigation · doi:10.1172/jci116451 · Cited by 174
AXIN2+ Pericentral Hepatocytes Have Limited Contributions to Liver Homeostasis and Regeneration
Sun, T., Pikiolek, M., Orsini, V., Bergling, S., Holwerda, S., Morelli, L., Hoppe, P. S., Planas-Paz, L., Yang, Y., Ruffner, H., et al. (2020) · Cell Stem Cell · doi:10.1016/j.stem.2019.10.011 · Cited by 166
Epigenetic remodelling licences adult cholangiocytes for organoid formation and liver regeneration
Aloia, L., McKie, M. A., Vernaz, G., Cordero-Espinoza, L., Aleksieva, N., van den Ameele, J., Antonica, F., Font-Cunill, B., Raven, A., Aiese Cigliano, R., et al. (2019) · Nature Cell Biology · doi:10.1038/s41556-019-0402-6 · Cited by 160
Elucidating the Metabolic Regulation of Liver Regeneration
Huang, J., & Rudnick, D. A. (2013) · American Journal Of Pathology · doi:10.1016/j.ajpath.2013.04.034 · Cited by 156
Smith, J. R., Hayman, G. T., Wang, S., Laulederkind, S. J. F., Hoffman, M. J., Kaldunski, M. L., Tutaj, M., Thota, J., Nalabolu, H. S., Ellanki, S. L. R., et al. (2019) · Nucleic Acids Research · doi:10.1093/nar/gkz1041 · Cited by 155
Activation of Jun kinase is an early event in hepatic regeneration.
Westwick, J. K., Weitzel, C., Leffert, H. L., & Brenner, D. A. (1995) · Journal of Clinical Investigation · doi:10.1172/jci117730 · Cited by 148
Webber, E. M., Fitzgerald, M. J., Brown, P. I., Bartlett, M. H., & Fausto, N. (1993) · Hepatology · doi:10.1002/hep.1840180622 · Cited by 143
Nakatsukasa, H., Evarts, R. P., Hsia, C. C., & Thorgeirsson, S. S. (1990) · PubMed · Cited by 143
Schiebinger, G., Shu, J., Tabaka, M., Cleary, B., Subramanian, V., Solomon, A., Gould, J., Liu, S., Lin, S., Berube, P., et al. (2019) · Cell · doi:10.1016/j.cell.2019.02.026 · Cited by 139
Regulation of bile acid biosynthesis by hepatocyte nuclear factor 4α
Inoue, Y., Yu, A., Yim, S. H., Ma, X., Krausz, K. W., Inoue, J., Xiang, C. C., Brownstein, M., Eggertsen, G., Björkhem, I., et al. (2005) · Journal of Lipid Research · doi:10.1194/jlr.m500430-jlr200 · Cited by 137
Hilaire, R. J. S., Hradek, G. T., & Jones, A. L. (1983) · Proceedings of the National Academy of Sciences · doi:10.1073/pnas.80.12.3797 · Cited by 136
Mfsd2a+ hepatocytes repopulate the liver during injury and regeneration
Pu, W., Zhang, H., Huang, X., Tian, X., He, L., Wang, Y., Zhang, L., Liu, Q., Li, Y., Li, Y., et al. (2016) · Nature Communications · doi:10.1038/ncomms13369 · Cited by 136
Preziosi, M., Okabe, H., Poddar, M., Singh, S., & Monga, S. P. (2018) · Hepatology Communications · doi:10.1002/hep4.1196 · Cited by 135
Metabolic Remodeling during Liver Regeneration
Caldez, M. J., Van Hul, N., Koh, H. W. L., Teo, X. Q., Fan, J. J., Tan, P. Y., Dewhurst, M. R., Too, P. G., Talib, S. Z. A., Chiang, B. E., et al. (2018) · Developmental Cell · doi:10.1016/j.devcel.2018.09.020 · Cited by 133
Walesky, C. M., Edwards, G., Borude, P. C., Gunewardena, S., O’Neil, M. F., Yoo, B., & Apte, U. M. (2013) · Hepatology · doi:10.1002/hep.26251 · Cited by 130
Wu, H., Xiao, Y., Zhang, S., Ji, S., Wei, L., Fan, F., Geng, J., Tian, J., Sun, X., Qin, F., et al. (2013) · Cell Reports · doi:10.1016/j.celrep.2013.04.020 · Cited by 128
Coordinated induction of VEGF receptors in mesenchymal cell types during rat hepatic wound healing
Ankoma‐Sey, V., Matli, M. R., Chang, K.-C., Lalazar, A., Donner, D. B., Wong, L., Warren, R. S., & Friedman, S. L. (1998) · Oncogene · doi:10.1038/sj.onc.1201912 · Cited by 125
Resetting the transcription factor network reverses terminal chronic hepatic failure
Nishikawa, T., Bell, A., Brooks, J. M., Setoyama, K., Melis, M., Han, B., Fukumitsu, K., Handa, K., Tian, J., Kaestner, K. H., et al. (2015) · Journal of Clinical Investigation · doi:10.1172/jci73137 · Cited by 124
Hepatocyte Nuclear Factor 4α Is a Central Regulator of Bile Acid Conjugation
Inoue, Y., Yu, A., Inoue, J., & Gonzalez, F. J. (2004) · Journal of Biological Chemistry · doi:10.1074/jbc.m311015200 · Cited by 112
Zhao, L., Jin, Y., Donahue, K., Tsui, M., Fish, M., Logan, C. Y., Wang, B., & Nusse, R. (2019) · Hepatology · doi:10.1002/hep.30563 · Cited by 111
Liver stem cells: experimental findings and implications for human liver disease
Michalopoulos, G. K., & Khan, Z. (2015) · Gastroenterology · doi:10.1053/j.gastro.2015.08.004 · Cited by 109
Inoue, Y., Hayhurst, G. P., Inoue, J., Mori, M., & Gonzalez, F. J. (2002) · Journal of Biological Chemistry · doi:10.1074/jbc.m203126200 · Cited by 104
c-Myc regulates cell size and ploidy but is not essential for postnatal proliferation in liver
Baena, E., Gandarillas, A., Vallespinós, M., Zanet, J., Bachs, O., Redondo, C., Fabregat, I., Martinez-A., C., & de Alborán, I. M. (2005) · Proceedings of the National Academy of Sciences · doi:10.1073/pnas.0409260102 · Cited by 104
Huck, I., Gunewardena, S., Español‐Suñer, R., Willenbring, H., & Apte, U. M. (2018) · Hepatology · doi:10.1002/hep.30405 · Cited by 104
ESRP2 controls an adult splicing programme in hepatocytes to support postnatal liver maturation
Bhate, A., Parker, D. J., Bebee, T. W., Ahn, J., Arif, W., Rashan, E. H., Chorghade, S., Chau, A., Lee, J.-H., Anakk, S., et al. (2015) · Nature Communications · doi:10.1038/ncomms9768 · Cited by 103
Self-citationKiso, S., Kawata, S., Tamura, S., Higashiyama, S., Ito, N., Tsushima, H., Taniguchi, N., & Matsuzawa, Y. (1995) · Hepatology · doi:10.1002/hep.1840220535 · Cited by 103
p53 regulates a mitotic transcription program and determines ploidy in normal mouse liver
Kurinna, S. M., Stratton, S. A., Coban, Z., Schumacher, J. M., Grompe, M., Duncan, A. W., & Barton, M. C. (2013) · Hepatology · doi:10.1002/hep.26233 · Cited by 101
Zellmer, S., Schmidt‐Heck, W., Godoy, P., Weng, H., Meyer, C., Lehmann, T. J., Sparna, T., Schormann, W., Hammad, S., Kreutz, C., et al. (2010) · Hepatology · doi:10.1002/hep.23930 · Cited by 100
Greenbaum, L. E., Cressman, D. E., Haber, B. A., & Taub, R. A. (1995) · Journal of Clinical Investigation · doi:10.1172/jci118170 · Cited by 95
Jakobsen, J. S., Waage, J., Rapin, N., Bisgaard, H. C., Larsen, F. S., & Porse, B. T. (2013) · Genome Research · doi:10.1101/gr.146399.112 · Cited by 90
Kiso, S., Kawata, S., Tamura, S., Inui, Y., Yoshida, Y., Sawai, Y., Umeki, S., Ito, N., Yamada, A., Miyagawa, J., et al. (2003) · Gastroenterology · doi:10.1053/gast.2003.50097 · Cited by 87
Alternative splicing rewires Hippo signaling pathway in hepatocytes to promote liver regeneration
Bangru, S., Arif, W., Seimetz, J., Bhate, A., Chen, J., Rashan, E. H., Carstens, R. P., Anakk, S., & Kalsotra, A. (2018) · Nature Structural & Molecular Biology · doi:10.1038/s41594-018-0129-2 · Cited by 85
Self-citationAdrenergic effects on secretion of epidermal growth factor from Brunner's glands.
Olsen, P. S., Poulsen, S. S., & Kirkegaard, P. O. (1985) · Gut · doi:10.1136/gut.26.9.920 · Cited by 81
A novel approach to remove the batch effect of single-cell data
Zhang, F., Wu, Y., & Tian, W. (2019) · Cell Discovery · doi:10.1038/s41421-019-0114-x · Cited by 79
Kelley‐Loughnane, N., Sabla, G. E., Ley, C. A., Aronow, B. J., & Bezerra, J. A. (2002) · Hepatology · doi:10.1053/jhep.2002.31351 · Cited by 77
Hyun, J., Sun, Z., Ahmadi, A. R., Bangru, S., Chembazhi, U. V., Du, K., Chen, T., Tsukamoto, H., Rusyn, I., Kalsotra, A., et al. (2020) · Journal of Clinical Investigation · doi:10.1172/jci132691 · Cited by 76
Self-citationEpigenetic Compensation Promotes Liver Regeneration
Wang, S., Zhang, C., Hasson, D., Desai, A., SenBanerjee, S., Magnani, E., Ukomadu, C., Lujambio, A., Bernstein, E., & Sadler, K. C. (2019) · Developmental Cell · doi:10.1016/j.devcel.2019.05.034 · Cited by 73
Underlying potential: cellular and molecular determinants of adult liver repair
Diehl, A. M., & Chute, J. P. (2013) · Journal of Clinical Investigation · doi:10.1172/jci69966 · Cited by 72
Sladky, V. C., Knapp, K., Soratroi, C., Heppke, J., Eichin, F., Rocamora‐Reverte, L., Szabó, T. G., Bongiovanni, L., Westendorp, B., Moreno, E., et al. (2020) · Developmental Cell · doi:10.1016/j.devcel.2019.12.016 · Cited by 69
Cellular and molecular basis of liver regeneration
Bangru, S., & Kalsotra, A. (2020) · Seminars in Cell and Developmental Biology · doi:10.1016/j.semcdb.2019.12.004 · Cited by 67
Self-citationEpidermal Growth Factor: Its Biologic and Metabolic Effects With Emphasis on the Hepatocyte
Hilaire, J. R. S., & Jones, A. L. (1982) · Hepatology · doi:10.1002/hep.1840020515 · Cited by 66
Role of hepatocyte nuclear factor 4α in control of blood coagulation factor gene expression
Inoue, Y., Peters, L. L., Yim, S. H., Inoue, J., & Gonzalez, F. J. (2005) · Journal of Molecular Medicine · doi:10.1007/s00109-005-0013-5 · Cited by 65
Jin, J., Hong, I., Lewis, K., Iakova, P. A., Breaux, M., Jiang, Y., Sullivan, E. M., Jawanmardi, N., Timchenko, L., & Timchenko, N. A. (2014) · Hepatology · doi:10.1002/hep.27295 · Cited by 62
A Complement–IL-4 Regulatory Circuit Controls Liver Regeneration
DeAngelis, R. A., Markiewski, M. M., Kourtzelis, I., Rafail, S., Syriga, M., Sandor, A., Maurya, M. R., Gupta, S., Subramaniam, S., & Lambris, J. D. (2011) · The Journal of Immunology · doi:10.4049/jimmunol.1101925 · Cited by 60
Servillo, G., Fazia, M. A. D., & Sassone‐Corsi, P. (1998) · Genes & Development · doi:10.1101/gad.12.23.3639 · Cited by 60
TGFβ gene transcription in normal and neoplastic liver growth
Carr, B. I., Huang, T. H., Itakura, K., Noël, M., & Marceau, N. (1989) · Journal of Cellular Biochemistry · doi:10.1002/jcb.240390413 · Cited by 52
The Dynamic Chromatin Architecture of the Regenerating Liver
Wang, A. W., Wang, Y. J., Zahm, A. M., Morgan, A. R., Wangensteen, K. J., & Kaestner, K. H. (2019) · Cellular and Molecular Gastroenterology and Hepatology · doi:10.1016/j.jcmgh.2019.09.006 · Cited by 49
Liu, Y., Lui, E. L. H., Friedman, S. L., Li, L., Ye, T., Chen, Y., Poon, R. T. P., Wo, J. Y. H., Kok, T. W., & Fan, S. T. (2008) · Laboratory Investigation · doi:10.1038/labinvest.2008.127 · Cited by 37
A detailed methodology of partial hepatectomy in the mouse
Boyce, S., & Harrison, D. J. (2008) · Lab Animal · doi:10.1038/laban1108-529 · Cited by 36
TRAP-seq identifies cystine/glutamate antiporter as a driver of recovery from liver injury
Wang, A. W., Wangensteen, K. J., Wang, Y. J., Zahm, A. M., Moss, N., Noam Erez, A., & Kaestner, K. H. (2018) · Journal of Clinical Investigation · doi:10.1172/jci95120 · Cited by 30
Estrov, Z. E., Talpaz, M., Zipf, T. F., Kantarjian, H. M., Ku, S., Ouspenskaia, M. V., Hirsch‐Ginsberg, C., Huh, Y. O., Yee, G., & Kurzrock, R. (1996) · Journal of Cellular Physiology · doi:10.1002/(sici)1097-4652(199603)166:3 · Cited by 30
Çolak, D., Al‐Harazi, O., Mustafa, O. M., Meng, F., Assiri, A. M., Dhar, D. K., & Broering, D. C. (2020) · Scientific Reports · doi:10.1038/s41598-020-61826-1 · Cited by 30
p53 may positively regulate hepatocyte proliferation in rats
Inoue, Y., Tomiya, T., Yanase, M., Arai, M., Ikeda, H., Tejima, K., Ogata, I., Kimura, S., Omata, M., & Fujiwara, K. (2002) · Hepatology · doi:10.1053/jhep.2002.34942 · Cited by 29
Dysregulated activation of fetal liver programme in acute liver failure
Hyun, J., Oh, S., Premont, R. T., Guy, C. D., Berg, C. L., & Diehl, A. M. (2019) · Gut · doi:10.1136/gutjnl-2018-317603 · Cited by 28
Sato, Y., Katoh, Y., Matsumoto, M., Sato, M., Ebina, M., Itoh‐Nakadai, A., Funayama, R., Nakayama, K., Unno, M., & Igarashi, K. (2017) · Journal of Biological Chemistry · doi:10.1074/jbc.m116.774547 · Cited by 22
Induction of DNA polymerase activities in the regenerating rat liver
Yang, C. L., Zhang, S. J., Toomey, N., Palmer, T. N., & Lee, M. (1991) · Biochemistry · doi:10.1021/bi00244a024 · Cited by 20
Segregated hepatocyte proliferation and metabolic states within the regenerating mouse liver
Minocha, S., Villeneuve, D., Rib, L., Moret, C., Guex, N., & Herr, W. (2017) · Hepatology Communications · doi:10.1002/hep4.1102 · Cited by 16
COOK, D. J., Achanta, S., Hoek, J. B., Ogunnaike, B. A., & Vadigepalli, R. (2018) · BMC Systems Biology · doi:10.1186/s12918-018-0605-7 · Cited by 15
A High-Content Screen Identifies MicroRNAs That Regulate Liver Repopulation After Injury in Mice
Zahm, A. M., Wang, A. W., Wang, Y. J., Schug, J., Wangensteen, K. J., & Kaestner, K. H. (2019) · Gastroenterology · doi:10.1053/j.gastro.2019.11.025 · Cited by 12
Transcriptome Temporal and Functional Analysis of Liver Regeneration Termination
Rychtrmoc, D., Hubálková, L., Víšková, A., Libra, A., Bunček, M., & Červinková, Z. (2012) · Physiological Research · doi:10.33549/physiolres.932393 · Cited by 11
Chaisson, M. L., Brooling, J. T., Ladiges, W., Tsai, S. Y., & Fausto, N. (2002) · Journal of Clinical Investigation · doi:10.1172/jci200215295 · Cited by 11
Achanta, S., Verma, A., Srivastava, A., Nilakantan, H., Hoek, J. B., & Vadigepalli, R. (2018) · Gene Expression · doi:10.3727/105221618x15361728786767 · Cited by 7
Kuttippurathu, L., Patra, B., COOK, D. J., Hoek, J. B., & Vadigepalli, R. (2016) · Physiological Genomics · doi:10.1152/physiolgenomics.00097.2016 · Cited by 5
Research works printed but not linked: 1
- 10.1016/0270-9139(93)90234-E · DOI
Cited by
Sorted by citations
Angiodiversity and organotypic functions of sinusoidal endothelial cells
Reiners-Koch, P.-S., Lee, K. H., Goerdt, S., & Augustin, H. G. (2021) · Angiogenesis · doi:10.1007/s10456-021-09780-y · Cited by 101
Loss of liver function in chronic liver disease: An identity crisis
Berasain, C., Arechederra, M., Argemí, J., Fernández-Barrena, M. G., & Avila, M. A. (2023) · Journal of Hepatology · doi:10.1016/j.jhep.2022.09.001 · Cited by 99
Senescent hepatic stellate cells promote liver regeneration through IL-6 and ligands of CXCR2
Cheng, N., Kim, K.-H., & Lau, L. F. (2022) · JCI Insight · doi:10.1172/jci.insight.158207 · Cited by 87
“ing PHx, with many genes being rapidly activated (4, 5).”
Decoding aging-dependent regenerative decline across tissues at single-cell resolution
Cai, Y., Xiong, M., Xin, Z., Liu, C., Ren, J., Yang, X., Lei, J., Li, W., Liu, F., Chu, Q., et al. (2023) · Cell stem cell · doi:10.1016/j.stem.2023.09.014 · Cited by 94
A spatiotemporal atlas of mouse liver homeostasis and regeneration
Xu, J., Guo, P., Hao, S., Shangguan, S., Shi, Q., Volpe, G., Huang, K., Zuo, J., An, J., Yuan, Y., et al. (2024) · Nature Genetics · doi:10.1038/s41588-024-01709-7 · Cited by 75
Metadata
- Authors
- Chembazhi, U. V., Bangru, S., Hernaez, M., & Kalsotra, A.
- Affiliations
- University of Illinois Urbana-Champaign (US)
- Corresponding author
- Kalsotra, Auinash
- Venue
- Genome Research
- Publisher
- Cold Spring Harbor Laboratory
- Published
- 2021-03-01
- Volume
- 31
- Issue
- 4
- Pages
- 576-591
- ISSN
- 1088-9051 (ISSN-L)
- 1549-5469
- PMC
- PMC8015853
- OpenAlex
- W3133820991
- Cited by
- 102
- References
- 147
- Citations by year
- 2026: 13 · 2025: 19 · 2024: 22 · 2023: 26 · 2022: 9 · 2021: 10
- Type
- posted content
- Language
- en
- Open access
- bronze
- doi.org
- Locations
- Genome Research (publishedVersion)
- bioRxiv (Cold Spring Harbor Laboratory) (acceptedVersion, cc-by-nc-nd)
- Europe PMC (PubMed Central) (publishedVersion, cc-by-nc)
- PubMed Central (publishedVersion, cc-by-nc)
- PubMed (publishedVersion)
- Funders
- National Institutes of Health
- NIH (R01HL126845, R01AA010154, T32-EB019944)
- Muscular Dystrophy Association (MDA514335)
- Topics
- Health Sciences › Medicine › Hepatology › Liver physiology and pathology
- Life Sciences › Biochemistry, Genetics and Molecular Biology › Molecular Biology › Single-cell and spatial transcriptomics
- Health Sciences › Medicine › Surgery › Tissue Engineering and Regenerative Medicine
- Keywords
- liver regeneration, partial hepatectomy, hepatocyte proliferation, cellular plasticity, cell-to-cell communication, non-parenchymal cells, developmental gene regulatory networks, single-cell transcriptomics
- MeSH terms
- Cell Plasticity, Animals, Hepatectomy, Liver, Liver Regeneration, Hepatocytes, Cell Proliferation, Mice, Single-Cell Analysis, Transcriptome
About these checks
Registry, retraction, Cites and statistics results are computed, not judged, with one exception: a printed reference that no index lists is read once by a model before it counts as a citation error. Claims are extracted by a model and kept only when their quote appears verbatim in the text; each cited source is then checked, with a model’s help, for whether it says what the claim relies on. Those verdicts can be wrong — read the claim’s quote and the cited source before relying on one.
Statistics and arithmetic are recomputed, not judged.
Confidence bands are shown only for fields calibrated on our annotated test set. None is calibrated yet, so no band is shown.
What counts as a claim ›How we measure confidence ›How we check this ›
Are you an author, or do you see a problem with this page? Request a review
