

The DOI matches its Crossref record; 48 of the 49 references it cites were found in a registry or an index.
Trimethylamine‐N‐oxide promotes brain aging and cognitive impairment in mice
Open accessAbstract
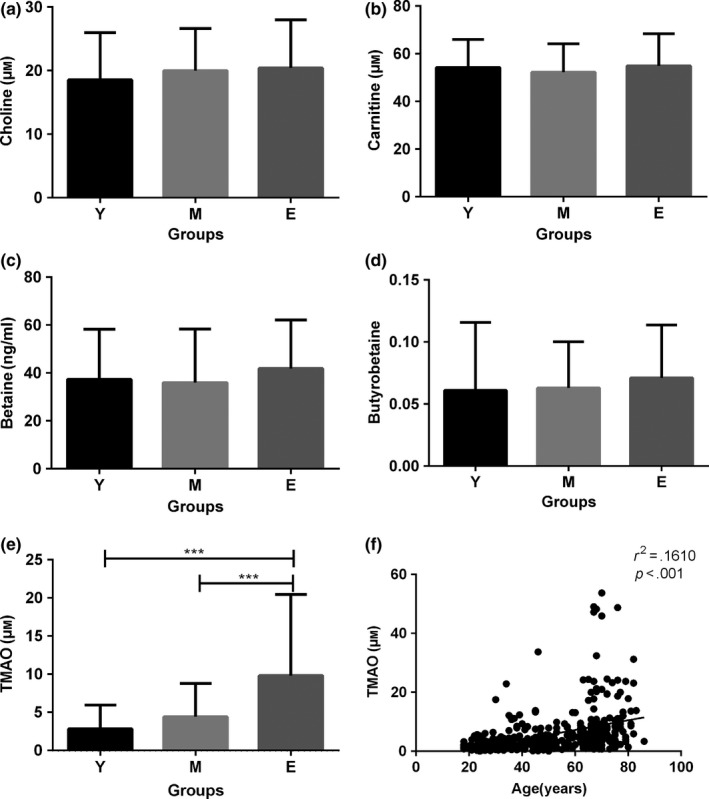
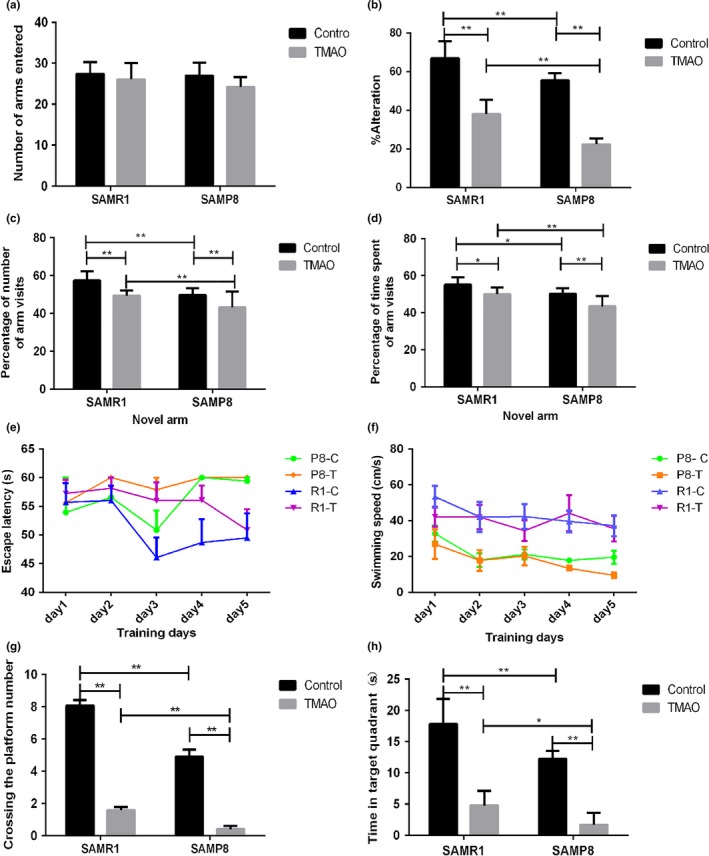
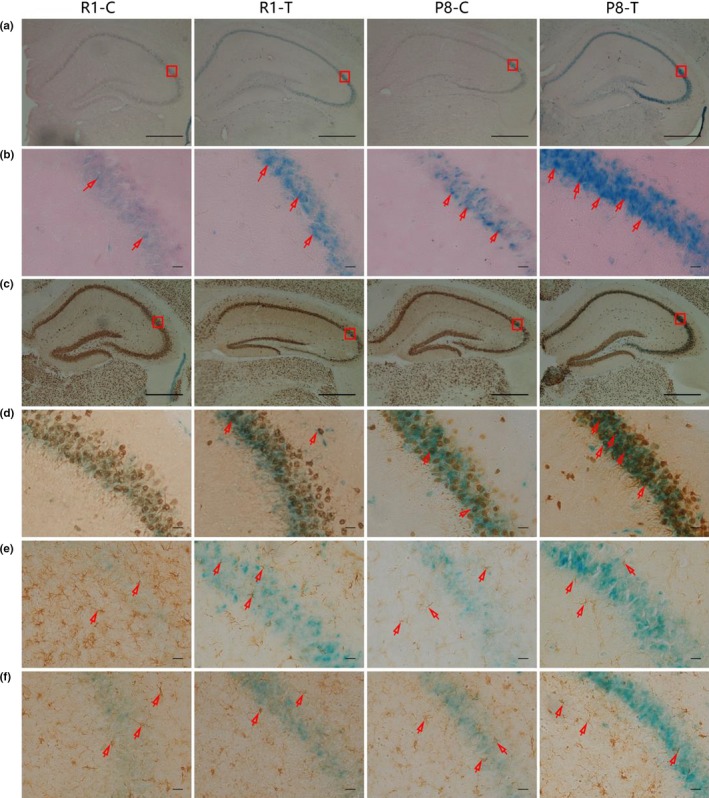
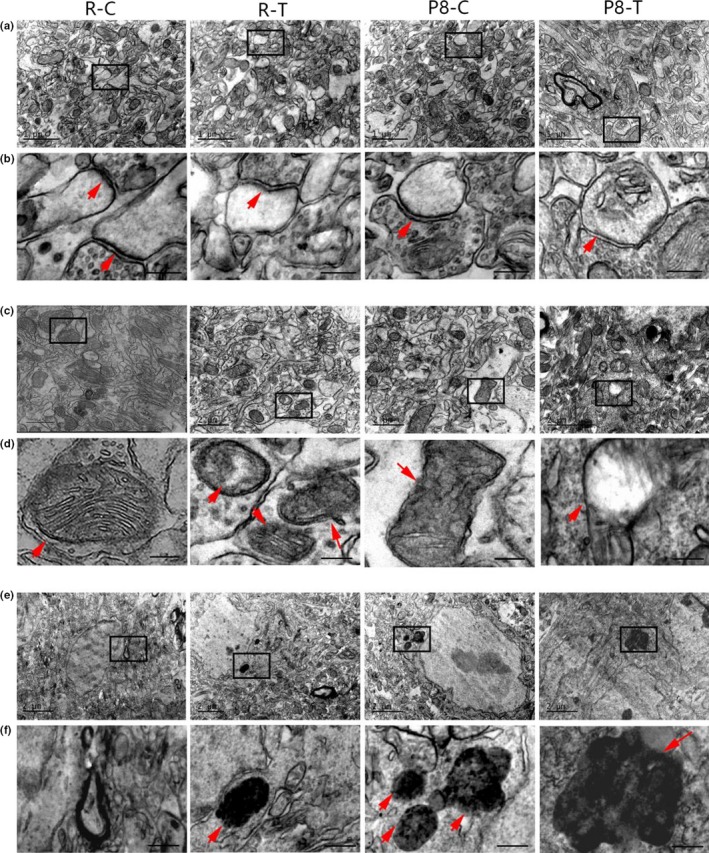
Summary: Gut microbiota can influence the aging process and may modulate aging‐related changes in cognitive function. Trimethylamine‐N‐oxide (TMAO), a metabolite of intestinal flora, has been shown to be closely associated with cardiovascular disease and other diseases. However, the relationship between TMAO and aging, especially brain aging, has not been fully elucidated. To explore the relationship between TMAO and brain aging, we analysed the plasma levels of TMAO in both humans and mice and administered exogenous TMAO to 24‐week‐old senescence‐accelerated prone mouse strain 8 (SAMP 8) and age‐matched senescence‐accelerated mouse resistant 1 (SAMR 1) mice for 16 weeks. We found that the plasma levels of TMAO increased in both the elderly and the aged mice. Compared with SAMR 1‐control mice, SAMP 8‐control mice exhibited a brain aging phenotype characterized by more senescent cells in the hippocampal CA 3 region and cognitive dysfunction. Surprisingly, TMAO treatment increased the number of senescent cells, which were primarily neurons, and enhanced the mitochondrial impairments and superoxide production. Moreover, we observed that TMAO treatment increased synaptic damage and reduced the expression levels of synaptic plasticity‐related proteins by inhibiting the mTOR signalling pathway, which induces and aggravates aging‐related cognitive dysfunction in SAMR 1 and SAMP 8 mice, respectively. Our findings suggested that TMAO could induce brain aging and age‐related cognitive dysfunction in SAMR 1 mice and aggravate the cerebral aging process of SAMP 8 mice, which might provide new insight into the effects of intestinal microbiota on the brain aging process and help to delay senescence by regulating intestinal flora metabolites.
Overview
The claims and statistics of this paper haven’t been checked yet.
Run the check — free, no account needed. It reads the open-access text and checks the sources it cites.
Integrity signals
Registry
Cites
Statistics
Figures
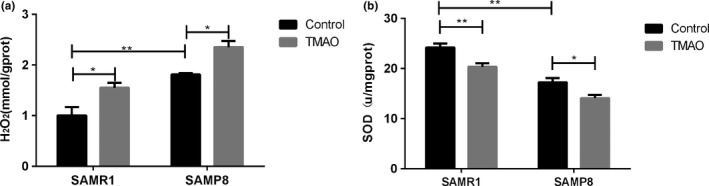
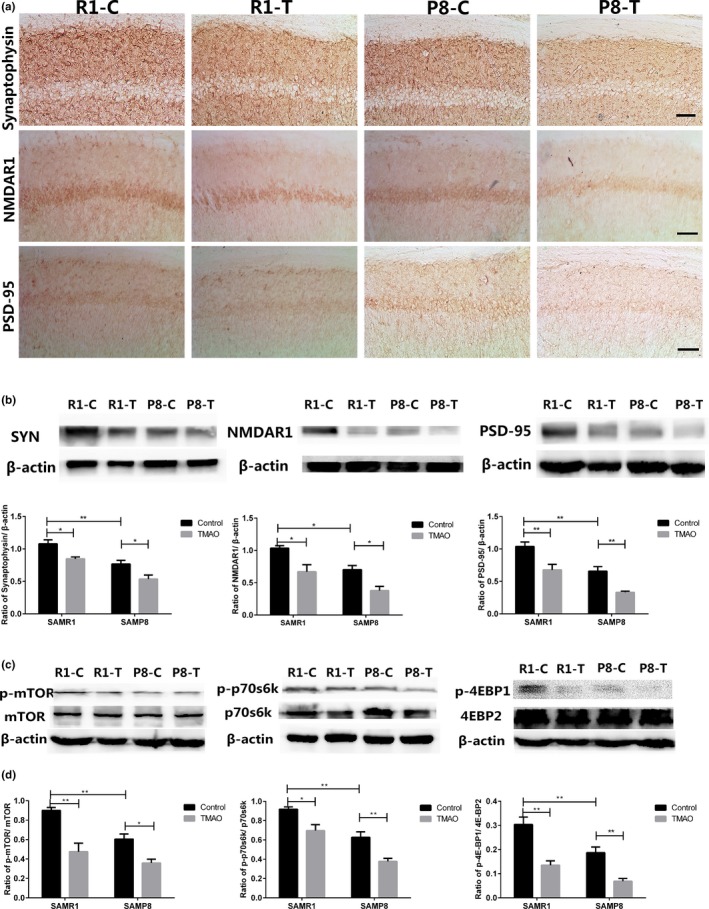
Verification
Claims the paper makes
The claims and statistics of this paper haven’t been checked yet.
Run the check — free, no account needed. It reads the open-access text and checks the sources it cites.
Claims other papers make about this one
Each is checked against this paper’s own text: does it say what the citing paper says it does?
In the citing paper
“In the brain, TMAO is detrimental to neuronal physiology as it induces neuronal senescence, oxidative stress, and alters synaptic plasticity.”
From Microbiota–gut–brain axis and its therapeutic applications in neurodegenerative diseases (2024) · cites this paper as [668]
In the citing paper
“mice treated with dietary TMAO show increased brain aging and cognitive impairment, likely due to increased oxidative stress, mitochondrial dysfunction, and inhibition of mammalian target of rapamycin (mTOR) signaling in the brain [11].”
From The gut microbiota-derived metabolite trimethylamine N-oxide is elevated in Alzheimer’s disease (2018) · cites this paper as [11]
In the citing paper
“TMAO is an amine oxide product of the bacterial metabolism that has been implicated in oxidative stress enhancement, BBB disruption, mitochondria dysfunction, brain aging and neurodegeneration [105,106,107]”
From The Interplay between Gut Microbiota and Parkinson’s Disease: Implications on Diagnosis and Treatment (2022) · cites this paper as [107]
Self-check
Percentages, sums and reported differences re-computed from the paper’s own numbers.
The self-check needs the paper’s full text.
Citations
Cites
TOR signaling in growth and metabolism
Wullschleger, S., Loewith, R., & Hall, M. N. (2006) · Cell · doi:10.1016/j.cell.2006.01.016 · Cited by 5,787
Mind-altering microorganisms: the impact of the gut microbiota on brain and behaviour
Cryan, J. F., & Dinan, T. G. (2012) · Nature Reviews Neuroscience · doi:10.1038/nrn3346 · Cited by 4,572
Intestinal microbiota metabolism of l-carnitine, a nutrient in red meat, promotes atherosclerosis
Koeth, R. A., Wang, Z., Levison, B. S., Buffa, J. A., Org, E., Sheehy, B. T., Britt, E. B., Fu, X., Wu, Y., Li, L., et al. (2013) · Nature Medicine · doi:10.1038/nm.3145 · Cited by 4,386
Gut microbiota composition correlates with diet and health in the elderly
Claesson, M. J., Jeffery, I. B., Conde, S., Power, S. E., O’Connor, E. M., Cusack, S., Harris, H. M. B., Coakley, M., Lakshminarayanan, B., O’Sullivan, O., et al. (2012) · Nature · doi:10.1038/nature11319 · Cited by 3,314
Hsiao, E. Y., McBride, S. W., Hsien, S., Sharon, G., Hyde, E. R., McCue, T., Codelli, J. A., Chow, J., Reisman, S. E., Petrosino, J. F., et al. (2013) · Cell · doi:10.1016/j.cell.2013.11.024 · Cited by 3,283
O’Toole, P. W., & Jeffery, I. B. (2015) · Science · doi:10.1126/science.aac8469 · Cited by 1,202
Migaud, M., Charlesworth, P., Dempster, M., Webster, L. C., Watabe, A. M., Makhinson, M., He, Y., Ramsay, M. F., Morris, R. G. M., Morrison, J. H., et al. (1998) · Nature · doi:10.1038/24790 · Cited by 1,160
Romano, K. A., Vivas, E. I., Amador-Noguez, D., & Rey, F. E. (2015) · mBio · doi:10.1128/mbio.02481-14 · Cited by 777
Tang, W. H. W., Wang, Z., Fan, Y., Levison, B., Hazen, J. E., Donahue, L. M., Wu, Y., & Hazen, S. L. (2014) · Journal of the American College of Cardiology · doi:10.1016/j.jacc.2014.02.617 · Cited by 681
The contributory role of gut microbiota in cardiovascular disease
Tang, W. H. W., & Hazen, S. L. (2014) · Journal of Clinical Investigation · doi:10.1172/jci72331 · Cited by 641
Cited by
Sorted by citations
Microbiota–gut–brain axis and its therapeutic applications in neurodegenerative diseases
Loh, J. S., Mak, W. Q., Tan, L. K. S., Ng, C. X., Chan, H. H., Yeow, S. H., Foo, J. B., Ong, Y. S., How, C. W., & Khaw, K. Y. (2024) · Signal Transduction and Targeted Therapy · doi:10.1038/s41392-024-01743-1 · Cited by 1,193
The gut microbiome as a modulator of healthy ageing
Ghosh, T. S., Shanahan, F., & O’Toole, P. W. (2022) · Nature Reviews Gastroenterology & Hepatology · doi:10.1038/s41575-022-00605-x · Cited by 817
The gut microbiota-derived metabolite trimethylamine N-oxide is elevated in Alzheimer’s disease
Vogt, N. M., Romano, K. A., Darst, B. F., Engelman, C. D., Johnson, S. C., Carlsson, C. M., Asthana, S., Blennow, K., Zetterberg, H., Bendlin, B. B., et al. (2018) · Alzheimer's Research & Therapy · doi:10.1186/s13195-018-0451-2 · Cited by 471
Trimethylamine N-Oxide Binds and Activates PERK to Promote Metabolic Dysfunction
Chen, S., Henderson, A., Petriello, M. C., Romano, K. A., Gearing, M., Miao, J., Schell, M., Sandoval-Espinola, W. J., Tao, J., Sha, B., et al. (2019) · Cell Metabolism · doi:10.1016/j.cmet.2019.08.021 · Cited by 427
Gut liver brain axis in diseases: the implications for therapeutic interventions
Yan, M., Man, S., Sun, B., Ma, L., Guo, L., Huang, L., & Gao, W. (2023) · Signal Transduction and Targeted Therapy · doi:10.1038/s41392-023-01673-4 · Cited by 314
Hosseinkhani, F., Heinken, A., Thiele, I., Lindenburg, P. W., Harms, A. C., & Hankemeier, T. (2021) · Gut Microbes · doi:10.1080/19490976.2021.1882927 · Cited by 249
Gut microbiota dependent trimethylamine N-oxide aggravates angiotensin II–induced hypertension
Jiang, S., Shui, Y., Cui, Y., Tang, C., Wang, X., Qiu, X., Hu, W., Fei, L., Li, Y., Zhang, S., et al. (2021) · Redox Biology · doi:10.1016/j.redox.2021.102115 · Cited by 237
Hoyles, L., Pontifex, M. G., Rodriguez-Ramiro, I., Anis-Alavi, M. A., Jelane, K. S., Snelling, T., Solito, E., Fonseca, S., Carvalho, A. L., Carding, S. R., et al. (2021) · Microbiome · doi:10.1186/s40168-021-01181-z · Cited by 221
The Role of Gut Bacterial Metabolites in Brain Development, Aging and Disease
Tran, S. M.-S., & Mohajeri, M. H. (2021) · Nutrients · doi:10.3390/nu13030732 · Cited by 213
Microbial-derived metabolites as a risk factor of age-related cognitive decline and dementia
Connell, E., Le Gall, G., Pontifex, M. G., Sami, S., Cryan, J. F., Clarke, G., Müller, M., & Vauzour, D. (2022) · Molecular Neurodegeneration · doi:10.1186/s13024-022-00548-6 · Cited by 208
Brunt, V. E., LaRocca, T. J., Bazzoni, A. E., Sapinsley, Z. J., Miyamoto-Ditmon, J., Gioscia-Ryan, R. A., Neilson, A. P., Link, C. D., & Seals, D. R. (2021) · GeroScience · doi:10.1007/s11357-020-00257-2 · Cited by 197
Interactions between polysaccharides and gut microbiota: A metabolomic and microbial review
Zhang, D., Liu, J., Cheng, H., Wang, H., Tan, Y., Feng, W., & Peng, C. Y. (2022) · Food Research International · doi:10.1016/j.foodres.2022.111653 · Cited by 206
Parkinson’s disease and gut microbiota: from clinical to mechanistic and therapeutic studies
Zhang, X., Tang, B., & Guo, J. (2023) · Translational Neurodegeneration · doi:10.1186/s40035-023-00392-8 · Cited by 212
Trimethylamine N-Oxide (TMAO), Diet and Cardiovascular Disease
Thomas, M. S., & Fernández, M. L. (2021) · Current Atherosclerosis Reports · doi:10.1007/s11883-021-00910-x · Cited by 192
Metformin attenuated sepsis-related liver injury by modulating gut microbiota
Liang, H., Song, H., Zhang, X., Song, G., Wang, Y., Ding, X., Duan, X., Li, L., Sun, T., & Kan, Q. (2022) · Emerging Microbes & Infections · doi:10.1080/22221751.2022.2045876 · Cited by 177
Gut Microbiota and Ischemic Stroke: The Role of Trimethylamine N-Oxide
Nam, H. S. (2019) · Journal of Stroke · doi:10.5853/jos.2019.00472 · Cited by 176
Zarneshan, S. N., Fakhri, S., & Khan, H. Z. (2022) · Pharmacological Research · doi:10.1016/j.phrs.2022.106099 · Cited by 179
Lu, S., Zhao, Q., Yu, G., Sun, Z., Li, W., Guo, S., & Zhang, A. (2024) · Biomedicine & Pharmacotherapy · doi:10.1016/j.biopha.2024.117207 · Cited by 191
The Role of Gut Microbiota in an Ischemic Stroke
Pluta, R. M., Januszewski, S., & Czuczwar, S. J. (2021) · International Journal of Molecular Sciences · doi:10.3390/ijms22020915 · Cited by 163
Implications of Gut Microbiota in Neurodegenerative Diseases
Zhang, H., Chen, Y., Wang, Z., Xie, G., Liu, M., Yuan, B., Chai, H., Wang, W., & Cheng, P. (2022) · Frontiers in Immunology · doi:10.3389/fimmu.2022.785644 · Cited by 161
Trimethylamine N-Oxide in Relation to Cardiometabolic Health—Cause or Effect?
Papandreou, C., Moré, M. I., & Bellamine, A. (2020) · Nutrients · doi:10.3390/nu12051330 · Cited by 157
Wang, Q., Shen, Y., Wang, X., Fu, S., Zhang, X., Zhang, Y., & Wang, R. (2020) · Aging · doi:10.18632/aging.102645 · Cited by 135
Li, L., Chen, B., Zhu, R., Li, R., Tian, Y., Liu, C., Jia, Q., Wang, L., Tang, J., Zhao, D., et al. (2019) · Aging · doi:10.18632/aging.102376 · Cited by 129
Self-citationRudzki, L., Stone, T. W., Maes, M. H. J., Misiak, B., Samochowiec, J., & Szulc, A. (2021) · Progress in Neuro-Psychopharmacology and Biological Psychiatry · doi:10.1016/j.pnpbp.2020.110240 · Cited by 125
Mediterranean Diet on Sleep: A Health Alliance
Scoditti, E., Tumolo, M. R., & Garbarino, S. (2022) · Nutrients · doi:10.3390/nu14142998 · Cited by 128
Gao, Q., Wang, Y., Wang, X., Fu, S., Zhang, X., Wang, R., & Zhang, X. (2019) · Aging · doi:10.18632/aging.102352 · Cited by 119
Key Signaling Pathways in Aging and Potential Interventions for Healthy Aging
Yu, M., Zhang, H., Wang, B. Z., Zhang, Y., Zheng, X., Shao, B., Zhuge, Q., & Jin, K. (2021) · Cells · doi:10.3390/cells10030660 · Cited by 117
Gut Metabolite TMAO Induces Synaptic Plasticity Deficits by Promoting Endoplasmic Reticulum Stress
Govindarajulu, M., Pinky, P. D., Steinke, I., Bloemer, J., Ramesh, S., Kariharan, T., Rella, R. T., Bhattacharya, S., Dhanasekaran, M., Suppiramaniam, V., et al. (2020) · Frontiers in Molecular Neuroscience · doi:10.3389/fnmol.2020.00138 · Cited by 113
Zhao, M., Wei, H., Li, C., Zhan, R., Liu, C., Gao, J., Yi, Y., Cui, X. B., Shan, W., Liang, J., et al. (2022) · Nature Communications · doi:10.1038/s41467-022-29060-7 · Cited by 117
Self-citationGut microbiota-derived metabolites and their importance in neurological disorders
Swer, N. M., Venkidesh, B. S., Murali, T. S., & Mumbrekar, K. D. (2022) · Molecular Biology Reports · doi:10.1007/s11033-022-08038-0 · Cited by 120
Boundaries and integration between microbiota, the nervous system, and immunity
Macpherson, A. J., Pachnis, V., & Prinz, M. (2023) · Immunity · doi:10.1016/j.immuni.2023.07.011 · Cited by 118
Can diet modulate trimethylamine N-oxide (TMAO) production? What do we know so far?
Coutinho‐Wolino, K. S., Cardozo, L., Leal, V. D. O., Mafra, D., & Stockler‐Pinto, M. B. (2021) · European Journal of Nutrition · doi:10.1007/s00394-021-02491-6 · Cited by 116
Praveenraj, S. S., Sonali, S., Anand, N., Hediyal, T. A., Vichitra, C., Kalyan, M., Kanna, P. V., Chandana, K. A., Paneyala, S., Mahalakshmi, A. M., et al. (2022) · Molecular Neurobiology · doi:10.1007/s12035-022-02990-5 · Cited by 116
Du, D., Tang, W., Zhou, C., Sun, X., Wei, Z., Zhong, J., & Huang, Z. (2021) · Oxidative Medicine and Cellular Longevity · doi:10.1155/2021/5816837 · Cited by 105
Ischemic stroke and intestinal flora: an insight into brain–gut axis
Hu, W., Kong, X., Wang, H., Li, Y., & Luo, Y. (2022) · European journal of medical research · doi:10.1186/s40001-022-00691-2 · Cited by 102
Interventions on Gut Microbiota for Healthy Aging
Zeppa, S. D., Agostini, D., Ferrini, F., Gervasi, M., Barbieri, E., Bartolacci, A., Piccoli, G., Saltarelli, R., Sestili, P., & Stocchi, V. (2022) · Cells · doi:10.3390/cells12010034 · Cited by 98
Varesi, A., Campagnoli, L. I. M., Fahmideh, F., Pierella, E., Romeo, M., Ricevuti, G., Nicoletta, M., Chirumbolo, S., & Pascale, A. (2022) · International Journal of Molecular Sciences · doi:10.3390/ijms232012289 · Cited by 88
Chu, C., Yu, L., Qi, G., Mi, Y., Wu, W., Lee, Y. K., Zhai, Q., Tian, F., & Chen, W. (2022) · Neuroscience & Biobehavioral Reviews · doi:10.1016/j.neubiorev.2022.104556 · Cited by 87
The gut microbiome and Alzheimer’s disease: Complex and bidirectional interactions
Tarawneh, R. M., & Penhos, E. (2022) · Neuroscience & Biobehavioral Reviews · doi:10.1016/j.neubiorev.2022.104814 · Cited by 92
Zhou, Y., Zhang, Y., Jin, S., Lv, J., Li, M., & Feng, N. (2024) · Biomedicine & Pharmacotherapy · doi:10.1016/j.biopha.2024.117031 · Cited by 94
Trimethylamine N-Oxide Promotes Cell Proliferation and Angiogenesis in Colorectal Cancer
Yang, S., Dai, H., Lu, Y., Li, R., Gao, C., & Pan, S. (2022) · Journal of Immunology Research · doi:10.1155/2022/7043856 · Cited by 86
Wang, M., Li, X. S., Wang, Z., Otto, M. C. D. O., Lemaître, R. N., Fretts, A. M., Sotoodehnia, N., Budoff, M. J., Nemet, I., DiDonato, J. A., et al. (2023) · European Heart Journal · doi:10.1093/eurheartj/ehad089 · Cited by 84
Gut Microbiota-Derived Metabolite Trimethylamine N-Oxide as a Biomarker in Early Parkinson’s Disease
Chung, S. J., Rim, J. H., Ji, D., Lee, S., Yoo, H. S., Jung, J. H., Baik, K., Choi, Y., Ye, B. S., Sohn, Y. H., et al. (2021) · Nutrition · doi:10.1016/j.nut.2020.111090 · Cited by 74
Trimethylamine N -oxide: heart of the microbiota–CVD nexus?
Naghipour, S., Cox, A. J., Peart, J. N., Toit, E. F. D., & Headrick, J. P. (2020) · Nutrition Research Reviews · doi:10.1017/s0954422420000177 · Cited by 77
Ge, P., Duan, H., Tao, C., Niu, S., Hu, Y., Duan, R., Shen, A., Sun, Y., & Sun, W. (2023) · Journal of Inflammation Research · doi:10.2147/jir.s399480 · Cited by 76
Cellular senescence in brain aging and cognitive decline
Shafqat, A., Khan, S., Omer, M. H., Niaz, M., Albalkhi, I., AlKattan, K. M., Yaqinuddin, A., Tchkonia, T., Kirkland, J. L., & Hashmi, S. K. (2023) · Frontiers in Aging Neuroscience · doi:10.3389/fnagi.2023.1281581 · Cited by 81
Can nutrition support healthy cognitive ageing and reduce dementia risk?
Jennings, A., Cunnane, S. C., & Minihane, A. M. (2020) · BMJ · doi:10.1136/bmj.m2269 · Cited by 69
Ilyas, A., Wijayasinghe, Y. S., Khan, I., Samaloty, N. M. E., Adnan, M., Dar, T. A., Poddar, N. K., Singh, L. R., Sharma, H., & Khan, S. (2022) · Frontiers in Molecular Biosciences · doi:10.3389/fmolb.2022.964624 · Cited by 73
Zou, B., Li, J., Ma, R., Cheng, X.-Y., Ma, R.-Y., Zhou, T.-Y., Wu, Z., Yao, Y., & Li, J. (2023) · Aging and Disease · doi:10.14336/ad.2022.1127 · Cited by 76
The Brain–Gut Axis, an Important Player in Alzheimer and Parkinson Disease: A Narrative Review
Caradonna, E., Nemni, R., Bifone, A., Gandolfo, P., Costantino, L., Giordano, L., Mormone, E., Macula, A., Cuomo, M., Difruscolo, R., et al. (2024) · Journal of Clinical Medicine · doi:10.3390/jcm13144130 · Cited by 80
Hernandez, L. N., Ward, L. J., Arefin, S., Ebert, T., Laučytė-Cibulskienė, A., Collaborators, G.-F., Pilote, L., Norris, C. M., Raparelli, V., Kautzky‐Willer, A., et al. (2022) · Scientific Reports · doi:10.1038/s41598-022-08387-7 · Cited by 70
Mudimela, S., Vishwanath, N. K., Pillai, A., Morales, R., Marrelli, S. P., Barichello, T., & Giridharan, V. V. (2022) · Drug Discovery Today · doi:10.1016/j.drudis.2022.08.002 · Cited by 71
The potential role of mitochondria in the microbiota-gut-brain axis: Implications for brain health
Qiao, L., Yang, G., Wang, P., & Xu, C. (2024) · Pharmacological Research · doi:10.1016/j.phrs.2024.107434 · Cited by 73
Microbiota impacts on chronic inflammation and metabolic syndrome - related cognitive dysfunction
Arnoriaga‐Rodríguez, M., & Fernández‐Real, J. M. (2019) · Reviews in Endocrine and Metabolic Disorders · doi:10.1007/s11154-019-09537-5 · Cited by 68
Elevated plasma trimethylamine-N-oxide levels are associated with diabetic retinopathy
Liu, W., Wang, C., Xia, Y., Xia, W. T., Liu, G., Ren, C., Gu, Y., Li, X., & Lu, P. (2020) · Acta Diabetologica · doi:10.1007/s00592-020-01610-9 · Cited by 66
Zhu, C., Li, G., Lv, Z., Li, J., Wang, X., Kang, J., & Zhan, C. (2019) · Neurological Sciences · doi:10.1007/s10072-019-04040-w · Cited by 65
Luo, Y., Yang, L.-L., & Yao, X. (2024) · Molecular Neurodegeneration · doi:10.1186/s13024-024-00720-0 · Cited by 75
Dietary Regulation of Gut-Brain Axis in Alzheimer’s Disease: Importance of Microbiota Metabolites
Frausto, D. M., Forsyth, C. B., Keshavarzian, A., & Voigt, R. M. (2021) · Frontiers in Neuroscience · doi:10.3389/fnins.2021.736814 · Cited by 61
The dietary source of trimethylamine N-oxide and clinical outcomes: an unexpected liaison
Evans, M., Dai, L., Avesani, C. M., Kublickiene, K. R., & Stenvinkel, P. (2023) · Clinical Kidney Journal · doi:10.1093/ckj/sfad095 · Cited by 68
The role of trimethylamine‐N‐Oxide in the development of Alzheimer's disease
Buawangpong, N., Pinyopornpanish, K., Siri‐Angkul, N., Chattipakorn, N., & Chattipakorn, S. C. (2021) · Journal of Cellular Physiology · doi:10.1002/jcp.30646 · Cited by 59
Choline Pathway Nutrients and Metabolites and Cognitive Impairment After Acute Ischemic Stroke
Zhong, C., Lu, Z., Che, B., Qian, S., Zheng, X., Wang, A., Bu, X., Zhang, J., Ju, Z., Xu, T., et al. (2021) · Stroke · doi:10.1161/strokeaha.120.031903 · Cited by 59
Nutrition, gut microbiota, and alzheimer’s disease
Romanenko, M., Kholin, V., Koliada, A., & Vaiserman, A. (2021) · Frontiers in Psychiatry · doi:10.3389/fpsyt.2021.712673 · Cited by 56
Zhou, D., Zhang, J., Xiao, C., Mo, C., & Ding, B. (2022) · Frontiers in Immunology · doi:10.3389/fimmu.2022.964477 · Cited by 61
Trimethylamine N-Oxide and Stroke Recurrence Depends on Ischemic Stroke Subtypes
Xu, J., Cheng, A., Song, B., Zhao, M., Xue, J., Wang, A., Dai, L., Jing, J., Meng, X., Li, H., et al. (2021) · Stroke · doi:10.1161/strokeaha.120.031443 · Cited by 55
Self-citationTan, C., Wang, H., Gao, X., Xu, R., Zeng, X., Cui, Z., Zhu, J., Wu, Q., Xia, G., Zhou, H., et al. (2020) · Frontiers in Neurology · doi:10.3389/fneur.2020.00029 · Cited by 55
Mu, C., Corley, M. J., Lee, R. W. Y., Wong, M., Pang, A. P. S., Arakaki, G., Miyamoto, R. H., Rho, J. M., Mickiewicz, B., Dowlatabadi, R., et al. (2019) · Journal of Proteome Research · doi:10.1021/acs.jproteome.9b00581 · Cited by 56
Alzheimer’s disease and gut microbiota: does trimethylamine N-oxide (TMAO) play a role?
Arrona Cardoza, P., Spillane, M. B., & Morales Marroquin, E. (2022) · Nutrition Reviews · doi:10.1093/nutrit/nuab022 · Cited by 53
Li, J., Zeng, Q., Xiong, Z., Xian, G., Liu, Z., Zhan, Q., Lai, W., Ao, L., Meng, X., Ren, H., et al. (2021) · Cardiovascular Research · doi:10.1093/cvr/cvab243 · Cited by 52
He, W., Luo, Y., Liu, J., Sun, N. L., Guo, D., Cui, L.-L., Zheng, P., Yao, S.-M., Yang, J.-F., & Wang, H. (2020) · Clinical Interventions in Aging · doi:10.2147/cia.s270887 · Cited by 52
Rath, S., Rox, K., Bardenhorst, S. K., Schminke, U., Dörr, M., Mayerle, J. V., Frost, F., Lerch, M. M., Karch, A., Brönstrup, M., et al. (2021) · mSystems · doi:10.1128/msystems.00945-21 · Cited by 55
Drivers and mechanisms of cognitive decline in chronic kidney disease
Capasso, G., Franssen, C. F. M., Perna, A. F., Massy, Z. A., Menzies, R. I., Zoccali, C., Tessitore, A., Nedergaard, M., Okusa, M. D., Ortíz, A., et al. (2025) · Nature Reviews Nephrology · doi:10.1038/s41581-025-00963-0 · Cited by 58
Prognostic Value of Plasma Trimethylamine N-Oxide Levels in Patients with Acute Ischemic Stroke
Zhai, Q., Wang, X., Chen, C., Tang, Y., Wang, Y., Tian, J., Zhao, Y., & Liu, X. (2019) · Cellular and Molecular Neurobiology · doi:10.1007/s10571-019-00714-3 · Cited by 53
Citrulline regulates macrophage metabolism and inflammation to counter aging in mice
Xie, Z., Lin, M., Xing, B., Wang, H., Zhang, H., Cai, Z., Mei, X., & Zhu, Z. (2025) · Science Advances · doi:10.1126/sciadv.ads4957 · Cited by 51
Nutritional metabolism and cerebral bioenergetics in Alzheimer's disease and related dementias
Yassine, H. N., Self, W. K., Kerman, B. E., Santoni, G., Shanmugam, N. K. N., Abdullah, L. I., Golden, L. R., Fonteh, A. N., Harrington, M. G., Gräff, J., et al. (2022) · Alzheimer s & Dementia · doi:10.1002/alz.12845 · Cited by 52
Diet-Microbiota-Brain Axis in Alzheimer’s Disease
Kincaid, H. J., Nagpal, R., & Yadav, H. (2021) · Annals of Nutrition and Metabolism · doi:10.1159/000515700 · Cited by 51
Deng, Y., Zou, J., Hong, Y., Peng, Q., Fu, X., Duan, R., Chen, J., & Chen, X. (2022) · Cells · doi:10.3390/cells11223650 · Cited by 48
The Molecular Gut-Brain Axis in Early Brain Development
Muhammad, F., Fan, B., Wang, R., Ren, J., Jia, S., Wang, L., Chen, Z., & Liu, X. (2022) · International Journal of Molecular Sciences · doi:10.3390/ijms232315389 · Cited by 53
Stroke and Vascular Cognitive Impairment: The Role of Intestinal Microbiota Metabolite TMAO
Tu, R., & Xia, J. (2024) · CNS & Neurological Disorders - Drug Targets · doi:10.2174/1871527322666230203140805 · Cited by 47
Xie, W., Ke, Y., You, Q., Li, J., Chen, L., Li, D., Fang, J., Chen, X., Zhou, Y., Chen, L., et al. (2022) · Arteriosclerosis, Thrombosis, and Vascular Biology · doi:10.1161/atvbaha.121.316883 · Cited by 46
Self-citationThe complex relationship between gut microbiota and Alzheimer’s disease: A systematic review
Zhou, X.-P., Sun, L.-B., Liu, W., Zhu, W.-M., Li, L.-C., Song, X., Xing, J.-P., & Gao, S. (2024) · Ageing Research Reviews · doi:10.1016/j.arr.2024.102637 · Cited by 54
Glinert, A., Turjeman, S., Elliott, E., & Koren, O. (2021) · Biological reviews/Biological reviews of the Cambridge Philosophical Society · doi:10.1111/brv.12812 · Cited by 48
Nicolas, S., Dohm-Hansen, S., Lavelle, A., Bastiaanssen, T. F. S., English, J. A., Cryan, J. F., & Nolan, Y. M. (2024) · Translational Psychiatry · doi:10.1038/s41398-024-02904-0 · Cited by 52
Gut Microbiota and Microbiota-Related Metabolites as Possible Biomarkers of Cognitive Aging
Ticinesi, A., Nouvenne, A., Tana, C., Prati, B., & Meschi, T. (2019) · Advances in experimental medicine and biology · doi:10.1007/978-3-030-25650-0_8 · Cited by 45
Qiao, C.-M., Quan, W., Zhou, Y., Niu, G.-Y., Hong, H., Wu, J., Zhao, L.-P., Li, T., Cui, C., Zhao, W.-J., et al. (2023) · Molecular Neurobiology · doi:10.1007/s12035-023-03392-x · Cited by 45
Self-citationLong-Term Intake of Red Meat in Relation to Dementia Risk and Cognitive Function in US Adults
Li, Y., Li, Y., Gu, X., Liu, Y., Dong, D., Kang, J. H., Wang, M., Eliassen, A. H., Willett, W. C., Stampfer, M. J., et al. (2025) · Neurology · doi:10.1212/wnl.0000000000210286 · Cited by 46
Lv, L.-L., Liu, B., Liu, J., Li, L.-S., Jin, F., Xu, Y.-Y., Wu, Q., Liu, J., & Shi, J.-S. (2020) · Journal of Alzheimer's Disease · doi:10.3233/jad-200308 · Cited by 40
Functional effects of gut microbiota-derived metabolites in Alzheimer's disease
Choi, H., & Mook‐Jung, I. (2023) · Current Opinion in Neurobiology · doi:10.1016/j.conb.2023.102730 · Cited by 41
Prajapati, S. K., Shah, R., Alford, N., Mishra, S. P., Jain, S., HANSEN, B. C., Sanberg, P. R., Molina, A. J. A., & Yadav, H. (2023) · The Journals of Gerontology Series A · doi:10.1093/gerona/glad226 · Cited by 42
Chen, F.-J., Liu, B., Wu, Q., Liu, J., Xu, Y., Zhou, S., & Shi, J. (2019) · Journal of Pharmacology and Experimental Therapeutics · doi:10.1124/jpet.118.253310 · Cited by 42
Krueger, E. S., Lloyd, T. S., & Tessem, J. S. (2021) · Nutrients · doi:10.3390/nu13082873 · Cited by 41
Zhu, Y., Li, Y., Zhang, Q., Song, Y., Wang, L., & Zhu, Z. (2022) · Frontiers in Microbiology · doi:10.3389/fmicb.2022.798917 · Cited by 40
Gut Microbial Dysbiosis and Cognitive Impairment in Bipolar Disorder: Current Evidence
Dai, W., Liu, J., Yan, Q., Teng, Z., Li, S., Yuan, H., Huang, J., Xiang, H., Tang, H., Wang, B., et al. (2022) · Frontiers in Pharmacology · doi:10.3389/fphar.2022.893567 · Cited by 42
Wang, F., Gu, Y., Xu, C., Du, K., Zhao, C., Zhao, Y., & Liu, X. (2022) · Frontiers in Aging Neuroscience · doi:10.3389/fnagi.2022.858130 · Cited by 39
Effect of a Vegan Diet on Alzheimer’s Disease
Katonová, A., Sheardová, K., Amlerová, J., Angelucci, F., & Hort, J. (2022) · International Journal of Molecular Sciences · doi:10.3390/ijms232314924 · Cited by 46
Ji, X., Tian, L., Niu, S., Yao, S., & Qu, C. (2022) · Frontiers in Aging Neuroscience · doi:10.3389/fnagi.2022.963876 · Cited by 38
Zhang, Y., Wang, G., Li, R., Liu, R., Yu, Z., Zhang, Z., & Wan, Z. (2023) · Neurochemistry International · doi:10.1016/j.neuint.2022.105459 · Cited by 37
Plasma Trimethylamine N-Oxide (TMAO): Associations with Cognition, Neuroimaging, and Dementia
Yaqub, A., Vojinovic, D., Vernooij, M. W., Slagboom, P. E., Ghanbari, M., Beekman, M., van der Grond, J., Hankemeier, T., van Duijn, C. M., Ikram, M. A., et al. (2024) · Alzheimer's Research & Therapy · doi:10.1186/s13195-024-01480-1 · Cited by 37
Li, C., Zhu, L., Dai, Y., Zhang, Z., Huang, L., Wang, T. J., Fu, P., Li, Y., Wang, J., & Jiang, C. Q. (2022) · Oxidative Medicine and Cellular Longevity · doi:10.1155/2022/1599747 · Cited by 37
Zhou, S., Liu, J., Sun, Y., Xu, P., Liu, J. L., Sun, S., Zhu, B., & Wu, H. (2023) · Food & Function · doi:10.1039/d2fo03874a · Cited by 34
Begdache, L., Sadeghzadeh, S., Derose, G., & Abrams, C. (2020) · Nutrients · doi:10.3390/nu13010024 · Cited by 38
Metadata
- Authors
- Li, D., Ke, Y., Zhan, R., Liu, C., Zhao, M., Zeng, A., Shi, X., Ji, L., Cheng, S., Pan, B., Zheng, L., & Hong, H.
- Affiliations
- Union Hospital (CN)
- Peking University (CN)
- The Institute of Cardiovascular Sciences and Institute of Systems Biomedicine School of Basic Medical Sciences Peking University Health Science Center Key Laboratory of Molecular Cardiovascular Science Ministry of Education; Key Laboratory of Cardiovascular Molecular Biology and Regulatory Peptides Ministry of Health; Beijing Key Laboratory of Cardiovascular Receptors Research Beijing China
- Capital Medical University (CN)
- Corresponding author
- Zheng, Lemin
- Hong, Huashan
- Venue
- Aging Cell
- Publisher
- Wiley
- Published
- 2018-05-10
- Volume
- 17
- Issue
- 4
- Pages
- e12768-e12768
- ISSN
- 1474-9718 (ISSN-L)
- 1474-9726
- PMC
- PMC6052480
- OpenAlex
- W2800864806
- Cited by
- 304
- References
- 49
- Citations by year
- 2026: 32 · 2025: 46 · 2024: 52 · 2023: 50 · 2022: 60 · 2021: 33 · 2020: 19 · 2019: 11 · 2018: 1
- FWCI
- 6.42
- Type
- journal article
- Language
- en
- Open access
- gold
- doi.org
- Licence
- Locations
- Aging Cell (publishedVersion, cc-by)
- Europe PMC (PubMed Central) (publishedVersion, other-oa)
- PubMed Central (publishedVersion, cc-by)
- PubMed (publishedVersion)
- Funders
- National Natural Science Foundation of China (81570448, 91639108, 81370235, 81770272)
- Topics
- Life Sciences › Biochemistry, Genetics and Molecular Biology › Aging › Genetics, Aging, and Longevity in Model Organisms
- Life Sciences › Neuroscience › Cellular and Molecular Neuroscience › Antioxidants, Aging, Portulaca oleracea
- Health Sciences › Medicine › Psychiatry and Mental health › Dementia and Cognitive Impairment Research
- Keywords
- trimethylamine N-oxide, brain aging, cognitive impairment, gut microbiota, cellular senescence, neuronal senescence, hippocampal CA3, mitochondrial dysfunction, superoxide, synaptic damage, synaptic plasticity, mTOR signaling, SAMP8 mice, SAMR1 mice
- MeSH terms
- Adolescent, Adult, Aged, Animals, Brain, Humans, Male, Methylamines, Middle Aged, Cellular Senescence, Mice, Young Adult, Cognitive Dysfunction
About these checks
Registry, retraction, Cites and statistics results are computed, not judged, with one exception: a printed reference that no index lists is read once by a model before it counts as a citation error. Claims are extracted by a model and kept only when their quote appears verbatim in the text; each cited source is then checked, with a model’s help, for whether it says what the claim relies on. Those verdicts can be wrong — read the claim’s quote and the cited source before relying on one.
Statistics and arithmetic are recomputed, not judged.
Confidence bands are shown only for fields calibrated on our annotated test set. None is calibrated yet, so no band is shown.
What counts as a claim ›How we measure confidence ›How we check this ›
Are you an author, or do you see a problem with this page? Request a review
