

The DOI matches its Crossref record; 20 of the 20 references it cites were found in a registry or an index.
GOrilla: a tool for discovery and visualization of enriched GO terms in ranked gene lists
Open accessAbstract
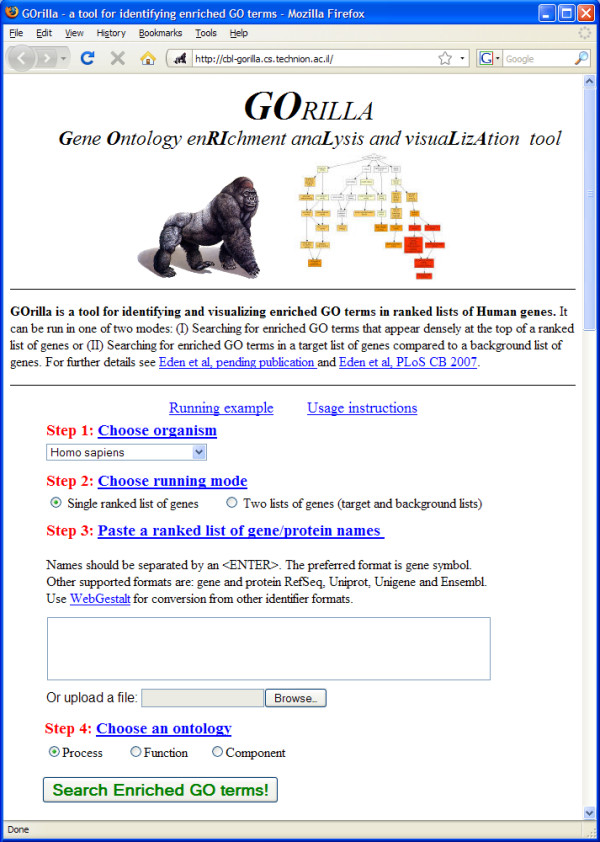
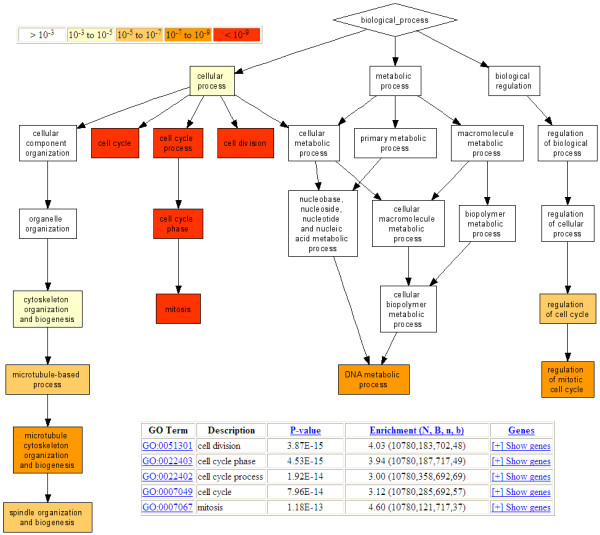
BACKGROUND: Since the inception of the GO annotation project, a variety of tools have been developed that support exploring and searching the GO database. In particular, a variety of tools that perform GO enrichment analysis are currently available. Most of these tools require as input a target set of genes and a background set and seek enrichment in the target set compared to the background set. A few tools also exist that support analyzing ranked lists. The latter typically rely on simulations or on union-bound correction for assigning statistical significance to the results. RESULTS: GOrilla is a web-based application that identifies enriched GO terms in ranked lists of genes, without requiring the user to provide explicit target and background sets. This is particularly useful in many typical cases where genomic data may be naturally represented as a ranked list of genes (e.g. by level of expression or of differential expression). GOrilla employs a flexible threshold statistical approach to discover GO terms that are significantly enriched at the top of a ranked gene list. Building on a complete theoretical characterization of the underlying distribution, called mHG, GOrilla computes an exact p-value for the observed enrichment, taking threshold multiple testing into account without the need for simulations. This enables rigorous statistical analysis of thousand of genes and thousands of GO terms in order of seconds. The output of the enrichment analysis is visualized as a hierarchical structure, providing a clear view of the relations between enriched GO terms. CONCLUSION: GOrilla is an efficient GO analysis tool with unique features that make a useful addition to the existing repertoire of GO enrichment tools. GOrilla's unique features and advantages over other threshold free enrichment tools include rigorous statistics, fast running time and an effective graphical representation. GOrilla is publicly available at: http://cbl-gorilla.cs.technion.ac.il
Overview
The claims and statistics of this paper haven’t been checked yet.
Run the check — free, no account needed. It reads the open-access text and checks the sources it cites.
Integrity signals
Registry
Cites
Statistics
Figures
Verification
Claims the paper makes
The claims and statistics of this paper haven’t been checked yet.
Run the check — free, no account needed. It reads the open-access text and checks the sources it cites.
Claims other papers make about this one
Each is checked against this paper’s own text: does it say what the citing paper says it does?
The source backs part of the claim, not all of it — or backs it for a different population, condition or comparison.
In the citing paper
“Biological ontologies are large hierarchies which also have a DAG structure; as such, existing tools for visualizing ontologies can also have direct application to data-driven multiscale models (Binns et al., 2009; Eden et al., 2009; Sealfon et al., 2006; Supek et al., 2011; Zhu et al., 2019).”
From Mapping the multiscale structure of biological systems (2021) · cites this paper as Eden et al., 2009
Experimental — accuracy not yet measuredThe cited source says what the claim attributes to it.
In the citing paper
“GO term analysis (33) indicated significant enrichment of only one process (P-value = 5.2E-5; false discovery rate = 6.3E-2): regulators of calcineurin (CNB1, RCN1), a well-studied Ca2+/calmodulin-dependent protein phosphatase.”
From Echinocandin tolerance and persistence in vitro are regulated by calcineurin signaling in Candida glabrata (2026) · cites this paper as [33]
The cited source says what the claim attributes to it.
In the citing paper
“These were enriched for specialized programs across ages: Embryonic epithelia upregulated genes for developmental processes (Figure 3K, S3K), while aged epithelia upregulated host-defense programs (Figure 3L, FDR q-value < 0.01, GOrilla (Eden et al., 2007, 2009;Baruch et al., 2014).”
From A cellular and spatial map of the choroid plexus across brain ventricles and ages (2021) · cites this paper as Eden et al., 2009
In the citing paper
“We employed GOrilla (Eden et al. , 2009) on the genes ranked according to the LFC along the genotype -axis and along the Aβ -axis, and identified 13 functional super categories (Figure S3A, Table S2).”
From Spatial Transcriptomics and In Situ Sequencing to Study Alzheimer’s Disease (2020) · cites this paper as Eden et al., 2009
Self-check
Percentages, sums and reported differences re-computed from the paper’s own numbers.
The self-check needs the paper’s full text.
Citations
Cites
Subramanian, A., Tamayo, P., Mootha, V. K., Mukherjee, S., Ebert, B. L., Gillette, M. A., Paulovich, A., Pomeroy, S. L., Golub, T. R., Lander, E. S., et al. (2005) · Proceedings of the National Academy of Sciences · doi:10.1073/pnas.0506580102 · Cited by 53,625
Gene Ontology: tool for the unification of biology
Ashburner, M., Ball, C. A., Blake, J. A., Botstein, D., Butler, H., Cherry, J. M., Davis, A. P., Dolinski, K., Dwight, S. S., Eppig, J. T., et al. (2000) · Nature Genetics · doi:10.1038/75556 · Cited by 43,206
Gene expression profiling predicts clinical outcome of breast cancer
van 't Veer, L. J., Dai, H., van de Vijver, M. J., He, Y. D., Hart, A. A. M., Mao, M., Peterse, H. L., van der Kooy, K., Marton, M. J., Witteveen, A. T., et al. (2002) · Nature · doi:10.1038/415530a · Cited by 9,536
DAVID: Database for Annotation, Visualization, and Integrated Discovery
Dennis, G., Sherman, B. T., Hosack, D. A., Yang, J., Gao, W., Lane, H. C., & Lempicki, R. A. (2003) · Genome Biology · doi:10.1186/gb-2003-4-5-p3 · Cited by 9,327
Maere, S., Heymans, K., & Kuiper, M. T. R. (2005) · Computer applications in the biosciences · doi:10.1093/bioinformatics/bti551 · Cited by 4,163
Boyle, E. I., Weng, S., Gollub, J., Jin, H., Botstein, D., Cherry, J. M., & Sherlock, G. (2004) · Bioinformatics · doi:10.1093/bioinformatics/bth456 · Cited by 2,067
GOstat: find statistically overrepresented Gene Ontologies within a group of genes
Beißbarth, T., & Speed, T. P. (2004) · Bioinformatics · doi:10.1093/bioinformatics/bth088 · Cited by 1,256
GoMiner: a resource for biological interpretation of genomic and proteomic data
Zeebèrg, B. R., Feng, W., Wang, G., Wang, M. D., Fojo, A. T., Sunshine, M., Narasimhan, S., Kane, D. W., Reinhold, W. C., Lababidi, S., et al. (2003) · Genome biology · doi:10.1186/gb-2003-4-4-r28 · Cited by 1,198
FatiGO: a web tool for finding significant associations of Gene Ontology terms with groups of genes
Al‐Shahrour, F., Díaz‐Uriarte, R., & Dopazo, J. (2004) · Bioinformatics · doi:10.1093/bioinformatics/btg455 · Cited by 1,135
Ontological analysis of gene expression data: current tools, limitations, and open problems
Khatri, P., & Drăghici, S. (2005) · Bioinformatics · doi:10.1093/bioinformatics/bti565 · Cited by 850
Research works printed but not linked: 1
- Eden E: Discovering Motifs in Ranked Lists of DNA Sequences. Master's thesis [ http://bioinfo.cs.technion.ac.il/people/zohar/thesis/eran.pdf ]
Cited by
Sorted by citations
REVIGO summarizes and visualizes long lists of gene ontology terms
Supek, F., Bošnjak, M., Škunca, N., & Šmuc, T. (2011) · PLoS ONE · doi:10.1371/journal.pone.0021800 · Cited by 6,264
Fagerberg, L., Hallström, B. M., Oksvold, P., Kampf, C., Djureinovic, D., Odeberg, J., Habuka, M., Tahmasebpoor, S., Danielsson, A., Edlund, K., et al. (2014) · Molecular & Cellular Proteomics · doi:10.1074/mcp.m113.035600 · Cited by 3,665
Molecular and genetic properties of tumors associated with local immune cytolytic activity
Rooney, M. S., Shukla, S. A., Wu, C. J., Getz, G., & Hacohen, N. (2015) · Cell · doi:10.1016/j.cell.2014.12.033 · Cited by 3,825
Host microbiota constantly control maturation and function of microglia in the CNS
Erny, D., Hrabě de Angelis, A. L., Jaitin, D., Wieghofer, P., Staszewski, O., David, E., Keren-Shaul, H., Mahlakoiv, T., Jakobshagen, K., Buch, T., et al. (2015) · Nature Neuroscience · doi:10.1038/nn.4030 · Cited by 3,569
Finak, G., McDavid, A., Yajima, M., Deng, J., Gersuk, V., Shalek, A. K., Slichter, C. K., Miller, H. W., McElrath, M. J., Prlic, M., et al. (2015) · Genome Biology · doi:10.1186/s13059-015-0844-5 · Cited by 3,159
Single-cell RNA-seq reveals new types of human blood dendritic cells, monocytes, and progenitors
Villani, A.-C., Satija, R., Reynolds, G., Sarkizova, S., Shekhar, K., Fletcher, J., Griesbeck, M., Butler, A., Zheng, S., Lazo, S., et al. (2017) · Science · doi:10.1126/science.aah4573 · Cited by 2,413
Tissue-Resident Macrophage Enhancer Landscapes Are Shaped by the Local Microenvironment
Lavin, Y., Winter, D., Blecher-Gonen, R., David, E., Keren-Shaul, H., Merad, M., Jung, S., & Amit, I. (2014) · Cell · doi:10.1016/j.cell.2014.11.018 · Cited by 2,167
Dixon, S. J., Patel, D. N., Welsch, M., Skouta, R., Lee, E. D., Hayano, M., Thomas, A. G., Gleason, C. E., Tatonetti, N. P., Slusher, B. S., et al. (2014) · eLife · doi:10.7554/elife.02523 · Cited by 2,088
Zmora, N., Zilberman-Schapira, G., Suez, J., Mor, U., Dori-Bachash, M., Bashiardes, S., Kotler, E., Zur, M., Regev-Lehavi, D., Brik, R. B.-Z., et al. (2018) · Cell · doi:10.1016/j.cell.2018.08.041 · Cited by 1,695
Single-Cell Multi-omic Integration Compares and Contrasts Features of Brain Cell Identity
Welch, J. D., Kozareva, V., Ferreira, A., Vanderburg, C., Martin, C., & Macosko, E. Z. (2019) · Cell · doi:10.1016/j.cell.2019.05.006 · Cited by 1,193
Tracking cancer drugs in living cells by thermal profiling of the proteome
Savitski, M. M., Reinhard, F. B. M., Franken, H., Werner, T., Savitski, M. F., Eberhard, D., Molina, D. M., Jafari, R., Dovega, R. B., Klaeger, S., et al. (2014) · Science · doi:10.1126/science.1255784 · Cited by 1,187
Microglia development follows a stepwise program to regulate brain homeostasis
Matcovitch-Natan, O., Winter, D. R., Giladi, A., Vargas Aguilar, S., Spinrad, A., Sarrazin, S., Ben-Yehuda, H., David, E., Zelada González, F., Perrin, P., et al. (2016) · Science · doi:10.1126/science.aad8670 · Cited by 1,180
Microglial brain region-dependent diversity and selective regional sensitivities to aging
Grabert, K., Michoel, T., Karavolos, M. H., Clohisey, S., Baillie, J. K., Stevens, M. P., Freeman, T. C., Summers, K. M., & McColl, B. W. (2016) · Nature Neuroscience · doi:10.1038/nn.4222 · Cited by 1,151
Suez, J., Zmora, N., Zilberman-Schapira, G., Mor, U., Dori-Bachash, M., Bashiardes, S., Zur, M., Regev-Lehavi, D., Ben-Zeev Brik, R., Federici, S., et al. (2018) · Cell · doi:10.1016/j.cell.2018.08.047 · Cited by 1,184
Reyfman, P. A., Walter, J. M., Joshi, N., Anekalla, K. R., McQuattie-Pimentel, A. C., Chiu, S., Fernandez, R., Akbarpour, M., Chen, C.-I., Ren, Z., et al. (2019) · American Journal of Respiratory and Critical Care Medicine · doi:10.1164/rccm.201712-2410oc · Cited by 1,203
Lysosome-targeting chimaeras for degradation of extracellular proteins
Banik, S. M., Pedram, K., Wisnovsky, S., Ahn, G., Riley, N. M., & Bertozzi, C. R. (2020) · Nature · doi:10.1038/s41586-020-2545-9 · Cited by 1,199
Monocyte-derived alveolar macrophages drive lung fibrosis and persist in the lung over the life span
Misharin, A. V., Morales-Nebreda, L., Reyfman, P. A., Cuda, C. M., Walter, J. M., McQuattie-Pimentel, A. C., Chen, C.-I., Anekalla, K. R., Joshi, N., Williams, K. J. N., et al. (2017) · Journal of Experimental Medicine · doi:10.1084/jem.20162152 · Cited by 1,133
The NASA Twins Study: A multidimensional analysis of a year-long human spaceflight
Garrett-Bakelman, F. E., Darshi, M., Green, S. J., Gur, R. C., Lin, L., Macias, B. R., McKenna, M. J., Meydan, C., Mishra, T., Nasrini, J., et al. (2019) · Science · doi:10.1126/science.aau8650 · Cited by 1,128
Normalizing the environment recapitulates adult human immune traits in laboratory mice
Beura, L. K., Hamilton, S. E., Bi, K., Schenkel, J. M., Odumade, O. A., Casey, K. A., Thompson, E. A., Fraser, K. A., Rosato, P. C., Filali-Mouhim, A., et al. (2016) · Nature · doi:10.1038/nature17655 · Cited by 1,072
Single-cell spatial reconstruction reveals global division of labour in the mammalian liver
Halpern, K. B., Shenhav, R., Matcovitch-Natan, O., Tóth, B., Lemze, D., Golan, M., Massasa, E. E., Baydatch, S., Landen, S., Moor, A. E., et al. (2017) · Nature · doi:10.1038/nature21065 · Cited by 1,059
Spatial Transcriptomics and In Situ Sequencing to Study Alzheimer’s Disease
Chen, W.-T., Lu, A., Craessaerts, K., Pavie, B., Sala Frigerio, C., Corthout, N., Qian, X., Laláková, J., Kühnemund, M., Voytyuk, I., et al. (2020) · Cell · doi:10.1016/j.cell.2020.06.038 · Cited by 949
A Single-Cell Transcriptome Atlas of the Aging Drosophila Brain
Davie, K., Janssens, J., Koldere, D., De Waegeneer, M., Pech, U., Kreft, Ł., Aibar, S., Makhzami, S., Christiaens, V., Bravo González-Blas, C., et al. (2018) · Cell · doi:10.1016/j.cell.2018.05.057 · Cited by 840
The complex transcriptional landscape of the anucleate human platelet
Bray, P. F., McKenzie, S. E., Edelstein, L. C., Nagalla, S., Delgrosso, K., Ertel, A., Kupper, J., Jing, Y., Londin, E., Loher, P., et al. (2013) · BMC Genomics · doi:10.1186/1471-2164-14-1 · Cited by 802
Solovei, I., Wang, A. S., Thanisch, K., Schmidt, C. S., Krebs, S., Zwerger, M., Cohen, T. V., Devys, D., Foisner, R., Peichl, L., et al. (2013) · Cell · doi:10.1016/j.cell.2013.01.009 · Cited by 809
A Highly Conserved Program of Neuronal Microexons Is Misregulated in Autistic Brains
Irimia, M., Weatheritt, R. J., Ellis, J. D., Parikshak, N. N., Gonatopoulos-Pournatzis, T., Babor, M., Quesnel-Vallières, M., Tapial, J., Raj, B., O’Hanlon, D., et al. (2014) · Cell · doi:10.1016/j.cell.2014.11.035 · Cited by 693
Domestication and Divergence of Saccharomyces cerevisiae Beer Yeasts
Gallone, B., Steensels, J., Prahl, T., Soriaga, L., Saels, V., Herrera-Malaver, B., Merlevede, A., Roncoroni, M., Voordeckers, K., Miraglia, L., et al. (2016) · Cell · doi:10.1016/j.cell.2016.08.020 · Cited by 679
Human ADAR1 Prevents Endogenous RNA from Triggering Translational Shutdown
Chung, H., Calis, J. J. A., Wu, X., Sun, T., Yu, Y., Sarbanes, S. L., Dao Thi, V. L., Shilvock, A. R., Hoffmann, H.-H., Rosenberg, B. R., et al. (2018) · Cell · doi:10.1016/j.cell.2017.12.038 · Cited by 538
Physiological blood–brain transport is impaired with age by a shift in transcytosis
Yang, A. C., Stevens, M. Y., Chen, M. B., Lee, D. P., Stähli, D., Gate, D., Contrepois, K., Chen, W., Iram, T., Zhang, L., et al. (2020) · Nature · doi:10.1038/s41586-020-2453-z · Cited by 477
A Genome-wide CRISPR Screen in Primary Immune Cells to Dissect Regulatory Networks
Parnas, O., Jovanovic, M., Eisenhaure, T. M., Herbst, R. H., Dixit, A., Ye, C. J., Przybylski, D., Platt, R. J., Tirosh, I., Sanjana, N. E., et al. (2015) · Cell · doi:10.1016/j.cell.2015.06.059 · Cited by 440
Regulation of life span by the gut microbiota in the short-lived African turquoise killifish
Smith, P., Willemsen, D., Popkes, M., Metge, F., Gandiwa, E., Reichard, M., & Valenzano, D. R. (2017) · eLife · doi:10.7554/elife.27014 · Cited by 423
Population genomics reveal recent speciation and rapid evolutionary adaptation in polar bears
Liu, S., Lorenzen, E. D., Fumagalli, M., Li, B., Harris, K., Xiong, Z., Zhou, L., Korneliussen, T. S., Somel, M., Babbitt, C., et al. (2014) · Cell · doi:10.1016/j.cell.2014.03.054 · Cited by 411
A cellular and spatial map of the choroid plexus across brain ventricles and ages
Dani, N., Herbst, R. H., McCabe, C., Green, G. S., Kaiser, K., Head, J. P., Cui, J., Shipley, F. B., Jang, A., Dionne, D., et al. (2021) · Cell · doi:10.1016/j.cell.2021.04.003 · Cited by 388
Epigenetic silencing by SETDB1 suppresses tumour intrinsic immunogenicity
Griffin, G. K., Wu, J., Iracheta-Vellve, A., Patti, J. C., Hsu, J., Davis, T., Dele-Oni, D., Du, P. P., Halawi, A. G., Ishizuka, J. J., et al. (2021) · Nature · doi:10.1038/s41586-021-03520-4 · Cited by 370
Million-year-old DNA sheds light on the genomic history of mammoths
van der Valk, T., Pečnerová, P., Díez-del-Molino, D., Bergström, A., Oppenheimer, J., Hartmann, S., Xenikoudakis, G., Thomas, J. A., Dehasque, M., Sağlıcan, E., et al. (2021) · Nature · doi:10.1038/s41586-021-03224-9 · Cited by 345
Trade-off between transcriptome plasticity and genome evolution in cephalopods
Liscovitch-Brauer, N., Alon, S., Porath, H. T., Elstein, B., Unger, R., Ziv, T., Admon, A., Levanon, E. Y., Rosenthal, J. J. C., & Eisenberg, E. (2017) · Cell · doi:10.1016/j.cell.2017.03.025 · Cited by 356
A Synergistic Core for Human Brain Evolution and Cognition
Luppi, A. I., Mediano, P. A. M., Rosas, F. E., Holland, N., Fryer, T. D., O’Brien, J. T., Rowe, J. B., Menon, D. K., Bor, D., & Stamatakis, E. A. (2022) · Nature Neuroscience · doi:10.1038/s41593-022-01070-0 · Cited by 314
Martyn, G. E., Wienert, B., Yang, L., Shah, M., Norton, L. J., Burdach, J., Kurita, R., Nakamura, Y., Pearson, R. C. M., Funnell, A. P. W., et al. (2018) · Nature Genetics · doi:10.1038/s41588-018-0085-0 · Cited by 300
The EGFR-specific antibody cetuximab combined with chemotherapy triggers immunogenic cell death
Pozzi, C., Cuomo, A., Spadoni, I., Magni, E., Silvola, A., Conte, A., Sigismund, S., Ravenda, P. S., Bonaldi, T., Zampino, M. G., et al. (2016) · Nature Medicine · doi:10.1038/nm.4078 · Cited by 292
Novel Alzheimer risk genes determine the microglia response to amyloid-β but not to TAU pathology
Sierksma, A., Lu, A., Mancuso, R., Fattorelli, N., Thrupp, N., Salta, E., Zoco, J., Blum, D., Buée, L., De Strooper, B., et al. (2020) · EMBO Molecular Medicine · doi:10.15252/emmm.201910606 · Cited by 291
pH-gated succinate secretion regulates muscle remodeling in response to exercise
Reddy, A., Bozi, L. H. M., Yaghi, O. K., Mills, E. L., Xiao, H., Nicholson, H. E., Paschini, M., Paulo, J. A., Garrity, R., Laznik-Bogoslavski, D., et al. (2020) · Cell · doi:10.1016/j.cell.2020.08.039 · Cited by 279
Nrl knockdown by AAV-delivered CRISPR/Cas9 prevents retinal degeneration in mice
Yu, W., Mookherjee, S., Chaitankar, V., Hiriyanna, S., Kim, J.-W., Brooks, M., Ataeijannati, Y., Sun, X., Dong, L., Li, T., et al. (2017) · Nature Communications · doi:10.1038/ncomms14716 · Cited by 271
Deczkowska, A., Matcovitch-Natan, O., Tsitsou-Kampeli, A., Ben-Hamo, S., Dvir-Szternfeld, R., Spinrad, A., Singer, O., David, E., Winter, D. R., Smith, L. K., et al. (2017) · Nature Communications · doi:10.1038/s41467-017-00769-0 · Cited by 260
Normative brain size variation and brain shape diversity in humans
Reardon, P. K., Seidlitz, J., Vandekar, S., Liu, S., Patel, R., Park, M. T. M., Alexander-Bloch, A., Clasen, L. S., Blumenthal, J. D., Lalonde, F. M., et al. (2018) · Science · doi:10.1126/science.aar2578 · Cited by 255
Functional Genetic Variants Revealed by Massively Parallel Precise Genome Editing
Sharon, E., Chen, S.-A. A., Khosla, N. M., Smith, J. D., Pritchard, J. K., & Fraser, H. B. (2018) · Cell · doi:10.1016/j.cell.2018.08.057 · Cited by 225
IL-15, gluten and HLA-DQ8 drive tissue destruction in coeliac disease
Abadie, V., Kim, S. M., Lejeune, T., Palanski, B. A., Ernest, J. D., Tastet, O., Voisine, J., Discepolo, V., Marietta, E. V., Hawash, M. B. F., et al. (2020) · Nature · doi:10.1038/s41586-020-2003-8 · Cited by 231
Synaptic markers of cognitive decline in neurodegenerative diseases: a proteomic approach
Bereczki, E., Branca, R. M., Francis, P. T., Pereira, J. B., Baek, J.-H., Hortobágyi, T., Winblad, B., Ballard, C., Lehtiö, J., & Aarsland, D. (2018) · Brain · doi:10.1093/brain/awx352 · Cited by 220
Hernando-Herraez, I., Evano, B., Stubbs, T., Commere, P.-H., Jan Bonder, M., Clark, S., Andrews, S., Tajbakhsh, S., & Reik, W. (2019) · Nature Communications · doi:10.1038/s41467-019-12293-4 · Cited by 236
Hudson, N. J., Reverter, A., & Dalrymple, B. P. (2009) · PLoS Computational Biology · doi:10.1371/journal.pcbi.1000382 · Cited by 221
scSLAM-seq reveals core features of transcription dynamics in single cells
Erhard, F., Baptista, M. A. P., Krammer, T., Hennig, T., Lange, M., Arampatzi, P., Jürges, C. S., Theis, F. J., Saliba, A.-E., & Dölken, L. (2019) · Nature · doi:10.1038/s41586-019-1369-y · Cited by 233
i-cisTarget 2015 update: generalized cis-regulatory enrichment analysis in human, mouse and fly
Imrichová, H., Hulselmans, G., Kalender Atak, Z., Potier, D., & Aerts, S. (2015) · Nucleic Acids Research · doi:10.1093/nar/gkv395 · Cited by 202
A spatially resolved brain region- and cell type-specific isoform atlas of the postnatal mouse brain
Joglekar, A., Prjibelski, A., Mahfouz, A., Collier, P., Lin, S., Schlusche, A. K., Marrocco, J., Williams, S. R., Haase, B., Hayes, A., et al. (2021) · Nature Communications · doi:10.1038/s41467-020-20343-5 · Cited by 229
Cell-type-specific metabolic labeling of nascent proteomes in vivo
Alvarez-Castelao, B., Schanzenbächer, C. T., Hanus, C., Glock, C., tom Dieck, S., Dörrbaum, A. R., Bartnik, I., Nassim-Assir, B., Ciirdaeva, E., Mueller, A., et al. (2017) · Nature Biotechnology · doi:10.1038/nbt.4016 · Cited by 219
Transcriptome-wide Discovery of microRNA Binding Sites in Human Brain
Boudreau, R. L., Jiang, P., Gilmore, B. L., Spengler, R. M., Tirabassi, R., Nelson, J. A., Ross, C. A., Xing, Y., & Davidson, B. L. (2014) · Neuron · doi:10.1016/j.neuron.2013.10.062 · Cited by 217
Cohen, L. D., Zuchman, R., Sorokina, O., Müller, A., Dieterich, D. C., Armstrong, J. D., Ziv, T., & Ziv, N. E. (2013) · PLoS ONE · doi:10.1371/journal.pone.0063191 · Cited by 215
Watson, C. T., Roussos, P., Garg, P., Ho, D. J., Azam, N., Katsel, P. L., Haroutunian, V., & Sharp, A. J. (2016) · Genome Medicine · doi:10.1186/s13073-015-0258-8 · Cited by 201
Sex-chromosome dosage effects on gene expression in humans
Raznahan, A., Parikshak, N. N., Chandran, V., Blumenthal, J. D., Clasen, L. S., Alexander-Bloch, A. F., Zinn, A. R., Wangsa, D., Wise, J., Murphy, D. G. M., et al. (2018) · Proceedings of the National Academy of Sciences · doi:10.1073/pnas.1802889115 · Cited by 179
Identifying drug targets in tissues and whole blood with thermal-shift profiling
Perrin, J., Werner, T., Kurzawa, N., Rutkowska, A., Childs, D. D., Kalxdorf, M., Poeckel, D., Stonehouse, E., Strohmer, K., Heller, B., et al. (2020) · Nature Biotechnology · doi:10.1038/s41587-019-0388-4 · Cited by 178
The lung microenvironment shapes a dysfunctional response of alveolar macrophages in aging
McQuattie-Pimentel, A. C., Ren, Z., Joshi, N., Watanabe, S., Stoeger, T., Chi, M., Lu, Z., Sichizya, L., Aillon, R. P., Chen, C.-I., et al. (2021) · Journal of Clinical Investigation · doi:10.1172/jci140299 · Cited by 177
Kuijpers, M., Kochlamazashvili, G., Stumpf, A., Puchkov, D., Swaminathan, A., Lucht, M. T., Krause, E., Maritzen, T., Schmitz, D., & Haucke, V. (2021) · Neuron · doi:10.1016/j.neuron.2020.10.005 · Cited by 170
Gutowska-Owsiak, D., Schaupp, A. L., Salimi, M., Taylor, S., & Ogg, G. S. (2011) · British Journal of Dermatology · doi:10.1111/j.1365-2133.2011.10400.x · Cited by 168
Gibbons, J. G., Branco, A. T., Yu, S., & Lemos, B. (2014) · Nature Communications · doi:10.1038/ncomms5850 · Cited by 165
Reciprocal cellular cross-talk within the tumor microenvironment promotes oncolytic virus activity
Ilkow, C. S., Marguerie, M., Batenchuk, C., Mayer, J., Ben Neriah, D., Cousineau, S., Falls, T., Jennings, V. A., Boileau, M., Bellamy, D., et al. (2015) · Nature Medicine · doi:10.1038/nm.3848 · Cited by 165
Single-cell RNA sequencing of human liver reveals hepatic stellate cell heterogeneity
Payen, V. L., Lavergne, A., Alevra Sarika, N., Colonval, M., Karim, L., Deckers, M., Najimi, M., Coppieters, W., Charloteaux, B., Sokal, E. M., et al. (2021) · JHEP Reports · doi:10.1016/j.jhepr.2021.100278 · Cited by 160
Pan, W.-H., Sommer, F., Falk-Paulsen, M., Ulas, T., Best, L., Fazio, A., Kachroo, P., Luzius, A., Jentzsch, M., Rehman, A., et al. (2018) · Genome Medicine · doi:10.1186/s13073-018-0534-5 · Cited by 157
Sex-Specific Role for the Long Non-coding RNA LINC00473 in Depression
Issler, O., van der Zee, Y. Y., Ramakrishnan, A., Wang, J., Tan, C., Loh, Y.-H. E., Purushothaman, I., Walker, D. M., Lorsch, Z. S., Hamilton, P. J., et al. (2020) · Neuron · doi:10.1016/j.neuron.2020.03.023 · Cited by 156
Enzymatic dissociation induces transcriptional and proteotype bias in brain cell populations
Mattei, D., Ivanov, A., van Oostrum, M., Pantelyushin, S., Richetto, J., Mueller, F., Beffinger, M. M., Schellhammer, L., vom Berg, J., Wollscheid, B., et al. (2020) · doi:10.1101/2020.05.14.095422 · Cited by 143
Gonatopoulos-Pournatzis, T., Aregger, M., Brown, K. R., Farhangmehr, S., Braunschweig, U., Ward, H. N., Ha, K. C. H., Weiss, A., Billmann, M., Durbic, T., et al. (2020) · Nature Biotechnology · doi:10.1038/s41587-020-0437-z · Cited by 142
He, L., Pratt, H., Gao, M., Wei, F., Weng, Z., & Struhl, K. (2021) · eLife · doi:10.7554/elife.67312 · Cited by 122
Metformin targets mitochondrial electron transport to reduce air-pollution-induced thrombosis
Soberanes, S., Misharin, A. V., Jairaman, A., Morales-Nebreda, L., McQuattie-Pimentel, A. C., Cho, T., Hamanaka, R. B., Meliton, A. Y., Reyfman, P. A., Walter, J. M., et al. (2019) · Cell Metabolism · doi:10.1016/j.cmet.2018.09.019 · Cited by 131
Stable Polycomb-dependent transgenerational inheritance of chromatin states in Drosophila
Ciabrelli, F., Comoglio, F., Fellous, S., Bonev, B., Ninova, M., Szabo, Q., Xuéreb, A., Klopp, C., Aravin, A., Paro, R., et al. (2017) · Nature Genetics · doi:10.1038/ng.3848 · Cited by 129
Dileep, V., Boix, C. A., Mathys, H., Marco, A., Welch, G. M., Meharena, H. S., Loon, A., Jeloka, R., Peng, Z., Bennett, D. A., et al. (2023) · Cell · doi:10.1016/j.cell.2023.08.038 · Cited by 130
Li, C., Virgilio, M. C., Collins, K. L., & Welch, J. D. (2023) · Nature Biotechnology · doi:10.1038/s41587-022-01476-y · Cited by 130
A quantitative framework for characterizing the evolutionary history of mammalian gene expression
Chen, J., Swofford, R., Johnson, J., Cummings, B. B., Rogel, N., Lindblad-Toh, K., Haerty, W., Palma, F. D., & Regev, A. (2019) · Genome Research · doi:10.1101/gr.237636.118 · Cited by 128
Systems-based proteomics to resolve the biology of Alzheimer’s disease beyond amyloid and tau
Rayaprolu, S., Higginbotham, L., Bagchi, P., Watson, C. M., Zhang, T., Levey, A. I., Rangaraju, S., & Seyfried, N. T. (2021) · Neuropsychopharmacology · doi:10.1038/s41386-020-00840-3 · Cited by 118
Mayor-Ruiz, C., Jaeger, M. G., Bauer, S., Brand, M., Sin, C., Hanzl, A., Mueller, A. C., Menche, J., & Winter, G. E. (2019) · Molecular Cell · doi:10.1016/j.molcel.2019.07.013 · Cited by 119
Gut microbiota–driven brain Aβ amyloidosis in mice requires microglia
Dodiya, H. B., Lutz, H. L., Weigle, I. Q., Patel, P., Michalkiewicz, J., Roman-Santiago, C. J., Zhang, C. M., Liang, Y., Srinath, A., Zhang, X., et al. (2022) · Journal of Experimental Medicine · doi:10.1084/jem.20200895 · Cited by 120
Hippo Signaling Influences HNF4A and FOXA2 Enhancer Switching during Hepatocyte Differentiation
Alder, O., Cullum, R., Lee, S., Kan, A. C., Wei, W., Yi, Y., Garside, V. C., Bilenky, M., Griffith, M., Morrissy, A. S., et al. (2014) · Cell Reports · doi:10.1016/j.celrep.2014.08.046 · Cited by 113
Liscovitch-Brauer, N., Montalbano, A., Deng, J., Méndez-Mancilla, A., Wessels, H.-H., Moss, N. G., Kung, C.-Y., Sookdeo, A., Guo, X., Geller, E., et al. (2021) · Nature Biotechnology · doi:10.1038/s41587-021-00902-x · Cited by 107
Genetic control of the human brain proteome
Robins, C., Wingo, A. P., Fan, W., Duong, D. M., Meigs, J., Gerasimov, E. S., Dammer, E. B., Cutler, D. J., Jager, P. L. D., Bennett, D. A., et al. (2019) · doi:10.1101/816652 · Cited by 104
Down-syndrome-induced senescence disrupts the nuclear architecture of neural progenitors
Meharena, H. S., Marco, A., Dileep, V., Lockshin, E. R., Akatsu, G. Y., Mullahoo, J., Watson, L. A., Ko, T., Guerin, L. N., Abdurrob, F., et al. (2022) · Cell Stem Cell · doi:10.1016/j.stem.2021.12.002 · Cited by 92
Taliaz, D., Spinrad, A., Barzilay, R., Barnett-Itzhaki, Z., Averbuch, D., Teltsh, O., Schurr, R., Darki-Morag, S., & Lerer, B. (2021) · Translational Psychiatry · doi:10.1038/s41398-021-01488-3 · Cited by 93
Hoffman, Y., Bublik, D. R., P. Ugalde, A., Elkon, R., Biniashvili, T., Agami, R., Oren, M., & Pilpel, Y. (2016) · PLOS Genetics · doi:10.1371/journal.pgen.1005879 · Cited by 90
Region-Specific Proteome Changes of the Intestinal Epithelium during Aging and Dietary Restriction
Gebert, N., Cheng, C.-W., Kirkpatrick, J. M., Di Fraia, D., Yun, J., Schädel, P., Pace, S., Garside, G. B., Werz, O., Rudolph, K. L., et al. (2020) · Cell Reports · doi:10.1016/j.celrep.2020.107565 · Cited by 88
Growth of the Developing Cerebral Cortex Is Controlled by MicroRNA-7 through the p53 Pathway
Pollock, A., Bian, S., Zhang, C., Chen, Z., & Sun, T. (2014) · Cell Reports · doi:10.1016/j.celrep.2014.04.003 · Cited by 88
Lim, R. G., Al-Dalahmah, O., Wu, J., Gold, M. P., Reidling, J. C., Tang, G., Adam, M., Dansu, D. K., Park, H.-J., Casaccia, P., et al. (2022) · Nature Communications · doi:10.1038/s41467-022-35388-x · Cited by 84
Compromising the 19S proteasome complex protects cells from reduced flux through the proteasome
Tsvetkov, P., Mendillo, M. L., Zhao, J., Carette, J. E., Merrill, P. H., Cikes, D., Varadarajan, M., van Diemen, F. R., Penninger, J. M., Goldberg, A. L., et al. (2015) · eLife · doi:10.7554/elife.08467 · Cited by 83
Genetic evidence for common pathways in human age‐related diseases
Johnson, S. C., Dong, X., Vijg, J., & Suh, Y. (2015) · Aging Cell · doi:10.1111/acel.12362 · Cited by 78
Sharma, A., Jamil, M. A., Nuesgen, N., Schreiner, F., Priebe, L., Hoffmann, P., Herns, S., Nöthen, M. M., Fröhlich, H., Oldenburg, J., et al. (2015) · Clinical Epigenetics · doi:10.1186/s13148-015-0112-2 · Cited by 81
Model‐based detection and analysis of introgressed Neanderthal ancestry in modern humans
Steinrücken, M., Spence, J. P., Kamm, J. A., Wieczorek, E., & Song, Y. S. (2018) · Molecular Ecology · doi:10.1111/mec.14565 · Cited by 73
Santana-Codina, N., Chandhoke, A. S., Yu, Q., Małachowska, B., Kuljanin, M., Gikandi, A., Stańczak, M., Gableske, S., Jedrychowski, M. P., Scott, D. A., et al. (2020) · Cell Reports · doi:10.1016/j.celrep.2020.03.021 · Cited by 77
Ziats, M. N., & Rennert, O. M. (2011) · PLoS ONE · doi:10.1371/journal.pone.0024691 · Cited by 75
Mapping the multiscale structure of biological systems
Schaffer, L. V., & Ideker, T. (2021) · Cell Systems · doi:10.1016/j.cels.2021.05.012 · Cited by 75
Delbridge, A. R. D., Huh, D., Brickelmaier, M., Burns, J. C., Roberts, C., Challa, R., Raymond, N., Cullen, P., Carlile, T. M., Ennis, K. A., et al. (2020) · Frontiers in Cellular Neuroscience · doi:10.3389/fncel.2020.592005 · Cited by 72
Pacifico, R., & Davis, R. L. (2017) · Molecular Psychiatry · doi:10.1038/mp.2016.94 · Cited by 61
Species comparison of liver proteomes reveals links to naked mole-rat longevity and human aging
Heinze, I., Bens, M., Calzia, E., Holtze, S., Dakhovnik, O., Sahm, A., Kirkpatrick, J. M., Szafranski, K., Romanov, N., Sama, S. N., et al. (2018) · BMC Biology · doi:10.1186/s12915-018-0547-y · Cited by 65
Marín-Prida, J., Pavón-Fuentes, N., Llópiz-Arzuaga, A., Fernández-Massó, J. R., Delgado-Roche, L., Mendoza-Marí, Y., Santana, S. P., Cruz-Ramírez, A., Valenzuela-Silva, C., Nazábal-Gálvez, M., et al. (2013) · Toxicology and Applied Pharmacology · doi:10.1016/j.taap.2013.05.021 · Cited by 61
Małecki, J. M., Odonohue, M.-F., Kim, Y., Jakobsson, M. E., Gessa, L., Pinto, R., Wu, J., Davydova, E., Moen, A., Olsen, J. V., et al. (2021) · Nucleic Acids Research · doi:10.1093/nar/gkab088 · Cited by 59
Gale, A. N., Sakhawala, R. M., Levitan, A., Sharan, R., Berman, J., Timp, W., & Cunningham, K. W. (2020) · G3 Genes|Genomes|Genetics · doi:10.1534/g3.120.401595 · Cited by 56
Yu, D.-H., Ware, C., Waterland, R. A., Zhang, J., Chen, M.-H., Gadkari, M., Kunde-Ramamoorthy, G., Nosavanh, L. M., & Shen, L. (2013) · Molecular and Cellular Biology · doi:10.1128/mcb.01124-12 · Cited by 48
Quantitative proteomics of synaptosome S‐nitrosylation in Alzheimer’s disease
Wijasa, T. S., Sylvester, M., Brocke‐Ahmadinejad, N., Schwartz, S., Santarelli, F., Gieselmann, V., Klockgether, T., Brosseron, F., & Heneka, M. T. (2020) · Journal of Neurochemistry · doi:10.1111/jnc.14870 · Cited by 41
Metadata
- Authors
- Eden, E., Navon, R., Steinfeld, I., Lipson, D., & Yakhini, Z.
- Affiliations
- Weizmann Institute of Science (IL)
- Tel Aviv University (IL)
- Technion – Israel Institute of Technology (IL)
- Corresponding author
- Eden, Eran
- Navon, Roy
- Venue
- BMC Bioinformatics
- Published
- 2009-02-03
- Volume
- 10
- Issue
- 1
- Pages
- 48-48
- ISSN
- 1471-2105 (ISSN-L)
- PMC
- PMC2644678
- OpenAlex
- W2038963685
- Cited by
- 3,356
- References
- 20
- Citations by year
- 2026: 64 · 2025: 135 · 2024: 169 · 2023: 213 · 2022: 274 · 2021: 409 · 2020: 305 · 2019: 319 · 2018: 300 · 2017: 251 · 2016: 242 · 2015: 217 · 2014: 168 · 2013: 138 · 2012: 67
- FWCI
- 20.15
- Type
- journal article
- Language
- en
- Open access
- gold
- doi.org
- Licence
- Locations
- BMC Bioinformatics (publishedVersion, cc-by)
- PubMed Central (publishedVersion, cc-by)
- PubMed (publishedVersion)
- DOAJ (DOAJ: Directory of Open Access Journals) (submittedVersion)
- Funders
- European Commission
- Topics
- Life Sciences › Biochemistry, Genetics and Molecular Biology › Molecular Biology › Bioinformatics and Genomic Networks
- Life Sciences › Biochemistry, Genetics and Molecular Biology › Molecular Biology › Genomics and Phylogenetic Studies
- Health Sciences › Medicine › Health Informatics › Biomedical Text Mining and Ontologies
- Keywords
- gorillas, gene ontology enrichment, exact p-values, web-based bioinformatics tool, differential gene expression
- MeSH terms
- Algorithms, Animals, Data Interpretation, Statistical, Genes, Humans, Models, Genetic, Terminology as Topic, Software, User-Computer Interface, Yeasts, Models, Statistical, Information Storage and Retrieval, Arabidopsis, Computational Biology, Internet, Gene Expression Profiling, Genomics, Databases, Genetic
About these checks
Registry, retraction, Cites and statistics results are computed, not judged, with one exception: a printed reference that no index lists is read once by a model before it counts as a citation error. Claims are extracted by a model and kept only when their quote appears verbatim in the text; each cited source is then checked, with a model’s help, for whether it says what the claim relies on. Those verdicts can be wrong — read the claim’s quote and the cited source before relying on one.
Statistics and arithmetic are recomputed, not judged.
Confidence bands are shown only for fields calibrated on our annotated test set. None is calibrated yet, so no band is shown.
What counts as a claim ›How we measure confidence ›How we check this ›
Are you an author, or do you see a problem with this page? Request a review
