

The DOI matches its Crossref record; 209 of the 209 references it cites were found in a registry or an index.
ApoE expression across the CNS: Who, What, Where, When, and How (much)?
Open accessAbstract
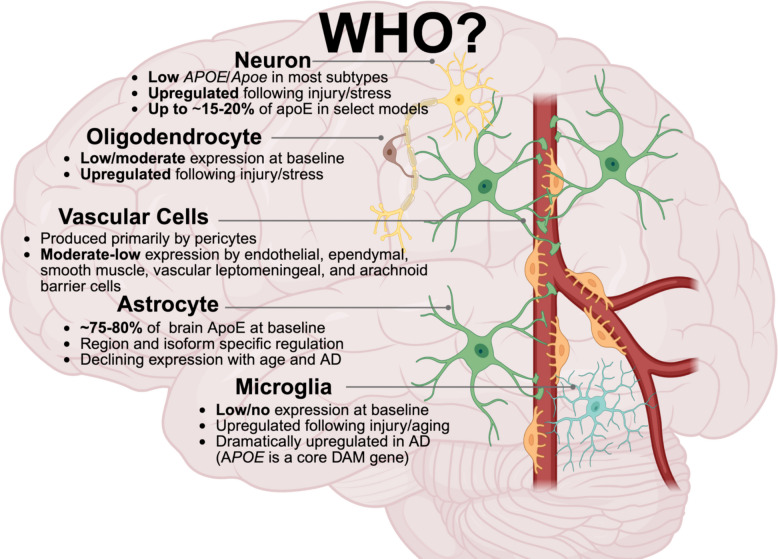
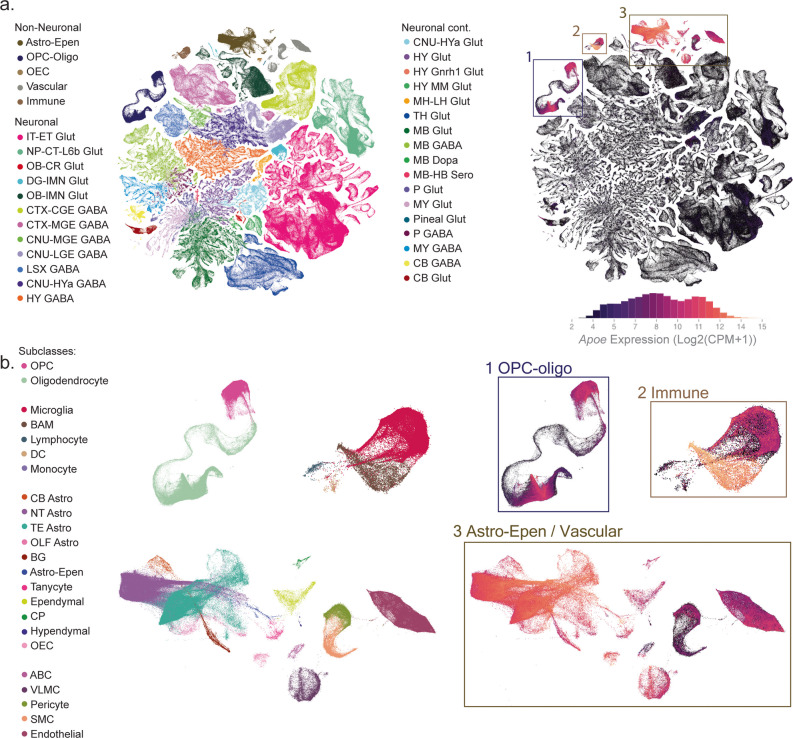
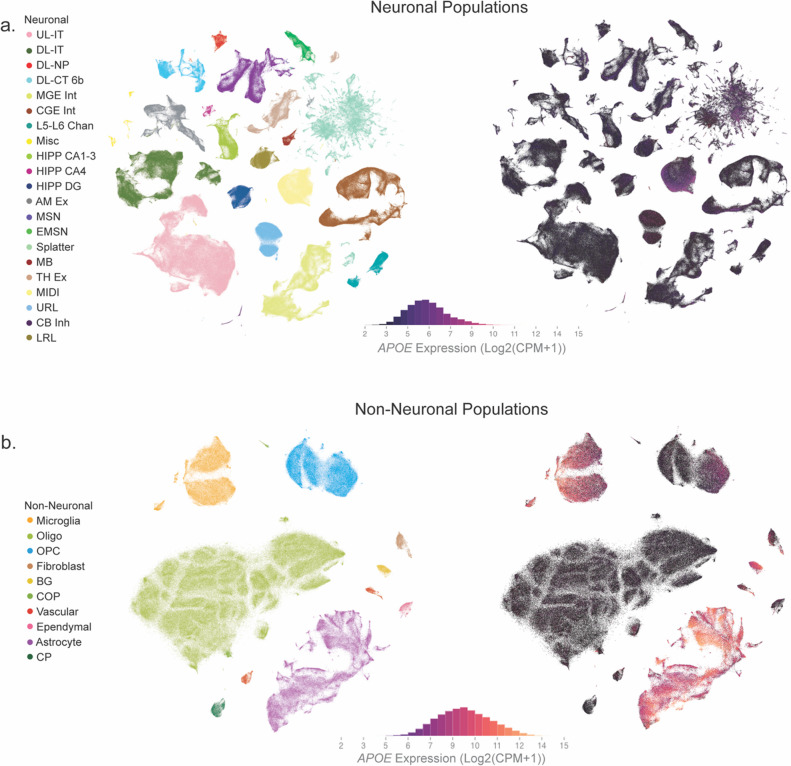
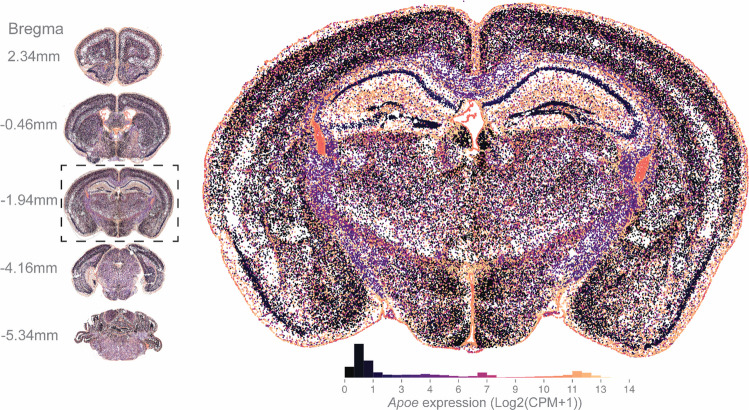
Apolipoprotein E ( APOE ) is the strongest genetic risk factor for late-onset Alzheimer’s disease (AD) and encodes a major lipid transporter in the central nervous system (CNS). Although apoE has been studied extensively, fundamental questions remain regarding its expression across the CNS. For example, which CNS cell types express APOE ? Where is APOE expression enriched across brain regions? When is APOE dynamically regulated – across development, aging, injury, and neurodegeneration? How much apoE is produced at the mRNA and protein level – particularly across the common E2, E3, and E4 isoforms? Here, we synthesize transcriptomic, spatial, biochemical, and genetic evidence to provide an organized framework for the “who, what, where, when, and how (much)” of CNS APOE /apoE. By assessing large-scale single-cell datasets along with in vivo and cell-type–specific genetic studies, we highlight that astrocytes are the predominant source of CNS apoE at baseline, while microglia, oligodendrocyte-lineage cells, vascular-associated populations, and border-interface macrophages exhibit context-dependent induction that is strongly influenced by aging, injury, and AD-related pathology. We also evaluate unresolved discrepancies, such as the extent of neuronal APOE expression and its contribution to total brain apoE, and describe how – across modalities – apoE abundance often follows an isoform-dependent hierarchy (typically E2 > E3 > E4 at the protein level) while transcript–protein discordance and model-specific effects underscore substantial post-transcriptional and contextual regulation. Finally, we discuss how clarifying spatiotemporal, cell-specific, and isoform-dependent apoE expression will enable better informed and more precise apoE-targeted therapeutic strategies.
Overview
The claims and statistics of this paper haven’t been checked yet.
Run the check — free, no account needed. It reads the open-access text and checks the sources it cites.
Integrity signals
Registry
Cites
Statistics
Figures
Verification
Claims the paper makes
The claims and statistics of this paper haven’t been checked yet.
Run the check — free, no account needed. It reads the open-access text and checks the sources it cites.
Self-check
Percentages, sums and reported differences re-computed from the paper’s own numbers.
The self-check needs the paper’s full text.
Citations
Cites
Corder, E. H., Saunders, A. M., Strittmatter, W. J., Schmechel, D. E., Gaskell, P. C., Small, G. W., Roses, A. D., Haines, J. L., & Pericak-Vance, M. A. (1993) · Science · doi:10.1126/science.8346443 · Cited by 9,429
A Unique Microglia Type Associated with Restricting Development of Alzheimer’s Disease
Keren-Shaul, H., Spinrad, A., Weiner, A., Matcovitch-Natan, O., Dvir-Szternfeld, R., Ulland, T. K., David, E., Baruch, K., Lara-Astaiso, D., Toth, B., et al. (2017) · Cell · doi:10.1016/j.cell.2017.05.018 · Cited by 5,493 · cited 4×
“In fact, APOE is a core gene that drives the disease associated microglia (DAM) phenotype observed in AD ( discussed further in the “When” section ) [39, 77, 78].”
InfluentialZhang, Y., Chen, K., Sloan, S. A., Bennett, M. L., Scholze, A. R., O'Keeffe, S., Phatnani, H. P., Guarnieri, P., Caneda, C., Ruderisch, N., et al. (2014) · The Journal of Neuroscience · doi:10.1523/jneurosci.1860-14.2014 · Cited by 4,875 · cited 1×
“Numerous in vivo studies converge on the estimate that 75%–80% of apoE in the brain can be attributed to astrocytic production [12, 26, 28, 29, 31–35].”
Strittmatter, W. J., Saunders, A. M., Schmechel, D., Pericak-Vance, M., Enghild, J., Salvesen, G. S., & Roses, A. D. (1993) · Proceedings of the National Academy of Sciences · doi:10.1073/pnas.90.5.1977 · Cited by 4,268
Association of apolipoprotein E allele ϵ4 with late‐onset familial and sporadic Alzheimer's disease
Saunders, A. M., Strittmatter, W. J., Schmechel, D., St. George-Hyslop, P. H., Pericak-Vance, M. A., Joo, S. H., Rosi, B. L., Gusella, J. F., Crapper-MacLachlan, D. R., Alberts, M. J., et al. (1993) · Neurology · doi:10.1212/wnl.43.8.1467 · Cited by 3,786
Krasemann, S., Madore, C., Cialic, R., Baufeld, C., Calcagno, N., El Fatimy, R., Beckers, L., O’Loughlin, E., Xu, Y., Fanek, Z., et al. (2017) · Immunity · doi:10.1016/j.immuni.2017.08.008 · Cited by 2,979
Single-cell transcriptomic analysis of Alzheimer’s disease
Mathys, H., Davila-Velderrain, J., Peng, Z., Gao, F., Mohammadi, S., Young, J. Z., Menon, M., He, L., Abdurrob, F., Jiang, X., et al. (2019) · Nature · doi:10.1038/s41586-019-1195-2 · Cited by 2,568
Zhang, Y., Sloan, S. A., Clarke, L. E., Caneda, C., Plaza, C. A., Blumenthal, P. D., Vogel, H., Steinberg, G. K., Edwards, M. S. B., Li, G., et al. (2016) · Neuron · doi:10.1016/j.neuron.2015.11.013 · Cited by 2,295
Protective effect of apolipoprotein E type 2 allele for late onset Alzheimer disease
Corder, E. H., Saunders, A. M., Risch, N. J., Strittmatter, W. J., Schmechel, D. E., Gaskell, P. C., Rimmler, J. B., Locke, P. A., Conneally, P. M., Schmader, K. E., et al. (1994) · Nature Genetics · doi:10.1038/ng0694-180 · Cited by 1,920
A high-resolution transcriptomic and spatial atlas of cell types in the whole mouse brain
Yao, Z., van Velthoven, C. T. J., Kunst, M., Zhang, M., McMillen, D., Lee, C., Jung, W., Goldy, J., Abdelhak, A., Aitken, M., et al. (2023) · Nature · doi:10.1038/s41586-023-06812-z · Cited by 1,203 · cited 6×
“2a-b) [36–38] .”
InfluentialVan Hove, H., Martens, L., Scheyltjens, I., De Vlaminck, K., Pombo Antunes, A. R., De Prijck, S., Vandamme, N., De Schepper, S., Van Isterdael, G., Scott, C. L., et al. (2019) · Nature Neuroscience · doi:10.1038/s41593-019-0393-4 · Cited by 1,074
Disease-associated astrocytes in Alzheimer’s disease and aging
Habib, N., McCabe, C., Medina, S., Varshavsky, M., Kitsberg, D., Dvir-Szternfeld, R., Green, G., Dionne, D., Nguyen, L., Marshall, J. L., et al. (2020) · Nature Neuroscience · doi:10.1038/s41593-020-0624-8 · Cited by 1,009
Grubman, A., Chew, G., Ouyang, J. F., Sun, G., Choo, X. Y., McLean, C., Simmons, R. K., Buckberry, S., Vargas-Landin, D. B., Poppe, D., et al. (2019) · Nature Neuroscience · doi:10.1038/s41593-019-0539-4 · Cited by 956
Spatial Transcriptomics and In Situ Sequencing to Study Alzheimer’s Disease
Chen, W.-T., Lu, A., Craessaerts, K., Pavie, B., Sala Frigerio, C., Corthout, N., Qian, X., Laláková, J., Kühnemund, M., Voytyuk, I., et al. (2020) · Cell · doi:10.1016/j.cell.2020.06.038 · Cited by 949 · cited 1×
“…studies report apoE-isoform-dependent alterations in oligodendrocyte populations and function in AD and related neurodegenerative diseases, defining how oligo-dendrocyte apoE/ APOE is regulated across cell states, insults, and apoE isoforms remains an important gap in the field [94, 98, 101–105].”
Transcriptomic diversity of cell types across the adult human brain
Siletti, K., Hodge, R., Mossi Albiach, A., Lee, K. W., Ding, S.-L., Hu, L., Lönnerberg, P., Bakken, T., Casper, T., Clark, M., et al. (2023) · Science · doi:10.1126/science.add7046 · Cited by 832
Apolipoprotein E: Structure and function in lipid metabolism, neurobiology, and Alzheimer’s diseases
Huang, Y., & Mahley, R. W. (2014) · Neurobiology of Disease · doi:10.1016/j.nbd.2014.08.025 · Cited by 829
Boyles, J. K., Pitas, R. E., Wilson, E., Mahley, R. W., & Taylor, J. M. (1985) · Journal of Clinical Investigation · doi:10.1172/jci112130 · Cited by 829
A human brain vascular atlas reveals diverse mediators of Alzheimer’s risk
Yang, A. C., Vest, R. T., Kern, F., Lee, D. P., Agam, M., Maat, C. A., Losada, P. M., Chen, M. B., Schaum, N., Khoury, N., et al. (2022) · Nature · doi:10.1038/s41586-021-04369-3 · Cited by 797
Apolipoprotein E and Apolipoprotein E Receptors: Normal Biology and Roles in Alzheimer Disease
Holtzman, D. M., Herz, J., & Bu, G. (2012) · Cold Spring Harbor Perspectives in Medicine · doi:10.1101/cshperspect.a006312 · Cited by 782
Astrocytes synthesize apolipoprotein E and metabolize apolipoprotein E-containing lipoproteins
Pitas, R. E., Boyles, J. K., Lee, S. H., Foss, D., & Mahley, R. W. (1987) · Biochimica et Biophysica Acta (BBA) - Lipids and Lipid Metabolism · doi:10.1016/0005-2760(87)90295-5 · Cited by 693
Arboleda-Velasquez, J. F., Lopera, F., O’Hare, M., Delgado-Tirado, S., Marino, C., Chmielewska, N., Saez-Torres, K. L., Amarnani, D., Schultz, A. P., Sperling, R. A., et al. (2019) · Nature Medicine · doi:10.1038/s41591-019-0611-3 · Cited by 598
Defective cholesterol clearance limits remyelination in the aged central nervous system
Cantuti-Castelvetri, L., Fitzner, D., Bosch-Queralt, M., Weil, M.-T., Su, M., Sen, P., Ruhwedel, T., Mitkovski, M., Trendelenburg, G., Lütjohann, D., et al. (2018) · Science · doi:10.1126/science.aan4183 · Cited by 586
Loss of TREM2 function increases amyloid seeding but reduces plaque-associated ApoE
Parhizkar, S., Arzberger, T., Brendel, M., Kleinberger, G., Deussing, M., Focke, C., Nuscher, B., Xiong, M., Ghasemigharagoz, A., Katzmarski, N., et al. (2019) · Nature Neuroscience · doi:10.1038/s41593-018-0296-9 · Cited by 555
APOE4/4 is linked to damaging lipid droplets in Alzheimer’s disease microglia
Haney, M. S., Pálovics, R., Munson, C. N., Long, C., Johansson, P. K., Yip, O., Dong, W., Rawat, E., West, E., Schlachetzki, J. C. M., et al. (2024) · Nature · doi:10.1038/s41586-024-07185-7 · Cited by 536 · cited 1×
“These isoform-specific differences - particularly the reduced phagocytic capacity and diminished lipid-efflux capacity associated with E4 - contribute to increased lipid droplet accumulation and impaired clearance of amyloid-β and cellular debris relative to E3 or E2 [83, 94, 205].”
Xu, Q., Bernardo, A., Walker, D., Kanegawa, T., Mahley, R. W., & Huang, Y. (2006) · The Journal of Neuroscience · doi:10.1523/jneurosci.5476-05.2006 · Cited by 524
APOE4 impairs myelination via cholesterol dysregulation in oligodendrocytes
Blanchard, J. W., Akay, L. A., Davila-Velderrain, J., von Maydell, D., Mathys, H., Davidson, S. M., Effenberger, A., Chen, C.-Y., Maner-Smith, K., Hajjar, I., et al. (2022) · Nature · doi:10.1038/s41586-022-05439-w · Cited by 496 · cited 4×
“Isoform-specific patterns of apoE within oligodendrocytes remain underexplored, although available data suggests that E3 and E4 oligodendrocytes express comparable apoE levels that decline with aging regardless of genotype [39, 101].”
InfluentialBayraktar, O. A., Bartels, T., Holmqvist, S., Kleshchevnikov, V., Martirosyan, A., Polioudakis, D., Ben Haim, L., Young, A. M. H., Batiuk, M. Y., Prakash, K., et al. (2020) · Nature Neuroscience · doi:10.1038/s41593-020-0602-1 · Cited by 489
White matter aging drives microglial diversity
Safaiyan, S., Besson-Girard, S., Kaya, T., Cantuti-Castelvetri, L., Liu, L., Ji, H., Schifferer, M., Gouna, G., Usifo, F., Kannaiyan, N., et al. (2021) · Neuron · doi:10.1016/j.neuron.2021.01.027 · Cited by 477
Reiman, E. M., Arboleda-Velasquez, J. F., Quiroz, Y. T., Huentelman, M. J., Beach, T. G., Caselli, R. J., Chen, Y., Su, Y., Myers, A. J., Hardy, J., et al. (2020) · Nature Communications · doi:10.1038/s41467-019-14279-8 · Cited by 473
Age-Specific Epigenetic Drift in Late-Onset Alzheimer's Disease
Wang, S.-C., Oelze, B., & Schumacher, A. (2008) · PLoS ONE · doi:10.1371/journal.pone.0002698 · Cited by 471
ApoE4 Accelerates Early Seeding of Amyloid Pathology
Liu, C.-C., Zhao, N., Fu, Y., Wang, N., Linares, C., Tsai, C.-W., & Bu, G. (2017) · Neuron · doi:10.1016/j.neuron.2017.11.013 · Cited by 451
ApoE4: an emerging therapeutic target for Alzheimer’s disease
Safieh, M., Korczyn, A. D., & Michaelson, D. M. (2019) · BMC Medicine · doi:10.1186/s12916-019-1299-4 · Cited by 449
Microglia drive APOE-dependent neurodegeneration in a tauopathy mouse model
Shi, Y., Manis, M., Long, J., Wang, K., Sullivan, P. M., Remolina Serrano, J., Hoyle, R., & Holtzman, D. M. (2019) · Journal of Experimental Medicine · doi:10.1084/jem.20190980 · Cited by 448
Wang, C., Najm, R., Xu, Q., Jeong, D.-E., Walker, D., Balestra, M. E., Yoon, S. Y., Yuan, H., Li, G., Miller, Z. A., et al. (2018) · Nature Medicine · doi:10.1038/s41591-018-0004-z · Cited by 428
Alzheimer’s Patient Microglia Exhibit Enhanced Aging and Unique Transcriptional Activation
Srinivasan, K., Friedman, B. A., Etxeberria, A., Huntley, M. A., van der Brug, M. P., Foreman, O., Paw, J. S., Modrusan, Z., Beach, T. G., Serrano, G. E., et al. (2020) · Cell Reports · doi:10.1016/j.celrep.2020.107843 · Cited by 427
Cholesterol and matrisome pathways dysregulated in astrocytes and microglia
TCW, J., Qian, L., Pipalia, N. H., Chao, M. J., Liang, S. A., Shi, Y., Jain, B. R., Bertelsen, S. E., Kapoor, M., Marcora, E., et al. (2022) · Cell · doi:10.1016/j.cell.2022.05.017 · Cited by 411
ApoE4 Impairs Neuron-Astrocyte Coupling of Fatty Acid Metabolism
Qi, G., Mi, Y., Shi, X., Gu, H., Brinton, R. D., & Yin, F. (2021) · Cell Reports · doi:10.1016/j.celrep.2020.108572 · Cited by 379
Impact of Apolipoprotein E (ApoE) Polymorphism on Brain ApoE Levels
Riddell, D. R., Zhou, H., Atchison, K., Warwick, H. K., Atkinson, P. J., Jefferson, J., Xu, L., Aschmies, S., Kirksey, Y., Hu, Y., et al. (2008) · The Journal of Neuroscience · doi:10.1523/jneurosci.1972-08.2008 · Cited by 346
Wang, C., Xiong, M., Gratuze, M., Bao, X., Shi, Y., Andhey, P. S., Manis, M., Schroeder, C., Yin, Z., Madore, C., et al. (2021) · Neuron · doi:10.1016/j.neuron.2021.03.024 · Cited by 334
Genotyping and sequence analysis of apolipoprotein E isoforms*1
EMI, M. (1988) · Genomics · doi:10.1016/0888-7543(88)90130-9 · Cited by 301
Apolipoprotein E: Structural Insights and Links to Alzheimer Disease Pathogenesis
Chen, Y., Strickland, M. R., Soranno, A., & Holtzman, D. M. (2021) · Neuron · doi:10.1016/j.neuron.2020.10.008 · Cited by 298
Li, G., Bien-Ly, N., Andrews-Zwilling, Y., Xu, Q., Bernardo, A., Ring, K., Halabisky, B., Deng, C., Mahley, R. W., & Huang, Y. (2009) · Cell Stem Cell · doi:10.1016/j.stem.2009.10.015 · Cited by 288
Apolipoprotein E in lipid metabolism and neurodegenerative disease
Yang, L. G., March, Z. M., Stephenson, R. A., & Narayan, P. S. (2023) · Trends in Endocrinology & Metabolism · doi:10.1016/j.tem.2023.05.002 · Cited by 286
Blanchard, J. W., Bula, M., Davila-Velderrain, J., Akay, L. A., Zhu, L., Frank, A., Victor, M. B., Bonner, J. M., Mathys, H., Lin, Y.-T., et al. (2020) · Nature Medicine · doi:10.1038/s41591-020-0886-4 · Cited by 283
Ma, Q., Zhao, Z., Sagare, A. P., Wu, Y., Wang, M., Owens, N. C., Verghese, P. B., Herz, J., Holtzman, D. M., & Zlokovic, B. V. (2018) · Molecular Neurodegeneration · doi:10.1186/s13024-018-0286-0 · Cited by 281
Fernández-Calle, R., Konings, S. C., Frontiñán-Rubio, J., García-Revilla, J., Camprubí-Ferrer, L., Svensson, M., Martinson, I., Boza-Serrano, A., Venero, J. L., Nielsen, H. M., et al. (2022) · Molecular Neurodegeneration · doi:10.1186/s13024-022-00566-4 · Cited by 278
Achariyar, T. M., Li, B., Peng, W., Verghese, P. B., Shi, Y., McConnell, E., Benraiss, A., Kasper, T., Song, W., Takano, T., et al. (2016) · Molecular Neurodegeneration · doi:10.1186/s13024-016-0138-8 · Cited by 256
A shared disease-associated oligodendrocyte signature among multiple CNS pathologies
Kenigsbuch, M., Bost, P., Halevi, S., Chang, Y., Chen, S., Ma, Q., Hajbi, R., Schwikowski, B., Bodenmiller, B., Fu, H., et al. (2022) · Nature Neuroscience · doi:10.1038/s41593-022-01104-7 · Cited by 233
APOE ε4/ε4 diminishes neurotrophic function of human iPSC-derived astrocytes
Zhao, J., Davis, M. D., Martens, Y. A., Shinohara, M., Graff-Radford, N. R., Younkin, S. G., Wszolek, Z. K., Kanekiyo, T., & Bu, G. (2017) · Human Molecular Genetics · doi:10.1093/hmg/ddx155 · Cited by 221
The Choroid Plexus and Cerebrospinal Fluid: Emerging Roles in Development, Disease, and Therapy
Lehtinen, M. K., Bjornsson, C. S., Dymecki, S. M., Gilbertson, R. J., Holtzman, D. M., & Monuki, E. S. (2013) · Journal of Neuroscience · doi:10.1523/jneurosci.3258-13.2013 · Cited by 214
LRP1 in Brain Vascular Smooth Muscle Cells Mediates Local Clearance of Alzheimer's Amyloid-β
Kanekiyo, T., Liu, C.-C., Shinohara, M., Li, J., & Bu, G. (2012) · The Journal of Neuroscience · doi:10.1523/jneurosci.3987-12.2012 · Cited by 211
Bertrand, P., Poirier, J., Oda, T., Finch, C. E., & Pasinetti, G. M. (1995) · Molecular Brain Research · doi:10.1016/0169-328x(95)00097-c · Cited by 210
Lin, Y.-T., Seo, J., Gao, F., Feldman, H. M., Wen, H.-L., Penney, J., Cam, H. P., Gjoneska, E., Raja, W. K., Cheng, J., et al. (2018) · Neuron · doi:10.1016/j.neuron.2018.06.011 · Cited by 210
Age-Dependent Effects of apoE Reduction Using Antisense Oligonucleotides in a Model of β-amyloidosis
Huynh, T.-P. V., Liao, F., Francis, C. M., Robinson, G. O., Serrano, J. R., Jiang, H., Roh, J., Finn, M. B., Sullivan, P. M., Esparza, T. J., et al. (2017) · Neuron · doi:10.1016/j.neuron.2017.11.014 · Cited by 209
Dodart, J.-C., Marr, R. A., Koistinaho, M., Gregersen, B. M., Malkani, S., Verma, I. M., & Paul, S. M. (2005) · Proceedings of the National Academy of Sciences · doi:10.1073/pnas.0409072102 · Cited by 207
Cerebrospinal fluid APOE levels: an endophenotype for genetic studies for Alzheimer's disease
Cruchaga, C., Kauwe, J. S. K., Nowotny, P., Bales, K., Pickering, E. H., Mayo, K., Bertelsen, S., Hinrichs, A., Fagan, A. M., Holtzman, D. M., et al. (2012) · Human Molecular Genetics · doi:10.1093/hmg/dds296 · Cited by 207
Lee, S., Devanney, N. A., Golden, L. R., Smith, C. T., Schwartz, J. L., Walsh, A. E., Clarke, H. A., Goulding, D. S., Allenger, E. J., Morillo-Segovia, G., et al. (2023) · Cell Reports · doi:10.1016/j.celrep.2023.112196 · Cited by 203
Self-citationAPOE4 impairs the microglial response in Alzheimer’s disease by inducing TGFβ-mediated checkpoints
Yin, Z., Rosenzweig, N., Kleemann, K. L., Zhang, X., Brandão, W., Margeta, M. A., Schroeder, C., Sivanathan, K. N., Silveira, S., Gauthier, C., et al. (2023) · Nature Immunology · doi:10.1038/s41590-023-01627-6 · Cited by 202 · cited 3×
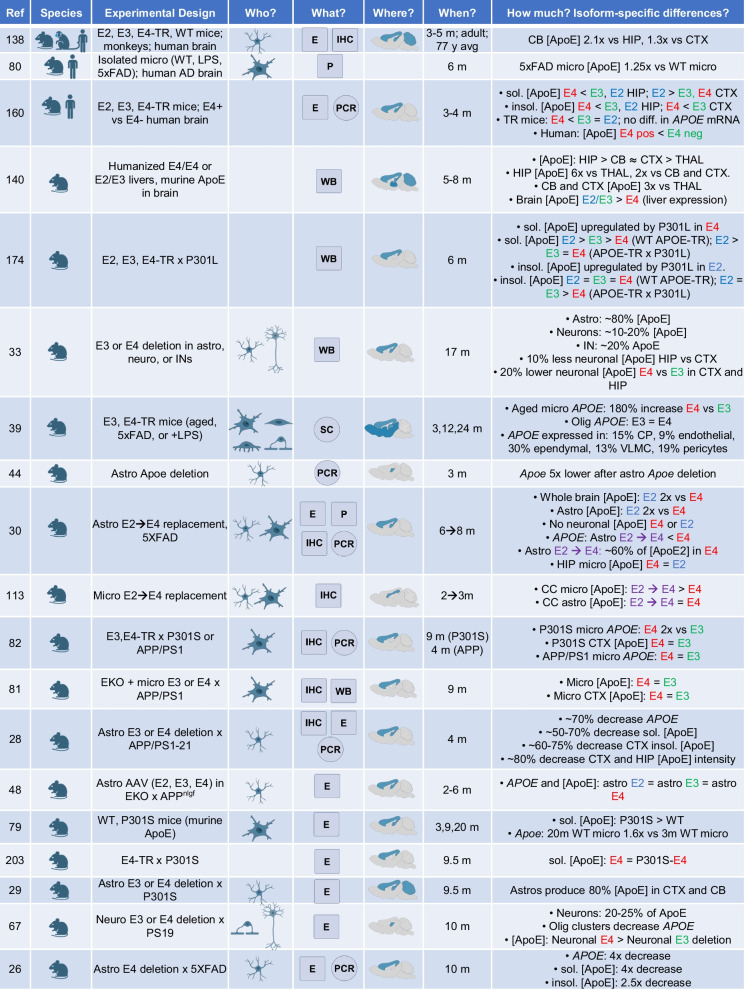
“For example, in P301S mice, microglial APOE expression is more than two-fold higher in E4 than in E3 mice, whereas no isoform difference is detected in APP/PS1 mice, highlighting pathology-specific expression patterns [82].”
Cell type‐specific roles of APOE4 in Alzheimer disease
Blumenfeld, J., Yip, O., Kim, M. J., & Huang, Y. (2024) · Nature Reviews Neuroscience · doi:10.1038/s41583-023-00776-9 · Cited by 202
Multifaceted roles of APOE in Alzheimer disease
Jackson, R. J., Hyman, B. T., & Serrano-Pozo, A. (2024) · Nature Reviews Neurology · doi:10.1038/s41582-024-00988-2 · Cited by 193
Alzheimer's Disease Genetic Risk Factor APOE-ε4 Also Affects Normal Brain Function
Battista, A. M. D., Heinsinger, N. M., & Rebeck, G. W. (2016) · Current Alzheimer Research · doi:10.2174/1567205013666160401115127 · Cited by 189
ApoE Lipidation as a therapeutic target in Alzheimer’s disease
Lanfranco, M. F., Ng, C. A., & Rebeck, G. W. (2020) · International Journal of Molecular Sciences · doi:10.3390/ijms21176336 · Cited by 189
Zalocusky, K. A., Najm, R., Taubes, A. L., Hao, Y., Yoon, S. Y., Koutsodendris, N., Nelson, M. R., Rao, A., Bennett, D. A., Bant, J., et al. (2021) · Nature Neuroscience · doi:10.1038/s41593-021-00851-3 · Cited by 189
Lipid Metabolism Crosstalk in the Brain: Glia and Neurons
Barber, C. N., & Raben, D. M. (2019) · Frontiers in Cellular Neuroscience · doi:10.3389/fncel.2019.00212 · Cited by 188
Hudry, E., Dashkoff, J., Roe, A. D., Takeda, S., Koffie, R. M., Hashimoto, T., Scheel, M., Spires-Jones, T., Arbel-Ornath, M., Betensky, R., et al. (2013) · Science Translational Medicine · doi:10.1126/scitranslmed.3007000 · Cited by 187
Specific Regional Transcription of Apolipoprotein E in Human Brain Neurons
Xu, P., Gilbert, J. R., Qiu, H.-L., Ervin, J. F., Rothrock‐Christian, T., Hulette, C., & Schmechel, D. E. (1999) · American Journal Of Pathology · doi:10.1016/s0002-9440(10)65305-9 · Cited by 178
AAVrh.10-Mediated APOE2 Central Nervous System Gene Therapy for APOE4-Associated Alzheimer's Disease
Rosenberg, J. B., Kaplitt, M. G., De, B. P., Chen, A., Flagiello, T., Salami, C., Pey, E., Zhao, L., Ricart Arbona, R. J., Monette, S., et al. (2018) · Human Gene Therapy Clinical Development · doi:10.1089/humc.2017.231 · Cited by 176
Martínez-Morillo, E., Hansson, O., Atagi, Y., Bu, G., Minthon, L., Diamandis, E. P., & Nielsen, H. M. (2014) · Acta Neuropathologica · doi:10.1007/s00401-014-1266-2 · Cited by 168
Apolipoprotein E4 Alters Astrocyte Fatty Acid Metabolism and Lipid Droplet Formation
Farmer, B., Kluemper, J., & Johnson, L. (2019) · Cells · doi:10.3390/cells8020182 · Cited by 164
Self-citationExpression and secretion of apoE isoforms in astrocytes and microglia during inflammation
Lanfranco, M. F., Sepulveda, J., Kopetsky, G., & Rebeck, G. W. (2021) · Glia · doi:10.1002/glia.23974 · Cited by 164
Hu, J., Liu, C.-C., Chen, X.-F., Zhang, Y.-W., Xu, H., & Bu, G. (2015) · Molecular Neurodegeneration · doi:10.1186/s13024-015-0001-3 · Cited by 161
Wardell, M. R., Brennan, S. O., Janus, E. D., Fraser, R., & Carrell, R. W. (1987) · Journal of Clinical Investigation · doi:10.1172/jci113096 · Cited by 159
Multiomic spatial landscape of innate immune cells at human central nervous system borders
Sankowski, R., Süß, P., Benkendorff, A., Böttcher, C., Fernandez-Zapata, C., Chhatbar, C., Cahueau, J., Monaco, G., Gasull, A. D., Khavaran, A., et al. (2024) · Nature Medicine · doi:10.1038/s41591-023-02673-1 · Cited by 156
Flowers, S. A., & Rebeck, G. W. (2020) · Neurobiology of Disease · doi:10.1016/j.nbd.2019.104724 · Cited by 149
Beyond the CNS: The many peripheral roles of APOE
Martínez-Martínez, A. B., Torres-Perez, E., Devanney, N., Del Moral, R., Johnson, L. A., & Arbones-Mainar, J. M. (2020) · Neurobiology of Disease · doi:10.1016/j.nbd.2020.104809 · Cited by 149
Self-citationLiu, C.-C., Wang, N., Chen, Y., Inoue, Y., Shue, F., Ren, Y., Wang, M., Qiao, W., Ikezu, T. C., Li, Z., et al. (2023) · Nature Immunology · doi:10.1038/s41590-023-01640-9 · Cited by 146
APOE ε2 is associated with increased tau pathology in primary tauopathy
Zhao, N., Liu, C.-C., Van Ingelgom, A. J., Linares, C., Kurti, A., Knight, J. A., Heckman, M. G., Diehl, N. N., Shinohara, M., Martens, Y. A., et al. (2018) · Nature Communications · doi:10.1038/s41467-018-06783-0 · Cited by 139
Huynh, T.-P. V., Wang, C., Tran, A. C., Tabor, G. T., Mahan, T. E., Francis, C. M., Finn, M. B., Spellman, R., Manis, M., Tanzi, R. E., et al. (2019) · Molecular Neurodegeneration · doi:10.1186/s13024-019-0337-1 · Cited by 139
Rangaraju, S., Dammer, E. B., Raza, S. A., Gao, T., Xiao, H., Betarbet, R. S., Duong, D. M., Webster, J. A., Hales, C. M., Lah, J. J., et al. (2018) · Molecular Neurodegeneration · doi:10.1186/s13024-018-0266-4 · Cited by 138
Astroglial Regulation of Apolipoprotein E Expression in Neuronal Cells
Harris, F. M., Tesseur, I., Brecht, W. J., Xu, Q., Mullendorff, K., Chang, S., Wyss-Coray, T., Mahley, R. W., & Huang, Y. (2004) · Journal of Biological Chemistry · doi:10.1074/jbc.m309475200 · Cited by 135
Shi, Y., Andhey, P. S., Ising, C., Wang, K., Snipes, L. L., Boyer, K., Lawson, S., Yamada, K., Qin, W., Manis, M., et al. (2021) · Neuron · doi:10.1016/j.neuron.2021.05.034 · Cited by 135
Mahan, T. E., Wang, C., Bao, X., Choudhury, A., Ulrich, J. D., & Holtzman, D. M. (2022) · Molecular Neurodegeneration · doi:10.1186/s13024-022-00516-0 · Cited by 134
Mahley, R. W., & Huang, Y. (2012) · Journal of Medicinal Chemistry · doi:10.1021/jm3008618 · Cited by 132
Neuronal APOE4 removal protects against tau-mediated gliosis, neurodegeneration and myelin deficits
Koutsodendris, N., Blumenfeld, J., Agrawal, A., Traglia, M., Grone, B., Zilberter, M., Yip, O., Rao, A., Nelson, M. R., Hao, Y., et al. (2023) · Nature Aging · doi:10.1038/s43587-023-00368-3 · Cited by 132
Oligodendroglial fatty acid metabolism as a central nervous system energy reserve
Asadollahi, E., Trevisiol, A., Saab, A. S., Looser, Z. J., Dibaj, P., Ebrahimi, R., Kusch, K., Ruhwedel, T., Möbius, W., Jahn, O., et al. (2024) · Nature Neuroscience · doi:10.1038/s41593-024-01749-6 · Cited by 130
Liao, F., Hori, Y., Hudry, E., Bauer, A. Q., Jiang, H., Mahan, T. E., Lefton, K. B., Zhang, T. J., Dearborn, J. T., Kim, J., et al. (2014) · The Journal of Neuroscience · doi:10.1523/jneurosci.0646-14.2014 · Cited by 128 · cited 1×
“…through antibodies, antisense oligonucleotides, or RNA interference, and supplementing E2 expression via gene therapy have all demonstrated promising potential to reverse aspects of E4-driven pathology (amyloid burden, metabolic shifts, reductions in gliosis) [171, 189–191, 203, 204, 209–213].”
In vivo measurement of apolipoprotein E from the brain interstitial fluid using microdialysis
Ulrich, J. D., Burchett, J. M., Restivo, J. L., Schuler, D. R., Verghese, P. B., Mahan, T. E., Landreth, G. E., Castellano, J. M., Jiang, H., Cirrito, J. R., et al. (2013) · Molecular Neurodegeneration · doi:10.1186/1750-1326-8-13 · Cited by 128
Cell-specific production, secretion, and function of apolipoprotein E
Kockx, M., Traini, M., & Kritharides, L. (2018) · Journal of Molecular Medicine · doi:10.1007/s00109-018-1632-y · Cited by 124
25-Hydroxycholesterol amplifies microglial IL-1β production in an apoE isoform-dependent manner
Wong, M. Y., Lewis, M., Doherty, J. J., Shi, Y., Cashikar, A. G., Amelianchik, A., Tymchuk, S., Sullivan, P. M., Qian, M., Covey, D. F., et al. (2020) · Journal of Neuroinflammation · doi:10.1186/s12974-020-01869-3 · Cited by 121
Border-associated macrophages in the central nervous system
Sun, R., & Jiang, H. (2024) · Journal of Neuroinflammation · doi:10.1186/s12974-024-03059-x · Cited by 120
Soluble apoE/Aβ complex: mechanism and therapeutic target for APOE4-induced AD risk
Tai, L. M., Mehra, S., Shete, V., Estus, S., Rebeck, G. W., Bu, G., & LaDu, M. J. (2014) · Molecular Neurodegeneration · doi:10.1186/1750-1326-9-2 · Cited by 116
Lane-Donovan, C., Wong, W. M., Durakoglugil, M. S., Wasser, C. R., Jiang, S., Xian, X., & Herz, J. (2016) · The Journal of Neuroscience · doi:10.1523/jneurosci.1054-16.2016 · Cited by 115
Marked regional differences of brain human apolipoprotein e expression in targeted replacement mice
Sullivan, P. M., Mace, B. E., Maeda, N., & Schmechel, D. E. (2004) · Neuroscience · doi:10.1016/j.neuroscience.2003.10.011 · Cited by 113
Reduced levels of human apoE4 protein in an animal model of cognitive impairment
Sullivan, P. M., Han, B., Liu, F., Mace, B. E., Ervin, J. F., Wu, S., Koger, D., Paul, S., & Bales, K. R. (2011) · Neurobiology of Aging · doi:10.1016/j.neurobiolaging.2009.05.011 · Cited by 113
Apolipoprotein E Expression by Neurons Surviving Excitotoxic Stress
Boschert, U., Merlo‐Pich, E., Higgins, G. A., Roses, A. D., & Catsicas, S. (1999) · Neurobiology of Disease · doi:10.1006/nbdi.1999.0251 · Cited by 111
Microglial efferocytosis: Diving into the Alzheimer’s disease gene pool
Romero-Molina, C., Garretti, F., Andrews, S. J., Marcora, E., & Goate, A. M. (2022) · Neuron · doi:10.1016/j.neuron.2022.10.015 · Cited by 111 · cited 2×
“Beyond its role in lipid transport, apoE also functions as an opsonin that facilitates microglial phagocytosis of apoptotic cells and other substrates, with apoE isoforms showing distinct efficiencies in this process [95].”
ApoE is required for maintenance of the dentate gyrus neural progenitor pool
Yang, C.-P., Gilley, J. A., Zhang, G., & Kernie, S. G. (2011) · Development · doi:10.1242/dev.065540 · Cited by 109
APOE3 -Jacksonville (V236E) variant reduces self-aggregation and risk of dementia
Liu, C.-C., Murray, M. E., Li, X., Zhao, N., Wang, N., Heckman, M. G., Shue, F., Martens, Y., Li, Y., Raulin, A.-C., et al. (2021) · Science Translational Medicine · doi:10.1126/scitranslmed.abc9375 · Cited by 108
Zhao, L., Gottesdiener, A. J., Parmar, M., Li, M., Kaminsky, S. M., Chiuchiolo, M. J., Sondhi, D., Sullivan, P. M., Holtzman, D. M., Crystal, R. G., et al. (2016) · Neurobiology of Aging · doi:10.1016/j.neurobiolaging.2016.04.020 · Cited by 107
The cell biology of APOE in the brain
Windham, I. A., & Cohen, S. (2024) · Trends in Cell Biology · doi:10.1016/j.tcb.2023.09.004 · Cited by 103
Henn, R. E., Noureldein, M. H., Elzinga, S. E., Kim, B., Savelieff, M. G., & Feldman, E. L. (2022) · Neurobiology of Disease · doi:10.1016/j.nbd.2022.105766 · Cited by 99
Apolipoprotein E4 produced in GABAergic interneurons causes learning and memory deficits in mice
Knoferle, J., Yoon, S. Y., Walker, D., Leung, L., Gillespie, A. K., Tong, L. M., Bien-Ly, N., & Huang, Y. (2014) · The Journal of Neuroscience · doi:10.1523/jneurosci.2281-14.2014 · Cited by 97
APOE traffics to astrocyte lipid droplets and modulates triglyceride saturation and droplet size
Windham, I. A., Powers, A. E., Ragusa, J. V., Wallace, E. D., Zanellati, M. C., Williams, V. H., Wagner, C. H., White, K. K., & Cohen, S. (2024) · Journal of Cell Biology · doi:10.1083/jcb.202305003 · Cited by 96
The role of APOE4 in Alzheimer’s disease: strategies for future therapeutic interventions
Hunsberger, H. C., Pinky, P. D., Smith, W., Suppiramaniam, V., & Reed, M. N. (2019) · Neuronal Signaling · doi:10.1042/ns20180203 · Cited by 94
Association of Rare APOE Missense Variants V236E and R251G With Risk of Alzheimer Disease
Le Guen, Y., Belloy, M. E., Grenier-Boley, B., de Rojas, I., Castillo-Morales, A., Jansen, I., Nicolas, A., Bellenguez, C., Dalmasso, C., Küçükali, F., et al. (2022) · JAMA Neurology · doi:10.1001/jamaneurol.2022.1166 · Cited by 93
Yamazaki, Y., Shinohara, M., Yamazaki, A., Ren, Y., Asmann, Y. W., Kanekiyo, T., & Bu, G. (2020) · Arteriosclerosis, Thrombosis, and Vascular Biology · doi:10.1161/atvbaha.119.313169 · Cited by 89
Measurement of Apolipoprotein E (apoE) in Cerebrospinal Fluid
Hesse, C., Larsson, H. E., Fredman, P., Minthon, L., Andreasen, N., Davidsson, P., & Blennow, K. (2000) · Neurochemical Research · doi:10.1023/a:1007516210548 · Cited by 87
Jackson, R. J., Keiser, M. S., Meltzer, J. C., Fykstra, D. P., Dierksmeier, S. E., Hajizadeh, S., Kreuzer, J., Morris, R., Melloni, A., Nakajima, T., et al. (2024) · Molecular Therapy · doi:10.1016/j.ymthe.2024.03.024 · Cited by 86
Kaya, I., Jennische, E., Lange, S., Baykal, A. T., Malmberg, P., & Fletcher, J. S. (2020) · Journal of Neurochemistry · doi:10.1111/jnc.14999 · Cited by 85
Hou, J., Zhou, Y., Cai, Z., Terekhova, M., Swain, A., Andhey, P. S., Guimaraes, R. M., Ulezko Antonova, A., Qiu, T., Sviben, S., et al. (2023) · Cell Reports · doi:10.1016/j.celrep.2023.112293 · Cited by 85
Apolipoprotein E levels in cerebrospinal fluid and the effects of ABCA1polymorphisms
Wahrle, S. E., Shah, A. R., Fagan, A. M., Smemo, S., Kauwe, J. S., Grupe, A., Hinrichs, A., Mayo, K., Jiang, H., Thal, L. J., et al. (2007) · Molecular Neurodegeneration · doi:10.1186/1750-1326-2-7 · Cited by 84
Border-associated macrophages as gatekeepers of brain homeostasis and immunity
Vara‐Pérez, M., & Movahedi, K. (2025) · Immunity · doi:10.1016/j.immuni.2025.04.005 · Cited by 84
Marangon, D., Boccazzi, M., Lecca, D., & Fumagalli, M. (2020) · Journal of Clinical Medicine · doi:10.3390/jcm9020470 · Cited by 82
Wang, N., Wang, M., Jeevaratnam, S., Rosenberg, C., Ikezu, T. C., Shue, F., Doss, S. V., Alnobani, A., Martens, Y. A., Wren, M., et al. (2022) · Molecular Neurodegeneration · doi:10.1186/s13024-022-00577-1 · Cited by 82
Cashikar, A. G., Toral-Rios, D., Timm, D., Romero, J., Strickland, M., Long, J. M., Han, X., Holtzman, D. M., & Paul, S. M. (2023) · Journal of Lipid Research · doi:10.1016/j.jlr.2023.100350 · Cited by 72
CSF Apo-E levels associate with cognitive decline and MRI changes
Initiative, F. T. A. D. N., Toledo, J. B., Da, X., Weiner, M. W., Wolk, D. A., Xie, S. X., Arnold, S. E., Davatzikos, C., Shaw, L. M., & Trojanowski, J. Q. (2014) · Acta Neuropathologica · doi:10.1007/s00401-013-1236-0 · Cited by 71
ApoE Regulates the Development of Adult Newborn Hippocampal Neurons
Tensaouti, Y., Stephanz, E. P., Yu, T., & Kernie, S. G. (2018) · eNeuro · doi:10.1523/eneuro.0155-18.2018 · Cited by 71
Vascular ApoE4 impairs behavior by modulating gliovascular function
Yamazaki, Y., Liu, C.-C., Yamazaki, A., Shue, F., Martens, Y. A., Chen, Y., Qiao, W., Kurti, A., Oue, H., Ren, Y., et al. (2021) · Neuron · doi:10.1016/j.neuron.2020.11.019 · Cited by 71
Dias, D., Portugal, C. C., Relvas, J. B., & Socodato, R. (2025) · Cells · doi:10.3390/cells14040243 · Cited by 71
Decreased Cerebrospinal Fluid Apolipoprotein E After Subarachnoid Hemorrhage
Kay, A., Petzold, A., Kerr, M., Keir, G., Thompson, E. J., & Nicoll, J. A. R. (2003) · Stroke · doi:10.1161/01.str.0000057579.25430.16 · Cited by 69
Fu, Y., Zhao, J., Atagi, Y., Nielsen, H. M., Liu, C.-C., Zheng, H., Shinohara, M., Kanekiyo, T., & Bu, G. (2016) · Molecular Neurodegeneration · doi:10.1186/s13024-016-0099-y · Cited by 69
Horsburgh, K. J., McCulloch, J., Nilsen, M., Roses, A. D., & Nicoll, J. A. R. (2000) · European Journal of Neuroscience · doi:10.1111/j.1460-9568.2000.01339.x · Cited by 68
Reducing microglial lipid load enhances β amyloid phagocytosis in an Alzheimer’s disease mouse model
Wu, X., Miller, J. A., Lee, B. T. K., Wang, Y., & Ruedl, C. (2025) · Science Advances · doi:10.1126/sciadv.adq6038 · Cited by 67
Oligodendrocyte precursor cells: the multitaskers in the brain
Fang, L., & Bai, X. (2023) · Pflügers Archiv - European Journal of Physiology · doi:10.1007/s00424-023-02837-5 · Cited by 65
Chernick, D., Ortiz‐Valle, S., Jeong, A., Qu, W., & Li, L. (2019) · Neuroscience Letters · doi:10.1016/j.neulet.2019.134306 · Cited by 64
Apolipoprotein E Inhibits Cerebrovascular Pericyte Mobility through a RhoA Protein-mediated Pathway
Casey, C. S., Atagi, Y., Yamazaki, Y., Shinohara, M., Tachibana, M., Fu, Y., Bu, G., & Kanekiyo, T. (2015) · Journal of Biological Chemistry · doi:10.1074/jbc.m114.625251 · Cited by 63
Bekris, L. M., Galloway, N. M., Montine, T. J., Schellenberg, G. D., & Yu, C. (2009) · American Journal of Medical Genetics Part B Neuropsychiatric Genetics · doi:10.1002/ajmg.b.30993 · Cited by 63
White matter microstructure is altered in cognitively normal middle-aged APOE-ε4 homozygotes
Study, F. T. A., Operto, G., Cacciaglia, R., Grau‐Rivera, O., Falcón, C., Brugulat‐Serrat, A., Ródenas, P., Ramos, R., Morán, S., Esteller, M., et al. (2018) · Alzheimer s Research & Therapy · doi:10.1186/s13195-018-0375-x · Cited by 61
ApoE4 reduction: An emerging and promising therapeutic strategy for Alzheimer's disease
Li, Y., Macyczko, J. R., Liu, C.-C., & Bu, G. (2022) · Neurobiology of Aging · doi:10.1016/j.neurobiolaging.2022.03.011 · Cited by 61
Patel, T., Carnwath, T., Wang, X., Allen, M., Lincoln, S., Lewis‐Tuffin, L. J., Quicksall, Z., Lin, S., Tutor‐New, F. Q., Ho, C. C. G., et al. (2022) · Aging Cell · doi:10.1111/acel.13606 · Cited by 61
ABCA1/ApoE/HDL Signaling Pathway Facilitates Myelination and Oligodendrogenesis after Stroke
Li, L., Li, R., Zacharek, A., Wang, F., Landschoot‐Ward, J., Chopp, M., Chen, J., & Cui, X. (2020) · International Journal of Molecular Sciences · doi:10.3390/ijms21124369 · Cited by 60
Apolipoprotein E protects cultured pericytes and astrocytes from D-Aβ1–40-mediated cell death
Bruinsma, I. B., Wilhelmus, M. M. M., Kox, M., Veerhuis, R., de Waal, R. M. W., & Verbeek, M. M. (2009) · Brain Research · doi:10.1016/j.brainres.2009.12.039 · Cited by 59
Raha‐Chowdhury, R., Henderson, J. W., Raha, A. A., Vuono, R., Bickerton, A., Jones, E. A., Fincham, R., Allinson, K. S. J., Holland, A. J., & Zaman, S. H. (2019) · Journal of Alzheimer s Disease · doi:10.3233/jad-181179 · Cited by 57
Takasugi, M., Nonaka, Y., Takemura, K., Yoshida, Y., Stein, F., Schwarz, J., Adachi, J., Satoh, J., Ito, S., Tombline, G., et al. (2024) · Nature Communications · doi:10.1038/s41467-024-52845-x · Cited by 57
Apolipoprotein E Genotype Regulates Amyloid-β Cytotoxicity
Wilhelmus, M. M. M., Otte‐Höller, I., Davis, J., Nostrand, W. E. V., de Waal, R. M. W., & Verbeek, M. M. (2005) · Journal of Neuroscience · doi:10.1523/jneurosci.4213-04.2005 · Cited by 56
Chen, Y., Jin, H., Chen, J., Li, J., Găman, M., & Zou, Z. (2025) · Cell Death Discovery · doi:10.1038/s41420-025-02600-y · Cited by 56
Gilley, J. A., Yang, C., & Kernie, S. G. (2009) · Hippocampus · doi:10.1002/hipo.20719 · Cited by 54
Phu, T. A., Ng, M., Vu, N. K., Gao, A. S., & Raffaï, R. L. (2023) · Journal of Extracellular Vesicles · doi:10.1002/jev2.12345 · Cited by 54
Anfray, A., Schaeffer, S., Hattori, Y., Santisteban, M. M., Casey, N., Wang, G., Strickland, M., Zhou, P., Holtzman, D. M., Anrather, J., et al. (2024) · Nature Neuroscience · doi:10.1038/s41593-024-01757-6 · Cited by 53
Introducing Human APOE into A β Transgenic Mouse Models
Tai, L. M., Youmans, K. L., Jungbauer, L., Yu, C., & LaDu, M. J. (2011) · International Journal of Alzheimer’s Disease · doi:10.4061/2011/810981 · Cited by 52
Regionally specific neuronal expression of human APOE gene in transgenic mice
Xu, P., Gilbert, J. R., Qiu, H.-L., Rothrock‐Christian, T., Settles, D. L., Roses, A. D., & Schmechel, D. E. (1998) · Neuroscience Letters · doi:10.1016/s0304-3940(98)00247-x · Cited by 50
Redefining transcriptional regulation of the APOE gene and its association with Alzheimer’s disease
Lee, E.-G., Tulloch, J., Chen, S., Leong, L., Saxton, A. D., Kraemer, B. C., Darvas, M., Keene, C. D., Shutes‐David, A., Todd, K. W., et al. (2020) · PLoS ONE · doi:10.1371/journal.pone.0227667 · Cited by 49
Rao, A. T., Chen, N., Kim, M. J., Blumenfeld, J. R., Yip, O., Liang, Z., Shostak, D. M., Hao, Y., Nelson, M. R., Koutsodendris, N., et al. (2024) · Cell stem cell · doi:10.1016/j.stem.2024.10.005 · Cited by 48
Lefranc, D., Vermersch, P., Dallongeville, J., Daems-Monpeurt, C., Petit, H., & Delacourte, A. (1996) · Neuroscience Letters · doi:10.1016/0304-3940(96)12774-9 · Cited by 47
Phagocytosis of Apoptotic Cells Is Specifically Upregulated in ApoE4 Expressing Microglia in vitro
Muth, C., Hartmann, A., Falla, D. S., Glatzel, M., & Krasemann, S. (2019) · Frontiers in Cellular Neuroscience · doi:10.3389/fncel.2019.00181 · Cited by 47
Mesquita, S. D., & Rua, R. (2024) · Trends in Immunology · doi:10.1016/j.it.2024.03.007 · Cited by 46
Age-Related Changes in the Behavior of Apolipoprotein E Knockout Mice
Fuentes, D., Fernández, N., García, Y., García, T. E., Morales, A., & Menéndez, R. (2018) · Behavioral Sciences · doi:10.3390/bs8030033 · Cited by 44
Astrocytic and neuronal apolipoprotein E isoforms differentially affect neuronal excitability
Konings, S. C., Torres-Garcia, L., Martinsson, I., & Gouras, G. K. (2021) · Frontiers in Neuroscience · doi:10.3389/fnins.2021.734001 · Cited by 43
Chemparathy, A., Le Guen, Y., Chen, S., Lee, E.-G., Leong, L., Gorzynski, J. E., Jensen, T. D., Ferrasse, A., Xu, G., Xiang, H., et al. (2024) · Neuron · doi:10.1016/j.neuron.2024.01.008 · Cited by 43
Ferguson, C. M., Hildebrand, S. R., Godinho, B. M. D. C., Buchwald, J. E., Echeverria, D., Coles, A. H., Grigorenko, A. P., Vangjeli, L., Sousa, J., McHugh, N., et al. (2024) · Alzheimer s & Dementia · doi:10.1002/alz.13703 · Cited by 43
Multi-functional role of apolipoprotein E in neurodegenerative diseases
Islam, S., Noorani, A. A., Sun, Y., Michikawa, M., & Zou, K. (2025) · Frontiers in Aging Neuroscience · doi:10.3389/fnagi.2025.1535280 · Cited by 43
Apolipoprotein E (apoE) levels in brains from Alzheimer disease patients and controls
Pirttilä, T., Soininen, H., Heinonen, O., Lehtimäki, T., Bogdanovic, N., Paljärvi, L., Kosunen, O., Winblad, B., Riekkinen, P., Wisniewski, H. M., et al. (1996) · Brain Research · doi:10.1016/0006-8993(96)00183-7 · Cited by 42
Xiong, M., Wang, C., Gratuze, M., Saadi, F., Bao, X., Bosch, M. E., Lee, C., Jiang, H., Serrano, J. R., Gonzales, E. R., et al. (2023) · Molecular Neurodegeneration · doi:10.1186/s13024-023-00610-x · Cited by 41
Cholesterol in the CNS: functions, recycling and remyelination
Wuerch, E. C., & Yong, V. W. (2025) · Journal of Neuroinflammation · doi:10.1186/s12974-025-03490-8 · Cited by 41
APOE ε4 allele and CSF APOE on Cognition in HIV-Infected Subjects
Andres, M. A., Feger, U., Nath, A., Munsaka, S. M., Jiang, C. S., & Chang, L. (2010) · Journal of Neuroimmune Pharmacology · doi:10.1007/s11481-010-9254-3 · Cited by 40
NAP Enhances Neurodevelopment of Newborn Apolipoprotein E-Deficient Mice Subjected to Hypoxia
Rotstein, M. S., Bassan, H., Kariv, N., Speiser, Z., Harel, S., & Gozes, I. (2006) · Journal of Pharmacology and Experimental Therapeutics · doi:10.1124/jpet.106.106898 · Cited by 40
Talwar, P., Sinha, J., Grover, S., Agarwal, R., Kushwaha, S. S., Srivastava, M. V. P., & Kukreti, R. (2015) · Journal of the Neurological Sciences · doi:10.1016/j.jns.2015.12.004 · Cited by 40
Brain integrity is altered by hepatic APOE ε4 in humanized-liver mice
Giannisis, A., Patra, K., Edlund, A. K., Nieto, L. A., Benedicto-Gras, J., Moussaud, S., de la Rosa, A., Twohig, D., Bengtsson, T., Fu, Y., et al. (2022) · Molecular Psychiatry · doi:10.1038/s41380-022-01548-0 · Cited by 40
APOE genotype determines cell-type-specific pathological landscape of Alzheimer’s disease
Li, Z., Martens, Y. A., Ren, Y., Jin, Y., Sekiya, H., Doss, S. V., Kouri, N., Castanedes-Casey, M., Christensen, T. A., Miller Nevalainen, L. B., et al. (2025) · Neuron · doi:10.1016/j.neuron.2025.02.017 · Cited by 39
Association of ApoE and LRP mRNA levels with dementia and AD neuropathology
Akram, A. M., Schmeidler, J., Katsel, P., Hof, P. R., & Haroutunian, V. H. (2011) · Neurobiology of Aging · doi:10.1016/j.neurobiolaging.2011.04.010 · Cited by 37
Mok, K. K., Yeung, S. H., Cheng, G. W., Ma, I. W., Lee, R. H., Herrup, K., & Tse, K. (2023) · Journal of Neurochemistry · doi:10.1111/jnc.15748 · Cited by 37
Iacono, D., & Feltis, G. C. (2019) · Aging · doi:10.18632/aging.101757 · Cited by 36
Cheng, G. W.-Y., Mok, K. K.-S., Yeung, S. H.-S., Kofler, J., Herrup, K., & Tse, K.-H. (2022) · Journal of Neuropathology & Experimental Neurology · doi:10.1093/jnen/nlac054 · Cited by 36
Kitagawa, K., Matsumoto, M., Kuwabara, K., Ohtsuki, T., & Hori, M. (2001) · Journal of Cerebral Blood Flow & Metabolism · doi:10.1097/00004647-200110000-00008 · Cited by 35
Bächner, D., Schröder, D., Betat, N., Ahrens, M., & Gross, G. (1999) · BioFactors · doi:10.1002/biof.5520090103 · Cited by 35
Up-regulation of apolipoprotein E by leptin in the hypothalamus of mice and rats
Shen, L., Tso, P., Wang, D. Q. ‐., Woods, S. C., Davidson, W. S., Sakai, R. R., & Liu, M. (2009) · Physiology & Behavior · doi:10.1016/j.physbeh.2009.05.013 · Cited by 34
Isoform-specific effects of apoE on neurite outgrowth in olfactory epithelium culture
Hussain, A., Luong, M., Pooley, A., & Nathan, B. P. (2013) · Journal of Biomedical Science · doi:10.1186/1423-0127-20-49 · Cited by 34
Apolipoprotein E Regulates Injury-Induced Activation of Hippocampal Neural Stem and Progenitor Cells
Hong, S. J., Washington, P. M., Kim, A., Yang, C.-P., Yu, T., & Kernie, S. G. (2015) · Journal of Neurotrauma · doi:10.1089/neu.2014.3860 · Cited by 33
Yu, T., Tensaouti, Y., Stephanz, E. P., Chintamen, S., Rafikian, E. E., Yang, M., & Kernie, S. G. (2021) · Communications Biology · doi:10.1038/s42003-021-02841-4 · Cited by 33
Preman, P., Moechars, D., Fertan, E., Wolfs, L., Serneels, L., Shah, D., Lamote, J., Poovathingal, S., Snellinx, A., Mancuso, R., et al. (2024) · EMBO Molecular Medicine · doi:10.1038/s44321-024-00162-7 · Cited by 32
Therapeutic potential of ApoE-mimetic peptides in CNS disorders: Current perspective
Ahmed, S., Pande, A. H., & Sharma, S. S. (2022) · Experimental Neurology · doi:10.1016/j.expneurol.2022.114051 · Cited by 29
The proportion of Alzheimer’s disease attributable to apolipoprotein E
Williams, D. M., Heikkinen, S., Hiltunen, M. O., FinnGen, Davies, N. M., & Anderson, E. L. (2026) · npj Dementia · doi:10.1038/s44400-025-00045-9 · Cited by 27
Murphy, K. B., Hu, D., Wolfs, L., Rohde, S. K., Fauró, G. L., Geric, I., Mancuso, R., De Strooper, B., & Marzi, S. J. (2025) · Nature Communications · doi:10.1038/s41467-025-60099-4 · Cited by 25
Sepulveda, J., Luo, N., Nelson, M., Ng, C. A. S., & Rebeck, G. W. (2022) · Journal of Neurochemistry · doi:10.1111/jnc.15665 · Cited by 24
Kamada, H., Sato, K., Zhang, W. R., Omori, N., Nagano, I., Shoji, M., & Abe, K. (2003) · Journal of Neuroscience Research · doi:10.1002/jnr.10658 · Cited by 22
Age-related Alterations of Apolipoprotein E and Interleukin-1β in the Aging Brain
Gee, J. R., Ding, Q., & Keller, J. N. (2006) · Biogerontology · doi:10.1007/s10522-005-6039-9 · Cited by 21
Triebswetter, C., Kiely, M., Khattar, N., Ferrucci, L., Resnick, S. M., Spencer, R. G. S., & Bouhrara, M. (2022) · NeuroImage · doi:10.1016/j.neuroimage.2022.118988 · Cited by 21
Apolipoprotein E imbalance in the cerebrospinal fluid of Alzheimer’s disease patients
Lennol, M. P., Sánchez-Domínguez, I., Cuchillo‐Ibáñez, I., Camporesi, E., Brinkmalm, G., Alcolea, D. A., Fortea, J., Lleó, A., Sòria, G., Aguado, F., et al. (2022) · Alzheimer s Research & Therapy · doi:10.1186/s13195-022-01108-2 · Cited by 20
APOE-Targeted Therapeutics for Alzheimer's Disease
Yassine, H. N., Hugo, C., O'Donovan, B., Stephens, I. O., Johnson, L. A., Cole, G., TCW, J., Johansson, J., Kisler, K., & Chiba-Falek, O. (2025) · The Journal of Neuroscience · doi:10.1523/jneurosci.1388-25.2025 · Cited by 20
Self-citationEmerging Role of Oligodendrocytes Malfunction in the Progression of Alzheimer's Disease
Tylek, K., & Basta‐Kaim, A. (2025) · Journal of Neuroimmune Pharmacology · doi:10.1007/s11481-025-10236-z · Cited by 19
APOE4 impacts cortical neurodevelopment and alters network formation in human brain organoids
Meyer-Acosta, K. K., Díaz‐Guerra, E., Varma, P., Aruk, A., Mirsadeghi, S., Perez, A. M., Rafati, Y., Hosseini, A., Nieto‐Estévez, V., Giugliano, M., et al. (2025) · Stem Cell Reports · doi:10.1016/j.stemcr.2025.102537 · Cited by 19
Eisenbaum, M., Pearson, A., Ortiz, C., Koprivica, M., Cembran, A., MULLAN, M. J., Crawford, F., Ojo, J. O., & Bachmeier, C. J. (2024) · Experimental Neurology · doi:10.1016/j.expneurol.2024.114702 · Cited by 18
Human apolipoprotein E glycosylation and sialylation: from structure to function
Moon, H.-J., Luo, Y., Chugh, D., & Zhao, L. (2024) · Frontiers in Molecular Neuroscience · doi:10.3389/fnmol.2024.1399965 · Cited by 18
Golden, L. R., Siano, D. S., Stephens, I. O., MacLean, S. M., Saito, K., Nolt, G. L., Funnell, J. L., Pallerla, A. V., Lee, S., Smith, C., et al. (2025) · Nature Neuroscience · doi:10.1038/s41593-025-02094-y · Cited by 18
Self-citationAstrocyte Lipid Droplet Dynamics Orchestrate Neurological Disorders and Therapeutic Horizons
Zhong, J., Peng, Y., Zhang, L., Xiao, B., & Zhang, M. (2025) · Small Science · doi:10.1002/smsc.202500152 · Cited by 17
Isoform- and cell-state-specific APOE homeostasis and function
Lindner, K., & Gavin, A.-C. (2024) · Neural Regeneration Research · doi:10.4103/nrr.nrr-d-23-01470 · Cited by 13
Kamada, H., Hayashi, T., Sato, K., Iwai, M., Nagano, I., Shoji, M., & Abe, K. (2005) · Molecular Brain Research · doi:10.1016/j.molbrainres.2004.10.037 · Cited by 12
Food-entrained rhythmic expression of apolipoprotein E expression in the hypothalamus of rats
Shen, L., Carey, K., Wang, D. Q. ‐., Woods, S. C., & Liu, M. (2009) · Brain Research · doi:10.1016/j.brainres.2009.04.004 · Cited by 12
Towards an Understanding of Microglia and Border-Associated Macrophages
Taketomi, T., & Tsuruta, F. (2023) · Biology · doi:10.3390/biology12081091 · Cited by 12
Li, T., Zhang, J., Song, H., Zhang, R., Fan, F., Huang, Z., Zeng, M., Peng, B., & Zhang, J. (2025) · Journal of Neuroinflammation · doi:10.1186/s12974-025-03631-z · Cited by 11
Age-Dependent Expression of Apolipoprotein E in Mouse Cerebral Cortex
Singh, S., & Thakur, M. K. (2010) · Journal of Molecular Neuroscience · doi:10.1007/s12031-010-9412-3 · Cited by 10
The absorption of apolipoprotein E by damaged neurons facilitates neuronal repair
Chen, M., Xie, M., Peng, C., & Long, S. (2019) · Cell Biology International · doi:10.1002/cbin.11135 · Cited by 9
Farrell, C., Buhidma, Y., Mumford, P., Heywood, W. E., Hällqvist, J., Flores-Aguilar, L., Andrews, E. J., Rahimzadah, N., Taso, O. S., Doran, E., et al. (2025) · Acta Neuropathologica · doi:10.1007/s00401-025-02889-0 · Cited by 9 · cited 1×
“…with Down syndrome–associated AD (DSAD) show increased apoE protein in the prefrontal cortex compared to both healthy controls and matched early onset AD cases, with upregulation observed in astrocytes, endothelial cells, and pericytes; these changes occur independently of APOE genotype [177].”
Lee, H. A., Cocks, G. D., Nowosiad, P., Polit, L. D., Price, J., Srivas, D. P., & Thuret, S. (2020) · F1000Research · doi:10.12688/f1000research.23580.2 · Cited by 8
Rao, A. T., Chen, N., Kim, M. J., Blumenfeld, J. R., Yip, O., Hao, Y., Liang, Z., Nelson, M. R., Koutsodendris, N., Grone, B. P., et al. (2023) · bioRxiv (Cold Spring Harbor Laboratory) · doi:10.1101/2023.11.10.566510 · Cited by 8
Cuní-López, C., Root, J. T., Hao, Y., Kowal, I., Blomberg, N., Ghirlando, R., Yang, L. G., Koppes-den Hertog, S. J., Cookson, M. R., van der Kant, R., et al. (2025) · doi:10.1101/2025.08.19.669163 · Cited by 8
Xiong, X.-Y., Yuan, H., Mu, Y., He, Y., Xie, F., Feng, X., Xie, J., Pan, X., Wang, Y.-F., Gong, J., et al. (2025) · Frontiers in Immunology · doi:10.3389/fimmu.2025.1625673 · Cited by 8
Kaji, S., Berghoff, S. A., Spieth, L., Schlaphoff, L., Sasmita, A. O., Vitale, S., Büschgens, L., Kedia, S., Zirngibl, M., Nazarenko, T., et al. (2025) · Immunity · doi:10.1016/j.immuni.2024.11.024 · Cited by 7
Vromen, E. M., Lageman, S. B., Gobom, J., van der Kant, R., Dobričić, V., Bertram, L., Streffer, J. R., Lovestone, S., Vos, S. J. B., Tainta, M., et al. (2025) · Alzheimer s & Dementia · doi:10.1002/alz.70738 · Cited by 7
APOE3 astrocytes can rescue lipid abnormalities and dystrophic neurites of APOE4 human neurons
Halim, D. O., Biase, E. D., Rajon, A., Jordi, L., Hallett, P. J., & Ole Isacson, A. (2026) · PNAS Nexus · doi:10.1093/pnasnexus/pgag053 · Cited by 7
Research works printed but not linked: 1
- Iadecola C, et al. Cell autonomous role of border associated macrophages in ApoE4 neurovascular dysfunction and susceptibility to white matter injury. Res Sq. 2023. · DOI
Cited by
Sorted by citations
Heart and Brain: Linking Obesity-Related Inflammation, Cardiovascular Disease and Cognitive Function
Reiss, A. B., Gulkarov, S., Syed, U., Ben-Dor, G. A., Srivastava, A., Singh, M., & Leon, J. D. (2026) · Journal of Cardiovascular Development and Disease · doi:10.3390/jcdd13100477
Gelperina, S. E., & Wacker, M. G. (2026) · Expert Opinion on Drug Delivery · doi:10.1080/17425247.2026.2755180
Metadata
- Authors
- Nolt, G. L., Lucido, C. C., Smith, L. M., & Johnson, L. A.
- Affiliations
- University of Kentucky (US)
- Corresponding author
- Johnson, Lance A.
- Venue
- Molecular Neurodegeneration Advances
- Published
- 2026-04-17
- Volume
- 2
- Issue
- 1
- Pages
- 24-24
- ISSN
- 3059-4944 (ISSN-L)
- PMC
- PMC13216210
- OpenAlex
- W7154709482
- Cited by
- 2
- References
- 193
- Citations by year
- 2026: 2
- FWCI
- 2.09
- Type
- journal article
- Language
- en
- Open access
- hybrid
- doi.org
- Licence
- Locations
- Molecular Neurodegeneration Advances (publishedVersion, cc-by-nc-nd)
- PubMed (publishedVersion)
- PubMed Central (publishedVersion, cc-by-nc-nd)
- Funders
- National Institutes of Health (R01AG081421)
- National Institute of General Medical Sciences (COBRE P20 GM148326)
- Alzheimer's Association (ABA-22-972169)
- Topics
- Life Sciences › Neuroscience › Cellular and Molecular Neuroscience › Alzheimer's disease research and treatments
- Life Sciences › Neuroscience › Neurology › Neuroinflammation and Neurodegeneration Mechanisms
- Life Sciences › Neuroscience › Neurology › Barrier Structure and Function Studies
- Keywords
- apolipoprotein E, APOE isoforms, Alzheimer's disease, central nervous system, astrocytes, microglia, oligodendrocyte lineage, spatiotemporal gene expression, post-transcriptional regulation, aging, neuroinflammation
About these checks
Registry, retraction, Cites and statistics results are computed, not judged, with one exception: a printed reference that no index lists is read once by a model before it counts as a citation error. Claims are extracted by a model and kept only when their quote appears verbatim in the text; each cited source is then checked, with a model’s help, for whether it says what the claim relies on. Those verdicts can be wrong — read the claim’s quote and the cited source before relying on one.
Statistics and arithmetic are recomputed, not judged.
Confidence bands are shown only for fields calibrated on our annotated test set. None is calibrated yet, so no band is shown.
What counts as a claim ›How we measure confidence ›How we check this ›
Are you an author, or do you see a problem with this page? Request a review
