

The DOI matches its Crossref record; 53 of the 53 references it cites were found in a registry or an index.
Circadian Desynchrony Promotes Metabolic Disruption in a Mouse Model of Shiftwork
Open accessAbstract
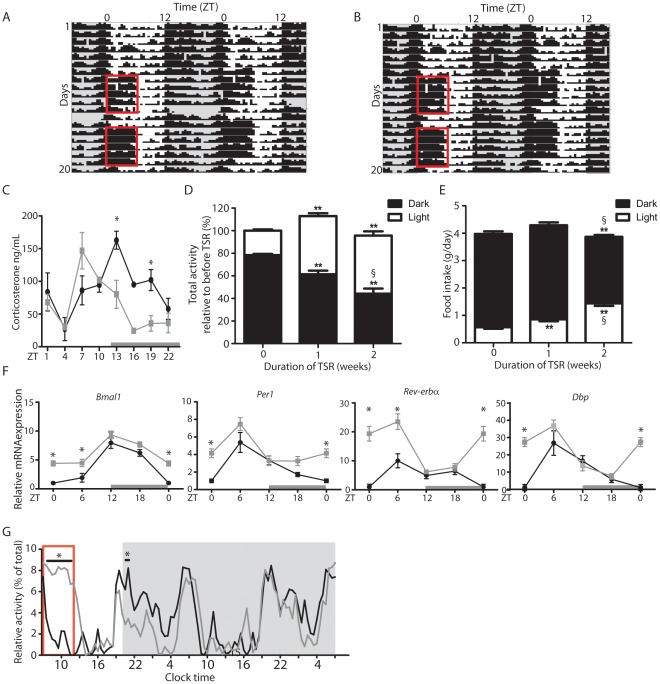
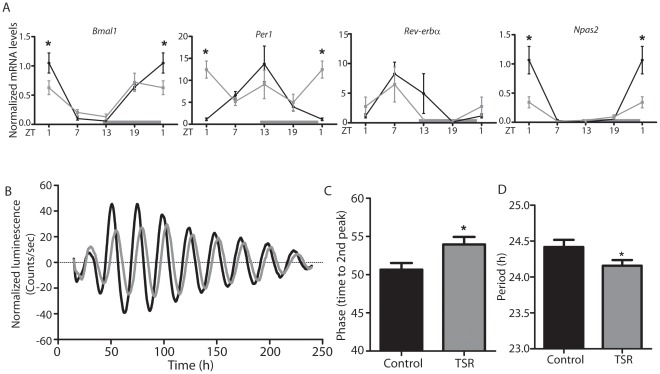
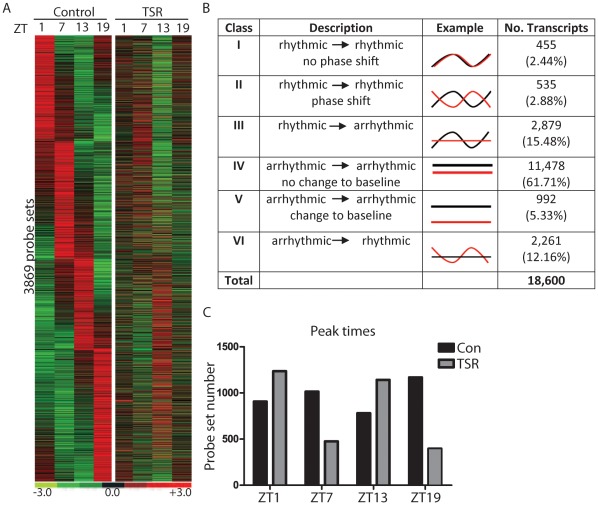
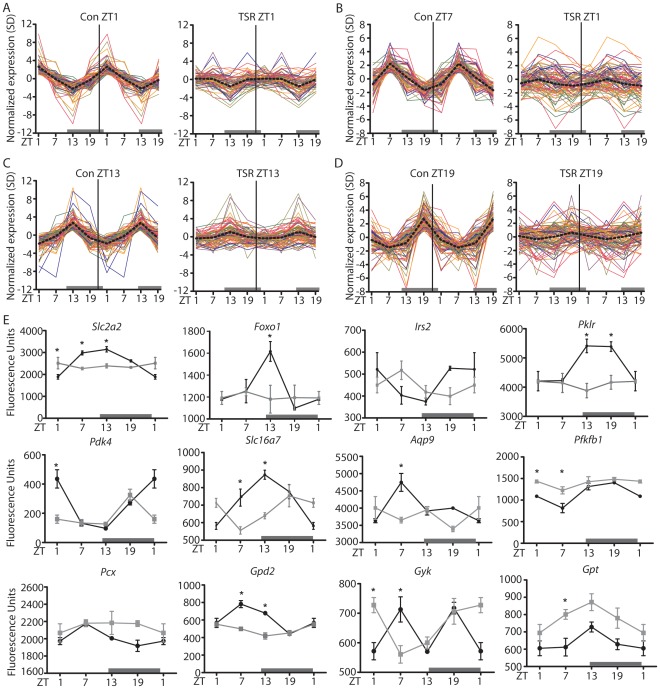
Shiftwork is associated with adverse metabolic pathophysiology, and the rising incidence of shiftwork in modern societies is thought to contribute to the worldwide increase in obesity and metabolic syndrome. The underlying mechanisms are largely unknown, but may involve direct physiological effects of nocturnal light exposure, or indirect consequences of perturbed endogenous circadian clocks. This study employs a two-week paradigm in mice to model the early molecular and physiological effects of shiftwork. Two weeks of timed sleep restriction has moderate effects on diurnal activity patterns, feeding behavior, and clock gene regulation in the circadian pacemaker of the suprachiasmatic nucleus. In contrast, microarray analyses reveal global disruption of diurnal liver transcriptome rhythms, enriched for pathways involved in glucose and lipid metabolism and correlating with first indications of altered metabolism. Although altered food timing itself is not sufficient to provoke these effects, stabilizing peripheral clocks by timed food access can restore molecular rhythms and metabolic function under sleep restriction conditions. This study suggests that peripheral circadian desynchrony marks an early event in the metabolic disruption associated with chronic shiftwork. Thus, strengthening the peripheral circadian system by minimizing food intake during night shifts may counteract the adverse physiological consequences frequently observed in human shift workers.
Overview
The claims and statistics of this paper haven’t been checked yet.
Run the check — free, no account needed. It reads the open-access text and checks the sources it cites.
Integrity signals
Registry
Cites
Statistics
Figures
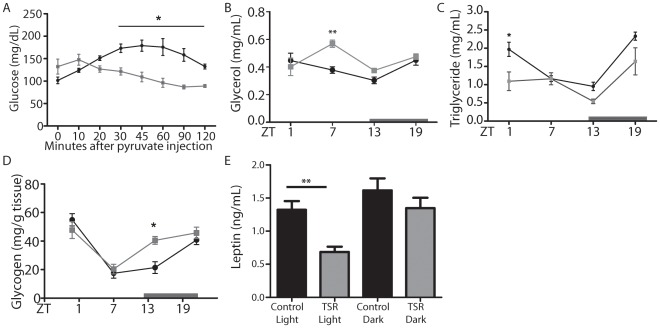
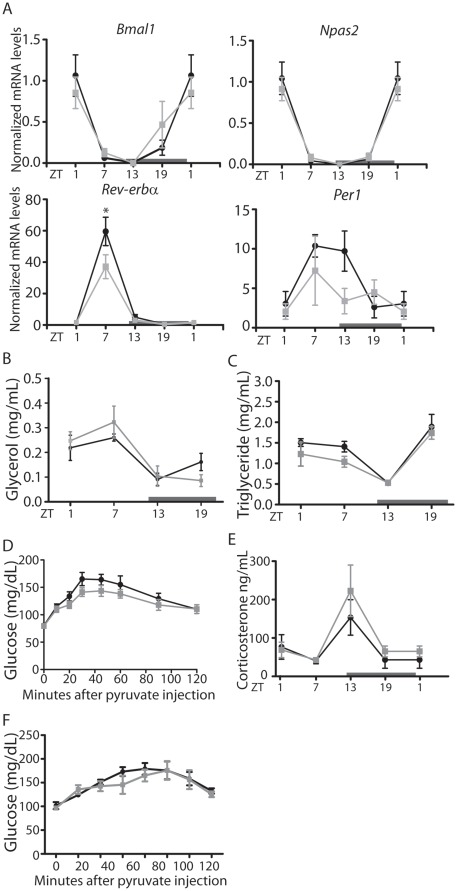
Verification
Claims the paper makes
The claims and statistics of this paper haven’t been checked yet.
Run the check — free, no account needed. It reads the open-access text and checks the sources it cites.
Claims other papers make about this one
Each is checked against this paper’s own text: does it say what the citing paper says it does?
The cited source says what the claim attributes to it.
In the citing paper
“The night eating syndrome in humans (33,34) and a shift of food intake from the active phase to the rest phase in laboratory rodents (35,36) have been associated with adverse metabolic consequences.”
From Circadian Misalignment Augments Markers of Insulin Resistance and Inflammation, Independently of Sleep Loss (2014) · cites this paper as [36]
Self-check
Percentages, sums and reported differences re-computed from the paper’s own numbers.
The self-check needs the paper’s full text.
Citations
Cites
Systematic and integrative analysis of large gene lists using DAVID bioinformatics resources
Huang, D. W., Sherman, B. T., & Lempicki, R. A. (2009) · Nature Protocols · doi:10.1038/nprot.2008.211 · Cited by 35,890
Huang, D. W., Sherman, B. T., & Lempicki, R. A. (2009) · Nucleic Acids Research · doi:10.1093/nar/gkn923 · Cited by 14,108
Bioconductor: open software development for computational biology and bioinformatics
Gentleman, R. C., Carey, V. J., Bates, D. M., Bolstad, B., Dettling, M., Dudoit, S., Ellis, B., Gautier, L., Ge, Y., Gentry, J., et al. (2004) · Genome biology · doi:10.1186/gb-2004-5-10-r80 · Cited by 12,082
Model-based analysis of oligonucleotide arrays: Expression index computation and outlier detection.
Li, C., & Wong, W. H. (2001) · Proceedings of the National Academy of Sciences · doi:10.1073/pnas.98.1.31 · Cited by 3,133
More powerful procedures for multiple significance testing
Hochberg, Y., & Benjamini, Y. (1990) · Statistics in Medicine · doi:10.1002/sim.4780090710 · Cited by 2,715
Obesity and Metabolic Syndrome in Circadian Clock Mutant Mice
Turek, F. W., Joshu, C., Kohsaka, A., Lin, E., Ivanova, G., McDearmon, E., Laposky, A., Losee-Olson, S., Easton, A., Jensen, D. R., et al. (2005) · Science · doi:10.1126/science.1108750 · Cited by 2,485
Spiegel, K., Tasali, E., Penev, P., & Cauter, E. V. (2004) · Annals of Internal Medicine · doi:10.7326/0003-4819-141-11-200412070-00008 · Cited by 2,459
Damiola, F., Le Minh, N., Preitner, N., Kornmann, B., Fleury-Olela, F., & Schibler, U. (2000) · Genes & Development · doi:10.1101/gad.183500 · Cited by 2,394
Yoo, S.-H., Yamazaki, S., Lowrey, P. L., Shimomura, K., Ko, C. H., Buhr, E. D., Siepka, S. M., Hong, H.-K., Oh, W. J., Yoo, O. J., et al. (2004) · Proceedings of the National Academy of Sciences · doi:10.1073/pnas.0308709101 · Cited by 2,329
Coordinated Transcription of Key Pathways in the Mouse by the Circadian Clock
Panda, S., Antoch, M. P., Miller, B. H., Su, A. I., Schook, A. C., Straume, M., Schultz, P. G., Kay, S. A., Takahashi, J. S., & Hogenesch, J. B. (2002) · Cell · doi:10.1016/s0092-8674(02)00722-5 · Cited by 2,310
Circadian integration of metabolism and energetics
Bass, J., & Takahashi, J. S. (2010) · Science · doi:10.1126/science.1195027 · Cited by 1,910
The genetics of mammalian circadian order and disorder: implications for physiology and disease
Takahashi, J. S., Hong, H.-K., Ko, C. H., & McDearmon, E. L. (2008) · Nature Reviews Genetics · doi:10.1038/nrg2430 · Cited by 1,611
Insulin-regulated hepatic gluconeogenesis through FOXO1–PGC-1α interaction
Puigserver, P., Rhee, J., Donovan, J., Walkey, C. J., Yoon, J. C., Oriente, F., Kitamura, Y., Altomonte, J., Dong, H., Accili, D., et al. (2003) · Nature · doi:10.1038/nature01667 · Cited by 1,487
Rudic, R. D., McNamara, P., Curtis, A.-M., Boston, R. C., Panda, S., Hogenesch, J. B., & FitzGerald, G. A. (2004) · PLoS Biology · doi:10.1371/journal.pbio.0020377 · Cited by 1,059
Physiological significance of a peripheral tissue circadian clock
Lamia, K. A., Storch, K.-F., & Weitz, C. J. (2008) · Proceedings of the National Academy of Sciences · doi:10.1073/pnas.0806717105 · Cited by 1,048
Circadian timing of food intake contributes to weight gain
Arble, D. M., Bass, J., Laposky, A. D., Vitaterna, M. H., & Turek, F. W. (2009) · Obesity · doi:10.1038/oby.2009.264 · Cited by 953
Karlsson, B., Knutsson, A., & Lindahl, B. (2001) · Occupational and Environmental Medicine · doi:10.1136/oem.58.11.747 · Cited by 924
Light at night increases body mass by shifting the time of food intake
Fonken, L. K., Workman, J. L., Walton, J. C., Weil, Z. M., Morris, J. S., Haim, A., & Nelson, R. J. (2010) · Proceedings of the National Academy of Sciences · doi:10.1073/pnas.1008734107 · Cited by 796
Time of feeding and the intrinsic circadian clock drive rhythms in hepatic gene expression.
Vollmers, C., Gill, S., DiTacchio, L., Pulivarthy, S. R., Le, H. D., & Panda, S. (2009) · Proceedings of the National Academy of Sciences · doi:10.1073/pnas.0909591106 · Cited by 765
Role of sleep timing in caloric intake and BMI
Baron, K. G., Reid, K. J., Kern, A. S., & Zee, P. C. (2011) · Obesity · doi:10.1038/oby.2011.100 · Cited by 549
Oster, H., Damerow, S., Kiessling, S., Jakubcakova, V., Abraham, D., Tian, J., Hoffmann, M. W., & Eichele, G. (2006) · Cell Metabolism · doi:10.1016/j.cmet.2006.07.002 · Cited by 528
Self-citationMasking: History, Definitions, and Measurement
Mrosovsky, N. (1999) · Chronobiology International · doi:10.3109/07420529908998717 · Cited by 449
Sleep and the epidemic of obesity in children and adults
Van Cauter, E., & Knutson, K. L. (2008) · European Journal of Endocrinology · doi:10.1530/eje-08-0298 · Cited by 427
Garaulet, M., Ortega, F. B., Ruiz, J. R., Rey-López, J. P., Béghin, L., Μanios, Y., Cuenca‐García, M., Plada, M., Diethelm, K., Kafatos, A., et al. (2011) · International Journal of Obesity · doi:10.1038/ijo.2011.149 · Cited by 423
Homer1a is a core brain molecular correlate of sleep loss
Maret, S., Dorsaz, S., Gurcel, L., Pradervand, S., Petit, B., Pfister, C., Hagenbüchle, O., O’Hara, B. F., Franken, P., & Tafti, M. (2007) · Proceedings of the National Academy of Sciences · doi:10.1073/pnas.0710131104 · Cited by 375
Determination of glycogen with the anthrone reagent
Roe, J. H., & Dailey, R. E. (1966) · Analytical Biochemistry · doi:10.1016/0003-2697(66)90028-5 · Cited by 350
Di Lorenzo, L., De Pergola, G., Zocchetti, C., L'Abbate, N., Basso, A., Pannacciulli, N., Cignarelli, M., Giorgino, R., & Soleo, L. (2003) · International Journal of Obesity · doi:10.1038/sj.ijo.0802419 · Cited by 346
Folkard, S. (2008) · Chronobiology International · doi:10.1080/07420520802106835 · Cited by 335
Salgado-Delgado, R., Angeles-Castellanos, M., Saderi, N., Buijs, R. M., & Escobar, C. (2010) · Endocrinology · doi:10.1210/en.2009-0864 · Cited by 323
Effects of rotating shift work on biomarkers of metabolic syndrome and inflammation
Sookoian, S. C., Gemma, C., Gianotti, T. F., Burgueño, A. L., Alvarez, A., González, C. D., & Pirola, C. J. (2007) · Journal of Internal Medicine · doi:10.1111/j.1365-2796.2007.01766.x · Cited by 318
Shift work: coping with the biological clock.
Arendt, J. (2010) · Occupational Medicine · doi:10.1093/occmed/kqp162 · Cited by 308
The role of mPer2 clock gene in glucocorticoid and feeding rhythms
Yang, S., Liu, A., Weidenhammer, A., Cooksey, R. C., McClain, D., Kim, M. K., Aguilera, G., Abel, E. D., & Chung, J. H. (2009) · Endocrinology · doi:10.1210/en.2008-0705 · Cited by 263
Oster, H., Damerow, S., Hut, R. A., & Gregor Eichele, C. (2006) · Journal of Biological Rhythms · doi:10.1177/0748730406293053 · Cited by 233
Self-citationPostprandial hormone and metabolic responses amongst shift workers in Antarctica
Lund, J., Arendt, J., Hampton, S., English, J., & Morgan, L. (2001) · Journal of Endocrinology · doi:10.1677/joe.0.1710557 · Cited by 206
Shift Work in Nurses: Contribution of Phenotypes and Genotypes to Adaptation
Gamble, K. L., Motsinger‐Reif, A. A., Hida, A., Borsetti, H., Servick, S. V., Ciarleglio, C. M., Robbins, S., Hicks, J., Carver, K., Hamilton, N. M., et al. (2011) · PLoS ONE · doi:10.1371/journal.pone.0018395 · Cited by 194
FoxOs Function Synergistically to Promote Glucose Production
Haeusler, R. A., Kaestner, K. H., & Accili, D. (2010) · Journal of Biological Chemistry · doi:10.1074/jbc.c110.175851 · Cited by 192
The effect of sleep deprivation on sleep in rats with suprachiasmatic lesions
Tobler, I., Borbély, A. A., & Groos, G. A. (1983) · Neuroscience Letters · doi:10.1016/0304-3940(83)90420-2 · Cited by 178
Impairment of Peripheral Circadian Clocks Precedes Metabolic Abnormalities in ob/ob Mice
Ando, H., Kumazaki, M., Motosugi, Y., Ushijima, K., Maekawa, T., Ishikawa, E., & Fujimura, A. (2011) · Endocrinology · doi:10.1210/en.2010-1068 · Cited by 166
Altered postprandial hormone and metabolic responses in a simulated shift work environment
Ribeiro, D., Hampton, S., Morgan, L., Deacon, S., & Arendt, J. (1998) · Journal of Endocrinology · doi:10.1677/joe.0.1580305 · Cited by 155
Role of melatonin in metabolic regulation
Korkmaz, A., Topal, T., Tan, D., & Reiter, R. J. (2009) · Reviews in Endocrine and Metabolic Disorders · doi:10.1007/s11154-009-9117-5 · Cited by 145
Al-Naimi, S., Hampton, S. M., Richard, P., Tzung, C., & Morgan, L. M. (2004) · Chronobiology International · doi:10.1081/cbi-200037171 · Cited by 134
Situations influencing habits in diet and exercise among nurses working night shift
PERSSON, M., & Mårtensson, J. (2006) · Journal of Nursing Management · doi:10.1111/j.1365-2934.2006.00601.x · Cited by 134
Wong, H. S. S., Wong, M. C. S., Wong, S. Y. S., & Lee, A. (2010) · International Journal of Nursing Studies · doi:10.1016/j.ijnurstu.2010.01.001 · Cited by 131
Evaluation of the Effects of Shift Work on Nutrient Intake: A Cross‐sectional Study
Morikawa, Y., Miura, K., Sasaki, S., Yoshita, K., Yoneyama, S., Sakurai, M., Ishizaki, M., Kido, T., Naruse, Y., Suwazono, Y., et al. (2008) · Journal of Occupational Health · doi:10.1539/joh.l7116 · Cited by 106
Hormonal appetite control is altered by shift work: a preliminary study
Crispim, C. A., Waterhouse, J. M., Dâmaso, A. R., Zimberg, I. Z., Padilha, H. G., Oyama, L. M., Tufik, S. B., & de Mello, M. T. (2011) · Metabolism · doi:10.1016/j.metabol.2011.04.014 · Cited by 92
Age-related changes in sleep in inbred mice are genotype dependent
Hasan, S., Dauvilliers, Y., Mongrain, V., Franken, P., & Tafti, M. (2012) · Neurobiology of Aging · doi:10.1016/j.neurobiolaging.2010.05.010 · Cited by 92
Loss of circadian rhythmicity in agingmPer1-/-mCry2-/-mutant micePreprint
Oster, H., Baeriswyl, S., van der Horst, G. T. J., & Albrecht, U. (2003) · Genes & Development · doi:10.1101/gad.256103 · Cited by 91
Self-citationYamanaka, Y., Honma, S., & Honma, K.-I. (2008) · Genes to Cells · doi:10.1111/j.1365-2443.2008.01183.x · Cited by 82
Effects of sleep restriction periods on serum cortisol levels in healthy men
Wu, H., Zhao, Z., Stone, W. S., Huang, L., Zhuang, J., He, B., Zhang, P., & Li, Y. (2008) · Brain Research Bulletin · doi:10.1016/j.brainresbull.2008.07.013 · Cited by 62
Shift Work and the Risk of Metabolic Syndrome: A Nested Case-Control Study
Li, Y., Sato, Y., & Yamaguchi, N. (2011) · International Journal of Occupational and Environmental Health · doi:10.1179/107735211799030960 · Cited by 58
Salgado‐Delgado, R., Saderi, N., Castellanos, A., Buijs, R. M., & Escobar, C. (2010) · Journal of Biological Rhythms · doi:10.1177/0748730410383403 · Cited by 51
Gibbs, M. A., Hampton, S. M., Morgan, L., & Arendt, J. (2007) · Journal of Biological Rhythms · doi:10.1177/0748730407302843 · Cited by 49
Rehman, J.-U., Brismar, K., Holmbäck, U. C., Åkerstedt, T., & Axelsson, J. (2010) · European Journal of Endocrinology · doi:10.1530/eje-10-0297 · Cited by 22
Research works printed but not linked: 1
- RD Rudic, 2004, BMAL1 and CLOCK, Two Essential Components of the Circadian Clock, Are Involved in Glucose Homeostasis., PLoS Biol, 2, e377, 10.1371/journal.pbio.0020377 · DOI · Paper page
Cited by
Sorted by citations
Chaix, A., Zarrinpar, A., Miu, P., & Panda, S. (2014) · Cell Metabolism · doi:10.1016/j.cmet.2014.11.001 · Cited by 956
Physiological and pathophysiological roles of NAMPT and NAD metabolism.
Garten, A., Schuster, S., Penke, M., Gorski, T., de Giorgis, T., & Kiess, W. (2015) · Nature Reviews Endocrinology · doi:10.1038/nrendo.2015.117 · Cited by 708
Leproult, R., Holmbäck, U., & Van Cauter, E. (2014) · Diabetes · doi:10.2337/db13-1546 · Cited by 607
“The night eating syndrome in humans (33,34) and a shift of food intake from the active phase to the rest phase in laboratory rodents (35,36) have been associated with adverse metabolic consequences.”
BackgroundRole of sleep deprivation in immune-related disease risk and outcomes
Garbarino, S., Lanteri, P., Bragazzi, N. L., Magnavita, N., & Scoditti, E. (2021) · Communications Biology · doi:10.1038/s42003-021-02825-4 · Cited by 665
Möller-Levet, C. S., Archer, S. N., Bucca, G., Laing, E. E., Slak, A., Kabiljo, R., Lo, J. C. Y., Santhi, N., von Schantz, M., Smith, C. P., et al. (2013) · Proceedings of the National Academy of Sciences · doi:10.1073/pnas.1217154110 · Cited by 576
Metadata
- Authors
- Barclay, J. L., Husse, J., Bode, B., Naujokat, N., Meyer-Kovac, J., Schmid, S. M., Lehnert, H., & Oster, H.
- Affiliations
- Max Planck Institute for Biophysical Chemistry (DE)
- University of Lübeck (DE)
- Corresponding author
- Oster, Henrik
- Venue
- PLoS ONE
- Publisher
- Public Library of Science (PLoS)
- Published
- 2012-05-21
- Volume
- 7
- Issue
- 5
- Pages
- e37150
- ISSN
- 1932-6203 (ISSN-L)
- PMC
- PMC3357388
- OpenAlex
- W2104310168
- Cited by
- 259
- References
- 53
- Citations by year
- 2026: 9 · 2025: 11 · 2024: 15 · 2023: 13 · 2022: 15 · 2021: 19 · 2020: 19 · 2019: 18 · 2018: 21 · 2017: 21 · 2016: 20 · 2015: 24 · 2014: 26 · 2013: 24 · 2012: 4
- FWCI
- 11.13
- Type
- journal article
- Language
- en
- Open access
- gold
- doi.org
- Locations
- PLoS ONE (publishedVersion, cc-by)
- Europe PMC (PubMed Central) (publishedVersion, cc-by)
- PubMed Central (publishedVersion, cc-by)
- PubMed (publishedVersion)
- MPG.PuRe (Max Planck Society) (submittedVersion, other-oa)
- DOAJ (DOAJ: Directory of Open Access Journals) (submittedVersion, cc-by-sa)
- Figshare (submittedVersion, cc-by)
- Funders
- Deutsche Forschungsgemeinschaft (SFB654)
- Volkswagen Foundation
- Topics
- Life Sciences › Neuroscience › Endocrine and Autonomic Systems › Circadian rhythm and melatonin
- Social Sciences › Psychology › Experimental and Cognitive Psychology › Sleep and Work-Related Fatigue
- Health Sciences › Medicine › Physiology (medical) › Dietary Effects on Health
- Keywords
- shift work, circadian desynchrony, metabolic disruption, sleep restriction, peripheral circadian clock, suprachiasmatic nucleus, glucose metabolism, lipid metabolism, metabolic syndrome, obesity, nocturnal light exposure, feeding behavior
- MeSH terms
- Animals, Biological Clocks, Circadian Rhythm, Disease Models, Animal, Eating, Gene Expression Regulation, Liver, Male, Suprachiasmatic Nucleus, Sleep Disorders, Circadian Rhythm, Mice, Transcriptome
About these checks
Registry, retraction, Cites and statistics results are computed, not judged, with one exception: a printed reference that no index lists is read once by a model before it counts as a citation error. Claims are extracted by a model and kept only when their quote appears verbatim in the text; each cited source is then checked, with a model’s help, for whether it says what the claim relies on. Those verdicts can be wrong — read the claim’s quote and the cited source before relying on one.
Statistics and arithmetic are recomputed, not judged.
Confidence bands are shown only for fields calibrated on our annotated test set. None is calibrated yet, so no band is shown.
What counts as a claim ›How we measure confidence ›How we check this ›
Are you an author, or do you see a problem with this page? Request a review
