

The DOI matches its Crossref record; 41 of the 41 references it cites were found in a registry or an index.
Functional Impairment of Microglia Coincides with Beta-Amyloid Deposition in Mice with Alzheimer-Like Pathology
Open accessAbstract
Microglial cells closely interact with senile plaques in Alzheimer's disease and acquire the morphological appearance of an activated phenotype. The significance of this microglial phenotype and the impact of microglia for disease progression have remained controversial. To uncover and characterize putative changes in the functionality of microglia during Alzheimer's disease, we directly assessed microglial behavior in two mouse models of Alzheimer's disease. Using in vivo two-photon microscopy and acute brain slice preparations, we found that important microglial functions - directed process motility and phagocytic activity - were strongly impaired in mice with Alzheimer's disease-like pathology compared to age-matched non-transgenic animals. Notably, impairment of microglial function temporally and spatially correlated with Aβ plaque deposition, and phagocytic capacity of microglia could be restored by interventionally decreasing amyloid burden by Aβ vaccination. These data suggest that major microglial functions progressively decline in Alzheimer's disease with the appearance of Aβ plaques, and that this functional impairment is reversible by lowering Aβ burden, e.g. by means of Aβ vaccination.
Overview
The claims and statistics of this paper haven’t been checked yet.
Run the check — free, no account needed. It reads the open-access text and checks the sources it cites.
Integrity signals
Registry
Cites
Statistics
Figures
Verification
Claims the paper makes
The claims and statistics of this paper haven’t been checked yet.
Run the check — free, no account needed. It reads the open-access text and checks the sources it cites.
Claims other papers make about this one
Each is checked against this paper’s own text: does it say what the citing paper says it does?
The source backs part of the claim, not all of it — or backs it for a different population, condition or comparison.
In the citing paper
“Notably, previous studies have shown that microglial function may be adversely affected by Aβ, particularly as a result of chronic exposure to pro-inflammatory cytokines, resulting in increased Aβ accumulation and potentially underpinning the contradiction between our in vitro and in vivo results.39,40”
From Microglial INPP5D limits plaque formation and glial reactivity in the PSAPP mouse model of Alzheimer's disease (2023) · cites this paper as [39]
Experimental — accuracy not yet measuredThe source backs part of the claim, not all of it — or backs it for a different population, condition or comparison.
In the citing paper
“the ability of microglia to remove Αβ declines over time”
From Amyloid-β induces lipid droplet-mediated microglial dysfunction via the enzyme DGAT2 in Alzheimer’s disease (2025) · cites this paper as [17]
Experimental — accuracy not yet measuredThe source backs part of the claim, not all of it — or backs it for a different population, condition or comparison.
In the citing paper
“supporting that the progression of amyloid pathology correlates with impaired capacity of microglia to phagocytose Αβ17,16.”
From Amyloid-β induces lipid droplet-mediated microglial dysfunction via the enzyme DGAT2 in Alzheimer’s disease (2025) · cites this paper as [17]
Experimental — accuracy not yet measuredThe source backs part of the claim, not all of it — or backs it for a different population, condition or comparison.
In the citing paper
“their phagocytic capacity declines with aging, chronic exposure to Αβ, and during sustained inflammation in the AD brain76,16,17.”
From Amyloid-β induces lipid droplet-mediated microglial dysfunction via the enzyme DGAT2 in Alzheimer’s disease (2025) · cites this paper as [17]
Experimental — accuracy not yet measuredThe source backs part of the claim, not all of it — or backs it for a different population, condition or comparison.
In the citing paper
“However, perturbations in microglial activity, often associated with aging, can affect the effective clearance of these neuron-derived Aβ fibrils, leading to increased plaque formation and the progression of cognitive and behavioral impairments (17–20).”
From Reducing microglial lipid load enhances β amyloid phagocytosis in an Alzheimer’s disease mouse model (2025) · cites this paper as [19]
Experimental — accuracy not yet measured
The cited source says what the claim attributes to it.
In the citing paper
“Microglial phagocytosis is believed to be dysfunctional in AD [17–19].”
From IL-1β-driven amyloid plaque clearance is associated with an expansion of transcriptionally reprogrammed microglia (2019) · cites this paper as [18]
The cited source says what the claim attributes to it.
In the citing paper
“However, several studies have shown that defects in the phagocytic function of microglia can be restored with Aβ immunization [18, 23] and anti-inflammatory drug treatment [24, 25].”
From IL-1β-driven amyloid plaque clearance is associated with an expansion of transcriptionally reprogrammed microglia (2019) · cites this paper as [18]
The cited source says what the claim attributes to it.
In the citing paper
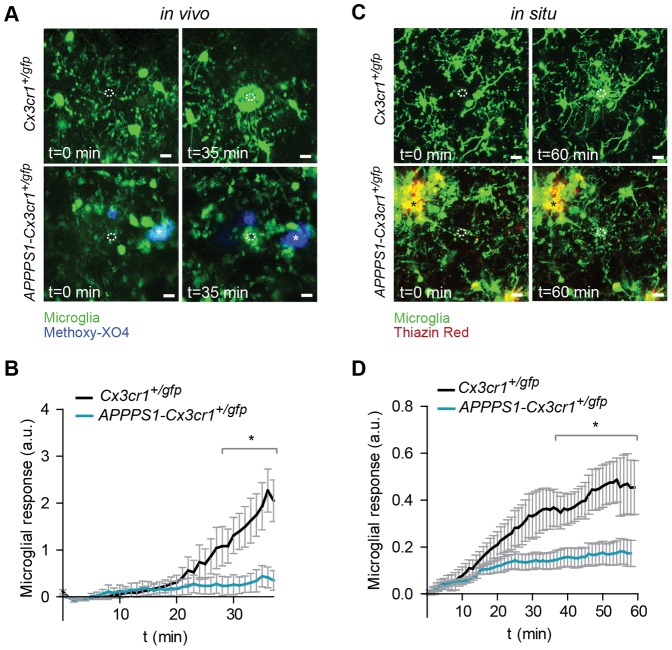
“Notably, microglial process motility directed toward site of damage was significantly impaired in mice with A β plaques 48 .”
From Transcriptomic analysis of purified human cortical microglia reveals age-associated changes (2017) · cites this paper as [48]
Self-check
Percentages, sums and reported differences re-computed from the paper’s own numbers.
The self-check needs the paper’s full text.
Citations
Cites
Resting microglial cells are highly dynamic surveillants of brain parenchyma in vivo
Nimmerjahn, A., Kirchhoff, F., & Helmchen, F. (2005) · Science · doi:10.1126/science.1110647 · Cited by 5,827 · cited 1×
“To investigate a second biologically relevant microglial function we studied process motility by assessing process extensions towards an acute injury induced by a laser lesion [1,2].”
BackgroundATP mediates rapid microglial response to local brain injury in vivo
Davalos, D., Grutzendler, J., Yang, G., Kim, J. V., Zuo, Y., Jung, S., Littman, D. R., Dustin, M. L., & Gan, W.-B. (2005) · Nature Neuroscience · doi:10.1038/nn1472 · Cited by 3,913 · cited 3×
“Microglia respond to defined tissue injuries by extending their processes towards the lesion in an ATP-dependent fashion [2].”
BackgroundMethodMicroglia: Active sensor and versatile effector cells in the normal and pathologic brain
Hanisch, U.-K., & Kettenmann, H. (2007) · Nature Neuroscience · doi:10.1038/nn1997 · Cited by 3,676 · cited 1×
“process and the morphology of microglial cells does not necessarily match their functional state [14,15].”
BackgroundSelf-citationJung, S., Aliberti, J., Graemmel, P., Sunshine, M. J., Kreutzberg, G. W., Sher, A., & Littman, D. R. (2000) · Molecular and Cellular Biology · doi:10.1128/mcb.20.11.4106-4114.2000 · Cited by 2,632 · cited 2×
“1A and B and Videos S1 and S2), which were obtained by crossbreeding APPPS1 mice, a mouse model of cerebral amyloidosis [21] with Cx3cr1 mice [23], a mouse model that allows visualization of microglia.”
MethodMicroglia Shape Adult Hippocampal Neurogenesis through Apoptosis-Coupled Phagocytosis
Sierra, A., Encinas, J. M., Deudero, J. J. P., Chancey, J. H., Enikolopov, G., Overstreet-Wadiche, L. S., Tsirka, S. E., & Maletic-Savatic, M. (2010) · Cell Stem Cell · doi:10.1016/j.stem.2010.08.014 · Cited by 1,622 · cited 1×
“newborn neuroblasts [5].”
Wake, H., Moorhouse, A. J., Jinno, S., Kohsaka, S., & Nabekura, J. (2009) · The Journal of Neuroscience · doi:10.1523/jneurosci.4363-08.2009 · Cited by 1,619 · cited 1×
“neuronal structure [3,4].”
Two amyloid precursor protein transgenic mouse models with Alzheimer disease-like pathology
Sturchler-Pierrat, C., Abramowski, D., Duke, M., Wiederhold, K.-H., Mistl, C., Rothacher, S., Ledermann, B., Bürki, K., Frey, P., Paganetti, P. A., et al. (1997) · Proceedings of the National Academy of Sciences · doi:10.1073/pnas.94.24.13287 · Cited by 1,507 · cited 2×
“APP23 mice, which express APP with the Swedish mutation [22] were provided by Novartis, Basel, Switzerland.”
BackgroundMethodMicroglial Dysfunction and Defective β-Amyloid Clearance Pathways in Aging Alzheimer's Disease Mice
Hickman, S. E., Allison, E. K., & El Khoury, J. (2008) · The Journal of Neuroscience · doi:10.1523/jneurosci.0616-08.2008 · Cited by 1,329 · cited 4×
“Interestingly, expression of receptors and enzymes involved in microglial Ab-uptake and degradation is progressively downregulated in a transgenic mouse model of Alzheimer’s disease [20].”
BackgroundResultInfluentialMCGEER, P., & MCGEER, E. (1995) · Brain Research Reviews · doi:10.1016/0165-0173(95)00011-9 · Cited by 1,287 · cited 1×
“A number of in vitro studies have not only shown that administration of Ab stimulates the production of inflammatory cytokines and activation markers in microglial cells [8] but also triggers its uptake by receptor-mediated phagocytosis [16].”
BackgroundLee, J.-H., Yu, W. H., Kumar, A., Lee, S., Mohan, P. S., Peterhoff, C. M., Wolfe, D. M., Martinez-Vicente, M., Massey, A. C., Sovak, G., et al. (2010) · Cell · doi:10.1016/j.cell.2010.05.008 · Cited by 1,212
Cited by
Sorted by citations
Neuroinflammation in Alzheimer's disease
Heneka, M. T., Carson, M. J., Khoury, J. E., Landreth, G. E., Brosseron, F., Feinstein, D. L., Jacobs, A. H., Wyss-Coray, T., Vitorica, J., Ransohoff, R. M., et al. (2015) · The Lancet Neurology · doi:10.1016/s1474-4422(15)70016-5 · Cited by 6,226
“The sustained exposure to A β itself, chemokines, cytokines, and other inflammatory mediators seems responsible for the persistent functional impairment of microglial cells observed at plaque sites 40,41 .”
Self-citationInflammation as a central mechanism in Alzheimer's disease
Kinney, J. W., Bemiller, S. M., Murtishaw, A. S., Leisgang, A. M., Salazar, A. M., & Lamb, B. T. (2018) · Alzheimer's & Dementia: Translational Research & Clinical Interventions · doi:10.1016/j.trci.2018.06.014 · Cited by 2,253
Immune attack: the role of inflammation in Alzheimer disease
Heppner, F. L., Ransohoff, R. M., & Becher, B. (2015) · Nature Reviews Neuroscience · doi:10.1038/nrn3880 · Cited by 2,134
Self-citationMicroglia in physiology and disease
Wolf, S. A., Boddeke, H. W. G. M., & Kettenmann, H. (2017) · Annual Review of Physiology · doi:10.1146/annurev-physiol-022516-034406 · Cited by 1,426
Self-citationMicroglia and brain macrophages in the molecular age: from origin to neuropsychiatric disease
Prinz, M., & Priller, J. (2014) · Nature Reviews Neuroscience · doi:10.1038/nrn3722 · Cited by 1,329
Microglia development and function
Nayak, D., Roth, T. L., & McGavern, D. B. (2014) · Annual Review of Immunology · doi:10.1146/annurev-immunol-032713-120240 · Cited by 1,154
A systemic view of Alzheimer disease — insights from amyloid-β metabolism beyond the brain
Wang, J., Gu, B. J., Masters, C. L., & Wang, Y.-J. (2017) · Nature Reviews Neurology · doi:10.1038/nrneurol.2017.111 · Cited by 808
A Breakdown in Metabolic Reprogramming Causes Microglia Dysfunction in Alzheimer's Disease
Baik, S. H., Kang, S., Lee, W., Choi, H., Chung, S., Kim, J.-I., & Mook-Jung, I. (2019) · Cell Metabolism · doi:10.1016/j.cmet.2019.06.005 · Cited by 843
The blood-brain barrier in Alzheimer’s disease
Zenaro, E., Piacentino, G., & Constantin, G. (2017) · Neurobiology of Disease · doi:10.1016/j.nbd.2016.07.007 · Cited by 767
“…activation of microglia is accompanied by diminished phagocytosis and the more abundant secretion of pro-in fl ammatory cytokines, leading to the accumulation of A β and the ampli fi cation of neuroin fl ammation (El Khoury et al., 2007; Hickman et al., 2008; Krabbe et al., 2013; Heneka et al., 2015).”
Transcriptomic analysis of purified human cortical microglia reveals age-associated changes
Galatro, T. F., Holtman, I. R., Lerario, A. M., Vainchtein, I. D., Brouwer, N., Sola, P. R., Veras, M. M., Pereira, T. F., Leite, R. E. P., Möller, T., et al. (2017) · Nature Neuroscience · doi:10.1038/nn.4597 · Cited by 741
“Notably, microglial process motility directed toward site of damage was significantly impaired in mice with A β plaques 48 .”
BackgroundResultMicroglial dysfunction in brain aging and Alzheimer's disease
Mosher, K. I., & Wyss-Coray, T. (2014) · Biochemical Pharmacology · doi:10.1016/j.bcp.2014.01.008 · Cited by 618
“A recent study showed that microglial phagocytic capacity is impaired in late stages of cerebral amyloidosis [142], and in vitro studies using microglia cultured from adult animals have shown that aged microglia internalize less Ab peptide than young cells [113,143].”
BackgroundNew insights on the role of microglia in synaptic pruning in health and disease
Hong, S., Dissing-Olesen, L., & Stevens, B. (2016) · Current Opinion in Neurobiology · doi:10.1016/j.conb.2015.12.004 · Cited by 557
Madry, C., Kyrargyri, V., Arancibia-Cárcamo, I. L., Jolivet, R., Kohsaka, S., Bryan, R. M., & Attwell, D. (2018) · Neuron · doi:10.1016/j.neuron.2017.12.002 · Cited by 464
“, in models of Alzheimer’s disease with amyloid b plaque deposition (Koenigsknecht-Talboo et al., 2008; Krabbe et al., 2013; Condello et al., 2015) raises the question of whether the dependence of surveillance on THIK-1 activity can be employed therapeutically.”
BackgroundMicroglia and Astrocytes in Alzheimer's Disease: Implications for Therapy
Fakhoury, M. (2017) · Current Neuropharmacology · doi:10.2174/1570159x15666170720095240 · Cited by 502
“Consistent with the view that microglia are involved in Aβ clearance, impairment of microglia function in transgenic mice facilitates the progression of AD and results in increased Aβ accumulation in the brain [61, 62].”
BackgroundMarsh, S. E., Abud, E. M., Lakatos, A., Karimzadeh, A., Yeung, S. T., Davtyan, H., Fote, G. M., Lau, L., Weinger, J. G., Lane, T. E., et al. (2016) · Proceedings of the National Academy of Sciences · doi:10.1073/pnas.1525466113 · Cited by 411
“However, chronic activation of these cells shift microglia to a more proinflammatory and less phagocytic state (9, 10).”
BackgroundIl10 Deficiency Rebalances Innate Immunity to Mitigate Alzheimer-Like Pathology
Guillot-Sestier, M.-V., Doty, K. R., Gate, D., Rodriguez, J., Leung, B. P., Rezai-Zadeh, K., & Town, T. (2015) · Neuron · doi:10.1016/j.neuron.2014.12.068 · Cited by 363
“Microglial ‘‘paralysis’’ may be owed to increasing Ab burden with disease progression, as shown by others in vitro and in vivo (Korotzer et al., 1993; Krabbe et al., 2013; Michelucci et al., 2009).”
Targeting mi R‐155 restores abnormal microglia and attenuates disease in SOD 1 mice
Butovsky, O., Jedrychowski, M. P., Cialic, R., Krasemann, S., Murugaiyan, G., Fanek, Z., Greco, D. J., Wu, P. M., Doykan, C. E., Kiner, O., et al. (2015) · Annals of Neurology · doi:10.1002/ana.24304 · Cited by 358
Microglia: Agents of the CNS Pro-Inflammatory Response
Rodríguez-Gómez, J. A., Kavanagh, E., Engskog-Vlachos, P., Engskog, M. K. R., Herrera, A. J., Espinosa-Oliva, A. M., Joseph, B., Hajji, N., Venero, J. L., & Burguillos, M. A. (2020) · Cells · doi:10.3390/cells9071717 · Cited by 365
Microglia-Mediated Synapse Loss in Alzheimer's Disease
Rajendran, L., & Paolicelli, R. C. (2018) · The Journal of Neuroscience · doi:10.1523/jneurosci.1136-17.2017 · Cited by 355
“However, in vivo two-photon imaging studies have revealed that A deposition coincides with functional impairment of microglia, suggesting that, in advanced pathological stages, microglia become unable to remove and clear the amyloid burden (Krabbe et al., 2013).”
BackgroundThe Microbiota–Gut–Brain Axis and Alzheimer’s Disease: Neuroinflammation Is to Blame?
Megur, A., Baltriukienė, D., Bukelskienė, V., & Burokas, A. (2020) · Nutrients · doi:10.3390/nu13010037 · Cited by 323
“On the other hand, the activated microglia lose their phagocytic effect, thus decreasing the degree of Aβ phagocytosis, inevitably developing its accumulation [162].”
BackgroundStreit, W. J., Xue, Q.-S., Tischer, J., & Bechmann, I. (2014) · Acta Neuropathologica Communications · doi:10.1186/s40478-014-0142-6 · Cited by 317
“Multiple lines of evidence have suggested that amyloid plaques accumulate and persist because dysfunctional microglia are unable to remove them [3,56,161-163].”
BackgroundChronic stress and glucocorticoids: From neuronal plasticity to neurodegeneration
Vyas, S., Rodrigues, A. J., Silva, J. M., Tronche, F., Almeida, O. F. X., Sousa, N., & Sotiropoulos, I. (2016) · Neural Plasticity · doi:10.1155/2016/6391686 · Cited by 297
RETRACTED: Neuroinflammatory Markers: Key Indicators in the Pathology of Neurodegenerative Diseases
Rauf, A., Badoni, H., Abu‐Izneid, T., Olatunde, A., Rahman, M. M., Painuli, S., Semwal, P., Wilairatana, P., & Mubarak, M. S. (2022) · Molecules · doi:10.3390/molecules27103194 · Cited by 316
“At the same time, it was observed that the capacity of microglia to form pro-inflammatory cytokines is not altered [68,69].”
BackgroundRetractedNeuroinflammation in Alzheimer’s Disease
Onyango, I. G., Jauregui, G. V., Čarná, M., Bennett, J. P., & Stokin, G. B. (2021) · Biomedicines · doi:10.3390/biomedicines9050524 · Cited by 330
“In AD, the accumulation of Aβ throughout the brain results partly from the failure of microglia to remove extracellular Aβ [126–128] and AD cortical specimens reveal that the microglia surrounding plaques have impaired Aβ uptake [127,129,130].”
BackgroundMicroglial phenotypes in Parkinson’s disease and animal models of the disease
Joers, V., Tansey, M. G., Mulas, G., & Carta, A. R. (2017) · Progress in Neurobiology · doi:10.1016/j.pneurobio.2016.04.006 · Cited by 285
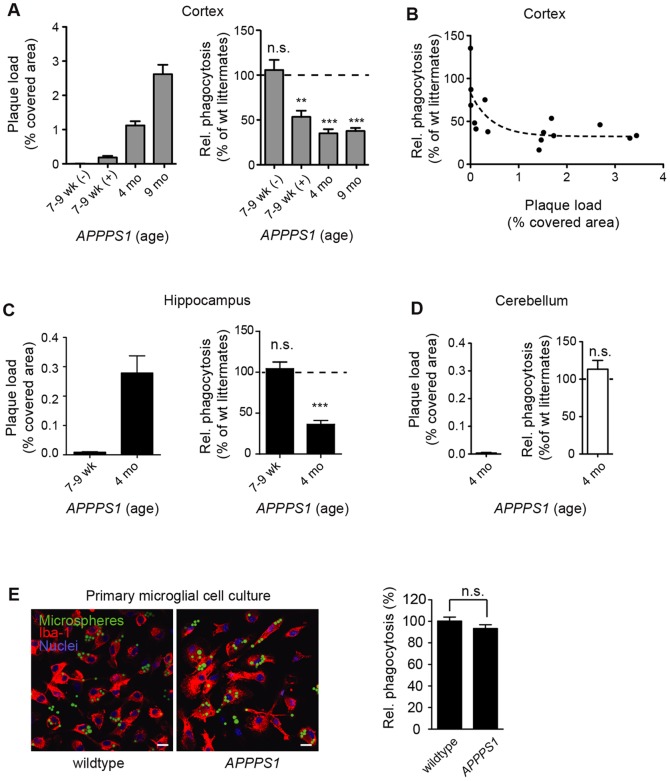
“Furthermore, in a mouse model of Alzheimer’s disease, the phagocytic capacity of microglia was reduced and inversely correlated to the Aβ plaque burden, suggesting that microglia function declined with severity of disease (Krabbe et al., 2013).”
BackgroundMicroglial translational profiling reveals a convergent APOE pathway from aging, amyloid, and tau
Kang, S. S., Ebbert, M. T. W., Baker, K. E., Cook, C., Wang, X., Sens, J. P., Kocher, J.-P., Petrucelli, L., & Fryer, J. D. (2018) · Journal of Experimental Medicine · doi:10.1084/jem.20180653 · Cited by 260
“3, E and F), suggesting that Cst7 induction in microglial cells may contribute to the decreased phagocytic activity observed during amyloidosis, tauopathy, or aging (Krabbe et al., 2013; Keren-Shaul et al., 2017; Koellhoffer et al., 2017; Salter and Stevens, 2017).”
BackgroundAging and Alzheimer's disease: comparison and associations from molecular to system level
Xia, X., Jiang, Q., McDermott, J., & Han, J. J. (2018) · Aging Cell · doi:10.1111/acel.12802 · Cited by 301
Microglia actions in Alzheimer's disease
Prokop, S., Miller, K. R., & Heppner, F. L. (2013) · Acta Neuropathologica · doi:10.1007/s00401-013-1182-x · Cited by 291
Self-citationLonnemann, N., Hosseini, S., Marchetti, C., Skouras, D. B., Stefanoni, D., D’Alessandro, A., Dinarello, C. A., & Korte, M. (2020) · Proceedings of the National Academy of Sciences · doi:10.1073/pnas.2009680117 · Cited by 298
“On the other hand, microglia cells react very sensitively to inflammatory processes by changing their morphological shape and have been consequently described as having an “ activated ” phenotype (36, 65, 66).”
The good, the bad, and the opportunities of the complement system in neurodegenerative disease
Schartz, N. D., & Tenner, A. J. (2020) · Journal of Neuroinflammation · doi:10.1186/s12974-020-02024-8 · Cited by 298
“come dysfunctional, and thus, the phagocytosis and clearance of Aß is reduced [169] while inflammation increases.”
BackgroundMicroglia and the aging brain: are senescent microglia the key to neurodegeneration?
Angelova, D. M., & Brown, D. R. (2019) · Journal of Neurochemistry · doi:10.1111/jnc.14860 · Cited by 262
“It is possible that iron accumulation in microglia could be a protective mechanism from iron toxicity in the brain which then can proceed to damage the microglia themselves and induce the accelerated aging signature seen in neurodegeneration (Krabbe et al. 2013).”
BackgroundClearance of cerebral Aβ in Alzheimer’s disease: reassessing the role of microglia and monocytes
Zuroff, L. R., Daley, D. A., Black, K. L., & Koronyo‐Hamaoui, M. (2017) · Cellular and Molecular Life Sciences · doi:10.1007/s00018-017-2463-7 · Cited by 292
Blood-brain barrier permeability and physical exercise
Małkiewicz, M. A., Szarmach, A., Sabisz, A., Cubała, W. J., Szurowska, E., & Winklewski, P. J. (2019) · Journal of Neuroinflammation · doi:10.1186/s12974-019-1403-x · Cited by 276
Beyond Activation: Characterizing Microglial Functional Phenotypes
Lier, J., Streit, W. J., & Bechmann, I. (2021) · Cells · doi:10.3390/cells10092236 · Cited by 274
Microglia in Alzheimer Disease: Well-Known Targets and New Opportunities
Hemonnot, A.-L., Hua, J., Ulmann, L., & Hirbec, H. (2019) · Frontiers in Aging Neuroscience · doi:10.3389/fnagi.2019.00233 · Cited by 298
Unger, M. S., Li, E., Scharnagl, L., Poupardin, R., Altendorfer, B., Mrowetz, H., Hutter-Paier, B., Weiger, T. M., Heneka, M. T., Attems, J., et al. (2020) · Brain, Behavior, and Immunity · doi:10.1016/j.bbi.2020.05.070 · Cited by 248
Innate Immune Cell Death in Neuroinflammation and Alzheimer’s Disease
Rajesh, Y., & Kanneganti, T. (2022) · Cells · doi:10.3390/cells11121885 · Cited by 269
Lee, J.-W., Nam, H., Kim, L. E., Jeon, Y., Min, H., Ha, S., Lee, Y., Kim, S.-Y., Lee, S. J., Kim, E.-K., et al. (2019) · Autophagy · doi:10.1080/15548627.2018.1556946 · Cited by 260
“Notably, in the brains of patients with neurodegenerative diseases such as AD, the ability of microglia to phagocytose and degrade Aβ is reduced [54,67,68].”
BackgroundThe Impact of Disease Comorbidities in Alzheimer’s Disease
Santiago, J. A., & Potashkin, J. A. (2021) · Frontiers in Aging Neuroscience · doi:10.3389/fnagi.2021.631770 · Cited by 259
Neuroinflammation in Alzheimer’s disease
Zhang, F., & Jiang, L. (2015) · Neuropsychiatric Disease and Treatment · doi:10.2147/ndt.s75546 · Cited by 276
“Major microglial functions progressively decline with the appearance of Aβ plaques in AD, and lowering Aβ burden could reverse this functional impairment.(36) Microglia interact with Aβ, overproduction of inflammatory cytokines (IL-1β, TNF-α, IL-6) and substances released by dying neurons, activated β-secretase-1 (BAC…”
BackgroundHussain, B., Fang, C., & Chang, J. (2021) · Frontiers in Neuroscience · doi:10.3389/fnins.2021.688090 · Cited by 255
Davies, D. S., Ma, J., Jegathees, T., & Goldsbury, C. (2017) · Brain Pathology · doi:10.1111/bpa.12456 · Cited by 251
Immune hyperreactivity of Aβ plaque-associated microglia in Alzheimer's disease
Yin, Z., Raj, D., Saiepour, N., Van Dam, D., Brouwer, N., Holtman, I. R., Eggen, B. J. L., Möller, T., Tamm, J. A., Abdourahman, A., et al. (2017) · Neurobiology of Aging · doi:10.1016/j.neurobiolaging.2017.03.021 · Cited by 238
“On the other hand, microglia show a pronounced reduction in motility (Krabbe et al., 2013) and reduced phagocytic capacity in brain slice cultures (Hellwig et al., 2015).”
Progranulin protects against amyloid β deposition and toxicity in Alzheimer's disease mouse models
Minami, S. S., Min, S.-W., Krabbe, G., Wang, C., Zhou, Y., Asgarov, R., Li, Y., Martens, L. H., Elia, L. P., Ward, M. E., et al. (2014) · Nature Medicine · doi:10.1038/nm.3672 · Cited by 237
Self-citationMorris, G. P., Clark, I. A., Zinn, R., & Vissel, B. (2013) · Neurobiology of Learning and Memory · doi:10.1016/j.nlm.2013.07.002 · Cited by 236
“, 2004), and this correlates with amyloid-b deposition (Krabbe et al., 2013).”
BackgroundBaik, S. H., Kang, S., Son, S. M., & Mook-Jung, I. (2016) · Glia · doi:10.1002/glia.23074 · Cited by 234
“Furthermore, several studies have shown that microglia are impaired func- tionally and physiologically in AD (Brawek et al., 2014; Krabbe et al., 2013; Zhang et al., 2014).”
BackgroundTargeting Neuroinflammation to Treat Alzheimer’s Disease
Ardura-Fabregat, A., Boddeke, E., Boza‐Serrano, A., Brioschi, S., Castro‐Gomez, S., Ceyzériat, K., Dansokho, C., Dierkes, T., Gelders, G., Heneka, M. T., et al. (2017) · CNS Drugs · doi:10.1007/s40263-017-0483-3 · Cited by 241
“specimens from patients with AD, the microglia surrounding plaques are impaired at Ab uptake [15, 17, 18].”
BackgroundThe dynamics of monocytes and microglia in Alzheimer’s disease
Thériault, P., ElAli, A., & Rivest, S. (2015) · Alzheimer s Research & Therapy · doi:10.1186/s13195-015-0125-2 · Cited by 237
Mattei, D., Ivanov, A., Ferrai, C., Jordan, P., Guneykaya, D., Buonfiglioli, A., Schaafsma, W., Przanowski, P., Deuther-Conrad, W., Brust, P., et al. (2017) · Translational Psychiatry · doi:10.1038/tp.2017.80 · Cited by 222
Self-citationBenarroch, E. E. (2013) · Neurology · doi:10.1212/wnl.0b013e3182a4a577 · Cited by 232
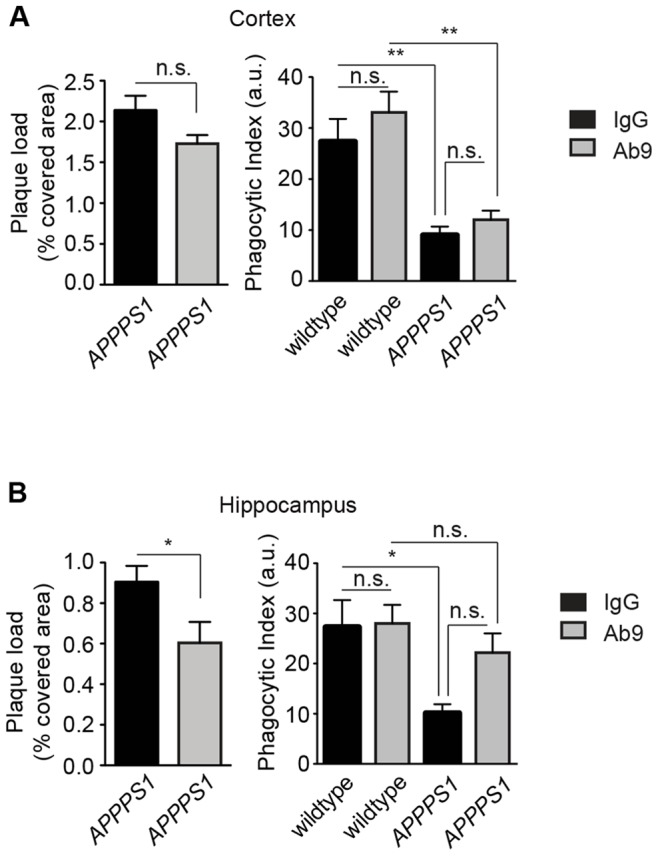
“Studies using acute brain slice preparations from mice with AD-like pathology show that impaired motility and phagocytic activity of microglia correlated with Ab plaque burden and could be restored by decreasing this burden by Ab vaccination.(81) These findings provide a rationale for promoting perivascular macrophage…”
Microglia contribute to the propagation of Aβ into unaffected brain tissue
d’Errico, P., Ziegler-Waldkirch, S., Aires, V., Hoffmann, P., Mezö, C., Erny, D., Monasor, L. S., Liebscher, S., Ravi, V. M., Joseph, K., et al. (2022) · Nature Neuroscience · doi:10.1038/s41593-021-00951-0 · Cited by 214
Beclin1‐driven autophagy modulates the inflammatory response of microglia via NLRP3
Houtman, J., Freitag, K., Gimber, N., Schmoranzer, J., Heppner, F. L., & Jendrach, M. (2019) · The EMBO Journal · doi:10.15252/embj.201899430 · Cited by 213
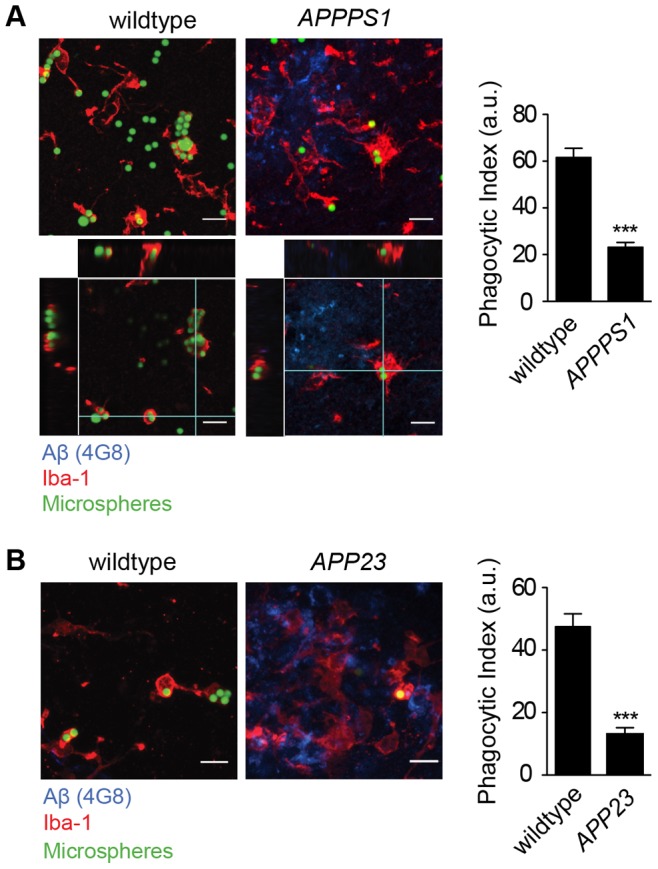
“The sum of the products in each group was then termed and displayed as phagocytic index (Krabbe et al , 2013).”
Self-citationThe role of the immune system in Alzheimer disease: Etiology and treatment
Jevtic, S. D., Sengar, A. S., Salter, M. W., & McLaurin, J. (2017) · Ageing Research Reviews · doi:10.1016/j.arr.2017.08.005 · Cited by 224
Microglia Gone Rogue: Impacts on Psychiatric Disorders across the Lifespan
Tay, T. L., Béchade, C., D’Andrea, I., St‐Pierre, M., Henry, M. S., Roumier, A., & Tremblay, M. (2018) · Frontiers in Molecular Neuroscience · doi:10.3389/fnmol.2017.00421 · Cited by 217
“Using acute hippocampal slices from 7 to 9-week old APP/PS1 mice, the phagocytic ability of microglia was also shown to be compromised in amyloid β plaque-burdened areas specifically (Krabbe et al., 2013).”
BackgroundOxidized cholesterol as the driving force behind the development of Alzheimer’s disease
Gamba, P., Testa, G., Gargiulo, S., Staurenghi, E., Poli, G., & Leonarduzzi, G. (2015) · Frontiers in Aging Neuroscience · doi:10.3389/fnagi.2015.00119 · Cited by 180
“Potentially these oxysterols, as well as other cholesterol metabolites, can cross the BBB.”
BackgroundChen, T., Dai, Y., Hu, C., Lin, Z., Wang, S., Yang, J., Zeng, L., Li, S., & Li, W. (2024) · Fluids and Barriers of the CNS · doi:10.1186/s12987-024-00557-1 · Cited by 205
“However, prolonged inflammation impairs the microglial cells’ ability to bind and phagocytose Aβ, diminishes the activity of Aβ-degrading enzymes, and weakens their capacity to disintegrate Aβ plaques [199, 200].”
BackgroundSong, C., Shieh, C., Wu, Y.-S., Kalueff, A. V., Gaikwad, S., & Su, K. (2016) · Progress in Lipid Research · doi:10.1016/j.plipres.2015.12.003 · Cited by 196
New role of P2X7 receptor in an Alzheimer’s disease mouse model
Martin, E., Amar, M., Dalle, C., Youssef, I., Boucher, C., Le Duigou, C., Brückner, M., Prigent, A., Sazdovitch, V., Halle, A., et al. (2019) · Molecular Psychiatry · doi:10.1038/s41380-018-0108-3 · Cited by 187
“Microglial phagocytic activity was quantified in acute brain slices from 16-month-old male mice, as previously described [33].”
BackgroundMethodSelf-citationFerretti, M. T., Merlini, M., Späni, C. B., Gericke, C., Schweizer, N., Enzmann, G. U., Engelhardt, B., Kulic, L., Suter, T. B., & Nitsch, R. M. (2016) · Brain Behavior and Immunity · doi:10.1016/j.bbi.2016.02.009 · Cited by 180
Astrocytic phagocytosis is a compensatory mechanism for microglial dysfunction
Konishi, H., Okamoto, T., Hara, Y., Komine, O., Tamada, H., Maeda, M., Osako, F., Kobayashi, M., Nishiyama, A., Kataoka, Y., et al. (2020) · The EMBO Journal · doi:10.15252/embj.2020104464 · Cited by 179
“In addition to epileptic injury, dysfunction of microglial phagocytosis is suggested to be associated with neurodegenerative diseases such as Alzheimer’s disease (Krabbe et al, 2013; Lucin et al, 2013; Gabande-Rodriguez et al, 2020).”
BackgroundYoung microglia restore amyloid plaque clearance of aged microglia
Daria, A., Colombo, A., Llovera, G., Hampel, H., Willem, M., Liesz, A., Haass, C., & Tahirovic, S. (2017) · The EMBO Journal · doi:10.15252/embj.201694591 · Cited by 174
“Several studies proposed that microglia/macrophages are involved in the clearance of A b (Rogers et al , 2002; Simard et al , 2006; El Khoury et al , 2007; Bolmont et al , 2008; Lee & Landreth, 2010; Liu et al , 2010; Krabbe et al , 2013).”
Nuclear Receptors License Phagocytosis by Trem2+Myeloid Cells in Mouse Models of Alzheimer's Disease
Savage, J. C., Jay, T., Goduni, E., Quigley, C., Mariani, M. M., Malm, T., Ransohoff, R. M., Lamb, B. T., & Landreth, G. E. (2015) · The Journal of Neuroscience · doi:10.1523/jneurosci.4586-14.2015 · Cited by 154
“9A,B), as previously reported in APPPS1 and APP23 mice (Krabbe et al., 2013).”
BackgroundMethodInfluentialHypothalamic innate immune reaction in obesity
Kälin, S., Heppner, F. L., Bechmann, I., Prinz, M., Tschöp, M. H., & Yi, C.-X. (2015) · Nature Reviews Endocrinology · doi:10.1038/nrendo.2015.48 · Cited by 167
Self-citationGuedes, J. R., Custódia, C. M., Silva, R. J., de Almeida, L. P., Pedroso de Lima, M. C., & Cardoso, A. L. (2014) · Human Molecular Genetics · doi:10.1093/hmg/ddu348 · Cited by 170
Microglia plasticity during health and disease: An immunological perspective
Shemer, A., Erny, D., Jung, S., & Prinz, M. (2015) · Trends in Immunology · doi:10.1016/j.it.2015.08.003 · Cited by 168
Martin, E., Boucher, C., Fontaine, B., & Delarasse, C. (2017) · Aging Cell · doi:10.1111/acel.12522 · Cited by 156
“Experimental models using bone marrow chimeric mice or microglial ablation systems have shown that microglia appear to have a deficient role in AD with motility and phagocytic activities impaired (Grathwohl et al., 2009; Krabbe et al., 2013), while MDM seem to contribute more efficiently to the elimination of Ab plaqu…”
BackgroundInfluentialThe NLRP3 inflammasome triggers sterile neuroinflammation and Alzheimer’s disease
Milner, M. T., Maddugoda, M. P., Götz, J., Burgener, S. S., & Schroder, K. (2020) · Current Opinion in Immunology · doi:10.1016/j.coi.2020.10.011 · Cited by 162
Prostaglandin signaling suppresses beneficial microglial function in Alzheimer’s disease models
Johansson, J. U., Woodling, N. S., Wang, Q., Panchal, M., Liang, X., Trueba-Saiz, A., Brown, H. D., Mhatre, S. D., Loui, T., & Andreasson, K. I. (2015) · Journal of Clinical Investigation · doi:10.1172/jci77487 · Cited by 161
“Moreover, prolonged exposure to proinflammatory cytokines or accumulating A β 42 peptides cause microglia to lose their normal abilities to clear toxic proteins and control inflammation (13, 14), a detrimental phenotype in the context of age-associated A β 42 accumulation.”
Microglia change from a reactive to an age-like phenotype with the time in culture
Caldeira, C., Oliveira, A. F., Cunha, C., Vaz, A. R., Falcão, A. S., Fernandes, A., & Brites, D. (2014) · Frontiers in Cellular Neuroscience · doi:10.3389/fncel.2014.00152 · Cited by 156
“In addition, these cells were analyzed either 24–48 h after isolation (Njie et al., 2012; Lai et al., 2013) or following trypsinization when kept in culture for several weeks in the presence of conditioned medium containing increased levels of mitogens (von Bernhardi et al., 2011).”
BackgroundMethodResultInfluentialNeuroinflammation as a Key Driver of Secondary Neurodegeneration Following Stroke?
Stuckey, S. M., Ong, L. K., Collins‐Praino, L. E., & Turner, R. J. (2021) · International Journal of Molecular Sciences · doi:10.3390/ijms222313101 · Cited by 162
“Specifically, an Alzheimer’s study in APPPS1 mice (a transgenic mouse model of cerebral amyloidosis) found that microglial directed process extension and phagocytic activity were strongly impaired in mice with Alzheimer’s diseaselike pathology [213].”
BackgroundGenetics of Alzheimer's Disease
Guerreiro, R. J., & Hardy, J. (2014) · Neurotherapeutics · doi:10.1007/s13311-014-0295-9 · Cited by 168
“In AD, microglial cells are attracted to βamyloid plaques, produce elevated levels of proinflammatory cytokines and reactive oxygen species, and exhibit a change in morphology [38].”
BackgroundBoyd, R. J., Avramopoulos, D., Jantzie, L. L., & McCallion, A. S. (2022) · Journal of Neuroinflammation · doi:10.1186/s12974-022-02584-x · Cited by 168
Microglial amyloid beta clearance is driven by PIEZO1 channels
Jäntti, H., Sitnikova, V., Ishchenko, Y., Shakirzyanova, A., Giudice, L., Ugidos, I. F., Gómez‐Budia, M., Korvenlaita, N., Ohtonen, S., Belaya, I., et al. (2022) · Journal of Neuroinflammation · doi:10.1186/s12974-022-02486-y · Cited by 164
“Sustained exposure to Aβ, cytokines and other inflammatory mediators appear to cause permanent impairment in microglial function at the plaque sites [77] manifested by impairment in motility and phagocytosis in mice with AD phenotype [78].”
BackgroundMicroglia inflict delayed brain injury after subarachnoid hemorrhage
Schneider, U. C., Davids, A., Brandenburg, S., Müller, A., Elke, A., Magrini, S., Atangana, E. N., Turkowski, K., Finger, T., Gutenberg, A., et al. (2015) · Acta Neuropathologica · doi:10.1007/s00401-015-1440-1 · Cited by 155
“Microglia have been discussed to play pivotal roles in CNS pathologies like Alzheimer’s disease, autoimmune encephalomyelitis, traumatic brain injury and ischemic stroke [4, 8, 32, 38], where microglia fulfill their pleiotropic roles as cells of the innate immune system, including antigen presentation, phagocytosis an…”
BackgroundSelf-citationMicroglial inflammation and phagocytosis in Alzheimer's disease: Potential therapeutic targets
Nizami, S., Hall‐Roberts, H., Warrier, S., Cowley, S. A., & Di Daniel, E. (2019) · British Journal of Pharmacology · doi:10.1111/bph.14618 · Cited by 147
“There are a large number of factors that can contribute to the extracellular build‐ up of Aβ aggregates in AD brains, one of which may be reduced microglial phagocytosis, which is observed in rodent models (Krabbe et al., 2013).”
BackgroundMicroglial polarization: novel therapeutic mechanism against Alzheimer’s disease
Yao, K., & Zu, H. (2019) · Inflammopharmacology · doi:10.1007/s10787-019-00613-5 · Cited by 150
Molecular Mechanisms of Microglial Motility: Changes in Ageing and Alzheimer’s Disease
Franco-Bocanegra, D. K., McAuley, C., Nicoll, J. A. R., & Boche, D. (2019) · Cells · doi:10.3390/cells8060639 · Cited by 147
“In situ experiments using acute brain slices demonstrated that the speed of microglial process motility was reduced in the APPPS1 compared to control mice after a laser insult [108].”
BackgroundFibrillar Aβ triggers microglial proteome alterations and dysfunction in Alzheimer mouse models
Sebastian Monasor, L., Müller, S. A., Colombo, A. V., Tanrioever, G., König, J., Roth, S., Liesz, A., Berghofer, A., Piechotta, A., Prestel, M., et al. (2020) · eLife · doi:10.7554/elife.54083 · Cited by 147
Salminen, A. (2023) · Journal of Molecular Medicine · doi:10.1007/s00109-023-02289-5 · Cited by 161
Bolton, J. L., Short, A. K., Othy, S., Kooiker, C. L., Shao, M., Gunn, B. G., Beck, J., Bai, X., Law, S. M., Savage, J. C., et al. (2022) · Cell Reports · doi:10.1016/j.celrep.2022.110600 · Cited by 158
“Whereas reduced microglial process dynamics has been associated with diminished “surveillance” of neurons and blunted microglial function (Abiega et al., 2016; Damani et al., 2011; Krabbe et al., 2013), it remains unclear whether these deficits in ELA microglia abutting CRH+ neurons result in deficient synapse engulfm…”
BackgroundKorvatska, O., Leverenz, J. B., Jayadev, S., McMillan, P., Kurtz, I., Guo, X., Rumbaugh, M., Matsushita, M., Girirajan, S., Dorschner, M. O., et al. (2015) · JAMA Neurology · doi:10.1001/jamaneurol.2015.0979 · Cited by 137
Brelstaff, J. H., Mason, M., Katsinelos, T., McEwan, W. A., Ghetti, B., Tolkovsky, A. M., & Spillantini, M. G. (2021) · Science Advances · doi:10.1126/sciadv.abg4980 · Cited by 135
Crashing the computer: apoptosis vs. necroptosis in neuroinflammation
Heckmann, B. L., Tummers, B., & Green, D. R. (2018) · Cell Death and Differentiation · doi:10.1038/s41418-018-0195-3 · Cited by 136
Inflammatory aspects of Alzheimer’s disease
Lucena, P. B., & Heneka, M. T. (2024) · Acta Neuropathologica · doi:10.1007/s00401-024-02790-2 · Cited by 152
“Furthermore, Aβ clearance seems to be impaired not only in late but early onset forms of AD [149, 178], and its regulation and effectiveness may depend on factors such as age or stage of the disease [122].”
Microglial Malfunction: The Third Rail in the Development of Alzheimer's Disease
Mhatre, S. D., Tsai, C. A., Rubin, A. J., James, M. L., & Andreasson, K. I. (2015) · Trends in Neurosciences · doi:10.1016/j.tins.2015.08.006 · Cited by 134
“However, exposure to accumulating Ab peptides leads to loss of these crucial microglial functions, resulting in a persistent proinflammatory state and failure to clear misfolded proteins [92,93].”
Heat-Shock Proteins in Neuroinflammation
Dukay, B., Csoboz, B., & Tóth, M. E. (2019) · Frontiers in Pharmacology · doi:10.3389/fphar.2019.00920 · Cited by 139
“In vitro and transgenic mouse studies showed that healthy microglia can help to remove dysfunctional neuronal cells and restrain the progression of the disease (Kraft et al., 2012; Benraiss et al., 2016).”
BackgroundMicroglial P2Y12 receptors regulate microglial activation and surveillance during neuropathic pain
Gu, N., Eyo, U. B., Murugan, M., Peng, J., Matta, S., Dong, H., & Wu, L. (2015) · Brain Behavior and Immunity · doi:10.1016/j.bbi.2015.11.007 · Cited by 135
“A few factors regulating microglial surveillance have been recognised including neuronal activity in general (Fontainhas et al., 2011; Li et al., 2012; Nimmerjahn et al., 2005; Tremblay et al., 2010) as well as through specific molecules including purines (Davalos et al., 2005; Kurpius et al., 2007; Orr et al., 2009)…”
Götzl, J. K., Brendel, M., Werner, G., Parhizkar, S., Sebastian Monasor, L., Kleinberger, G., Colombo, A., Deussing, M., Wagner, M., Winkelmann, J., et al. (2019) · EMBO Molecular Medicine · doi:10.15252/emmm.201809711 · Cited by 118
“On the other hand, during aging wild-type microglia in an AD mouse model lose their motility and phagocytic activity (Krabbe et al, 2013) although they express a neurodegenerative disease-associated mRNA profile (Krasemann et al, 2017).”
BackgroundCerovic, M., Forloni, G., & Balducci, C. (2019) · Frontiers in Aging Neuroscience · doi:10.3389/fnagi.2019.00284 · Cited by 127
“In addition, activated microglia loses their phagocytic properties, thus reducing the degree of Aβ phagocytosis, and consequently promoting its accumulation (Krabbe et al., 2013).”
BackgroundSubramanian, J., Savage, J. C., & Tremblay, M. (2020) · Frontiers in Cellular Neuroscience · doi:10.3389/fncel.2020.592607 · Cited by 127
Targeting innate immunity for neurodegenerative disorders of the central nervous system
Andreasson, K. I., Bachstetter, A. D., Colonna, M., Ginhoux, F., Holmes, C., Lamb, B., Landreth, G., Lee, D. C., Low, D., Lynch, M. A., et al. (2016) · Journal of Neurochemistry · doi:10.1111/jnc.13667 · Cited by 126
Systemic inflammation regulates microglial responses to tissue damage in vivo
Gyoneva, S., Davalos, D., Biswas, D., Swanger, S. A., Garnier‐Amblard, E. C., Loth, F., Akassoglou, K., & Traynelis, S. F. (2014) · Glia · doi:10.1002/glia.22686 · Cited by 131
“Consistent with our findings Gyoneva et al.: Microglial Motility in LPS-Treated Mice August 2014 1357 with systemic activation, microglia in an animal model of AD, which are locally activated by the ongoing Ab pathology, also show a reduced response to laser ablation (Krabbe et al., 2013).”
BackgroundResultBoza‐Serrano, A., Yang, Y., Paulus, A., & Deierborg, T. (2018) · Scientific Reports · doi:10.1038/s41598-018-19699-y · Cited by 131
Teter, B., Morihara, T., Lim, G. P., Chu, T., Jones, M. R., Zuo, X., Paul, R. M., Frautschy, S. A., & Cole, G. M. (2019) · Neurobiology of Disease · doi:10.1016/j.nbd.2019.02.015 · Cited by 127
“, 2002), clearance fails with chronic inflammation and the onset of amyloid plaques (Hickman et al., 2008; Krabbe et al., 2013).”
BackgroundDifferential contribution of microglia and monocytes in neurodegenerative diseases
Baufeld, C., O'Loughlin, E. K., Calcagno, N., Madore, C., & Butovsky, O. (2017) · Journal of Neural Transmission · doi:10.1007/s00702-017-1795-7 · Cited by 128
“This might be because they are impaired in their phagocytic function by the presence of Ab, chronic inflammation, or an age-linked dysfunction (Streit et al. 2004; Hickman et al. 2013; Krabbe et al. 2013).”
BackgroundInflammatory mechanisms in neurodegeneration
Nichols, M. R., St‐Pierre, M., Wendeln, A., Makoni, N. J., Gouwens, L. K., Garrad, E. C., Sohrabi, M., Neher, J. J., Tremblay, M., & Combs, C. K. (2019) · Journal of Neurochemistry · doi:10.1111/jnc.14674 · Cited by 129
“For example, various studies demonstrated impairments in microglial phagocytosis in AD models (Floden and Combs 2011; Krabbe et al. 2013; Wildsmith et al. 2013).”
ResultUltrastructural evidence of microglial heterogeneity in Alzheimer’s disease amyloid pathology
El Hajj, H., Savage, J. C., Bisht, K., Parent, M., Vallières, L., Rivest, S., & Tremblay, M.-È. (2019) · Journal of Neuroinflammation · doi:10.1186/s12974-019-1473-9 · Cited by 119
Genetic targeting of microglia
Wieghofer, P., Knobeloch, K., & Prinz, M. (2014) · Glia · doi:10.1002/glia.22727 · Cited by 118
“Examples include Alzheimer’s disease (AD) (Cho et al., 2011; Fuhrmann et al., 2010; Krabbe et al., 2013; Lee et al., 2010), Parkinson’s disease (PD) (Cardona et al.”
BackgroundInhomogeneous distribution of Iba‐1 characterizes microglial pathology in Alzheimer's disease
Tischer, J., Krueger, M., Mueller, W. C., Staszewski, O., Prinz, M., Streit, W. J., & Bechmann, I. (2016) · Glia · doi:10.1002/glia.23024 · Cited by 121
“, 1993), and a recent study demonstrates a form of paralysis of microglia near to amyloid deposits using twophoton life-imaging in APPPS1 and APP23 mice (Krabbe et al., 2013).”
BackgroundInfluentialInflammatory Events Following Subarachnoid Hemorrhage (SAH)
Schneider, U. C., Xu, R., & Vajkoczy, P. (2018) · Current Neuropharmacology · doi:10.2174/1570159x16666180412110919 · Cited by 120
Metadata
- Authors
- Krabbe, G., Halle, A., Matyash, V., Rinnenthal, J. L., Eom, G. D., Bernhardt, U., Miller, K. R., Prokop, S., Kettenmann, H., & Heppner, F. L.
- Affiliations
- Max Delbrück Center (DE)
- Center of Advanced European Studies and Research (DE)
- Charité – Universitätsmedizin Berlin (DE)
- Corresponding author
- Kettenmann, Helmut
- Heppner, Frank L.
- Venue
- PLoS ONE
- Publisher
- Public Library of Science (PLoS)
- Published
- 2013-04-08
- Volume
- 8
- Issue
- 4
- Pages
- e60921
- ISSN
- 1932-6203 (ISSN-L)
- PMC
- PMC3620049
- OpenAlex
- W2044090829
- Cited by
- 478
- References
- 41
- Citations by year
- 2026: 15 · 2025: 29 · 2024: 31 · 2023: 25 · 2022: 44 · 2021: 56 · 2020: 40 · 2019: 41 · 2018: 38 · 2017: 38 · 2016: 33 · 2015: 39 · 2014: 34 · 2013: 13
- FWCI
- 22.45
- Type
- journal article
- Language
- en
- Open access
- gold
- doi.org
- Locations
- PLoS ONE (publishedVersion, cc-by)
- Europe PMC (PubMed Central) (publishedVersion, other-oa)
- PubMed Central (publishedVersion, cc-by)
- PubMed (publishedVersion)
- MDC Repository (Max-Delbrueck-Center for Molecular Medicine) (acceptedVersion)
- MPG.PuRe (Max Planck Society) (submittedVersion)
- DOAJ (DOAJ: Directory of Open Access Journals) (submittedVersion, cc-by-sa)
- Max Planck Digital Library (submittedVersion)
- Figshare (submittedVersion, cc-by)
- Funders
- European Commission (FP7 HEALTH)
- Deutsche Forschungsgemeinschaft (SFB TRR 43, NeuroCure EXC257, GRK1258, EXC257)
- Jung-Stiftung für Wissenschaft und Forschung
- National Institutes of Health
- National Institute of Neurological Disorders and Stroke (R01NS046006, NS046006)
- FP7 Health
- Topics
- Life Sciences › Neuroscience › Neurology › Neuroinflammation and Neurodegeneration Mechanisms
- Life Sciences › Neuroscience › Cellular and Molecular Neuroscience › Alzheimer's disease research and treatments
- Life Sciences › Neuroscience › Neurology › Neurological Disease Mechanisms and Treatments
- Keywords
- microglia, Alzheimer's disease, amyloid plaques, microglial activation, microglial phagocytosis, mouse models of Alzheimer's disease
- MeSH terms
- Alzheimer Disease, Animals, Cell Movement, Disease Models, Animal, Female, Humans, Male, Mice, Transgenic, Mutation, Phagocytosis, Amyloid beta-Peptides, Protein Structure, Secondary, Microglia, Mice, Protein Multimerization, Plaque, Amyloid, Spatio-Temporal Analysis
About these checks
Registry, retraction, Cites and statistics results are computed, not judged, with one exception: a printed reference that no index lists is read once by a model before it counts as a citation error. Claims are extracted by a model and kept only when their quote appears verbatim in the text; each cited source is then checked, with a model’s help, for whether it says what the claim relies on. Those verdicts can be wrong — read the claim’s quote and the cited source before relying on one.
Statistics and arithmetic are recomputed, not judged.
Confidence bands are shown only for fields calibrated on our annotated test set. None is calibrated yet, so no band is shown.
What counts as a claim ›How we measure confidence ›How we check this ›
Are you an author, or do you see a problem with this page? Request a review
