Cited by 39

The DOI matches its Crossref record; 11 of the 11 references it cites were found in a registry or an index.

A microRNA negative feedback loop downregulates vesicle transport and inhibits fear memory

Mathew, Rebecca S, Tatarakis, Antonis, Rudenko, Andrii, Johnson-Venkatesh, Erin M, Yang, Yawei J, Murphy, Elisabeth A, Todd, Travis P, Schepers, Scott T, Siuti, Nertila, Martorell, Anthony J, Falls, William A, Hammack, Sayamwong E, Walsh, Christopher A, Tsai, Li-Huei, Umemori, Hisashi, Bouton, Mark E, Moazed, Danesh·2016·eLife

Abstract

The SNARE-mediated vesicular transport pathway plays major roles in synaptic remodeling associated with formation of long-term memories, but the mechanisms that regulate this pathway during memory acquisition are not fully understood. Here we identify miRNAs that are up-regulated in the rodent hippocampus upon contextual fear-conditioning and identify the vesicular transport and synaptogenesis pathways as the major targets of the fear-induced miRNAs. We demonstrate that miR-153, a member of this group, inhibits the expression of key components of the vesicular transport machinery, and down-regulates Glutamate receptor A1 trafficking and neurotransmitter release. MiR-153 expression is specifically induced during LTP induction in hippocampal slices and its knockdown in the hippocampus of adult mice results in enhanced fear memory. Our results suggest that miR-153, and possibly other fear-induced miRNAs, act as components of a negative feedback loop that blocks neuronal hyperactivity at least partly through the inhibition of the vesicular transport pathway.

Overview

The claims and statistics of this paper haven’t been checked yet.

Run the check — free, no account needed. It reads the open-access text and checks the sources it cites.

A few free checks a day · papers already verified open instantly · results are public

Integrity signals

Registry

Crossref · 10.7554/elife.22467

Cites

11 of 11 references verified0 citation errors · 0 not checkable

Statistics

Figures
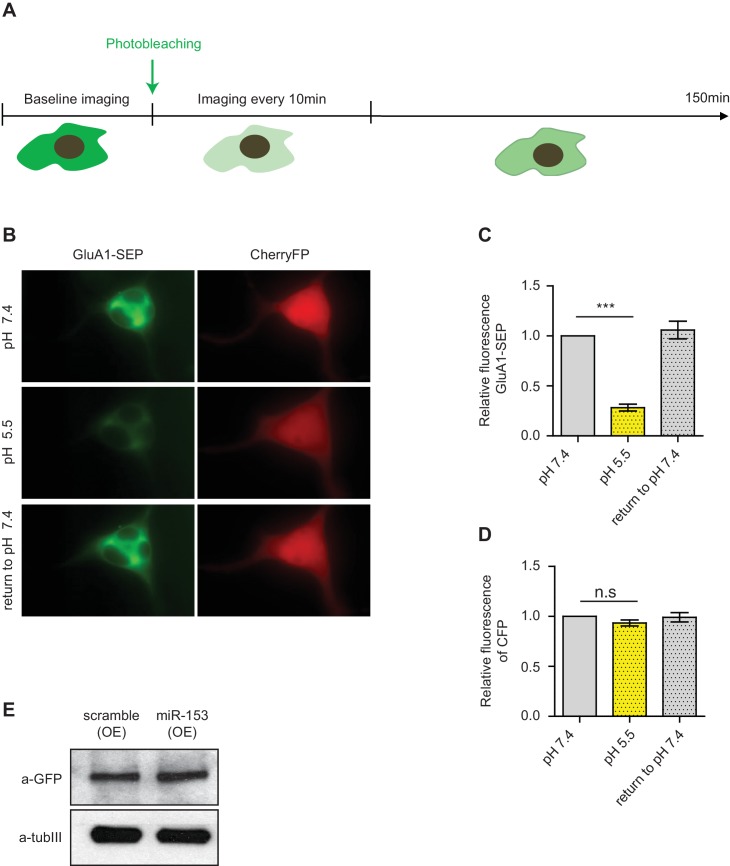
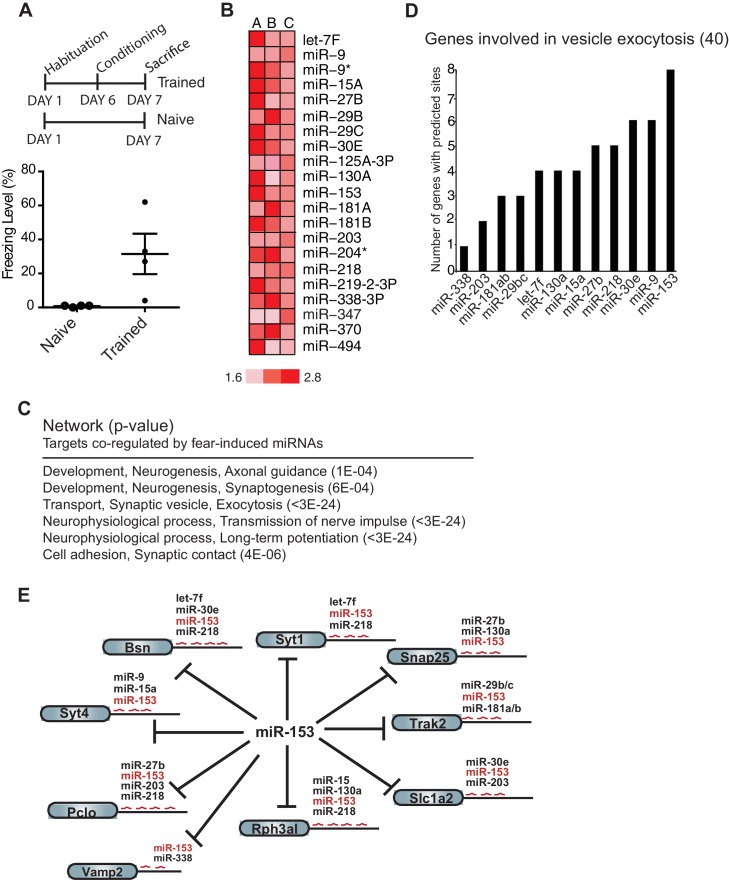
Figure 1. Expression profiling of miRNAs reveals 21 miRNAs that are induced in the hippocampus of adult rats 24 hr post-contextual fear conditioning. (A) Schematic representation of contextual fear conditioning paradigm. Rats were trained to associate an aversive unconditioned stimulus (foot shock) with the environment (context). Freezing behavior was examined 24 hr after contextual fear conditioning training for a control group of rats (n = 4 for each group, naïve and trained), a subset of rats for which tissue was not harvested. Error bars indicate SEM. P value from pairwise unpaired t-test is indicated with asterisks, *p<0.05. (B) MiRNAs that displayed at least a 1.5-fold increase in expression between trained and naïve rats in three different experiments. (C) Network analysis using MetaCore (Thompson Reuters) identifies pathways involved in neuronal development, vesicle exocytosis and synaptic plasticity that are co-regulated by three or more of the fear induced miRNAs identified in panel B. P values were calculated for each canonical signaling pathway as compared to the number of occurrences from random sets of brain-expressed genes (see Materials and methods for a detailed description of brain-expressed gene lists). All 6 of the pathways are statistically significant compared to random sets of brain-expressed genes, ***p<0.0001. (D) MiR-153 and miR-9 are the top two miRNAs co-regulating targets involved in the vesicle exocytosis pathway. (E) Eight predicted targets from the vesicle exocytosis pathway that may be co-regulated by miR-153 and at least two other fear-induced miRNAs. The potential targeting fear-miRNAs are indicated above each target. DOI: http://dx.doi.org/10.7554/eLife.22467.002
Figure 1. Expression profiling of miRNAs reveals 21 miRNAs that are induced in the hippocampus of adult rats 24 hr post-contextual fear conditioning. (A) Schematic representation of contextual fear conditioning paradigm. Rats were trained to associate an aversive unconditioned stimulus (foot shock) with the environment (context). Freezing behavior was examined 24 hr after contextual fear conditioning training for a control group of rats (n = 4 for each group, naïve and trained), a subset of rats for which tissue was not harvested. Error bars indicate SEM. P value from pairwise unpaired t-test is indicated with asterisks, *p<0.05. (B) MiRNAs that displayed at least a 1.5-fold increase in expression between trained and naïve rats in three different experiments. (C) Network analysis using MetaCore (Thompson Reuters) identifies pathways involved in neuronal development, vesicle exocytosis and synaptic plasticity that are co-regulated by three or more of the fear induced miRNAs identified in panel B. P values were calculated for each canonical signaling pathway as compared to the number of occurrences from random sets of brain-expressed genes (see Materials and methods for a detailed description of brain-expressed gene lists). All 6 of the pathways are statistically significant compared to random sets of brain-expressed genes, ***p<0.0001. (D) MiR-153 and miR-9 are the top two miRNAs co-regulating targets involved in the vesicle exocytosis pathway. (E) Eight predicted targets from the vesicle exocytosis pathway that may be co-regulated by miR-153 and at least two other fear-induced miRNAs. The potential targeting fear-miRNAs are indicated above each target. DOI: http://dx.doi.org/10.7554/eLife.22467.002CC BY · PubMed Central
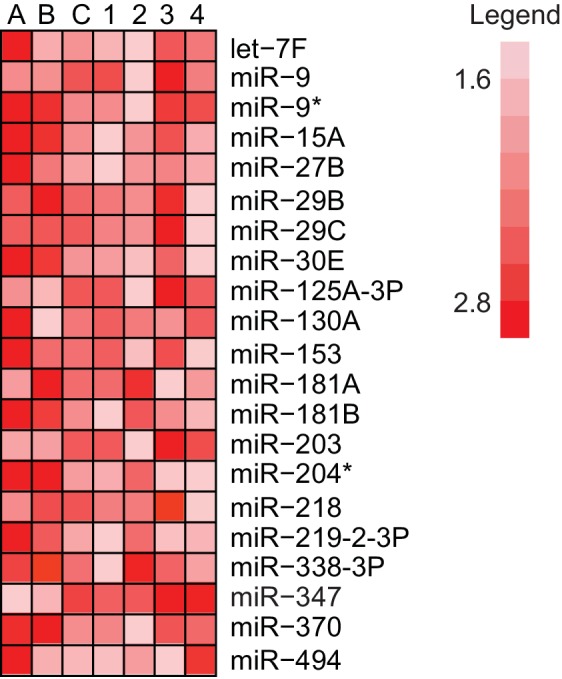
Figure 1—figure supplement 1. Identification of hippocampal fear-induced miRNAs. MiRNAs that displayed at least a 1.5-fold increase in expression between trained and naïve rats in three different experiments with pooled hippocampal RNA from three individual trained rats relative to three individual naïve rats are labeled A–C. Expression ratios comparing a single trained and naïve rat are labeled 1–4. DOI: http://dx.doi.org/10.7554/eLife.22467.003
Figure 1—figure supplement 1. Identification of hippocampal fear-induced miRNAs. MiRNAs that displayed at least a 1.5-fold increase in expression between trained and naïve rats in three different experiments with pooled hippocampal RNA from three individual trained rats relative to three individual naïve rats are labeled A–C. Expression ratios comparing a single trained and naïve rat are labeled 1–4. DOI: http://dx.doi.org/10.7554/eLife.22467.003CC BY · PubMed Central
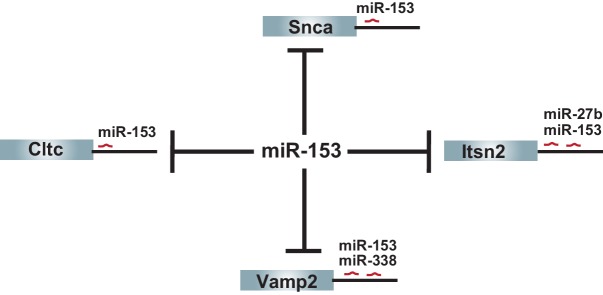
Figure 1—figure supplement 2. Additional targets shared between miR-153 and other fear-induced miRNAs. The remaining 4 (Vamp2, Snca, Cltc, Itsn2) predicted targets of miR-153 from the vesicle exocytosis pathway that are regulated by miR-153 alone or at least one other fear-induced miRNA are shown. DOI: http://dx.doi.org/10.7554/eLife.22467.004
Figure 1—figure supplement 2. Additional targets shared between miR-153 and other fear-induced miRNAs. The remaining 4 (Vamp2, Snca, Cltc, Itsn2) predicted targets of miR-153 from the vesicle exocytosis pathway that are regulated by miR-153 alone or at least one other fear-induced miRNA are shown. DOI: http://dx.doi.org/10.7554/eLife.22467.004CC BY · PubMed Central
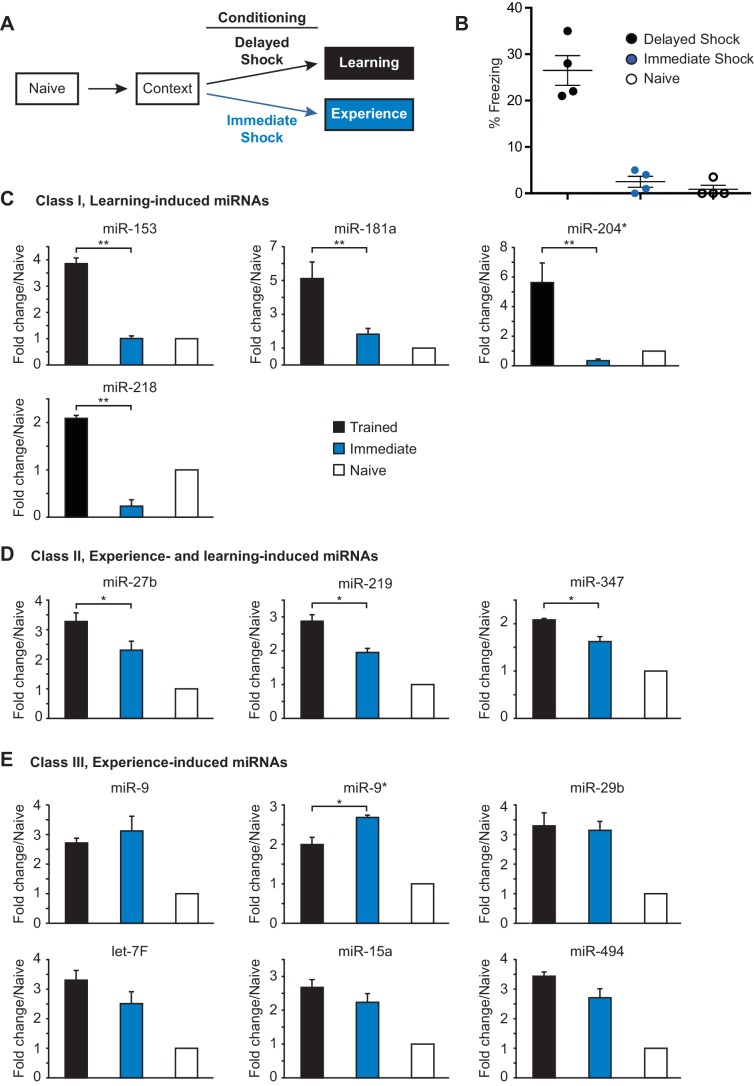
Figure 2. Identification of three classes of miRNA that are induced in the hippocampus with contextual fear conditioning. (A) Summary of experimental strategy. (B) Behavioral test of the naïve, immediate shock, and delayed shock animals. (C–D) RT-qPCR experiments showing changes in miRNA levels in the hippocampi of animals that were subjected to contextual fear conditioning with either the application of immediate shock after introduction to a novel context (immediate, blue bars) or delayed shock (trained, black bars) relative to animals that were only handled (naïve, white bars). (C) Class I miRNAs were specifically induced in the trained group. (D) Class II miRNAs were induced in both the immediate and trained groups with stronger induction in the trained group. The cases where the differences in miRNA levels between immediate and trained groups were statistically significant are indicated (*p value<0.05). (E) Class III miRNAs were induced in both the immediate and trained hippocampi with no apparent increase in trained versus the immediate group. Each group contained nine animals, hippocampi from groups of three animals within each group were pooled for RNA isolation and RT-qPCR analysis. DOI: http://dx.doi.org/10.7554/eLife.22467.005
Figure 2. Identification of three classes of miRNA that are induced in the hippocampus with contextual fear conditioning. (A) Summary of experimental strategy. (B) Behavioral test of the naïve, immediate shock, and delayed shock animals. (C–D) RT-qPCR experiments showing changes in miRNA levels in the hippocampi of animals that were subjected to contextual fear conditioning with either the application of immediate shock after introduction to a novel context (immediate, blue bars) or delayed shock (trained, black bars) relative to animals that were only handled (naïve, white bars). (C) Class I miRNAs were specifically induced in the trained group. (D) Class II miRNAs were induced in both the immediate and trained groups with stronger induction in the trained group. The cases where the differences in miRNA levels between immediate and trained groups were statistically significant are indicated (*p value<0.05). (E) Class III miRNAs were induced in both the immediate and trained hippocampi with no apparent increase in trained versus the immediate group. Each group contained nine animals, hippocampi from groups of three animals within each group were pooled for RNA isolation and RT-qPCR analysis. DOI: http://dx.doi.org/10.7554/eLife.22467.005CC BY · PubMed Central
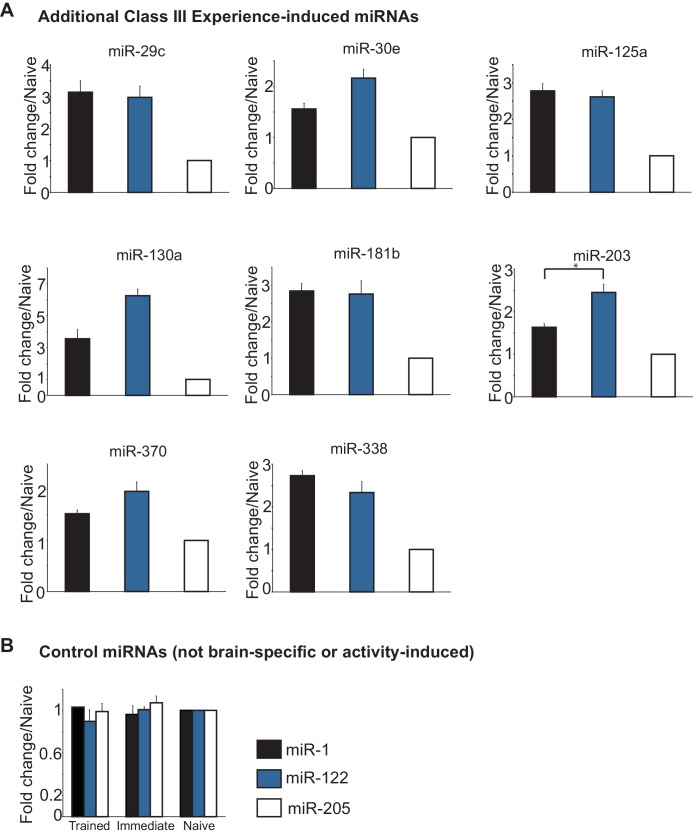
Figure 2—figure supplement 1. Class III miRNAs and control miRNAs. (A) Additional Class III miRNAs that were induced in both the immediate and trained hippocampi with no apparent increase in trained versus the immediate group. (B) Control miRNAs represent miRNAs that are not specific for neuronal tissue and are not activity induced. DOI: http://dx.doi.org/10.7554/eLife.22467.006
Figure 2—figure supplement 1. Class III miRNAs and control miRNAs. (A) Additional Class III miRNAs that were induced in both the immediate and trained hippocampi with no apparent increase in trained versus the immediate group. (B) Control miRNAs represent miRNAs that are not specific for neuronal tissue and are not activity induced. DOI: http://dx.doi.org/10.7554/eLife.22467.006CC BY · PubMed Central
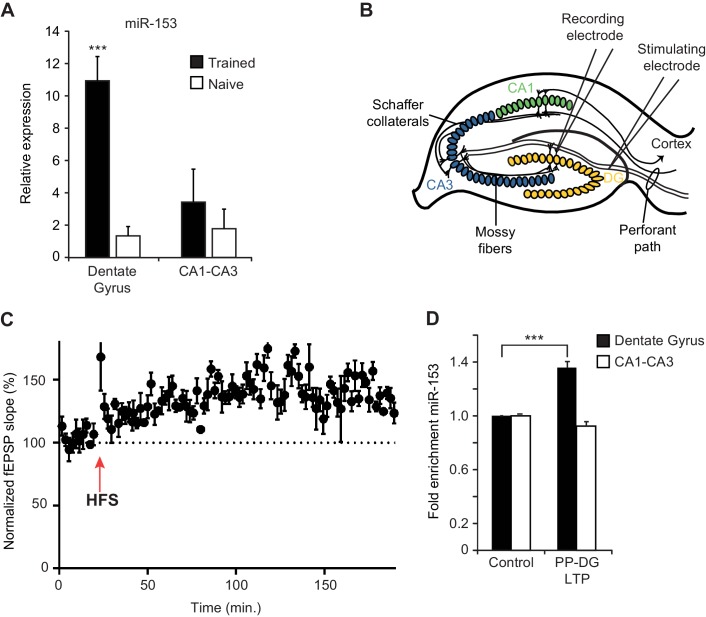
Figure 3. Expression of miR-153 is induced in the dentate gyrus by fear conditioning and LTP. (A) RT-qPCR analysis of RNA levels showing average expression profiles of miR-153 from the dentate gyrus and CA1-CA3 regions of hippocampus in naïve and trained rats. Expression levels were normalized to snoRNA-202 RNA levels. Error bars indicate standard deviation. ***p<0.001 (B) Schematic representation of a hippocampal slice showing stimulating and recording electrode sites. (C) Three-hour time course of perforant path-dentate gyrus (PP-DG) LTP in slices from wild-type mice (n = 5). A 20 min baseline was recorded, after which LTP was induced with four epochs of high frequency stimulation (labeled as HFS with a red arrow) applied 15 s apart. fEPSP slope was plotted demonstrating robust LTP even 3 hr after the induction (data points are averaged every 1.5 min). Each point represents mean ± SEM. (D) RT-qPCR analysis showing average expression relative to control for RNA isolated from the dentate gyrus and CA1-CA3 regions of hippocampal slices following 3 hr of PP-DG LTP. Expression levels were normalized to control RNA from the same region of the hippocampus. Error bars indicate standard error. DOI: http://dx.doi.org/10.7554/eLife.22467.007
Figure 3. Expression of miR-153 is induced in the dentate gyrus by fear conditioning and LTP. (A) RT-qPCR analysis of RNA levels showing average expression profiles of miR-153 from the dentate gyrus and CA1-CA3 regions of hippocampus in naïve and trained rats. Expression levels were normalized to snoRNA-202 RNA levels. Error bars indicate standard deviation. ***p<0.001 (B) Schematic representation of a hippocampal slice showing stimulating and recording electrode sites. (C) Three-hour time course of perforant path-dentate gyrus (PP-DG) LTP in slices from wild-type mice (n = 5). A 20 min baseline was recorded, after which LTP was induced with four epochs of high frequency stimulation (labeled as HFS with a red arrow) applied 15 s apart. fEPSP slope was plotted demonstrating robust LTP even 3 hr after the induction (data points are averaged every 1.5 min). Each point represents mean ± SEM. (D) RT-qPCR analysis showing average expression relative to control for RNA isolated from the dentate gyrus and CA1-CA3 regions of hippocampal slices following 3 hr of PP-DG LTP. Expression levels were normalized to control RNA from the same region of the hippocampus. Error bars indicate standard error. DOI: http://dx.doi.org/10.7554/eLife.22467.007CC BY · PubMed Central
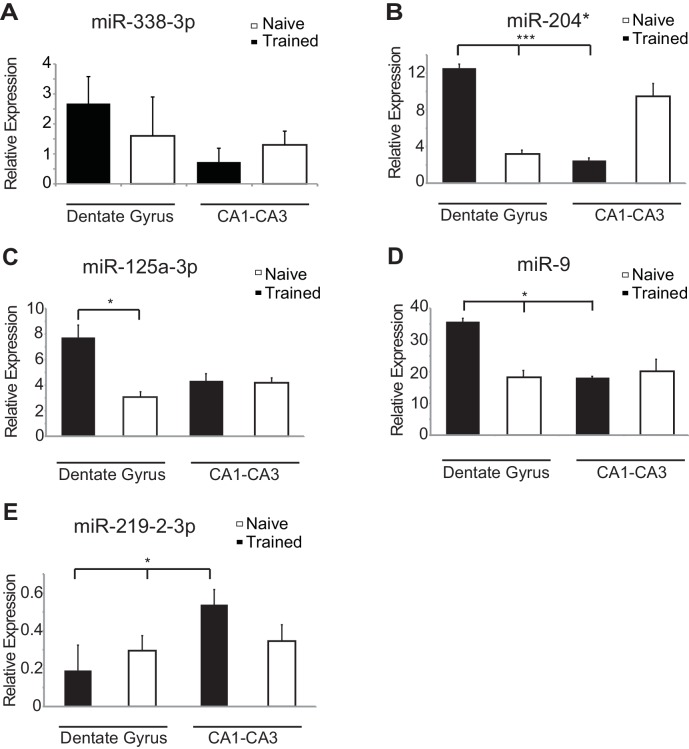
Figure 3—figure supplement 1. Region-specific expression of hippocampal fear-induced miRNAs. RT-qPCR analysis of RNA levels for (A) miR-338–3p (B) miR-204* (C) miR-125a-3p (D) miR-9 (E) miR-219-2-3p miRNAs from the dentate gyrus and CA1-CA3 regions of hippocampus in naïve and trained rats. Expression levels were normalized to snoRNA-202 RNA levels, and values are reported relative to snoRNA-202 expression. Error bars indicate standard deviation. *p<0.05, ***p<0.001. DOI: http://dx.doi.org/10.7554/eLife.22467.008
Figure 3—figure supplement 1. Region-specific expression of hippocampal fear-induced miRNAs. RT-qPCR analysis of RNA levels for (A) miR-338–3p (B) miR-204* (C) miR-125a-3p (D) miR-9 (E) miR-219-2-3p miRNAs from the dentate gyrus and CA1-CA3 regions of hippocampus in naïve and trained rats. Expression levels were normalized to snoRNA-202 RNA levels, and values are reported relative to snoRNA-202 expression. Error bars indicate standard deviation. *p<0.05, ***p<0.001. DOI: http://dx.doi.org/10.7554/eLife.22467.008CC BY · PubMed Central
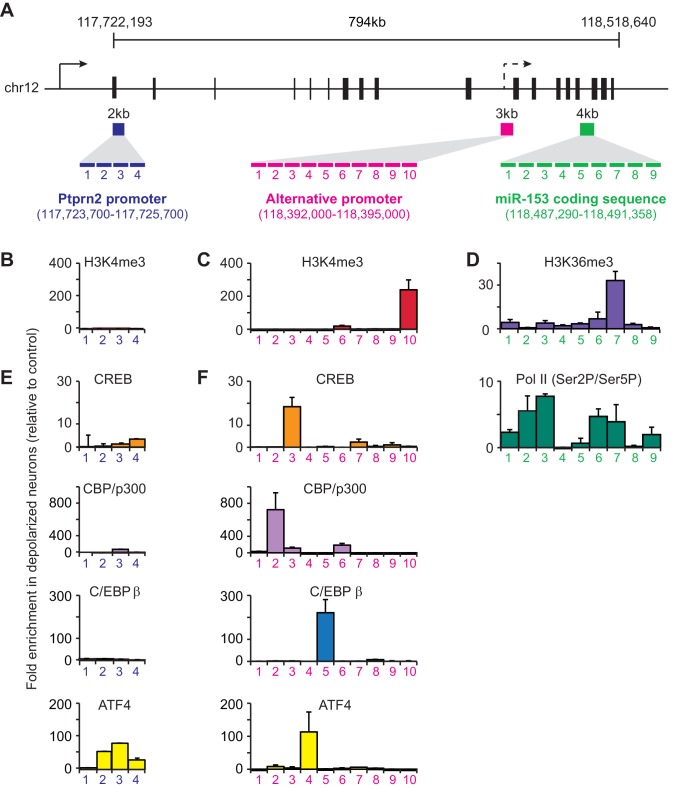
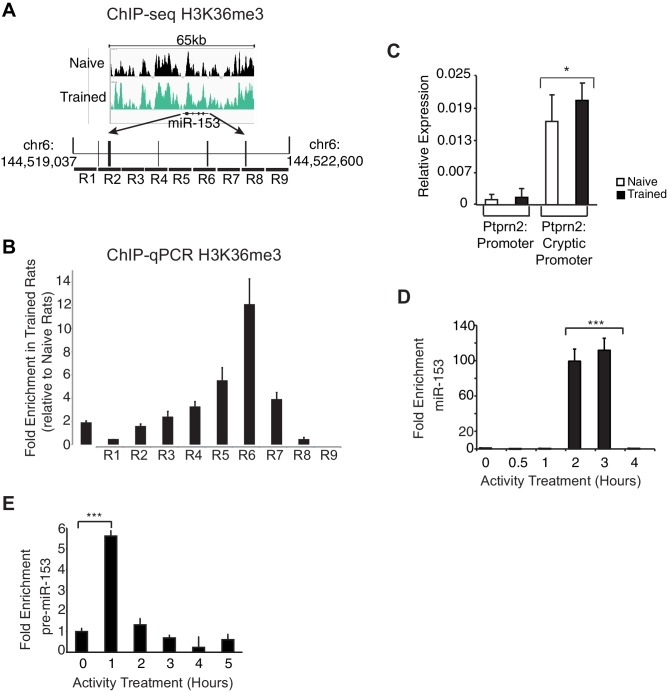
Figure 4. Transcriptional regulation of miR-153 expression may proceed through a cryptic promoter. (A) Schematic representation of Ptprn2 gene with regions identified for each tiling primer set used to map H3K4me3 for Ptprn2 (purple box, B), H3K4me3 for the cryptic promoter (magenta box, C), and H3K36me3 for the miR-153 coding sequence (green box, D). (B–C) ChIP-qPCR experiments showing changes in the association of histone H3K4me3 (red) with the (B) Ptprn2 promoter and (C) alternative cryptic promoter area. (D) ChIP-qPCR experiments showing changes in association of histone H3K36me3 (purple) and Pol II (green) across the miR-153 coding sequence. Tiling primer sets spanning a 2 kilobase range (1primer set/500 base pairs) were used to map the Ptprn2 promoter (B); a 3 kilobase range (1 primer set/300 base pairs) were used to map the putative cryptic promoter (C); and a 4 kilobase range (1 primer set/440 base pairs) were used to map the miR-153 coding sequence (D). (E–F) ChIP-qPCR experiments showing changes in association of CBP/p300 (purple), CREB (phosphorylated at Ser133, orange), C/EBPß (blue) and ATF4 (yellow) with the (E) Ptprn2 promoter and (F) alternative cryptic promoter area. All experiments were performed with chromatin isolated from mature mouse hippocampal neurons (14 DIV) depolarized continuously for 3 hr with 55 mM KCl relative to untreated hippocampal neurons. The experiments were performed in triplicate and the data are presented as mean ± standard deviation. DOI: http://dx.doi.org/10.7554/eLife.22467.009
Figure 4. Transcriptional regulation of miR-153 expression may proceed through a cryptic promoter. (A) Schematic representation of Ptprn2 gene with regions identified for each tiling primer set used to map H3K4me3 for Ptprn2 (purple box, B), H3K4me3 for the cryptic promoter (magenta box, C), and H3K36me3 for the miR-153 coding sequence (green box, D). (B–C) ChIP-qPCR experiments showing changes in the association of histone H3K4me3 (red) with the (B) Ptprn2 promoter and (C) alternative cryptic promoter area. (D) ChIP-qPCR experiments showing changes in association of histone H3K36me3 (purple) and Pol II (green) across the miR-153 coding sequence. Tiling primer sets spanning a 2 kilobase range (1primer set/500 base pairs) were used to map the Ptprn2 promoter (B); a 3 kilobase range (1 primer set/300 base pairs) were used to map the putative cryptic promoter (C); and a 4 kilobase range (1 primer set/440 base pairs) were used to map the miR-153 coding sequence (D). (E–F) ChIP-qPCR experiments showing changes in association of CBP/p300 (purple), CREB (phosphorylated at Ser133, orange), C/EBPß (blue) and ATF4 (yellow) with the (E) Ptprn2 promoter and (F) alternative cryptic promoter area. All experiments were performed with chromatin isolated from mature mouse hippocampal neurons (14 DIV) depolarized continuously for 3 hr with 55 mM KCl relative to untreated hippocampal neurons. The experiments were performed in triplicate and the data are presented as mean ± standard deviation. DOI: http://dx.doi.org/10.7554/eLife.22467.009CC BY · PubMed Central
Figure 4—figure supplement 1. H3K36 trimethylation occupancy is increased across the miR-153 coding sequence after contextual fear-conditioning and miR-153 is transcriptionally induced from an alternative promoter within Ptprn2. (A) Genome browser tracks of H3K36me3 ChIP-seq data across the miR-153 coding sequence in. 18 the hippocampus of trained (green) and naïve (black) rats. Figure was generated using integrative genomics viewer. (B) ChIP-qPCR experiments showing changes in association of H3K36me3 (black) across the miR-153 coding sequence, for chromatin isolated from hippocampus of trained rats relative to naïve rats. Tiling primer sets spanning a 3.6 kilobase range (1 primer set/400 base pairs) were used to map the coding sequence. The experiments were performed in triplicate and the data are presented as mean ± standard deviation. (C) RT-qPCR analysis showing average expression profiles of Ptprn2 for RNA isolated from hippocampus of naïve and trained rats 24 hr after contextual fear conditioning. Exon downstream of the host gene promoter (left) and exon downstream of a cryptic promoter (right) are shown. Error bars indicate standard deviation. *p<0.05 (D) RT-qPCR analysis of miR-153 expression for RNA isolated from mature mouse hippocampal neurons (14 DIV) depolarized continuously for 0.5–4 hr with KCl (as described in Supplemental Materials and methods). Error bars indicate standard deviation. ***p<0.001 (E) RT-qPCR analysis showing average expression profiles of the precursor form of miR-153 (pre-miR-153) for RNA isolated from mature mouse hippocampal neurons (14 DIV) depolarized continuously for 1–5 hr with 55 mM KCl relative to untreated hippocampal neurons. Error bars indicate standard deviation. ***p<0.001. DOI: http://dx.doi.org/10.7554/eLife.22467.010
Figure 4—figure supplement 1. H3K36 trimethylation occupancy is increased across the miR-153 coding sequence after contextual fear-conditioning and miR-153 is transcriptionally induced from an alternative promoter within Ptprn2. (A) Genome browser tracks of H3K36me3 ChIP-seq data across the miR-153 coding sequence in. 18 the hippocampus of trained (green) and naïve (black) rats. Figure was generated using integrative genomics viewer. (B) ChIP-qPCR experiments showing changes in association of H3K36me3 (black) across the miR-153 coding sequence, for chromatin isolated from hippocampus of trained rats relative to naïve rats. Tiling primer sets spanning a 3.6 kilobase range (1 primer set/400 base pairs) were used to map the coding sequence. The experiments were performed in triplicate and the data are presented as mean ± standard deviation. (C) RT-qPCR analysis showing average expression profiles of Ptprn2 for RNA isolated from hippocampus of naïve and trained rats 24 hr after contextual fear conditioning. Exon downstream of the host gene promoter (left) and exon downstream of a cryptic promoter (right) are shown. Error bars indicate standard deviation. *p<0.05 (D) RT-qPCR analysis of miR-153 expression for RNA isolated from mature mouse hippocampal neurons (14 DIV) depolarized continuously for 0.5–4 hr with KCl (as described in Supplemental Materials and methods). Error bars indicate standard deviation. ***p<0.001 (E) RT-qPCR analysis showing average expression profiles of the precursor form of miR-153 (pre-miR-153) for RNA isolated from mature mouse hippocampal neurons (14 DIV) depolarized continuously for 1–5 hr with 55 mM KCl relative to untreated hippocampal neurons. Error bars indicate standard deviation. ***p<0.001. DOI: http://dx.doi.org/10.7554/eLife.22467.010CC BY · PubMed Central
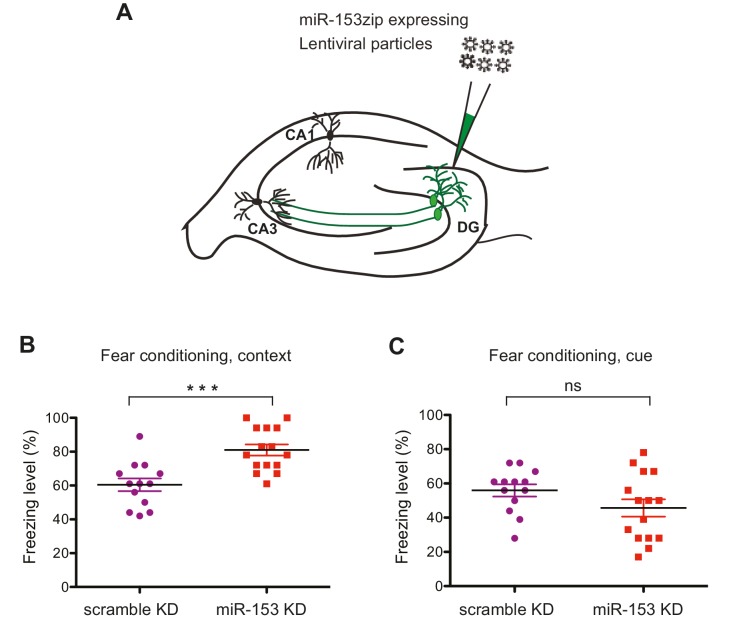
Figure 5. Knockdown of miR-153 enhances contextual fear-based memory. (A) Schematic representation of the DG region of the hippocampus that is injected by lentiviruses expressing miRZip-153 or miRZip-scramble. (B) miRZip-153 (KD) and miRZip-scramble (KD) injected mice were tested with a contextual fear conditioning task. Freezing behavior was examined 24 hr after contextual fear conditioning training. Contextual fear conditioning training was performed after injection of miRZip-153 (KD) or miRZip-scramble (KD) into the dentate gyrus region of the hippocampus. p=0.001 (C) miRZip-153 (KD) and miRZip-scramble (KD)-injected mice were tested with a cued fear conditioning task. Freezing behavior was examined 24 hr after cued fear conditioning training. Cued fear conditioning training was performed after injection of miRZip-153 (KD) or miRZip-scramble (KD) into the dentate gyrus region of the hippocampus. DOI: http://dx.doi.org/10.7554/eLife.22467.011
Figure 5. Knockdown of miR-153 enhances contextual fear-based memory. (A) Schematic representation of the DG region of the hippocampus that is injected by lentiviruses expressing miRZip-153 or miRZip-scramble. (B) miRZip-153 (KD) and miRZip-scramble (KD) injected mice were tested with a contextual fear conditioning task. Freezing behavior was examined 24 hr after contextual fear conditioning training. Contextual fear conditioning training was performed after injection of miRZip-153 (KD) or miRZip-scramble (KD) into the dentate gyrus region of the hippocampus. p=0.001 (C) miRZip-153 (KD) and miRZip-scramble (KD)-injected mice were tested with a cued fear conditioning task. Freezing behavior was examined 24 hr after cued fear conditioning training. Cued fear conditioning training was performed after injection of miRZip-153 (KD) or miRZip-scramble (KD) into the dentate gyrus region of the hippocampus. DOI: http://dx.doi.org/10.7554/eLife.22467.011CC BY · PubMed Central
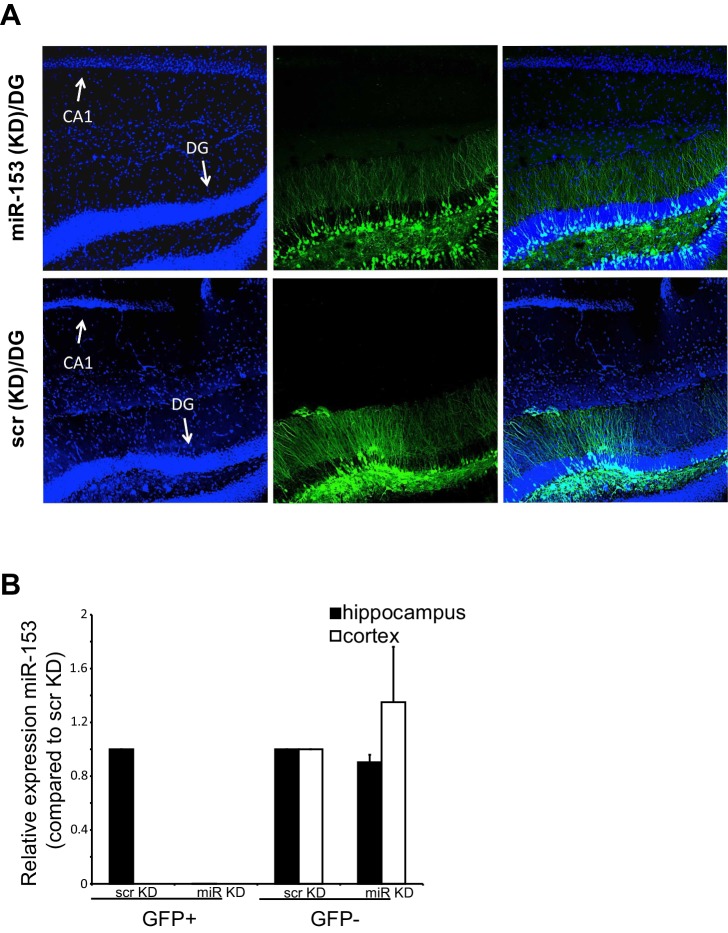
Figure 5—figure supplement 1. miR-153 (KD)-GFP and scrambled-GFP in the dentate gyrus of C57BL/6 mice. (A) Confocal microscope images of hippocampi injected with either the miRZip-153 (KD) (top) or miRZip-scr (KD) scrambled control (bottom) lentivirus construct in the dentate gyrus area. The brain slices and labeled with antibodies against GFP (green) and Hoechst (blue). DG: dentate gyrus region, CA1: Cornu Ammonis region 1. Scale bar: 100 μm. (B) RT-qPCR analysis of RNA levels for miR-153 from hippocampus and cortex tissue isolated from miRZip-153 (KD) and miRZip-scr (KD) injected mice. Transcript levels are reported for FACS sorted GFP+ or GFP- neurons from miRZip-153 (KD) tissues relative to FACS sorted GFP+ or GFP- neurons from miRZip-scr (KD), a control scrambled miR lentivirus. Each experiment was performed in triplicate. Error bars indicate standard deviation. DOI: http://dx.doi.org/10.7554/eLife.22467.012
Figure 5—figure supplement 1. miR-153 (KD)-GFP and scrambled-GFP in the dentate gyrus of C57BL/6 mice. (A) Confocal microscope images of hippocampi injected with either the miRZip-153 (KD) (top) or miRZip-scr (KD) scrambled control (bottom) lentivirus construct in the dentate gyrus area. The brain slices and labeled with antibodies against GFP (green) and Hoechst (blue). DG: dentate gyrus region, CA1: Cornu Ammonis region 1. Scale bar: 100 μm. (B) RT-qPCR analysis of RNA levels for miR-153 from hippocampus and cortex tissue isolated from miRZip-153 (KD) and miRZip-scr (KD) injected mice. Transcript levels are reported for FACS sorted GFP+ or GFP- neurons from miRZip-153 (KD) tissues relative to FACS sorted GFP+ or GFP- neurons from miRZip-scr (KD), a control scrambled miR lentivirus. Each experiment was performed in triplicate. Error bars indicate standard deviation. DOI: http://dx.doi.org/10.7554/eLife.22467.012CC BY · PubMed Central
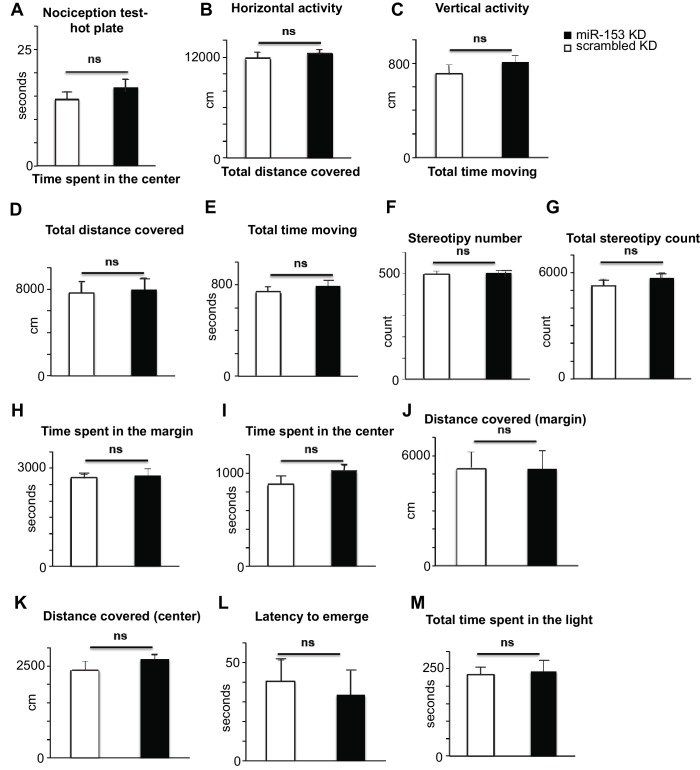
Figure 5—figure supplement 2. Behavioral characterization of miR-153 (KD)-GFP and scrambled-GFP injected mice. (A) miRZip-153 (KD) mice exhibit normal pain sensitivity behavior as measured by length of time required for observation of nociceptive response (rear paw licking). miRZip-153 (KD) mice demonstrate normal (B) horizontal activity, (C) vertical activity, (D) distance traveled, as well as (E) total time moving, (F) total movement number and (G) frequency of stereotypic behavior in the open field test (60 min observation). (White – miRZip-scr (KD) control mice; black – miRZip-153 (KD) mice; n = 15 + 13 animals. Error bars indicate SEM, ns: not significant, *p<0.05, **p<0.01, ***p<0.001). miRZip-153 (KD) mice exhibit normal activity and anxiety-related behavior in the open field as measured by the time spent in (H) the margin and (I) the center (60 min observation). miR-153 (KD) mice exhibit normal activity and anxiety-related behavior in the open field as measured by total distance covered in (J) the margin and (K) the center (60 min observation). miR-153 (KD) mice exhibit normal anxiety-related behavior in the Light-Dark exploration test as measured by (L) the time of the first exit into the brightly lit area and (M) the total time spent in the brightly lit area. DOI: http://dx.doi.org/10.7554/eLife.22467.013
Figure 5—figure supplement 2. Behavioral characterization of miR-153 (KD)-GFP and scrambled-GFP injected mice. (A) miRZip-153 (KD) mice exhibit normal pain sensitivity behavior as measured by length of time required for observation of nociceptive response (rear paw licking). miRZip-153 (KD) mice demonstrate normal (B) horizontal activity, (C) vertical activity, (D) distance traveled, as well as (E) total time moving, (F) total movement number and (G) frequency of stereotypic behavior in the open field test (60 min observation). (White – miRZip-scr (KD) control mice; black – miRZip-153 (KD) mice; n = 15 + 13 animals. Error bars indicate SEM, ns: not significant, *p<0.05, **p<0.01, ***p<0.001). miRZip-153 (KD) mice exhibit normal activity and anxiety-related behavior in the open field as measured by the time spent in (H) the margin and (I) the center (60 min observation). miR-153 (KD) mice exhibit normal activity and anxiety-related behavior in the open field as measured by total distance covered in (J) the margin and (K) the center (60 min observation). miR-153 (KD) mice exhibit normal anxiety-related behavior in the Light-Dark exploration test as measured by (L) the time of the first exit into the brightly lit area and (M) the total time spent in the brightly lit area. DOI: http://dx.doi.org/10.7554/eLife.22467.013CC BY · PubMed Central
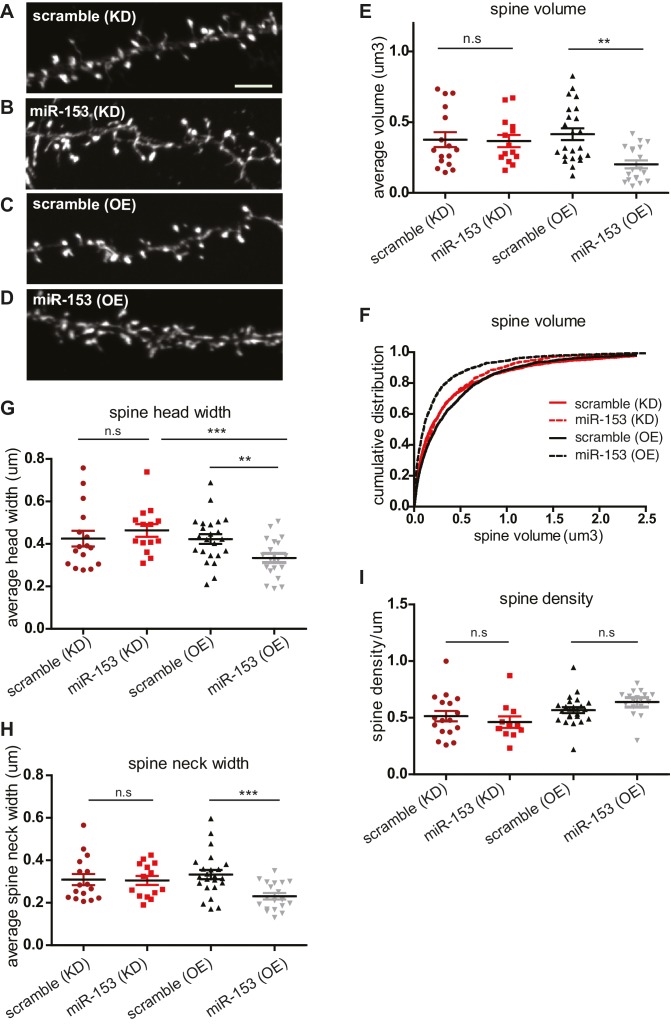
Figure 6. Overexpression of miR-153 decreases dendritic spine volume in hippocampal neurons. (A–D) Lifeact-mRuby images, used to visualize spines, of dendritic regions from representative neurons (DIV18) transfected with scramble (KD) control vector (A), miR-153 (KD) inhibiting vector (B), scramble (OE) control vector (C), miR-153 (OE) overexpressing vector (D). Scale bar, 5 μm. KD represents knock-down and OE represents overexpression. (E) Average volume of spines (n > 800 spines) from neurons (n = 14–23) transfected as in (A–D). The means for these parameters were calculated for each neuron separately and then the averages from all neurons together were plotted as average numbers for each condition. Error bars indicate SEM. P values of pairwise unpaired t-tests are indicated with asterisks scramble (KD) vs miR-153 (KD) (p=0.84) and scramble (OE) vs miR-153 (OE) (p=0.003). *p<0.05, **p<0.01 (F) Cumulative distributions of spine volume were plotted for each group of hippocampal neurons (DIV18) transfected as above. At least 800 spines were measured from two independent experiments and three coverslips each experiment per condition. Spine volume was decreased in miR-153 overexpressing neurons (p<0.0001, D = 0.21), but not changed in neurons with miR-153 inhibited (p=0.37, D = 0.041). (G) Average spine head width calculated and represented as in (E). Error bars indicate SEM. P values of pairwise unpaired t-tests are indicated with asterisks; scramble (KD) vs miR-153 (KD) (p=0.43), scramble (OE) vs miR-153 (OE) (p=0.008) and miR-153 (KD) vs miR-153 (OE) (p=0.001). *p<0.05, **p<0.01, ***p<0.001 (H) Average spine neck width calculated and represented as in (E). Error bars indicate SEM. P values of pairwise unpaired t-tests are indicated with asterisks scramble (KD) vs miR-153 (KD) (p=0.9) and scramble (OE) vs miR-153 (OE) (p=0.0006). ***p<0.001 (I) Average spine density of hippocampal neurons calculated as in (E). Error bars indicate SEM. P values of pairwise unpaired t-tests are indicated with asterisks. n.s., not significant. DOI: http://dx.doi.org/10.7554/eLife.22467.014
Figure 6. Overexpression of miR-153 decreases dendritic spine volume in hippocampal neurons. (A–D) Lifeact-mRuby images, used to visualize spines, of dendritic regions from representative neurons (DIV18) transfected with scramble (KD) control vector (A), miR-153 (KD) inhibiting vector (B), scramble (OE) control vector (C), miR-153 (OE) overexpressing vector (D). Scale bar, 5 μm. KD represents knock-down and OE represents overexpression. (E) Average volume of spines (n > 800 spines) from neurons (n = 14–23) transfected as in (A–D). The means for these parameters were calculated for each neuron separately and then the averages from all neurons together were plotted as average numbers for each condition. Error bars indicate SEM. P values of pairwise unpaired t-tests are indicated with asterisks scramble (KD) vs miR-153 (KD) (p=0.84) and scramble (OE) vs miR-153 (OE) (p=0.003). *p<0.05, **p<0.01 (F) Cumulative distributions of spine volume were plotted for each group of hippocampal neurons (DIV18) transfected as above. At least 800 spines were measured from two independent experiments and three coverslips each experiment per condition. Spine volume was decreased in miR-153 overexpressing neurons (p<0.0001, D = 0.21), but not changed in neurons with miR-153 inhibited (p=0.37, D = 0.041). (G) Average spine head width calculated and represented as in (E). Error bars indicate SEM. P values of pairwise unpaired t-tests are indicated with asterisks; scramble (KD) vs miR-153 (KD) (p=0.43), scramble (OE) vs miR-153 (OE) (p=0.008) and miR-153 (KD) vs miR-153 (OE) (p=0.001). *p<0.05, **p<0.01, ***p<0.001 (H) Average spine neck width calculated and represented as in (E). Error bars indicate SEM. P values of pairwise unpaired t-tests are indicated with asterisks scramble (KD) vs miR-153 (KD) (p=0.9) and scramble (OE) vs miR-153 (OE) (p=0.0006). ***p<0.001 (I) Average spine density of hippocampal neurons calculated as in (E). Error bars indicate SEM. P values of pairwise unpaired t-tests are indicated with asterisks. n.s., not significant. DOI: http://dx.doi.org/10.7554/eLife.22467.014CC BY · PubMed Central
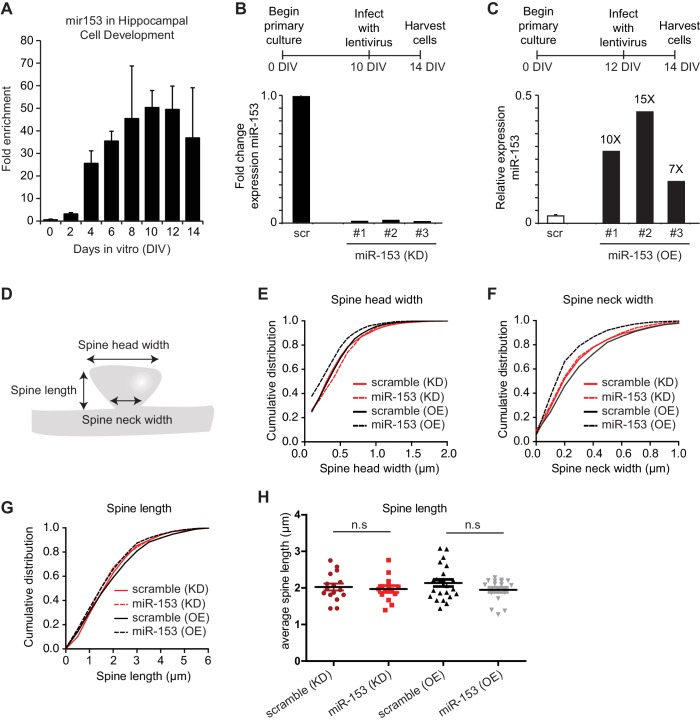
Figure 6—figure supplement 1. miR-153 negatively regulates dendritic spine size. (A) Expression profile of miR-153 during primary hippocampal differentiation in vitro. (B–C) Schematic representation of treatment of miR-153 lentiviral-infected mature hippocampal cultures. RT-qPCR analysis of RNA levels showing expression profile of miR-153 in mature hippocampal neurons (14 DIV). Expression profiles are shown for neurons infected with either (B) miR-Zip-153 (KD) or miR-Zip-scr (KD), a control scrambled miR lentivirus (black bars). (C) Expression profiles for neurons infected with either Lv-miR-153 (OE) or Lv-scr (OE), a control scrambled miR lentivirus (white bar). Each sample was measured in triplicate and error bars indicate standard deviation. The scr (OE) replicates are represented as a single bar (white). (D) Schematic representation of a spine and the features that were measured in this analysis together with the total spine volume and the density of spines. (E–G) Cumulative distributions of (E) spine head width, (F) spine neck width, (G) spine length were plotted for each group of hippocampal neurons (DIV18) transfected as in Figure 3A–D. At least 800 spines were measured from two independent experiments and three coverslips each experiment per condition. (E) Spine head width was decreased when miR-153 was overexpressed (p<0.0001, D = 0.14) and increased when miR-153 was blocked (p<0.001, D = 0.09). (F) Spine neck width was decreased, when miR-153 was overexpressed (p<0.0001, D = 0.2) and not changed, when miR-153 was blocked (p=0.55, 0.04). Statistical significance was assessed by Kolmogorov-Smirnov test. (G) Spine length showed a decrease when miR-153 was overexpressed (p<0.0001, D = 0.14), but with no change when miR-153 was blocked (p=0.176, D = 0.05). Statistical significance was assessed by the Kolmogorov-Smirnov test. (H) Average spine length of hippocampal neurons (n = 14–23) transfected as above. It was calculated for each neuron separately and then the averages from all neurons together were plotted as average numbers for each condition. Error bars indicate SEM. P values of pairwise unpaired t-tests are indicated with asterisks scramble (KD) vs miR-153 (KD) (p=0.69) and scramble(OE) vs miR-153(OE) (p=0.14). n.s. not significant. DOI: http://dx.doi.org/10.7554/eLife.22467.015
Figure 6—figure supplement 1. miR-153 negatively regulates dendritic spine size. (A) Expression profile of miR-153 during primary hippocampal differentiation in vitro. (B–C) Schematic representation of treatment of miR-153 lentiviral-infected mature hippocampal cultures. RT-qPCR analysis of RNA levels showing expression profile of miR-153 in mature hippocampal neurons (14 DIV). Expression profiles are shown for neurons infected with either (B) miR-Zip-153 (KD) or miR-Zip-scr (KD), a control scrambled miR lentivirus (black bars). (C) Expression profiles for neurons infected with either Lv-miR-153 (OE) or Lv-scr (OE), a control scrambled miR lentivirus (white bar). Each sample was measured in triplicate and error bars indicate standard deviation. The scr (OE) replicates are represented as a single bar (white). (D) Schematic representation of a spine and the features that were measured in this analysis together with the total spine volume and the density of spines. (E–G) Cumulative distributions of (E) spine head width, (F) spine neck width, (G) spine length were plotted for each group of hippocampal neurons (DIV18) transfected as in Figure 3A–D. At least 800 spines were measured from two independent experiments and three coverslips each experiment per condition. (E) Spine head width was decreased when miR-153 was overexpressed (p<0.0001, D = 0.14) and increased when miR-153 was blocked (p<0.001, D = 0.09). (F) Spine neck width was decreased, when miR-153 was overexpressed (p<0.0001, D = 0.2) and not changed, when miR-153 was blocked (p=0.55, 0.04). Statistical significance was assessed by Kolmogorov-Smirnov test. (G) Spine length showed a decrease when miR-153 was overexpressed (p<0.0001, D = 0.14), but with no change when miR-153 was blocked (p=0.176, D = 0.05). Statistical significance was assessed by the Kolmogorov-Smirnov test. (H) Average spine length of hippocampal neurons (n = 14–23) transfected as above. It was calculated for each neuron separately and then the averages from all neurons together were plotted as average numbers for each condition. Error bars indicate SEM. P values of pairwise unpaired t-tests are indicated with asterisks scramble (KD) vs miR-153 (KD) (p=0.69) and scramble(OE) vs miR-153(OE) (p=0.14). n.s. not significant. DOI: http://dx.doi.org/10.7554/eLife.22467.015CC BY · PubMed Central
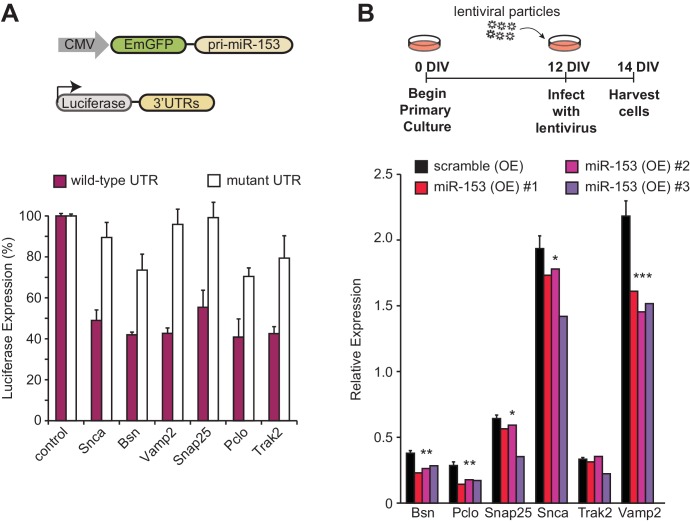
Figure 7. miR-153 regulates the expression of targets involved in the vesicle exocytosis pathway. (A) Cells with luciferase reporter constructs containing wild-type (purple bars) or mutant (white bars) Bsn, Pclo, Snap25, Snca, Trak2, or Vamp2 mouse 3'-UTR region were co-transfected with the miR-153 expression plasmid. A miR-153 scrambled expression plasmid served as a control (leftmost bars). 3’-UTR mutations were in the seed sequence for the miR-153 binding site for each gene. HEK293T cells were co-transfected with both the reporter gene and miRNA expression vectors, and luciferase activity was measured 48 hr later. The experiments were performed in triplicate and error bars indicate standard deviation. (B) RT-qPCR analysis of RNA levels for genes (Bsn, Pclo, Snap25, Snca, Trak2, and Vamp2) from miRZip-153 (OE) infected 14 DIV hippocampal neurons (red, magenta and purple bars), relative to neurons infected with miRZip-scramble (OE), a control scrambled miR lentivirus (black bar). Each experiment was performed in triplicate. Error bars indicate standard deviation. *p<0.05, **p<0.01, ***p<0.001. DOI: http://dx.doi.org/10.7554/eLife.22467.016
Figure 7. miR-153 regulates the expression of targets involved in the vesicle exocytosis pathway. (A) Cells with luciferase reporter constructs containing wild-type (purple bars) or mutant (white bars) Bsn, Pclo, Snap25, Snca, Trak2, or Vamp2 mouse 3'-UTR region were co-transfected with the miR-153 expression plasmid. A miR-153 scrambled expression plasmid served as a control (leftmost bars). 3’-UTR mutations were in the seed sequence for the miR-153 binding site for each gene. HEK293T cells were co-transfected with both the reporter gene and miRNA expression vectors, and luciferase activity was measured 48 hr later. The experiments were performed in triplicate and error bars indicate standard deviation. (B) RT-qPCR analysis of RNA levels for genes (Bsn, Pclo, Snap25, Snca, Trak2, and Vamp2) from miRZip-153 (OE) infected 14 DIV hippocampal neurons (red, magenta and purple bars), relative to neurons infected with miRZip-scramble (OE), a control scrambled miR lentivirus (black bar). Each experiment was performed in triplicate. Error bars indicate standard deviation. *p<0.05, **p<0.01, ***p<0.001. DOI: http://dx.doi.org/10.7554/eLife.22467.016CC BY · PubMed Central
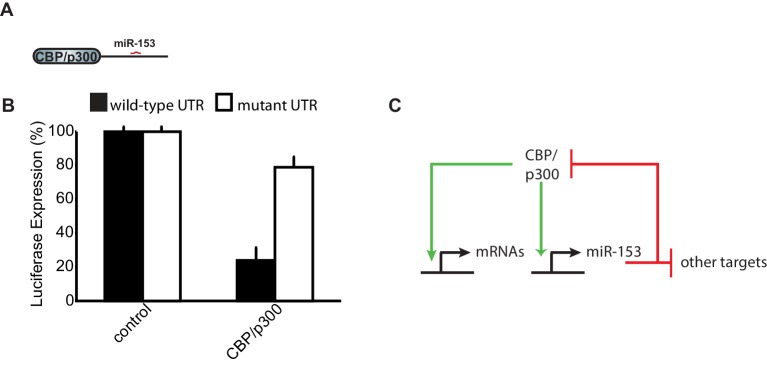
Figure 7—figure supplement 1. CBP/p300 is a target of miR-153. (A) Schematic representation of CBP/p300 gene with miR-153 binding site indicated. (B) Cells containing the luciferase reporter constructs containing wild-type (black bars) or mutated CBP/p300 mouse 3'-UTR region (white bars) were co-transfected with miR-153. A miR-153 scrambled expression plasmid served as a control (left two bars). HEK293T cells were co-transfected with both the reporter gene and miRNA expression vectors, and luciferase activity was measured 48 hr later. The experiments were performed in triplicate and error bars indicate standard deviation. (C) Schematic representation of the feedback loop formed between miR-153 and CBP/p300. Green arrows indicate activation or positive feedback; red arrows indicate repression or negative feedback. DOI: http://dx.doi.org/10.7554/eLife.22467.017
Figure 7—figure supplement 1. CBP/p300 is a target of miR-153. (A) Schematic representation of CBP/p300 gene with miR-153 binding site indicated. (B) Cells containing the luciferase reporter constructs containing wild-type (black bars) or mutated CBP/p300 mouse 3'-UTR region (white bars) were co-transfected with miR-153. A miR-153 scrambled expression plasmid served as a control (left two bars). HEK293T cells were co-transfected with both the reporter gene and miRNA expression vectors, and luciferase activity was measured 48 hr later. The experiments were performed in triplicate and error bars indicate standard deviation. (C) Schematic representation of the feedback loop formed between miR-153 and CBP/p300. Green arrows indicate activation or positive feedback; red arrows indicate repression or negative feedback. DOI: http://dx.doi.org/10.7554/eLife.22467.017CC BY · PubMed Central
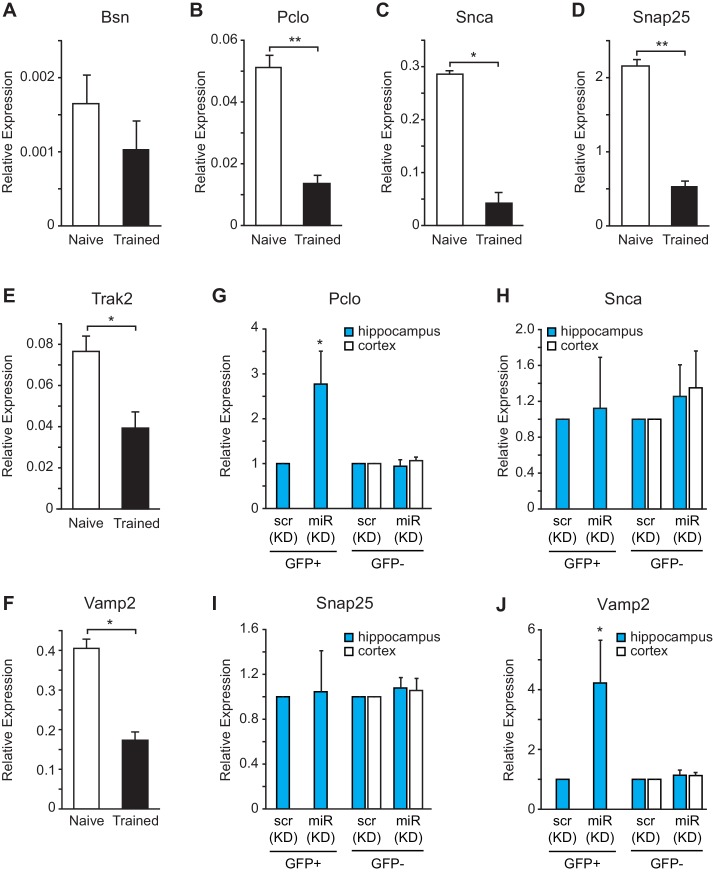
Figure 8. miR-153 regulates targets involved in the vesicle exocytosis pathway that are suppressed after fear conditioning. (A–F) RT-qPCR analysis of RNA levels for vesicle exocytosis genes Bsn (A), Pclo (B), Snca (C), Snap25 (D), Trak2 (E), and Vamp2 (F) from hippocampus of naïve and trained rats. (G–J) RT-qPCR analysis of RNA levels for vesicle exocytosis genes Pclo (G), Snca (H), Snap25 (I), and Vamp2 (J) from hippocampus and cortex tissue isolated from miRZip-153 (KD) and miRZip-scr (KD) injected mice. Transcript levels are reported for FACS sorted GFP+ or GFP− neurons from miRZip-153 (KD) tissues relative to FACS sorted GFP+ or GFP− neurons from miRZip-scr (KD), a control scrambled miR lentivirus. Each experiment was performed in triplicate. Error bars indicate standard deviation. *p<0.05. DOI: http://dx.doi.org/10.7554/eLife.22467.018
Figure 8. miR-153 regulates targets involved in the vesicle exocytosis pathway that are suppressed after fear conditioning. (A–F) RT-qPCR analysis of RNA levels for vesicle exocytosis genes Bsn (A), Pclo (B), Snca (C), Snap25 (D), Trak2 (E), and Vamp2 (F) from hippocampus of naïve and trained rats. (G–J) RT-qPCR analysis of RNA levels for vesicle exocytosis genes Pclo (G), Snca (H), Snap25 (I), and Vamp2 (J) from hippocampus and cortex tissue isolated from miRZip-153 (KD) and miRZip-scr (KD) injected mice. Transcript levels are reported for FACS sorted GFP+ or GFP− neurons from miRZip-153 (KD) tissues relative to FACS sorted GFP+ or GFP− neurons from miRZip-scr (KD), a control scrambled miR lentivirus. Each experiment was performed in triplicate. Error bars indicate standard deviation. *p<0.05. DOI: http://dx.doi.org/10.7554/eLife.22467.018CC BY · PubMed Central
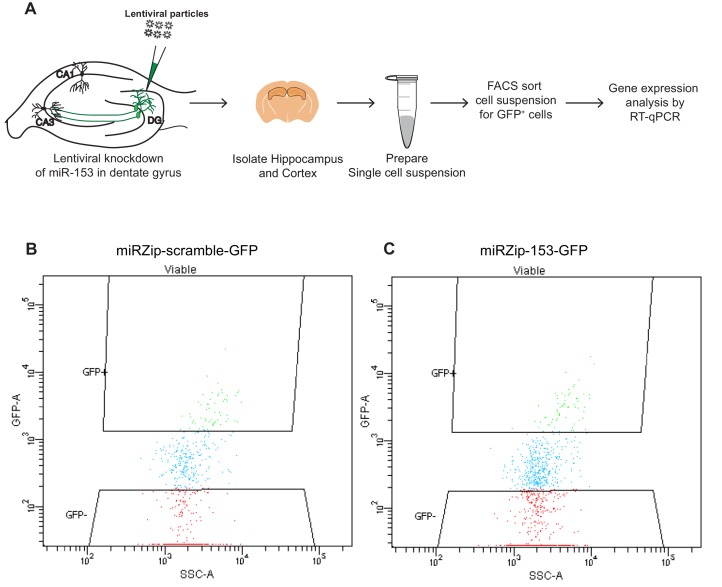
Figure 8—figure supplement 1. Fluorescence-activated cell sorting (FACS) plots of hippocampal neurons isolated from wild-type mice transduced in the dentate gyrus with miRZip lentiviruses. (A) Schematic representation of the methods used to prepare samples for FACS sorting and RT-qPCR analysis from wild type mice transduced in the dentate gyrus with lentiviruses. (B–C) Representative examples of FACS sorting of GFP positive but DAPI negative neurons from wild type mice transduced in the dentate gyrus with miRZip-scr-GFP (B) or miRZip-153-GFP (C) lentivirus. DOI: http://dx.doi.org/10.7554/eLife.22467.019
Figure 8—figure supplement 1. Fluorescence-activated cell sorting (FACS) plots of hippocampal neurons isolated from wild-type mice transduced in the dentate gyrus with miRZip lentiviruses. (A) Schematic representation of the methods used to prepare samples for FACS sorting and RT-qPCR analysis from wild type mice transduced in the dentate gyrus with lentiviruses. (B–C) Representative examples of FACS sorting of GFP positive but DAPI negative neurons from wild type mice transduced in the dentate gyrus with miRZip-scr-GFP (B) or miRZip-153-GFP (C) lentivirus. DOI: http://dx.doi.org/10.7554/eLife.22467.019CC BY · PubMed Central
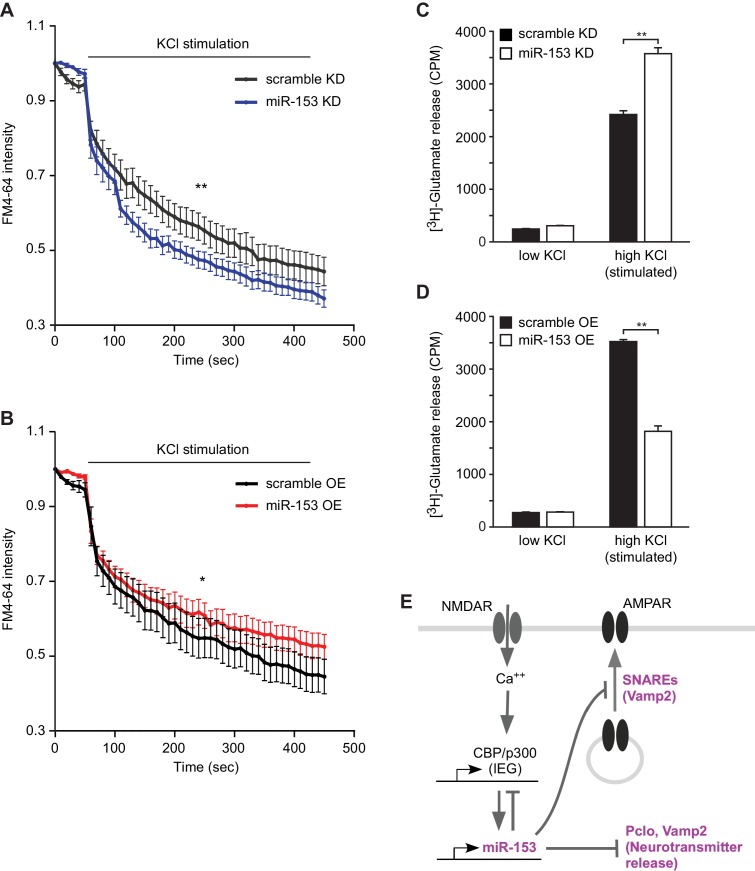
Figure 9. miR-153 regulates vesicle exocytosis and glutamate neurotransmitter release. (A–B) Analysis of vesicle exocytosis by FM4–64 imaging in primary neurons. (A) Fold fluorescence depletion of FM4-–64 dye of scramble (KD) and miR-153 (KD) groups of (n = 10–12) neurons per group, **p=0.008, two-tailed Mann Whitney U test. (B) Fold fluorescence depletion of FM4-–64 dye of scramble (OE) and miR-153 (OE) groups of (n = 10–12) neurons per group, *p=0.014, two-tailed Mann Whitney U test. (C–D) [H3]-glutamate release in primary neurons. (C) [H3]-glutamate release as determined by measuring the radioactivity content in neurons transduced with miRZip-153 knockdown (KD) lentivirus (white bars) as compared to primary neurons transduced with miRZip-scr (KD) lentivirus (black bars) after depolarization with 55 mM KCl (high KCl). (D) [H3]-glutamate release as determined by measuring radioactivity content in neurons transduced with miR-153 overexpression (OE) lentivirus (white bars) as compared to primary neurons transduced with scramble overexpression (OE) lentivirus (black bars) after depolarization with 55 mM KCl (high KCl). Each experiment was performed in triplicate. Error bars indicate standard deviation. *p<0.05. (E) Schematic summary illustrating the role of miR-153 as a negative feedback regulator of the pathways that mediate changes in synaptic strength and neurotransmitter release. DOI: http://dx.doi.org/10.7554/eLife.22467.020
Figure 9. miR-153 regulates vesicle exocytosis and glutamate neurotransmitter release. (A–B) Analysis of vesicle exocytosis by FM4–64 imaging in primary neurons. (A) Fold fluorescence depletion of FM4-–64 dye of scramble (KD) and miR-153 (KD) groups of (n = 10–12) neurons per group, **p=0.008, two-tailed Mann Whitney U test. (B) Fold fluorescence depletion of FM4-–64 dye of scramble (OE) and miR-153 (OE) groups of (n = 10–12) neurons per group, *p=0.014, two-tailed Mann Whitney U test. (C–D) [H3]-glutamate release in primary neurons. (C) [H3]-glutamate release as determined by measuring the radioactivity content in neurons transduced with miRZip-153 knockdown (KD) lentivirus (white bars) as compared to primary neurons transduced with miRZip-scr (KD) lentivirus (black bars) after depolarization with 55 mM KCl (high KCl). (D) [H3]-glutamate release as determined by measuring radioactivity content in neurons transduced with miR-153 overexpression (OE) lentivirus (white bars) as compared to primary neurons transduced with scramble overexpression (OE) lentivirus (black bars) after depolarization with 55 mM KCl (high KCl). Each experiment was performed in triplicate. Error bars indicate standard deviation. *p<0.05. (E) Schematic summary illustrating the role of miR-153 as a negative feedback regulator of the pathways that mediate changes in synaptic strength and neurotransmitter release. DOI: http://dx.doi.org/10.7554/eLife.22467.020CC BY · PubMed Central
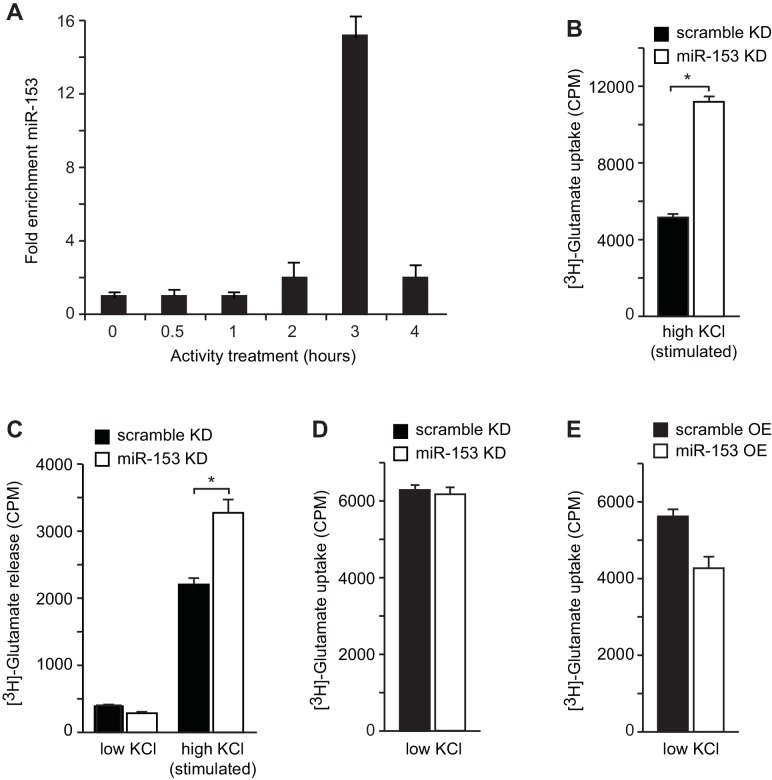
Figure 9—figure supplement 1. Neurotransmitter uptake and release measurements in H19-7 hippocampal neuronal cells. (A) RT-qPCR analysis of miR-153 expression for RNA isolated from differentiated H19-7 cells depolarized continuously for 0.5–4 hr with KCl (as described in Supplemental Materials and methods). Experiments were performed in triplicate and error bars indicate standard deviation. (B) [H3]-glutamate uptake as determined by measuring the radioactivity content in H19-7 miRZip-153 knockdown (KD) cells as compared to H19-7 miRZip-scr (KD) cells after depolarization with 55 mM KCl (high KCl). (C) [H3]-glutamate secretion by 5 mM KCl (low KCl) or 55 mM KCl (high KCl) as determined by measuring the radioactivity in the supernatant of H19-7 miRZip-153 (KD) cells as compared to H19-7 miRZip-scr (KD) cells. (D) [H3]-glutamate uptake as determined by measuring the radioactivity content in primary neurons transduced with miRZip-153 knockdown (KD) lentivirus as compared to primary neurons transduced with miRZip-scr (KD) lentivirus. (E) [H3]-glutamate uptake as determined by measuring radioactivity content in primary neurons transduced with miR-153 overexpression (OE) lentivirus as compared to primary neurons transduced with scramble overexpression (OE) lentivirus. Each experiment has been performed in triplicate. Error bars indicate standard deviation. *p<0.05. DOI: http://dx.doi.org/10.7554/eLife.22467.021
Figure 9—figure supplement 1. Neurotransmitter uptake and release measurements in H19-7 hippocampal neuronal cells. (A) RT-qPCR analysis of miR-153 expression for RNA isolated from differentiated H19-7 cells depolarized continuously for 0.5–4 hr with KCl (as described in Supplemental Materials and methods). Experiments were performed in triplicate and error bars indicate standard deviation. (B) [H3]-glutamate uptake as determined by measuring the radioactivity content in H19-7 miRZip-153 knockdown (KD) cells as compared to H19-7 miRZip-scr (KD) cells after depolarization with 55 mM KCl (high KCl). (C) [H3]-glutamate secretion by 5 mM KCl (low KCl) or 55 mM KCl (high KCl) as determined by measuring the radioactivity in the supernatant of H19-7 miRZip-153 (KD) cells as compared to H19-7 miRZip-scr (KD) cells. (D) [H3]-glutamate uptake as determined by measuring the radioactivity content in primary neurons transduced with miRZip-153 knockdown (KD) lentivirus as compared to primary neurons transduced with miRZip-scr (KD) lentivirus. (E) [H3]-glutamate uptake as determined by measuring radioactivity content in primary neurons transduced with miR-153 overexpression (OE) lentivirus as compared to primary neurons transduced with scramble overexpression (OE) lentivirus. Each experiment has been performed in triplicate. Error bars indicate standard deviation. *p<0.05. DOI: http://dx.doi.org/10.7554/eLife.22467.021CC BY · PubMed Central
Figure 9—figure supplement 2. Fluorescence recovery after photobleaching (FRAP) of SEP-GluA1 AMPA receptors in neuroblastoma N2A cells. (A) Schematic representation of the design of the FRAP experiment. (B) Images of N2A cells that were perfused with p.H 7.4 ACSF followed by a brief exposure to p.H 5.5 and then returned to p.H 7.4. (C) Relative levels of SEP-GluA1 at neutral and acidic conditions for N2A cells treated as in (B). (D) Relative levels of mCherryFP at neutral and acidic conditions. (E) Immunoblot for GluA1 total levels in scramble (OE) and miR-153 (OE) cells. DOI: http://dx.doi.org/10.7554/eLife.22467.022
Figure 9—figure supplement 2. Fluorescence recovery after photobleaching (FRAP) of SEP-GluA1 AMPA receptors in neuroblastoma N2A cells. (A) Schematic representation of the design of the FRAP experiment. (B) Images of N2A cells that were perfused with p.H 7.4 ACSF followed by a brief exposure to p.H 5.5 and then returned to p.H 7.4. (C) Relative levels of SEP-GluA1 at neutral and acidic conditions for N2A cells treated as in (B). (D) Relative levels of mCherryFP at neutral and acidic conditions. (E) Immunoblot for GluA1 total levels in scramble (OE) and miR-153 (OE) cells. DOI: http://dx.doi.org/10.7554/eLife.22467.022CC BY · PubMed Central
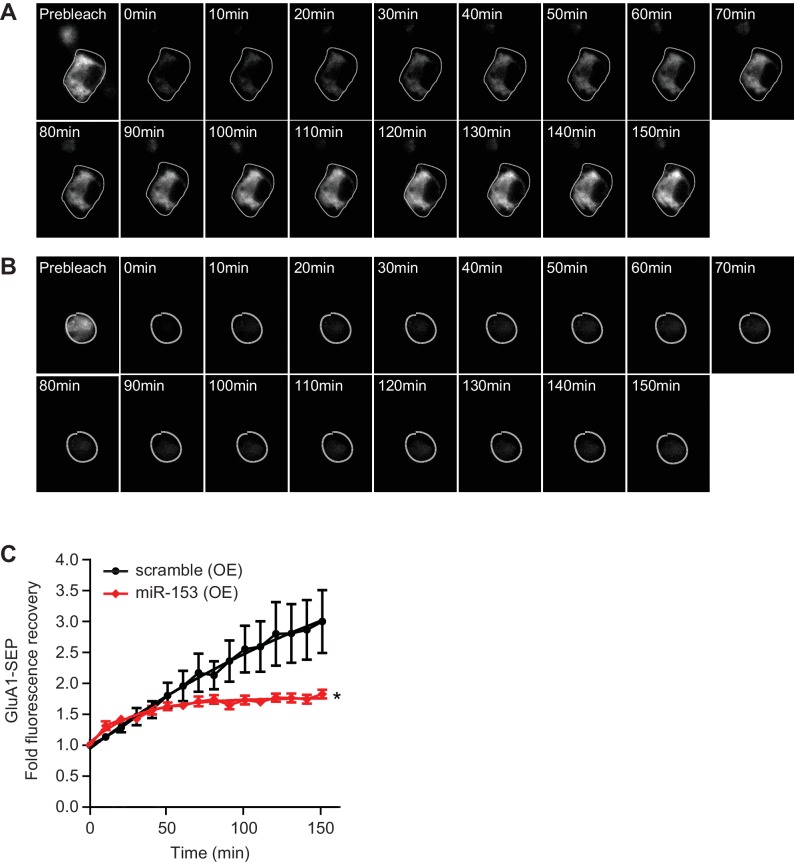
Figure 9—figure supplement 3. miR-153 regulates AMPAR transport in neuroblastoma N2A cells. (A) Time lapse images following photobleaching of SEP-GluA1 in scramble (OE) cells. (B) Time lapse images following photobleaching of SEP-GluA1 in miR-153 (OE) cells. (C) Fold fluorescence recovery of SEP-GluA1 of scramble (OE) and miR-153 (OE) groups of cells (n = 5–8 cells per group, p=0.028, two-tailed Mann Whitney U test). DOI: http://dx.doi.org/10.7554/eLife.22467.023
Figure 9—figure supplement 3. miR-153 regulates AMPAR transport in neuroblastoma N2A cells. (A) Time lapse images following photobleaching of SEP-GluA1 in scramble (OE) cells. (B) Time lapse images following photobleaching of SEP-GluA1 in miR-153 (OE) cells. (C) Fold fluorescence recovery of SEP-GluA1 of scramble (OE) and miR-153 (OE) groups of cells (n = 5–8 cells per group, p=0.028, two-tailed Mann Whitney U test). DOI: http://dx.doi.org/10.7554/eLife.22467.023CC BY · PubMed Central

Verification

Claims the paper makes

The claims and statistics of this paper haven’t been checked yet.

Run the check — free, no account needed. It reads the open-access text and checks the sources it cites.

A few free checks a day · papers already verified open instantly · results are public

Claims other papers make about this one

Each is checked against this paper’s own text: does it say what the citing paper says it does?

Self-check

Percentages, sums and reported differences re-computed from the paper’s own numbers.

The self-check needs the paper’s full text.

Citations

Cites

Show all 11 references

Research works printed but not linked: 93

  1. Abraham, 1991, Macromolecules and the Maintenance of Long-Term Potentiation
  2. Abraham, 2003, Properties and mechanisms of LTP maintenance, The Neuroscientist, 9, 463, 10.1177/1073858403259119 · DOI
  3. Akchiche, 2010, Differentiation and neural integration of hippocampal neuronal progenitors: signaling pathways sequentially involved, Hippocampus, 20, 949, 10.1002/hipo.20690 · DOI
  4. Alberini, 2015, The regulation of transcription in memory consolidation, Cold Spring Harbor Perspectives in Biology, 7, a021741, 10.1101/cshperspect.a021741 · DOI · Paper page
  5. Alberini, 2011, The role of reconsolidation and the dynamic process of long-term memory formation and storage, Frontiers in Behavioral Neuroscience, 5, 12, 10.3389/fnbeh.2011.00012 · DOI
  6. Barak, 2013, Opposing actions of environmental enrichment and Alzheimer's disease on the expression of hippocampal microRNAs in mouse models, Translational Psychiatry, 3, e304, 10.1038/tp.2013.77 · DOI
  7. Bartel, 2004, MicroRNAs: genomics, biogenesis, mechanism, and function, Cell, 116, 281, 10.1016/S0092-8674(04)00045-5 · DOI
  8. Bartel, 2009, MicroRNAs: target recognition and regulatory functions, Cell, 136, 215, 10.1016/j.cell.2009.01.002 · DOI · Paper page
  9. Betel, 2008, The microRNA.org resource: targets and expression, Nucleic Acids Research, 36, D149, 10.1093/nar/gkm995 · DOI
  10. Beveridge, 2008, Dysregulation of miRNA 181b in the temporal cortex in schizophrenia, Human Molecular Genetics, 17, 1156, 10.1093/hmg/ddn005 · DOI
  11. Bliss, 1993, A synaptic model of memory: long-term potentiation in the hippocampus, Nature, 361, 31, 10.1038/361031a0 · DOI · Paper page
  12. Burré, 2010, Alpha-synuclein promotes SNARE-complex assembly in vivo and in vitro, Science, 329, 1663, 10.1126/science.1195227 · DOI
  13. Cetin, 2006, Stereotaxic gene delivery in the rodent brain, Nature Protocols, 1, 3166, 10.1038/nprot.2006.450 · DOI
  14. Dalla, 2009, Female rats learn trace memories better than male rats and consequently retain a greater proportion of new neurons in their hippocampi, PNAS, 106, 2927, 10.1073/pnas.0809650106 · DOI
  15. De Felice, 2014, miR-338-3p is over-expressed in blood, CFS, serum and spinal cord from sporadic amyotrophic lateral sclerosis patients, Neurogenetics, 15, 243, 10.1007/s10048-014-0420-2 · DOI
  16. Doxakis, 2010, Post-transcriptional regulation of alpha-synuclein expression by mir-7 and mir-153, Journal of Biological Chemistry, 285, 12726, 10.1074/jbc.M109.086827 · DOI · Paper page
  17. ENCODE Project Consortium, 2012, An integrated encyclopedia of DNA elements in the human genome, Nature, 489, 57, 10.1038/nature11247 · DOI · Paper page
  18. Fanselow, 1980, Conditioned and unconditional components of post-shock freezing, The Pavlovian Journal of Biological Science, 15, 177, 10.1007/BF03001163 · DOI
  19. Fanselow, 2000, Contextual fear, gestalt memories, and the hippocampus, Behavioural Brain Research, 110, 73, 10.1016/S0166-4328(99)00186-2 · DOI
  20. Flavell, 2008, Signaling mechanisms linking neuronal activity to gene expression and plasticity of the nervous system, Annual Review of Neuroscience, 31, 563, 10.1146/annurev.neuro.31.060407.125631 · DOI · Paper page
  21. Frankland, 2004, Consolidation of CS and US representations in associative fear conditioning, Hippocampus, 14, 557, 10.1002/hipo.10208 · DOI
  22. Friedman, 2009, Most mammalian mRNAs are conserved targets of microRNAs, Genome Research, 19, 92, 10.1101/gr.082701.108 · DOI · Paper page
  23. Gaffield, 2006, Imaging synaptic vesicle exocytosis and endocytosis with FM dyes, Nature Protocols, 6, 2916, 10.1038/nprot.2006.476 · DOI
  24. Gaidatzis, 2007, Inference of miRNA targets using evolutionary conservation and pathway analysis, BMC Bioinformatics, 8, 69, 10.1186/1471-2105-8-69 · DOI
  25. Griffiths-Jones, 2008, miRBase: tools for microRNA genomics, Nucleic Acids Research, 36, D154, 10.1093/nar/gkm952 · DOI
  26. Gureviciene, 2007, Role of alpha-synuclein in synaptic glutamate release, Neurobiology of Disease, 28, 83, 10.1016/j.nbd.2007.06.016 · DOI
  27. Hardy, 2002, The amyloid hypothesis of Alzheimer's disease: progress and problems on the road to therapeutics, Science, 297, 353, 10.1126/science.1072994 · DOI · Paper page
  28. Hayashi, 2004, Tyrosine phosphorylation and regulation of the AMPA receptor by SRC family tyrosine kinases, Journal of Neuroscience, 24, 6152, 10.1523/JNEUROSCI.0799-04.2004 · DOI · Paper page
  29. Hébert, 2008, Loss of microRNA cluster miR-29a/b-1 in sporadic Alzheimer's disease correlates with increased BACE1/beta-secretase expression, PNAS, 105, 6415, 10.1073/pnas.0710263105 · DOI · Paper page
  30. Ifrim, 2015, Single-Molecule imaging of PSD-95 mRNA translation in dendrites and its Dysregulation in a mouse model of fragile X syndrome, Journal of Neuroscience, 35, 7116, 10.1523/JNEUROSCI.2802-14.2015 · DOI
  31. Jacobsson, 1994, Identification of synaptic proteins and their isoform mRNAs in compartments of pancreatic endocrine cells, PNAS, 91, 12487, 10.1073/pnas.91.26.12487 · DOI
  32. Jerman, 2006, Disconnection analysis of CA3 and DG in mediating encoding but not retrieval in a spatial maze learning task, Learning & Memory, 13, 458, 10.1101/lm.246906 · DOI
  33. Johnson, 2008, A microRNA-based gene dysregulation pathway in Huntington's disease, Neurobiology of Disease, 29, 438, 10.1016/j.nbd.2007.11.001 · DOI · Paper page
  34. Jurado, 2013, LTP requires a unique postsynaptic SNARE fusion machinery, Neuron, 77, 542, 10.1016/j.neuron.2012.11.029 · DOI · Paper page
  35. Kandel, 2001, The molecular biology of memory storage: a dialogue between genes and synapses, Science, 294, 1030, 10.1126/science.1067020 · DOI · Paper page
  36. Kocerha, 2009, MicroRNA-219 modulates NMDA receptor-mediated neurobehavioral dysfunction, PNAS, 106, 3507, 10.1073/pnas.0805854106 · DOI
  37. Kozomara, 2014, miRBase: annotating high confidence microRNAs using deep sequencing data, Nucleic Acids Research, 42, D68, 10.1093/nar/gkt1181 · DOI · Paper page
  38. Krek, 2005, Combinatorial microRNA target predictions, Nature Genetics, 37, 495, 10.1038/ng1536 · DOI · Paper page
  39. Kubik, 2007, Using immediate-early genes to map hippocampal subregional functions, Learning & Memory, 14, 758, 10.1101/lm.698107 · DOI
  40. Kye, 2011, NMDA mediated contextual conditioning changes miRNA expression, PLoS One, 6, e24682, 10.1371/journal.pone.0024682 · DOI
  41. Lee, 2004, Differential contributions of dorsal hippocampal subregions to memory acquisition and retrieval in contextual fear-conditioning, Hippocampus, 14, 301, 10.1002/hipo.10177 · DOI
  42. Lee, 2004, Encoding versus retrieval of spatial memory: double dissociation between the dentate gyrus and the perforant path inputs into CA3 in the dorsal hippocampus, Hippocampus, 14, 66, 10.1002/hipo.10167 · DOI
  43. Lewis, 2005, Conserved seed pairing, often flanked by adenosines, indicates that thousands of human genes are microRNA targets, Cell, 120, 15, 10.1016/j.cell.2004.12.035 · DOI · Paper page
  44. Lewis, 2003, Prediction of mammalian microRNA targets, Cell, 115, 787, 10.1016/S0092-8674(03)01018-3 · DOI · Paper page
  45. Li, 2007, The role of chromatin during transcription, Cell, 128, 707, 10.1016/j.cell.2007.01.015 · DOI
  46. Liang, 2012, MicroRNA-153 negatively regulates the expression of amyloid precursor protein and amyloid precursor-like protein 2, Brain Research, 1455, 103, 10.1016/j.brainres.2011.10.051 · DOI
  47. Lim, 2005, Microarray analysis shows that some microRNAs downregulate large numbers of target mRNAs, Nature, 433, 769, 10.1038/nature03315 · DOI · Paper page
  48. Lovén, 2010, MYCN-regulated microRNAs repress estrogen receptor-alpha (ESR1) expression and neuronal differentiation in human neuroblastoma, PNAS, 107, 1553, 10.1073/pnas.0913517107 · DOI
  49. Lu, 2001, Activation of synaptic NMDA receptors induces membrane insertion of new AMPA receptors and LTP in cultured hippocampal neurons, Neuron, 29, 243, 10.1016/S0896-6273(01)00194-5 · DOI
  50. Lukiw, 2012, Studying micro RNA function and dysfunction in Alzheimer's Disease, Frontiers in Genetics, 3, 327, 10.3389/fgene.2012.00327 · DOI
  51. Lynch, 2004, Long-term potentiation and memory, Physiological Reviews, 84, 87, 10.1152/physrev.00014.2003 · DOI
  52. Malinow, 2002, AMPA receptor trafficking and synaptic plasticity, Annual Review of Neuroscience, 25, 103, 10.1146/annurev.neuro.25.112701.142758 · DOI · Paper page
  53. Malmevik, 2016, Distinct cognitive effects and underlying transcriptome changes upon inhibition of individual miRNAs in hippocampal neurons, Scientific Reports, 6, 19879, 10.1038/srep19879 · DOI
  54. Mandemakers, 2013, Co-regulation of intragenic microRNA miR-153 and its host gene Ia-2 β: identification of miR-153 target genes with functions related to IA-2β in pancreas and brain, Diabetologia, 56, 1547, 10.1007/s00125-013-2901-5 · DOI
  55. Maren, 1994, Water deprivation enhances fear conditioning to contextual, but not discrete, conditional stimuli in rats, Behavioral Neuroscience, 108, 645, 10.1037/0735-7044.108.3.645 · DOI
  56. Martin, 2000, Synaptic plasticity and memory: an evaluation of the hypothesis, Annual Review of Neuroscience, 23, 649, 10.1146/annurev.neuro.23.1.649 · DOI · Paper page
  57. Matsuo, 2008, Spine-type-specific recruitment of newly synthesized AMPA receptors with learning, Science, 319, 1104, 10.1126/science.1149967 · DOI
  58. Matthies, 1990, Different mechanisms and multiple stages of LTP, Advances in Experimental Medicine and Biology, 268, 359, 10.1007/978-1-4684-5769-8_39 · DOI
  59. McNeill, 2012, MicroRNAs shape the neuronal landscape, Neuron, 75, 363, 10.1016/j.neuron.2012.07.005 · DOI · Paper page
  60. Milner, 1998, Cognitive neuroscience and the study of memory, Neuron, 20, 445, 10.1016/S0896-6273(00)80987-3 · DOI
  61. Mostov, 2003, Polarized epithelial membrane traffic: conservation and plasticity, Nature Cell Biology, 5, 287, 10.1038/ncb0403-287 · DOI
  62. Mouradian, 2012, MicroRNAs in Parkinson's disease, Neurobiology of Disease, 46, 279, 10.1016/j.nbd.2011.12.046 · DOI
  63. Nelson, 2008, MicroRNAs (miRNAs) in neurodegenerative diseases, Brain Pathology, 18, 130, 10.1111/j.1750-3639.2007.00120.x · DOI
  64. Nishimura, 2010, IA-2 modulates dopamine secretion in PC12 cells, Molecular and Cellular Endocrinology, 315, 81, 10.1016/j.mce.2009.09.023 · DOI
  65. Nishimura, 2009, Disturbances in the secretion of neurotransmitters in IA-2/IA-2beta null mice: changes in behavior, learning and lifespan, Neuroscience, 159, 427, 10.1016/j.neuroscience.2009.01.022 · DOI
  66. Nudelman, 2010, Neuronal activity rapidly induces transcription of the CREB-regulated microRNA-132, in vivo, Hippocampus, 20, 492, 10.1002/hipo.20646 · DOI
  67. Ostroff, 2002, Polyribosomes redistribute from dendritic shafts into spines with enlarged synapses during LTP in developing rat hippocampal slices, Neuron, 35, 535, 10.1016/S0896-6273(02)00785-7 · DOI · Paper page
  68. Perkins, 2007, microRNA expression in the prefrontal cortex of individuals with schizophrenia and schizoaffective disorder, Genome Biology, 8, R27, 10.1186/gb-2007-8-2-r27 · DOI · Paper page
  69. Phillips, 1992, Differential contribution of amygdala and hippocampus to cued and contextual fear conditioning, Behavioral Neuroscience, 106, 274, 10.1037/0735-7044.106.2.274 · DOI · Paper page
  70. Pickard, 2001, Transient synaptic activation of NMDA receptors leads to the insertion of native AMPA receptors at hippocampal neuronal plasma membranes, Neuropharmacology, 41, 700, 10.1016/S0028-3908(01)00127-7 · DOI
  71. Raymond, 2000, Metabotropic glutamate receptors trigger homosynaptic protein synthesis to prolong long-term potentiation, Journal of Neuroscience, 20, 969, 10.1523/JNEUROSCI.20-03-00969.2000 · DOI
  72. Rempel-Clower, 1996, Three cases of enduring memory impairment after bilateral damage limited to the hippocampal formation, Journal of Neuroscience, 16, 5233, 10.1523/JNEUROSCI.16-16-05233.1996 · DOI
  73. Rizo, 2008, Synaptic vesicle fusion, Nature Structural & Molecular Biology, 15, 665, 10.1038/nsmb.1450 · DOI
  74. Schoch, 2006, Molecular organization of the presynaptic active zone, Cell and Tissue Research, 326, 379, 10.1007/s00441-006-0244-y · DOI
  75. Shepherd, 2007, The cell biology of synaptic plasticity: AMPA receptor trafficking, Annual Review of Cell and Developmental Biology, 23, 613, 10.1146/annurev.cellbio.23.090506.123516 · DOI · Paper page
  76. Shi, 1999, Rapid spine delivery and redistribution of AMPA receptors after synaptic NMDA receptor activation, Science, 284, 1811, 10.1126/science.284.5421.1811 · DOI · Paper page
  77. Shioya, 2010, Aberrant microRNA expression in the brains of neurodegenerative diseases: miR-29a decreased in Alzheimer disease brains targets neurone navigator 3, Neuropathology and Applied Neurobiology, 36, 320, 10.1111/j.1365-2990.2010.01076.x · DOI · Paper page
  78. Siegert, 2015, The schizophrenia risk gene product miR-137 alters presynaptic plasticity, Nature Neuroscience, 18, 1008, 10.1038/nn.4023 · DOI · Paper page
  79. Singleton, 2003, alpha-Synuclein locus triplication causes Parkinson's disease, Science, 302, 841, 10.1126/science.1090278 · DOI · Paper page
  80. Smalheiser, 2010, Olfactory discrimination training up-regulates and reorganizes expression of microRNAs in adult mouse hippocampus, ASN Neuro, 2, e00028, 10.1042/AN20090055 · DOI
  81. Sutton, 2006, Dendritic protein synthesis, synaptic plasticity, and memory, Cell, 127, 49, 10.1016/j.cell.2006.09.014 · DOI
  82. Söllner, 1993, A protein assembly-disassembly pathway in vitro that may correspond to sequential steps of synaptic vesicle docking, activation, and fusion, Cell, 75, 409, 10.1016/0092-8674(93)90376-2 · DOI
  83. Söllner, 1993, SNAP receptors implicated in vesicle targeting and fusion, Nature, 362, 318, 10.1038/362318a0 · DOI
  84. Südhof, 2009, Membrane fusion: grappling with SNARE and SM proteins, Science, 323, 474, 10.1126/science.1161748 · DOI · Paper page
  85. Südhof, 2013, Neurotransmitter release: the last millisecond in the life of a synaptic vesicle, Neuron, 80, 675, 10.1016/j.neuron.2013.10.022 · DOI · Paper page
  86. Tao, 1998, Ca2+ influx regulates BDNF transcription by a CREB family transcription factor-dependent mechanism, Neuron, 20, 709, 10.1016/S0896-6273(00)81010-7 · DOI · Paper page
  87. Tatarakis, 2008, Dominant and redundant functions of TFIID involved in the regulation of hepatic genes, Molecular Cell, 31, 531, 10.1016/j.molcel.2008.07.013 · DOI
  88. tom Dieck, 1998, Bassoon, a novel zinc-finger CAG/glutamine-repeat protein selectively localized at the active zone of presynaptic nerve terminals, The Journal of Cell Biology, 142, 499, 10.1083/jcb.142.2.499 · DOI · Paper page
  89. Weber, 1998, SNAREpins: minimal machinery for membrane fusion, Cell, 92, 759, 10.1016/S0092-8674(00)81404-X · DOI
  90. Wei, 2013, miR-153 regulates SNAP-25, synaptic transmission, and neuronal development, PLoS One, 8, e57080, 10.1371/journal.pone.0057080 · DOI
  91. Whitlock, 2006, Learning induces long-term potentiation in the hippocampus, Science, 313, 1093, 10.1126/science.1128134 · DOI · Paper page
  92. Xu, 2015, The Ia-2β intronic miRNA, miR-153, is a negative regulator of insulin and dopamine secretion through its effect on the Cacna1c gene in mice, Diabetologia, 58, 2298, 10.1007/s00125-015-3683-8 · DOI
  93. Xu, 2010, Downregulations of B-cell lymphoma 2 and myeloid cell leukemia sequence 1 by microRNA 153 induce apoptosis in a Glioblastoma cell line DBTRG-05MG, International Journal of Cancer, 126, 1029, 10.1002/ijc.24823 · DOI

Cited by

Sorted by citations

See all 39

Metadata

Authors
Mathew, R. S., Tatarakis, A., Rudenko, A., Johnson-Venkatesh, E. M., Yang, Y. J., Murphy, E. A., Todd, T. P., Schepers, S. T., Siuti, N., Martorell, A. J., Falls, W. A., Hammack, S. E., Walsh, C. A., Tsai, L.-H., Umemori, H., Bouton, M. E., & Moazed, D.
Affiliations
  • Department of Cell Biology, Howard Hughes Medical Institute, Harvard Medical School, Boston, United States
  • Department of Brain and Cognitive Sciences Massachusetts Institute of Technology, The Picower Institute for Learning and Memory, Cambridge, United States
  • Department of Neurology, FM Kirby Neurobiology Center, Boston Children’s Hospital, Harvard Medical School, Boston, United States
  • Division of Genetics, Howard Hughes Medical Institute, Manton Center for Orphan Disease Research, Boston Children's Hospital, Boston, United States
  • Department of Psychology, University of Vermont, Burlington, United States
Venue
eLife
Published
2016-12-21
Volume
5
ISSN
2050-084X
Cited by
39
References
11
Language
en
Funders
  • Damon Runyon Cancer Research Foundation (DRG-2042–10)
  • European Molecular Biology Organization (Long-term fellowship ALTF 197-2009)
  • Brain and Behavior Research Foundation (NARSAD Young Investigator Award)
  • Howard Hughes Medical Institute
  • National Institutes of Health (AG047661, MH091429, NS0925578, DA033123)
  • JPB Foundation
  • Biogen Idec

About these checks

Registry, retraction, Cites and statistics results are computed, not judged, with one exception: a printed reference that no index lists is read once by a model before it counts as a citation error. Claims are extracted by a model and kept only when their quote appears verbatim in the text; each cited source is then checked, with a model’s help, for whether it says what the claim relies on. Those verdicts can be wrong — read the claim’s quote and the cited source before relying on one.

Statistics and arithmetic are recomputed, not judged.

Confidence bands are shown only for fields calibrated on our annotated test set. None is calibrated yet, so no band is shown.

What counts as a claim ›How we measure confidence ›How we check this ›

Are you an author, or do you see a problem with this page? Request a review

How to cite

Cite CoChat for the checks on this page, and the paper for its own findings.

This page
CoChat. (2026). Citation check: A microRNA negative feedback loop downregulates vesicle transport and inhibits fear memory. https://app.cochat.ai/papers/10.7554/elife.22467
The paper
Mathew, R. S., Tatarakis, A., Rudenko, A., Johnson-Venkatesh, E. M., Yang, Y. J., Murphy, E. A., Todd, T. P., Schepers, S. T., Siuti, N., Martorell, A. J., Falls, W. A., Hammack, S. E., Walsh, C. A., Tsai, L.-H., Umemori, H., Bouton, M. E., & Moazed, D. (2016). A microRNA negative feedback loop downregulates vesicle transport and inhibits fear memory. eLife. https://doi.org/10.7554/elife.22467