

The DOI matches its Crossref record; 78 of the 78 references it cites were found in a registry or an index.
White matter maturation profiles through early childhood predict general cognitive ability
Open accessAbstract
Infancy and early childhood are periods of rapid brain development, during which brain structure and function mature alongside evolving cognitive ability. An important neurodevelopmental process during this postnatal period is the maturation of the myelinated white matter, which facilitates rapid communication across neural systems and networks. Though prior brain imaging studies in children (4 years of age and above), adolescents, and adults have consistently linked white matter development with cognitive maturation and intelligence, few studies have examined how these processes are related throughout early development (birth to 4 years of age). Here, we show that the profile of white matter myelination across the first 5 years of life is strongly and specifically related to cognitive ability. Using a longitudinal design, coupled with advanced magnetic resonance imaging, we demonstrate that children with above-average ability show differential trajectories of myelin development compared to average and below average ability children, even when controlling for socioeconomic status, gestation, and birth weight. Specifically, higher ability children exhibit slower but more prolonged early development, resulting in overall increased myelin measures by ~3 years of age. These results provide new insight into the early neuroanatomical correlates of cognitive ability, and suggest an early period of prolonged maturation with associated protracted white matter plasticity may result in strengthened neural networks that can better support later development. Further, these results reinforce the necessity of a longitudinal perspective in investigating typical or suspected atypical cognitive maturation.
Overview
The claims and statistics of this paper haven’t been checked yet.
Run the check — free, no account needed. It reads the open-access text and checks the sources it cites.
Integrity signals
Registry
Cites
Statistics
Figures
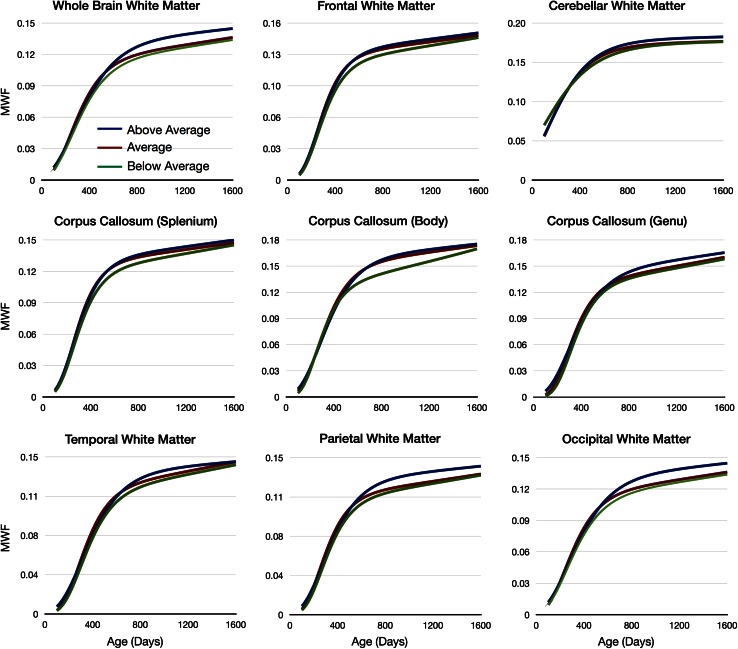
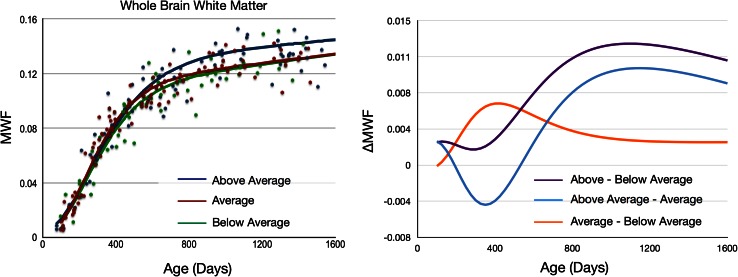
Verification
Claims the paper makes
The claims and statistics of this paper haven’t been checked yet.
Run the check — free, no account needed. It reads the open-access text and checks the sources it cites.
Claims other papers make about this one
Each is checked against this paper’s own text: does it say what the citing paper says it does?
In the citing paper
“age-dependent relationships between myelination and general cognitive ability from 3 months to 5 years200.”
From Imaging structural and functional brain development in early childhood (2018) · cites this paper as [200]
Self-check
Percentages, sums and reported differences re-computed from the paper’s own numbers.
The self-check needs the paper’s full text.
Citations
Cites
An Introduction to the Bootstrap
Efron, B., & Tibshirani, R. J. (1993) · doi:10.1007/978-1-4899-4541-9 · Cited by 21,230
Jenkinson, M., Bannister, P., Brady, M., & Smith, S. (2002) · NeuroImage · doi:10.1006/nimg.2002.1132 · Cited by 11,888
Fast robust automated brain extraction
Smith, S. M. (2002) · Human Brain Mapping · doi:10.1002/hbm.10062 · Cited by 10,496
Four Factor Index of Social Status
Paschou, R. (1975) · Cited by 6,989
Brain development during childhood and adolescence: a longitudinal MRI study
Giedd, J. N., Blumenthal, J., Jeffries, N. O., Castellanos, F. X., Liu, H., Zijdenbos, A., Paus, T., Evans, A. C., & Rapoport, J. L. (1999) · Nature Neuroscience · doi:10.1038/13158 · Cited by 5,552
SMITH, S., & NICHOLS, T. (2009) · NeuroImage · doi:10.1016/j.neuroimage.2008.03.061 · Cited by 5,250
A reproducible evaluation of ANTs similarity metric performance in brain image registration
Avants, B. B., Tustison, N. J., Song, G., Cook, P. A., Klein, A., & Gee, J. C. (2011) · NeuroImage · doi:10.1016/j.neuroimage.2010.09.025 · Cited by 4,796
An Introduction to the Bootstrap.
Buckland, S. T., Efron, B., & Tibshirani, R. J. (1994) · Biometrics · doi:10.2307/2532810 · Cited by 3,236
Within-subject template estimation for unbiased longitudinal image analysis
Reuter, M., Schmansky, N. J., Rosas, H. D., & Fischl, B. (2012) · NeuroImage · doi:10.1016/j.neuroimage.2012.02.084 · Cited by 2,356
Mullen Scales of Early Learning
Bradley‐Johnson, S. (1997) · Psychology in the Schools · doi:10.1002/(sici)1520-6807(199710)34:4 · Cited by 2,329
Nonlinear Mixed Effects Models for Repeated Measures Data
Lindstrom, M. J., & Bates, D. M. (1990) · Biometrics · doi:10.2307/2532087 · Cited by 1,793
Plasticity in gray and white: neuroimaging changes in brain structure during learning
Zatorre, R. J., Fields, R. D., & Johansen-Berg, H. (2012) · Nature Neuroscience · doi:10.1038/nn.3045 · Cited by 1,685
A tension-based theory of morphogenesis and compact wiring in the central nervous system
Essen, D. C. V. (1997) · Nature · doi:10.1038/385313a0 · Cited by 1,668
Intellectual ability and cortical development in children and adolescents
Shaw, P., Greenstein, D., Lerch, J., Clasen, L., Lenroot, R., Gogtay, N., Evans, A., Rapoport, J., & Giedd, J. (2006) · Nature · doi:10.1038/nature04513 · Cited by 1,543
Longitudinal Mapping of Cortical Thickness and Brain Growth in Normal Children
Sowell, E. R., Thompson, P. M., Leonard, C. M., Welcome, S. E., Kan, E., & Toga, A. W. (2004) · The Journal of Neuroscience · doi:10.1523/jneurosci.1798-04.2004 · Cited by 1,481
Microstructural maturation of the human brain from childhood to adulthood
Lebel, C., Walker, L., Leemans, A., Phillips, L., & Beaulieu, C. (2008) · NeuroImage · doi:10.1016/j.neuroimage.2007.12.053 · Cited by 1,398
Self-citationWhite matter in learning, cognition, and psychiatric disorders
Fields, R. D. (2008) · Trends in Neurosciences · doi:10.1016/j.tins.2008.04.001 · Cited by 1,337
Longitudinal Development of Human Brain Wiring Continues from Childhood into Adulthood
Lebel, C., & Beaulieu, C. (2011) · Journal of Neuroscience · doi:10.1523/jneurosci.5302-10.2011 · Cited by 1,193
Just, M. A., Cherkassky, V. L., Keller, T. A., Kana, R. K., & Minshew, N. J. (2007) · Cerebral Cortex · doi:10.1093/cercor/bhl006 · Cited by 1,081
Leiter International Performance Scale-Revised
Sullivan, S. A. (1998) · Psychology in the Schools · doi:10.1002/(sici)1520-6807(199804)35:2 · Cited by 1,012
Functional brain development in humans
Johnson, M. H. (2001) · Nature Reviews Neuroscience · doi:10.1038/35081509 · Cited by 980
In vivo visualization of myelin water in brain by magnetic resonance
MacKay, A. L., Whittall, K. P., Adler, J., Li, D. K. B., Paty, D. W., & Graeb, D. A. (1994) · Magnetic Resonance in Medicine · doi:10.1002/mrm.1910310614 · Cited by 916
Gur, R. C., Turetsky, B. I., Matsui, M., Yan, M., Bilker, W., Hughett, P., & Gur, R. E. (1999) · The Journal of Neuroscience · doi:10.1523/jneurosci.19-10-04065.1999 · Cited by 909
Brain development, gender and IQ in children
Reiss, A. L., Abrams, M. T., Singer, H. S., ROSS, J. L., & DENCKLA, M. B. (1996) · Brain · doi:10.1093/brain/119.5.1763 · Cited by 902
Mapping early brain development in autism
Courchesne, E., Pierce, K., Schumann, C. M., Redcay, E., Buckwalter, J. A., Kennedy, D. P., & Morgan, J. (2007) · Neuron · doi:10.1016/j.neuron.2007.10.016 · Cited by 860
Nagy, Z., Westerberg, H., & Klingberg, T. (2004) · Journal of Cognitive Neuroscience · doi:10.1162/0898929041920441 · Cited by 794
Imitation performance in toddlers with autism and those with other developmental disorders
Rogers, S. J., Hepburn, S. L., Stackhouse, T., & Wehner, E. (2003) · Journal of Child Psychology and Psychiatry · doi:10.1111/1469-7610.00162 · Cited by 648
Changes in cerebral functional organization during cognitive development
Casey, B. J., Galván, A., & Hare, T. A. (2005) · Current Opinion in Neurobiology · doi:10.1016/j.conb.2005.03.012 · Cited by 506
Mapping Infant Brain Myelination with Magnetic Resonance Imaging
Deoni, S. C. L., Mercure, E., Blasi, A., Gasston, D., Thomson, A., Johnson, M., Williams, S. C. R., & Murphy, D. G. M. (2011) · The Journal of Neuroscience · doi:10.1523/jneurosci.2106-10.2011 · Cited by 497
Self-citationGleaning multicomponent T 1 and T 2 information from steady‐state imaging data
Deoni, S., Rutt, B. K., Arun, T., Pierpaoli, C. M., & Jones, D. K. (2008) · Magnetic Resonance in Medicine · doi:10.1002/mrm.21704 · Cited by 473
Self-citationTuning the developing brain to social signals of emotions
Leppänen, J. M., & Nelson, C. A. (2008) · Nature reviews. Neuroscience · doi:10.1038/nrn2554 · Cited by 457
Intelligence and brain structure in normal individuals
Andreasen, N. C., Flaum, M., Swayze, V. W., OʼLeary, D. S., Alliger, R. J., Cohen, G., Ehrhardt, J. C., & Yuh, W. T. C. (1993) · American Journal of Psychiatry · doi:10.1176/ajp.150.1.130 · Cited by 419
Deoni, S. C. L., Dean, D. C., O'Muircheartaigh, J., Dirks, H., & Jerskey, B. A. (2012) · NeuroImage · doi:10.1016/j.neuroimage.2012.07.037 · Cited by 390
Self-citationSchmithorst, V. J., Wilke, M., Dardzinski, B. J., & Holland, S. K. (2005) · Human Brain Mapping · doi:10.1002/hbm.20149 · Cited by 382
MYELINATION AS A VULNERABLE PERIOD IN BRAIN DEVELOPMENT
Davison, A. N., & Dobbing, J. (1966) · British Medical Bulletin · doi:10.1093/oxfordjournals.bmb.a070434 · Cited by 380
Myelin water imaging of multiple sclerosis at 7 T: Correlations with histopathology
Laule, C., Kozłowski, P., Leung, E., Li, D. K. B., MacKay, A. L., & Moore, G. R. W. (2007) · NeuroImage · doi:10.1016/j.neuroimage.2007.12.008 · Cited by 379
Human intelligence and brain networks
Colom, R., Karama, S., Jung, R. E., & Haier, R. J. (2010) · Dialogues in Clinical Neuroscience · doi:10.31887/dcns.2010.12.4/rcolom · Cited by 368
Relationships between IQ and Regional Cortical Gray Matter Thickness in Healthy Adults
Narr, K. L., Woods, R. P., Thompson, P. M., Szeszko, P. R., Robinson, D. G., Dimtcheva, T., Gurbani, M. N., Toga, A. W., & Bilder, R. M. (2006) · Cerebral Cortex · doi:10.1093/cercor/bhl125 · Cited by 351
Phonological decisions require both the left and right supramarginal gyri
Hartwigsen, G., Baumgaertner, A., Price, C. J., Koehnke, M., Ulmer, S., & Siebner, H. R. (2010) · Proceedings of the National Academy of Sciences · doi:10.1073/pnas.1008121107 · Cited by 346 · cited 2×
“2003), lesion and more recent TMS studies suggest the right supramarginal gyrus plays an important role in phonological processing (Hartwigsen et al. 2010).”
BackgroundKindergarten Predictors of Math Learning Disability
Mazzocco, M. M. M., & Thompson, R. E. (2005) · Learning Disabilities Research and Practice · doi:10.1111/j.1540-5826.2005.00129.x · Cited by 342
MRI of normal brain maturation.
Holland, B. A., Haas, D. K., Norman, D. M., Brant-Zawadzki, M. N., & Newton, T. H. (1986) · PubMed Central · Cited by 334
What have we learned about cognitive development from neuroimaging?
Durston, S., & Casey, B. J. (2005) · Neuropsychologia · doi:10.1016/j.neuropsychologia.2005.10.010 · Cited by 319
Brain development in autism: Early overgrowth followed by premature arrest of growth
Courchesne, E. (2004) · Mental Retardation and Developmental Disabilities Research Reviews · doi:10.1002/mrdd.20020 · Cited by 310
When does human brain development end? Evidence of corpus callosum growth up to adulthood
Pujol, J., Vendrell, P., Junqué, C., Martí‐Vilalta, J. L., & Capdevila, A. (1993) · Annals of Neurology · doi:10.1002/ana.410340113 · Cited by 295
Peak Performance and Age Among Superathletes: Track and Field, Swimming, Baseball, Tennis, and Golf
Schulz, R., & Curnow, C. (1988) · Journal of Gerontology · doi:10.1093/geronj/43.5.p113 · Cited by 282
Change in the Brain's White Matter
Fields, R. D. (2010) · Science · doi:10.1126/science.1199139 · Cited by 265
Dean, D. C., Jerskey, B. A., Chen, K., Protas, H., Thiyyagura, P., Roontiva, A., O'Muircheartaigh, J., Dirks, H., Waskiewicz, N., Lehman, K., et al. (2014) · JAMA Neurology · doi:10.1001/jamaneurol.2013.4544 · Cited by 263
Self-citationLarge-Scale Use of the Modified Checklist for Autism in Low-Risk Toddlers
Chlebowski, C., Robins, D. L., Barton, M. L., & Fein, D. (2013) · Pediatrics · doi:10.1542/peds.2012-1525 · Cited by 258 · cited 3×
“In addition to the Mullen’s, assessments of abnormal behavior, including the Modified Checklist for Autism in Toddlers (M-CHAT) (Chlebowski et al. 2013) and the Communication and Symbolic Behavior Scales Developmental Profile (CSBS-DP) (Wetherby et al. 2002), were used to identify children who may…”
MethodDevelopmental aspects of language processing: fMRI of verbal fluency in children and adults
Gaillard, W. D., Sachs, B. C., Whitnah, J. R., Ahmad, Z., Balsamo, L. M., Petrella, J. R., Braniecki, S. H., McKinney, C. M., Hunter, K., Xu, B., et al. (2003) · Human Brain Mapping · doi:10.1002/hbm.10091 · Cited by 248
Verbal and non-verbal intelligence changes in the teenage brain
Ramsden, S., Richardson, F. M., Josse, G., Thomas, M. S. C., Ellis, C., Shakeshaft, C., Seghier, M. L., & Price, C. J. (2011) · Nature · doi:10.1038/nature10514 · Cited by 246
Mapping corpus callosum deficits in autism: An index of aberrant cortical connectivity
Vidal, C. N., Nicolson, R., DeVito, T. J., Hayashi, K. M., Geaga, J. A., Drost, D. J., Williamson, P. C., Rajakumar, N., Sui, Y., Dutton, R. A., et al. (2006) · Biological Psychiatry · doi:10.1016/j.biopsych.2005.11.011 · Cited by 244
Mapping IQ and gray matter density in healthy young people
Frangou, S., Chitins, X., & Williams, S. (2004) · NeuroImage · doi:10.1016/j.neuroimage.2004.05.027 · Cited by 221
Multimodal imaging of the self-regulating developing brain
Fjell, A. M., Walhovd, K. B., Brown, T. T., Kuperman, J. M., Chung, Y., Hagler, D. J., Venkatraman, V., Roddey, J. C., Erhart, M., McCabe, C., et al. (2012) · Proceedings of the National Academy of Sciences · doi:10.1073/pnas.1208243109 · Cited by 212
White matter development and early cognition in babies and toddlers
O'Muircheartaigh, J., Dean, D. C., Ginestet, C. E., Walker, L., Waskiewicz, N., Lehman, K., Dirks, H., Piryatinsky, I., & Deoni, S. C. L. (2014) · Human Brain Mapping · doi:10.1002/hbm.22488 · Cited by 183
Self-citationCharacterizing longitudinal white matter development during early childhood
Dean, D. C., O’Muircheartaigh, J., Dirks, H., Waskiewicz, N., Walker, L., Doernberg, E., Piryatinsky, I., & Deoni, S. C. L. (2015) · Brain Structure and Function · doi:10.1007/s00429-014-0763-3 · Cited by 174
Self-citationBright spots: correlations of gray matter volume with IQ in a normal pediatric population
Wilke, M., Sohn, J., Byars, A. W., & Holland, S. K. (2003) · NeuroImage · doi:10.1016/s1053-8119(03)00199-x · Cited by 171
Modeling healthy male white matter and myelin development: 3 through 60months of age
Dean, D. C., O'Muircheartaigh, J., Dirks, H., Waskiewicz, N., Lehman, K., Walker, L., Han, M., & Deoni, S. C. L. (2014) · NeuroImage · doi:10.1016/j.neuroimage.2013.09.058 · Cited by 163
Self-citationPreventive Interventions for ADHD: A Neurodevelopmental Perspective
Halperin, J. M., Bedard, A., & Curchack, J. T. (2012) · Neurotherapeutics · doi:10.1007/s13311-012-0123-z · Cited by 151
Deoni, S., Matthews, L., & Kolind, S. (2012) · Magnetic Resonance in Medicine · doi:10.1002/mrm.24429 · Cited by 145
Self-citationPediatric neuroimaging using magnetic resonance imaging during non-sedated sleep
Dean, D. C., Dirks, H., O’Muircheartaigh, J., Walker, L., Jerskey, B. A., Lehman, K., Han, M., Waskiewicz, N., & Deoni, S. C. L. (2014) · Pediatric Radiology · doi:10.1007/s00247-013-2752-8 · Cited by 138
Self-citationZhou, X., Qiu, T., Ke, X., Xiao, X., Xiao, T., Liang, F., Zou, B., Huang, H., Fang, H., Chu, K., et al. (2014) · Journal of Autism and Developmental Disorders · doi:10.1007/s10803-014-2033-x · Cited by 133
Myelin water imaging reflects clinical variability in multiple sclerosis
Kolind, S., Matthews, L., Johansen‐Berg, H., Leite, M. I., Williams, S., Deoni, S., & Palace, J. A. (2011) · NeuroImage · doi:10.1016/j.neuroimage.2011.11.070 · Cited by 131
Self-citationBorghesani, P. R., Madhyastha, T. M., Aylward, E., Reiter, M. A., Swarny, B. R., Schaie, K. W., & Willis, S. L. (2013) · Neuropsychologia · doi:10.1016/j.neuropsychologia.2013.03.005 · Cited by 124
Deoni, S. (2010) · Magnetic Resonance in Medicine · doi:10.1002/mrm.22685 · Cited by 111
Self-citationNonparametric Regression Methods for Longitudinal Data Analysis. Mixed-effects Modeling Approaches
Crainiceanu, C. M. (2007) · Journal of the American Statistical Association · doi:10.1198/jasa.2007.s189 · Cited by 108
Associations between white matter microstructure and infants' working memory
Short, S. J., Elison, J. T., Goldman, B. D., Styner, M., Gu, H., Connelly, M., Maltbie, E., Woolson, S., Lin, W., Gerig, G., et al. (2013) · NeuroImage · doi:10.1016/j.neuroimage.2012.09.021 · Cited by 105
Self-citationMR Relaxation in Multiple Sclerosis
MacKay, A. L., Vavasour, I. M., Rauscher, A., Kolind, S., Mädler, B., Moore, G. R. W., Traboulsee, A. L., Li, D. K. B., & Laule, C. (2008) · Neuroimaging Clinics of North America · doi:10.1016/j.nic.2008.09.007 · Cited by 95
Tang, C. Y., Eaves, E. L., Ng, J., Carpenter, D. M., Mai, X., Schroeder, D. H., Condon, C. A., Colom, R., & Haier, R. J. (2010) · Intelligence · doi:10.1016/j.intell.2010.03.003 · Cited by 87
Nonparametric Regression Methods for Longitudinal Data Analysis: Mixed-Effects Modeling Approaches
Wu, H., & Zhang, J.-T. (2006) · Cited by 85
On the inherent precision of mcDESPOT
Lankford, C. L., & Does, M. D. (2013) · Magnetic Resonance in Medicine · doi:10.1002/mrm.24241 · Cited by 83
Deficient MWF mapping in multiple sclerosis using 3D whole-brain multi-component relaxation MRI
Kitzler, H. H., Su, J., Zeineh, M., Harper-Little, C., Leung, A., Kremenchutzky, M., Deoni, S., & Rutt, B. K. (2011) · NeuroImage · doi:10.1016/j.neuroimage.2011.08.052 · Cited by 78
Self-citationThe course of human events: predicting the timing of primate neural development
Clancy, B., Darlington, R. B., & Finlay, B. L. (2000) · Developmental Science · doi:10.1111/1467-7687.00100 · Cited by 74
The link between callosal thickness and intelligence in healthy children and adolescents
Eileen Luders, A., Thompson, P. M., Narr, K. L., Zamanyan, A., Chou, Y., Gutman, B. A., Dinov, I. D., & Toga, A. W. (2010) · NeuroImage · doi:10.1016/j.neuroimage.2010.09.083 · Cited by 73
Myelin imaging in amyotrophic and primary lateral sclerosis
Kolind, S., Sharma, R., Knight, S., Johansen‐Berg, H., Talbot, K., & Turner, M. R. (2013) · Amyotrophic Lateral Sclerosis and Frontotemporal Degeneration · doi:10.3109/21678421.2013.794843 · Cited by 70
Deoni, S., & Kolind, S. (2014) · Magnetic Resonance in Medicine · doi:10.1002/mrm.25108 · Cited by 69
Self-citationNonverbal Cognitive Development in Children With Cochlear Implants
Caudle, S. E., Katzenstein, J. M., Oghalai, J. S., Lin, J., & Caudle, D. D. (2012) · Assessment · doi:10.1177/1073191112437594 · Cited by 22
Wetherby (2002) · doi:10.1044/1092-4388(2002/097
Huttenlocher (1997) · doi:10.1002/(sici)1096-9861(19971020)387:2
Research works printed but not linked: 2
- Campbell J, Stikov N, RF D, Pike GB (2014) Combined NODDI and qMT for full-brain g-ratio mapping with complex subvoxel microstructure. In: Proc. Intl. Soc. Mag. Reson. Med., Milan, p 393
- Hurley SA, Mossahebi PM, Samsonov AA (2010) Multicomponent Relaxometry (mcDESPOT) in the Shaking Pup Model of Dysmyelination. In: Proceedings of ISMRM, Stockholm, p 4516
Cited by
Sorted by citations
Imaging structural and functional brain development in early childhood
Gilmore, J. H., Knickmeyer, R. C., & Gao, W. (2018) · Nature Reviews Neuroscience · doi:10.1038/nrn.2018.1 · Cited by 1,013
The Neuroscience of Drug Reward and Addiction
Volkow, N. D., Michaelides, M., & Baler, R. (2019) · Physiological Reviews · doi:10.1152/physrev.00014.2018 · Cited by 863
The development of brain white matter microstructure
Lebel, C., & Deoni, S. (2018) · NeuroImage · doi:10.1016/j.neuroimage.2017.12.097 · Cited by 602
Self-citationKostyrka-Allchorne, K., Cooper, N. R., & Simpson, A. (2017) · Developmental Review · doi:10.1016/j.dr.2016.12.002 · Cited by 302
Ronan, V., Yeasin, R., & Claud, E. C. (2020) · Gastroenterology · doi:10.1053/j.gastro.2020.08.065 · Cited by 278
Metadata
- Authors
- Deoni, S. C. L., O’Muircheartaigh, J., Elison, J. T., Walker, L., Doernberg, E., Waskiewicz, N., Dirks, H., Piryatinsky, I., Dean, D. C., & Jumbe, N. L.
- Affiliations
- Brown University (US)
- King's College London (GB)
- University of Minnesota (US)
- Gates Foundation (US)
- Corresponding author
- Deoni, Sean C. L.
- ORCID
- Venue
- Brain Structure and Function
- Published
- 2014-11-29
- Volume
- 221
- Issue
- 2
- Pages
- 1189-1203
- ISSN
- 1863-2653 (ISSN-L)
- 1863-2661
- PMC
- PMC4771819
- OpenAlex
- W2000113085
- Cited by
- 147
- References
- 78
- Citations by year
- 2026: 10 · 2025: 11 · 2024: 10 · 2023: 22 · 2022: 17 · 2021: 19 · 2020: 16 · 2019: 11 · 2018: 14 · 2017: 5 · 2016: 5 · 2015: 6
- FWCI
- 4.17
- Type
- journal article
- Language
- en
- Open access
- hybrid
- doi.org
- Licence
- Locations
- Brain Structure and Function (publishedVersion, cc-by)
- Europe PMC (PubMed Central) (publishedVersion, cc-by)
- PubMed Central (publishedVersion, cc-by)
- PubMed (publishedVersion)
- Research Portal (King's College London) (publishedVersion, cc-by)
- Funders
- Bill and Melinda Gates Foundation
- Wellcome Trust (096195)
- National Institute of Mental Health (R01MH087510)
- Topics
- Health Sciences › Medicine › Radiology, Nuclear Medicine and Imaging › Advanced Neuroimaging Techniques and Applications
- Social Sciences › Psychology › Experimental and Cognitive Psychology › Cognitive Abilities and Testing
- Social Sciences › Psychology › Neuropsychology and Physiological Psychology › Developmental and Educational Neuropsychology
- Keywords
- white matter maturation, myelination, cognitive ability, early childhood, infancy, brain development, white matter plasticity, intelligence, longitudinal brain development
- MeSH terms
- Brain, Brain Mapping, Child Development, Child, Preschool, Cognition, Female, Forecasting, Humans, Infant, Intelligence, Magnetic Resonance Imaging, Male, Myelin Sheath, Nerve Fibers, Myelinated, Case-Control Studies, White Matter
About these checks
Registry, retraction, Cites and statistics results are computed, not judged, with one exception: a printed reference that no index lists is read once by a model before it counts as a citation error. Claims are extracted by a model and kept only when their quote appears verbatim in the text; each cited source is then checked, with a model’s help, for whether it says what the claim relies on. Those verdicts can be wrong — read the claim’s quote and the cited source before relying on one.
Statistics and arithmetic are recomputed, not judged.
Confidence bands are shown only for fields calibrated on our annotated test set. None is calibrated yet, so no band is shown.
What counts as a claim ›How we measure confidence ›How we check this ›
Are you an author, or do you see a problem with this page? Request a review
