

The DOI matches its Crossref record; 48 of the 50 references it cites were found in a registry or an index; 21 of the 22 sources its claims cite were checked for support.
Single-Nucleus RNA-Seq Is Not Suitable for Detection of Microglial Activation Genes in Humans
Open accessAbstract
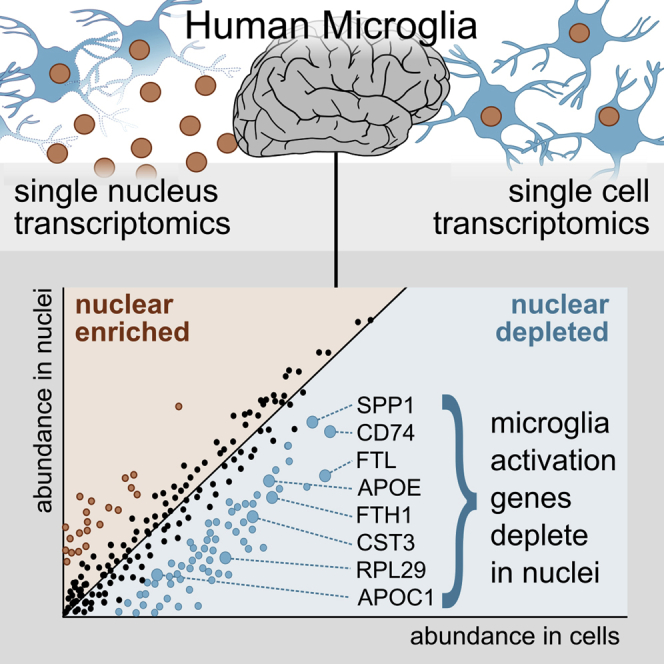
Single-nucleus RNA sequencing (snRNA-seq) is used as an alternative to single-cell RNA-seq, as it allows transcriptomic profiling of frozen tissue. However, it is unclear whether snRNA-seq is able to detect cellular state in human tissue. Indeed, snRNA-seq analyses of human brain samples have failed to detect a consistent microglial activation signature in Alzheimer's disease. Our comparison of microglia from single cells and single nuclei of four human subjects reveals that, although most genes show similar relative abundances in cells and nuclei, a small population of genes (∼1%) is depleted in nuclei compared to whole cells. This population is enriched for genes previously implicated in microglial activation, including APOE, CST3, SPP1, and CD74, comprising 18% of previously identified microglial-disease-associated genes. Given the low sensitivity of snRNA-seq to detect many activation genes, we conclude that snRNA-seq is not suited for detecting cellular activation in microglia in human disease.
Overview
AI snapshot
Written from the paper’s full text.
TL;DR
Comparing single-cell and single-nucleus RNA-seq of human microglia from four subjects, most genes had similar abundance, but a small set (~1%) was depleted in nuclei and enriched for microglial activation genes. The authors conclude snRNA-seq is not suited for detecting cellular activation states in human microglia.
Key findings
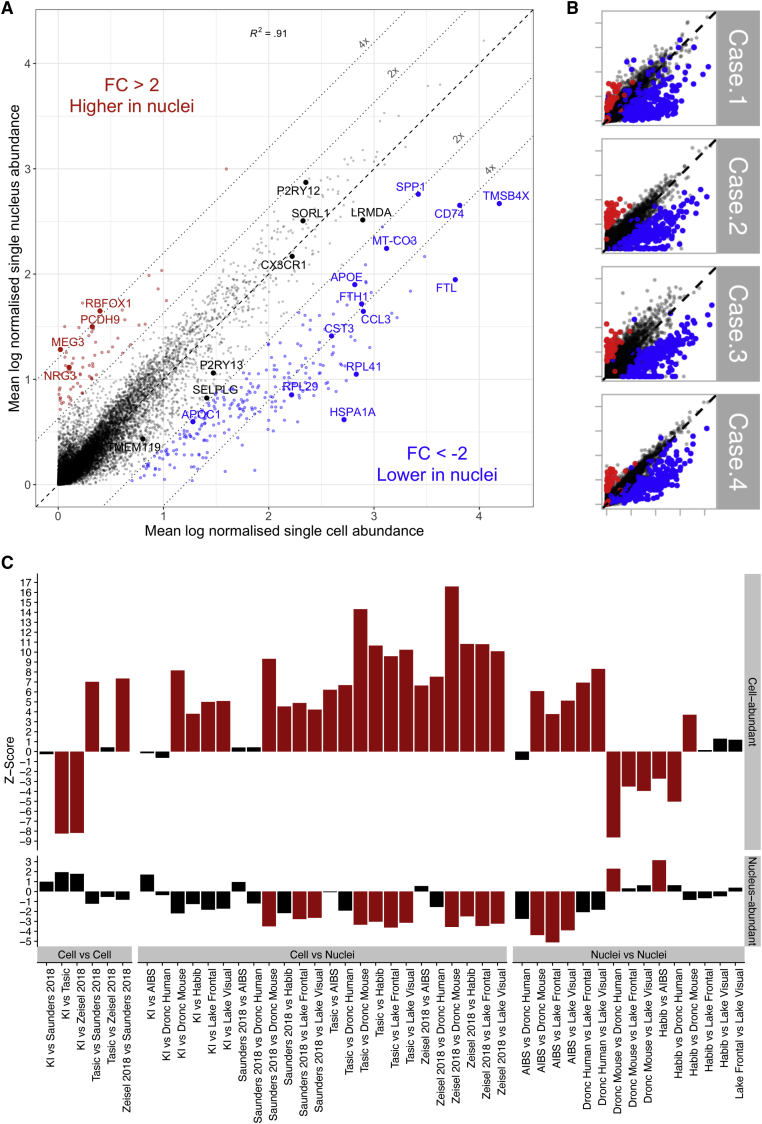
- Most genes showed similar normalized abundance in microglial cells and nuclei: 98.6% fell along the diagonal (Pearson’s correlation coefficient = 0.92, p < 2.2e-16). However, 246 genes (1.1%) were less abundant in nuclei (fold change < −2, padj < 0.05), and 67 genes (0.3%) were more abundant in nuclei (fold change > 2, padj < 0.05).
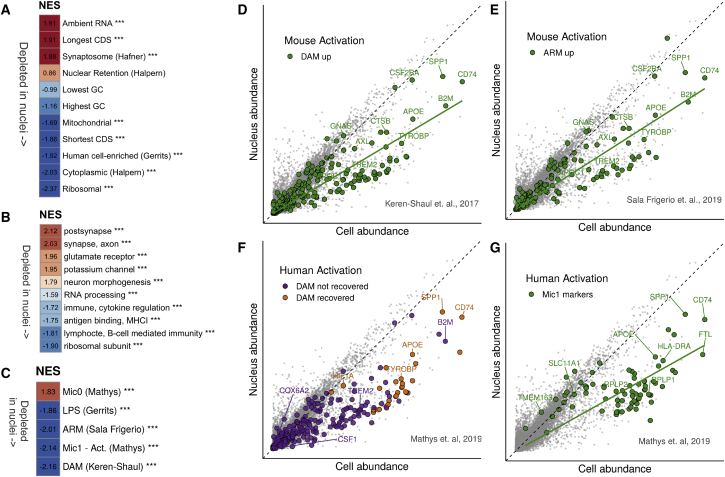
- Nuclei-depleted genes were enriched for microglial activation signatures: 45 of 257 orthologous DAM genes (NES = −2.16, padj = 3.6e-05), 28 of 200 orthologous ARM genes (NES = −2.01, padj = 3.6e-05), LPS-upregulated genes (NES = −1.86, padj = 3.6e-05), and Mathys et al. Mic1 markers (NES = −2.14, padj = 3.6e-05). Examples included APOE, CST3, SPP1, and CD74; the abstract states this comprises 18% of previously identified microglial-disease-associated genes.
- In public datasets, cell-abundant genes were depleted in other single-nucleus microglia relative to single-cell microglia (mean microglial Z score 7.95 for cells-to-nuclei, versus 0.01 for cell-to-cell and 0.81 for nuclei-to-nuclei comparisons). Reanalysis of Gerrits et al. data found the same nuclei-depleted pattern when comparing fresh cells to frozen nuclei, but little difference between fresh cells and fresh nuclei.
- snRNA-seq recovered major cell types from human tissue: 37,060 nuclei yielded 7 major cell types, including microglia (11.3%), but clustering did not convincingly recover differences between other microglial subpopulations.
Methods
- Paired scRNA-seq of FACS-sorted microglia and snRNA-seq from the same four human temporal cortex samples (epilepsy surgery; ages 7 male, 20, 24, and 50 female) using the 10X Genomics single-cell gene expression v2 kit. After preprocessing, 3,927 microglial nuclei remained; differential abundance analysis used 3,721 nuclei and 14,435 cells after discarding non-microglial clusters.
- Differential abundance was performed with Seurat using a two-sided Wilcoxon rank sum test with Bonferroni correction; genes with padj < 0.05 and fold change > |2| were considered significant. Functional analysis used GSEA (fgsea) against ranked log fold changes and gene sets from prior studies.
- Public dataset comparisons used the EWCE package and a MicroglialDepletion package with bootstrapped Z scores across 8 public single-cell or single-nucleus datasets; Gerrits et al. data were downloaded from GEO (GSE135618) and reanalyzed for fresh versus frozen nuclei.
Limitations
- Stated in the paper: the study used non-diseased tissue, so the authors cannot dismiss the possibility that mRNA localization distributions change in more activated microglia. They also state they cannot attribute cell-versus-nucleus abundance differences to a biological mechanism versus a technical artifact, and the reason for differences between fresh and frozen nuclei is unclear.
- Stated in the paper: deeper sequencing or increased sample size could possibly compensate for lack of sensitivity, but the sparse nature of snRNA-seq and high human heterogeneity suggest this may remain a problem.
- Evident from the text: the primary comparison relies on only four non-AD epilepsy surgery subjects, with one patient sample removed due to poor quality, so the findings about disease-associated activation are inferred from gene-set enrichment rather than direct AD patient snRNA-seq in this study.
Model-written summary. Check it against the paper before relying on it.
Integrity signals
Registry
Cites
Statistics
Figures
Verification
Claims the paper makes
31 Own result · 11 Supported · 10 Own method · 7 Partly supported · 6 Own interpretation · 1 Mixed support · accuracy not yet measured
Some cited sources support this claim and some don’t — read each source’s verdict below.
In the paper
“snRNA-seq analyses of human brain samples have failed to detect a consistent microglial activation signature in Alzheimer’s disease.”
- Also stated in: § Introduction · hedged
“a number of high-profile snRNA-seq studies of microglia in human AD (Del-Aguila et al., 2019; Grubman et al., 2019; Mathys et al., 2019) have been unable to recover an equivalent activation signature or, possibly more revealing, a consistent activation signature.”
§ Single-Nucleus RNA-Seq Is Not Suitable for Detection of Microglial Activation Genes in Humans > Abstract
What the sources say
- Partly supportedcites Del-Aguila et al., 2019 sourceExperimental — accuracy not yet measured
The Results section (page unavailable) says the study did not sequence enough microglial cells to replicate the previously reported disease-associated microglia (DAM) marker findings. But it found five markers consistently associated with microglia across all three samples. The claim overgeneralizes this limited finding to a failure to detect any consistent microglial activation signature in human Alzheimer’s disease samples. (LLM, conf=0.84)
- Not checked — no full text of the sourcecites Grubman et al., 2019 source
- Disputedcites Mathys et al., 2019 sourceExperimental — accuracy not yet measured
In “Identification of AD-associated cellular subpopulations” (page not specified), the paper reports an AD-associated human microglial subpopulation, Mic1, with immune-related marker genes that significantly overlap disease-associated microglial signatures. It also reports immunohistochemical confirmation of MHC class II–expressing microglia in AD-pathology samples. This is contrary to attributing a failure to detect a microglial activation signature to this study, though the paper does not establish consistency across all human snRNA-seq studies. (LLM, conf=0.87)
Checked by a reasoning model — may be wrong.
plainn = 4- Asserted: passes — The authors put it forward as true.
- Checkable: passes — It can be checked against evidence.
- Load-bearing: passes — The paper’s conclusions depend on it.
- Based: passes — The paper gives a reason why it holds.
- Also stated in: § Introduction · hedged
Every source the paper cites for this claim was checked and supports it.
In the paper
“Markers of this response (referred to by Mathys et al., 2019 as “Mic1”) had a NES score of −2.14 (padj = 3.6e-05), indicating that they were depleted in nuclei (Figure 2C).”
§ Single-Nucleus RNA-Seq Is Not Suitable for Detection of Microglial Activation Genes in Humans > Results > Activation Genes Identified in Human Studies of AD Are Depleted in Human Nuclei
What the sources say
- Supportedcites Mathys et al., 2019 source
The Identification of AD-associated cellular subpopulations section identifies Mic1 as an AD-associated human microglial subpopulation and discusses its marker genes. The citation supports the name and identification of the markers; the NES score and depletion in nuclei are presented as the citing paper’s Figure 2C result, not as a finding attributed to Mathys et al. (LLM, conf=0.92)
hedged- Asserted: passes — The authors put it forward as true.
- Checkable: passes — It can be checked against evidence.
- Load-bearing: passes — The paper’s conclusions depend on it.
- Based: passes — The paper gives a reason why it holds.
- Supported
Every source the paper cites for this claim was checked and supports it.
In the paper
“Genes upregulated by lipopolysaccharide (LPS) stimulation in mice (Gerrits et al., 2019) also showed depletion in nuclei (NES = −1.86, padj = 3.6e-05; Figure 2C; Figure S2F).”
§ Single-Nucleus RNA-Seq Is Not Suitable for Detection of Microglial Activation Genes in Humans > Results > Activation Genes Identified in Mouse Models of AD Are Depleted in Human Nuclei
What the sources say
- Supportedcites Gerrits et al., 2019 source
The Results section (Comparison of nuclear and whole-cell transcriptome by bulk sequencing) reports genes upregulated after LPS treatment in mice, supporting the citation’s identification of that gene set. The depletion statistic and Figure 2C are presented as the citing paper’s own result, not as a finding attributed to Gerrits et al. (LLM, conf=0.91)
plaincorrelational- Asserted: passes — The authors put it forward as true.
- Checkable: passes — It can be checked against evidence.
- Load-bearing: passes — The paper’s conclusions depend on it.
- Based: passes — The paper gives a reason why it holds.
- Supported
The cited sources support only part of this claim — read each source’s verdict below.
In the paper
“The study identified 28 DAM genes as marker genes of the Mic1 response cluster (shown in orange in Figure 2F); however, most DAM genes were not identified as activation genes using their snRNA-seq protocol (purple in Figure 2F).”
§ Single-Nucleus RNA-Seq Is Not Suitable for Detection of Microglial Activation Genes in Humans > Results > Activation Genes Identified in Human Studies of AD Are Depleted in Human Nuclei
What the sources say
- Partly supportedcites Mathys et al., 2019 sourceExperimental — accuracy not yet measured
The Identification of AD-associated cellular subpopulations section reports a significant overlap between Mic1 markers and mouse disease-associated microglia genes, while describing the states as distinct. It does not say that most DAM genes were missed or quantify how many were not identified as activation genes by its snRNA-seq analysis. Page numbers were not available in our copy. (LLM, conf=0.78)
plain- Asserted: passes — The authors put it forward as true.
- Checkable: passes — It can be checked against evidence.
- Load-bearing: passes — The paper’s conclusions depend on it.
- Based: passes — The paper gives a reason why it holds.
- Partly supported
Every source the paper cites for this claim was checked and supports it.
In the paper
“we found a strong depletion of genes associated with mouse microglial activation: 45 of 257 orthologous DAM genes (Keren-Shaul et al., 2017; NES = −2.16, padj = 3.6e-05; Figures 2C and 2D)”
§ Single-Nucleus RNA-Seq Is Not Suitable for Detection of Microglial Activation Genes in Humans > Results > Activation Genes Identified in Mouse Models of AD Are Depleted in Human Nuclei
What the sources say
- Supportedcites Keren-Shaul et al., 2017 source
The Results identify disease-associated microglia (DAM) in an AD mouse model and describe their distinctive gene-expression program. The citation identifies the DAM genes used in the citing authors’ analysis; the depletion of 45 of 257 orthologous genes is presented as the citing authors’ own finding, not as a result from this source. (LLM, conf=0.86)
boosted- Asserted: passes — The authors put it forward as true.
- Checkable: passes — It can be checked against evidence.
- Load-bearing: passes — The paper’s conclusions depend on it.
- Based: passes — The paper gives a reason why it holds.
- Supported
Every source the paper cites for this claim was checked and supports it.
In the paper
“cytoplasmic RNA (defined by Bahar Halpern et al., 2015) was clearly enriched among genes found to be more abundant in cells (NES = −2.03, padj = 3.6e-05)”
§ Single-Nucleus RNA-Seq Is Not Suitable for Detection of Microglial Activation Genes in Humans > Results > Gene Expression Profiling of Human Nuclei and Cells
What the sources say
- Supportedcites Bahar Halpern et al., 2015 source
The citation identifies the source of the ‘cytoplasmic RNA’ gene category, not the source of the citing paper’s enrichment result. In Results (‘RNA Sequencing of Cell Fractions Reveals Broad Nuclear Localization of mRNA in Beta Cells and Liver’), the paper compares nuclear and cytoplasmic mRNA levels and refers to a group of ‘the most cytoplasmic genes.’ The NES and adjusted p-value are results reported by the citing paper, not attributed to this source. (LLM, conf=0.91)
boostedcorrelational- Asserted: passes — The authors put it forward as true.
- Checkable: passes — It can be checked against evidence.
- Load-bearing: passes — The paper’s conclusions depend on it.
- Based: passes — The paper gives a reason why it holds.
- Supported
The cited sources support only part of this claim — read each source’s verdict below.
In the paper
“Genes with shorter coding sequences (CDSs) were depleted in nuclei (NES = −1.88, padj = 3.6e-05)”
§ Single-Nucleus RNA-Seq Is Not Suitable for Detection of Microglial Activation Genes in Humans > Results > Gene Expression Profiling of Human Nuclei and Cells
What the sources say
- Partly supportedcites Bakken et al., 2018 sourceExperimental — accuracy not yet measured
The Results section, “Comparison of nuclear and whole cell transcriptomes” (page unavailable), reports that nucleus-enriched genes were longer on average than cell-enriched genes, which supports a general association with gene length. It does not establish depletion specifically for shorter coding sequences or report the cited NES and adjusted p-value; it also cautions that the length difference may reflect intronic reads. (LLM, conf=0.82)
plaincorrelational- Asserted: passes — The authors put it forward as true.
- Checkable: passes — It can be checked against evidence.
- Load-bearing: unclear — It is unclear whether the paper’s conclusions depend on it.
- Based: passes — The paper gives a reason why it holds.
- Partly supported
Every source the paper cites for this claim was checked and supports it.
In the paper
“Finally, the genes defined by Gerrits et al. (2019) as cellular enriched in a differential analysis of microglial cells versus (fresh) nuclei in humans were also enriched in cells in our data, showing a NES score of −1.92 (padj = 3.6e-05).”
§ Single-Nucleus RNA-Seq Is Not Suitable for Detection of Microglial Activation Genes in Humans > Results > Gene Expression Profiling of Human Nuclei and Cells
What the sources say
- Supportedcites Gerrits et al., 2019 source
The Results section on human microglia compares cells with fresh nuclei and reports differentially expressed genes for two donors; it also notes lower detection of mitochondrial and ribosomal genes in nuclei. The NES score and adjusted p value describe the citing authors’ own data, not a result attributed to Gerrits et al. The supplied passages do not give page numbers. (LLM, conf=0.87)
plaincorrelational- Asserted: passes — The authors put it forward as true.
- Checkable: passes — It can be checked against evidence.
- Load-bearing: passes — The paper’s conclusions depend on it.
- Based: passes — The paper gives a reason why it holds.
- Supported
Every source the paper cites for this claim was checked and supports it.
In the paper
“and 28 of 200 orthologous ARM genes (Sala Frigerio et al., 2019; NES = −2.01, padj = 3.6e-05; Figures 2C and 2E), confirming that mouse microglial activation genes were less abundant in nuclei.”
§ Single-Nucleus RNA-Seq Is Not Suitable for Detection of Microglial Activation Genes in Humans > Results > Activation Genes Identified in Mouse Models of AD Are Depleted in Human Nuclei
What the sources say
- Supportedcites Sala Frigerio et al., 2019 source
The Results section (‘Aging and Aβ Deposition Induce Similar Responses in Microglia’; page not available) identifies ARMs and describes their characteristic genes. The citation identifies the ARM gene set; the depletion in nuclei, the 28-of-200 count, and the enrichment statistics are presented as the citing paper’s own analysis, not as findings attributed to Sala Frigerio et al. (LLM, conf=0.86)
plain- Asserted: passes — The authors put it forward as true.
- Checkable: passes — It can be checked against evidence.
- Load-bearing: passes — The paper’s conclusions depend on it.
- Based: passes — The paper gives a reason why it holds.
- Supported
The cited sources support only part of this claim — read each source’s verdict below.
In the paper
“Droplet-based methods do not appear to suffer from length bias (Phipson et al., 2017); thus, we cannot not attribute differences in capture efficiency to a preference for capturing longer genes.”
§ Single-Nucleus RNA-Seq Is Not Suitable for Detection of Microglial Activation Genes in Humans > Discussion
What the sources say
- Partly supportedcites Phipson et al., 2017 sourceExperimental — accuracy not yet measured
The Results section ('UMI-based protocols do not suffer from gene length bias'; page unavailable) reports fairly uniform counts and dropout across gene lengths in an InDrop droplet-based dataset. The paper draws its broader conclusion for UMI-based protocols, not droplet-based methods generally; it does not establish that other droplet methods lack length bias. (LLM, conf=0.84)
hedged- Asserted: passes — The authors put it forward as true.
- Checkable: passes — It can be checked against evidence.
- Load-bearing: passes — The paper’s conclusions depend on it.
- Based: passes — The paper gives a reason why it holds.
- Partly supported
- Probably not a substantial claim. 28
- It may state two separate claims as one. 12
Every source the paper cites for this claim was checked and supports it.
In the paper
“as was mitochondrial mRNA (NES = −1.69, padj = 2.7e-04, gene set extracted from Ensembl’s BioMart; Zerbino et al., 2018).”
§ Single-Nucleus RNA-Seq Is Not Suitable for Detection of Microglial Activation Genes in Humans > Results > Gene Expression Profiling of Human Nuclei and Cells
What the sources say
- Supportedcites Zerbino et al., 2018 source
The citation identifies Ensembl’s BioMart as the source of the gene set, not as the source of the enrichment result. The Introduction describes BioMart as a tool Ensembl supports for data-analysis workflows; the NES and adjusted p-value are the citing authors’ results. (LLM, conf=0.92)
plaincorrelational- Asserted: passes — The authors put it forward as true.
- Checkable: passes — It can be checked against evidence.
- Load-bearing: fails — The paper’s conclusions may not depend on it.
- Based: passes — The paper gives a reason why it holds.
Probably not a substantial claim. The paper’s conclusions may not depend on it.
- Supported
Every source the paper cites for this claim was checked and supports it.
In the paper
“RNA of genes coding for ribosomal proteins was also depleted in nuclei (NES = −2.37, padj = 3.6e-05), as previously described (Habib et al., 2017).”
§ Single-Nucleus RNA-Seq Is Not Suitable for Detection of Microglial Activation Genes in Humans > Results > Gene Expression Profiling of Human Nuclei and Cells
What the sources say
- Supportedcites Habib et al., 2017 source
In Online Methods (Computational Data Analysis), the paper reports that many ribosomal protein RNAs were up-regulated in 3T3 cells relative to nuclei. This supports the cited qualitative statement that they are depleted in nuclei; the NES and adjusted p-value are results of the citing paper, not attributed to Habib et al. (LLM, conf=0.93)
plain- Asserted: passes — The authors put it forward as true.
- Checkable: passes — It can be checked against evidence.
- Load-bearing: fails — The paper’s conclusions may not depend on it.
- Based: passes — The paper gives a reason why it holds.
Probably not a substantial claim. The paper’s conclusions may not depend on it.
- Supported
The cited sources support only part of this claim — read each source’s verdict below.
In the paper
“whereas longer CDSs were enriched (NES = 1.91, padj = 3.6e-05), as already observed in earlier snRNA-seq studies (Bakken et al., 2018).”
§ Single-Nucleus RNA-Seq Is Not Suitable for Detection of Microglial Activation Genes in Humans > Results > Gene Expression Profiling of Human Nuclei and Cells
What the sources say
- Partly supportedcites Bakken et al., 2018 sourceExperimental — accuracy not yet measured
In Results, under “Comparison of nuclear and whole cell transcriptomes” (page unavailable), Bakken et al. report that nucleus-enriched genes were longer than cell-enriched genes when expression was calculated from intronic and exonic reads. They do not establish that the coding sequences specifically were longer; they caution that long introns may account for the apparent enrichment. The NES and adjusted P-value in the citing sentence are not presented as Bakken et al.’s results. (LLM, conf=0.88)
plaincorrelational- Asserted: passes — The authors put it forward as true.
- Checkable: passes — It can be checked against evidence.
- Load-bearing: fails — The paper’s conclusions may not depend on it.
- Based: passes — The paper gives a reason why it holds.
Probably not a substantial claim. The paper’s conclusions may not depend on it.
- Partly supported
The cited sources support only part of this claim — read each source’s verdict below.
In the paper
“For our single-cell protocol, we performed dissociation at 4°C to mitigate potential activation (Mancuso et al., 2019), so it is unlikely the dissociation procedures account for the differences.”
§ Single-Nucleus RNA-Seq Is Not Suitable for Detection of Microglial Activation Genes in Humans > Discussion
What the sources say
- Partly supportedcites Mancuso et al., 2019 sourceExperimental — accuracy not yet measured
The Methods section, “Isolation of human and mouse microglia from the mouse brain” (page unavailable), describes tissue dissociation followed by centrifugation and antibody labeling at 4°C. It does not say dissociation itself was performed at 4°C or that cold processing mitigated activation. The conclusion about the citing authors’ own differences is not attributed to Mancuso et al. (LLM, conf=0.82)
hedged- Asserted: passes — The authors put it forward as true.
- Checkable: passes — It can be checked against evidence.
- Load-bearing: passes — The paper’s conclusions depend on it.
- Based: passes — The paper gives a reason why it holds.
It may state two separate claims as one.
- Partly supported
Every source the paper cites for this claim was checked and supports it.
In the paper
“This is supported by the enrichment of synaptosome genes (NES = 1.82, padj = 3.6e-05, Figure 2A; Hafner et al., 2019) and ambient RNA—mRNA originating not from intact cells/nuclei but from free-floating transcripts (Macosko et al., 2015)—(NES = 1.71, padj = 9.2e-05; Figure 2A; Figure S2D) within the nucleus-abundant genes.”
§ Single-Nucleus RNA-Seq Is Not Suitable for Detection of Microglial Activation Genes in Humans > Results > Gene Expression Profiling of Human Nuclei and Cells
What the sources say
- Supportedcites Hafner et al., 2019 source
The citation to Hafner et al. identifies the synaptosome genes used in the citing paper's enrichment analysis. In 'The presynaptic transcriptome of vGLUT1+ terminals,' the source reports RNA sequencing of synaptosomes and identifies transcripts enriched in sorted synaptosomes. The nucleus-abundant enrichment statistic and ambient-RNA result are presented as the citing paper's own analysis, not as findings attributed to Hafner et al. (LLM, conf=0.91)
- Supportedcites Macosko et al., 2015 source
The Macosko et al. citation is attached to the definition of ambient RNA, not to the citing paper’s enrichment result. In Results, under “The single cell accuracy and sensitivity of Drop-Seq libraries” (page unavailable), the source describes ambient RNA as RNA present in the cell suspension, presumably from cells damaged during preparation. This supports the description of transcripts not originating from intact cells or nuclei. (LLM, conf=0.91)
plaincorrelational- Asserted: passes — The authors put it forward as true.
- Checkable: passes — It can be checked against evidence.
- Load-bearing: unclear — It is unclear whether the paper’s conclusions depend on it.
- Based: passes — The paper gives a reason why it holds.
It may state two separate claims as one.
- Supported
Every source the paper cites for this claim was checked and supports it.
In the paper
“In agreement with the results of Gerrits et al. (2019), when we plotted the normalized abundance of fresh nuclei versus cells, we saw very little difference between the two populations (Figure S3C).”
§ Single-Nucleus RNA-Seq Is Not Suitable for Detection of Microglial Activation Genes in Humans > Results > Comparisons with Previous Studies
What the sources say
- Supportedcites Gerrits et al., 2019 source
The Discussion reports that fresh human microglia nuclei and cells clustered very similarly. The Results likewise describe fresh nuclei as a good proxy for the corresponding cells. The citing authors’ normalized-abundance plot is their own analysis; the attributed point—that fresh nuclei and cells showed little difference—agrees with the source. (LLM, conf=0.90)
plain- Asserted: passes — The authors put it forward as true.
- Checkable: passes — It can be checked against evidence.
- Load-bearing: fails — The paper’s conclusions may not depend on it.
- Based: passes — The paper gives a reason why it holds.
Probably not a substantial claim. The paper’s conclusions may not depend on it.
- Supported
The cited sources support only part of this claim — read each source’s verdict below.
In the paper
“Our lab has previously used the same protocol to study microglial activation in mice, and no activation due to technical artifacts was seen (Sala Frigerio et al., 2019).”
§ Single-Nucleus RNA-Seq Is Not Suitable for Detection of Microglial Activation Genes in Humans > Discussion
What the sources say
- Partly supportedcites Sala Frigerio et al., 2019 sourceExperimental — accuracy not yet measured
The Results and STAR★METHODS (page not provided) describe studying microglial activation in mice and keeping tissue cold to minimize activation caused by isolation. They do not report that no activation due to technical artifacts was observed; minimizing a risk is not evidence that it was absent. (LLM, conf=0.87)
plain- Asserted: passes — The authors put it forward as true.
- Checkable: passes — It can be checked against evidence.
- Load-bearing: unclear — It is unclear whether the paper’s conclusions depend on it.
- Based: passes — The paper gives a reason why it holds.
It may state two separate claims as one.
- Partly supported
The cited sources support only part of this claim — read each source’s verdict below.
In the paper
“The improved v3 chemistry yields a higher number of reads and genes per cell, as shown in a comparison using peripheral blood mononuclear cells (PBMCs) (Ding et al., 2020).”
§ Single-Nucleus RNA-Seq Is Not Suitable for Detection of Microglial Activation Genes in Humans > Discussion
What the sources say
- Partly supportedcites Ding et al., 2020 sourceExperimental — accuracy not yet measured
The Results section, “Similar relative ranking of method sensitivity across experiments” (page unavailable), reports that 10x Chromium v3 detected the most genes per PBMC cell among the high-throughput methods. It does not report that v3 yielded more reads per cell; its higher UMI count is not a read count. The claim also omits the high-throughput-methods qualifier. (LLM, conf=0.88)
plaindirect- Asserted: passes — The authors put it forward as true.
- Checkable: passes — It can be checked against evidence.
- Load-bearing: fails — The paper’s conclusions may not depend on it.
- Based: passes — The paper gives a reason why it holds.
Probably not a substantial claim. The paper’s conclusions may not depend on it.
- Partly supported
A result the paper reports from its own data — it cites no other source for it, so there is none to check. The quote shows it is in the paper.
In the paper
“Additionally, 3,248 genes were only detected in cells, and 5,068 genes were exclusively detected in nuclei.”
§ Single-Nucleus RNA-Seq Is Not Suitable for Detection of Microglial Activation Genes in Humans > Results > Gene Expression Profiling of Human Nuclei and Cells
plainn = 4- Asserted: passes — The authors put it forward as true.
- Checkable: passes — It can be checked against evidence.
- Load-bearing: fails — The paper’s conclusions may not depend on it.
- Based: passes — The paper gives a reason why it holds.
Probably not a substantial claim. The paper’s conclusions may not depend on it.
A result the paper reports from its own data — it cites no other source for it, so there is none to check. The quote shows it is in the paper.
In the paper
“A second population of 67 genes (0.3%) was found to be more abundant in nuclei (fold change > 2, padj < 0.05; red in Figure 1A).”
§ Single-Nucleus RNA-Seq Is Not Suitable for Detection of Microglial Activation Genes in Humans > Results > Gene Expression Profiling of Human Nuclei and Cells
plaincorrelationaln = 4- Asserted: passes — The authors put it forward as true.
- Checkable: passes — It can be checked against evidence.
- Load-bearing: fails — The paper’s conclusions may not depend on it.
- Based: passes — The paper gives a reason why it holds.
Probably not a substantial claim. The paper’s conclusions may not depend on it.
A result the paper reports from its own data — it cites no other source for it, so there is none to check. The quote shows it is in the paper.
In the paper
“A comparison of single-nucleus and single-cell clustering suggested that cytokine clusters and macrophage clusters recovered well by using single-nucleus methods”
§ Single-Nucleus RNA-Seq Is Not Suitable for Detection of Microglial Activation Genes in Humans > Results > snRNA-Seq Recovers Major Cell Types from Human Tissue but Not Microglial State
hedgeddirect- Asserted: passes — The authors put it forward as true.
- Checkable: passes — It can be checked against evidence.
- Load-bearing: unclear — It is unclear whether the paper’s conclusions depend on it.
- Based: passes — The paper gives a reason why it holds.
It may state two separate claims as one.
A result the paper reports from its own data — it cites no other source for it, so there is none to check. The quote shows it is in the paper.
In the paper
“In the frozen nuclei dataset, microglial clusters (clusters 3,5 and 6 in Figures S3A and S3B) were identified using known markers including P2RY12, CSF1R, CX3CR1 (resulting in 2,659 microglial nuclei), and extracted for downstream analysis.”
§ Single-Nucleus RNA-Seq Is Not Suitable for Detection of Microglial Activation Genes in Humans > STAR★Methods > Quantification and Statistical Analysis
plainn = 2- Asserted: passes — The authors put it forward as true.
- Checkable: passes — It can be checked against evidence.
- Load-bearing: passes — The paper’s conclusions depend on it.
- Based: passes — The paper gives a reason why it holds.
Probably not a substantial claim.
A result the paper reports from its own data — it cites no other source for it, so there is none to check. The quote shows it is in the paper.
In the paper
“Our nuclei were able to recover a cytokine response cluster (CRM), marked by CCL3, CCL4, and an activation-like cluster, equivalent to the “in vitro microglia” identified in the original study (original markers included APOC1, GPNMB, SPP1, APOE).”
§ Single-Nucleus RNA-Seq Is Not Suitable for Detection of Microglial Activation Genes in Humans > STAR★Methods > Quantification and Statistical Analysis
plaincorrelational- Asserted: passes — The authors put it forward as true.
- Checkable: passes — It can be checked against evidence.
- Load-bearing: passes — The paper’s conclusions depend on it.
- Based: passes — The paper gives a reason why it holds.
It may state two separate claims as one.
A result the paper reports from its own data — it cites no other source for it, so there is none to check. The quote shows it is in the paper.
In the paper
“Cluster Nuc4 showed similarities with the “in vitro 2” cluster, suggesting it could be a cluster of activation, however all 5 overlapping genes were mitochondrial genes.”
§ Single-Nucleus RNA-Seq Is Not Suitable for Detection of Microglial Activation Genes in Humans > STAR★Methods > Quantification and Statistical Analysis
hedgedcorrelational- Asserted: passes — The authors put it forward as true.
- Checkable: passes — It can be checked against evidence.
- Load-bearing: fails — The paper’s conclusions may not depend on it.
- Based: passes — The paper gives a reason why it holds.
Probably not a substantial claim. The paper’s conclusions may not depend on it. It may state two separate claims as one.
A result the paper reports from its own data — it cites no other source for it, so there is none to check. The quote shows it is in the paper.
In the paper
“The cell macrophage (CAM) and cell cytokine (CRM) clusters showed the largest overlaps with Nuc1 and Nuc5 (27 and 24 of 40 markers, respectively).”
§ Single-Nucleus RNA-Seq Is Not Suitable for Detection of Microglial Activation Genes in Humans > STAR★Methods > Quantification and Statistical Analysis
plaincorrelational- Asserted: passes — The authors put it forward as true.
- Checkable: passes — It can be checked against evidence.
- Load-bearing: fails — The paper’s conclusions may not depend on it.
- Based: passes — The paper gives a reason why it holds.
Probably not a substantial claim. The paper’s conclusions may not depend on it.
A result the paper reports from its own data — it cites no other source for it, so there is none to check. The quote shows it is in the paper.
In the paper
“Cluster Nuc3 markers RPS12, TPT1, FTL, RPS18 and EEF1A1 also appeared as markers of “in vitro 2.””
§ Single-Nucleus RNA-Seq Is Not Suitable for Detection of Microglial Activation Genes in Humans > STAR★Methods > Quantification and Statistical Analysis
plaincorrelational- Asserted: passes — The authors put it forward as true.
- Checkable: passes — It can be checked against evidence.
- Load-bearing: fails — The paper’s conclusions may not depend on it.
- Based: passes — The paper gives a reason why it holds.
Probably not a substantial claim. The paper’s conclusions may not depend on it.
A result the paper reports from its own data — it cites no other source for it, so there is none to check. The quote shows it is in the paper.
In the paper
“We identified 7 main cell types in 37,060 nuclei: oligodendrocytes (ODC, 34.0%), excitatory neurons (27.0%), interneurons (11.3%), oligodendrocyte precursors (OPC 9,4%), microglia (11.3%), astrocytes (6.0%), and endothelial cells (1.1%).”
§ Single-Nucleus RNA-Seq Is Not Suitable for Detection of Microglial Activation Genes in Humans > STAR★Methods > Quantification and Statistical Analysis
plainn = 4- Asserted: passes — The authors put it forward as true.
- Checkable: passes — It can be checked against evidence.
- Load-bearing: fails — The paper’s conclusions may not depend on it.
- Based: passes — The paper gives a reason why it holds.
Probably not a substantial claim. The paper’s conclusions may not depend on it.
A result the paper reports from its own data — it cites no other source for it, so there is none to check. The quote shows it is in the paper.
In the paper
“This resulted in 1,304 mean reads per cell, compared with the original count of 3,979 reads per cell.”
§ Single-Nucleus RNA-Seq Is Not Suitable for Detection of Microglial Activation Genes in Humans > STAR★Methods > Quantification and Statistical Analysis
plaindirect- Asserted: passes — The authors put it forward as true.
- Checkable: passes — It can be checked against evidence.
- Load-bearing: fails — The paper’s conclusions may not depend on it.
- Based: passes — The paper gives a reason why it holds.
Probably not a substantial claim. The paper’s conclusions may not depend on it.
A result the paper reports from its own data — it cites no other source for it, so there is none to check. The quote shows it is in the paper.
In the paper
“Other clusters only showed overlaps of between 1 and 5 genes.”
§ Single-Nucleus RNA-Seq Is Not Suitable for Detection of Microglial Activation Genes in Humans > STAR★Methods > Quantification and Statistical Analysis
plain- Asserted: passes — The authors put it forward as true.
- Checkable: passes — It can be checked against evidence.
- Load-bearing: fails — The paper’s conclusions may not depend on it.
- Based: passes — The paper gives a reason why it holds.
Probably not a substantial claim. The paper’s conclusions may not depend on it.
A result the paper reports from its own data — it cites no other source for it, so there is none to check. The quote shows it is in the paper.
In the paper
“The dataset consisted of 37,060 nuclei, with a mean UMI count of 4,305 counts per nucleus, and 1,791 genes per nucleus.”
§ Single-Nucleus RNA-Seq Is Not Suitable for Detection of Microglial Activation Genes in Humans > STAR★Methods > Quantification and Statistical Analysis
plainn = 4- Asserted: passes — The authors put it forward as true.
- Checkable: passes — It can be checked against evidence.
- Load-bearing: fails — The paper’s conclusions may not depend on it.
- Based: passes — The paper gives a reason why it holds.
Probably not a substantial claim. The paper’s conclusions may not depend on it. It may state two separate claims as one.
A result the paper reports from its own data — it cites no other source for it, so there is none to check. The quote shows it is in the paper.
In the paper
“Cluster Nuc0 showed an overlap of 5 genes with “in vivo HM,” and cluster Nuc2 showed an overlap of 2 genes with “in vivo HM.””
§ Single-Nucleus RNA-Seq Is Not Suitable for Detection of Microglial Activation Genes in Humans > STAR★Methods > Quantification and Statistical Analysis
plain- Asserted: passes — The authors put it forward as true.
- Checkable: passes — It can be checked against evidence.
- Load-bearing: fails — The paper’s conclusions may not depend on it.
- Based: passes — The paper gives a reason why it holds.
Probably not a substantial claim. The paper’s conclusions may not depend on it. It may state two separate claims as one.
A result the paper reports from its own data — it cites no other source for it, so there is none to check. The quote shows it is in the paper.
In the paper
“Cluster Nuc3 showed similar overlaps between “in vitro 1” and “in vitro 2” (5 genes).”
§ Single-Nucleus RNA-Seq Is Not Suitable for Detection of Microglial Activation Genes in Humans > STAR★Methods > Quantification and Statistical Analysis
plain- Asserted: passes — The authors put it forward as true.
- Checkable: passes — It can be checked against evidence.
- Load-bearing: fails — The paper’s conclusions may not depend on it.
- Based: passes — The paper gives a reason why it holds.
Probably not a substantial claim. The paper’s conclusions may not depend on it.
A result the paper reports from its own data — it cites no other source for it, so there is none to check. The quote shows it is in the paper.
In the paper
“We identified 3,721 microglia (expressing MEF2A, P2RY12, CX3CR1, CSF1R), a macrophage cluster (enriched for CD163 and MRC1, 67 nuclei), a neutrophil cluster (72 nuclei), and a cluster containing microglial as well as astrocytic markers (marked by GFAP, 68 nuclei).”
§ Single-Nucleus RNA-Seq Is Not Suitable for Detection of Microglial Activation Genes in Humans > STAR★Methods > Quantification and Statistical Analysis
plain- Asserted: passes — The authors put it forward as true.
- Checkable: passes — It can be checked against evidence.
- Load-bearing: fails — The paper’s conclusions may not depend on it.
- Based: passes — The paper gives a reason why it holds.
Probably not a substantial claim. The paper’s conclusions may not depend on it. It may state two separate claims as one.
A result the paper reports from its own data — it cites no other source for it, so there is none to check. The quote shows it is in the paper.
In the paper
“After pre-processing, 3,927 nuclei remained, with a mean UMI count of 1,328 and a mean gene count of 879 genes per nucleus.”
§ Single-Nucleus RNA-Seq Is Not Suitable for Detection of Microglial Activation Genes in Humans > STAR★Methods > Quantification and Statistical Analysis
plainn = 4- Asserted: passes — The authors put it forward as true.
- Checkable: passes — It can be checked against evidence.
- Load-bearing: fails — The paper’s conclusions may not depend on it.
- Based: passes — The paper gives a reason why it holds.
Probably not a substantial claim. The paper’s conclusions may not depend on it. It may state two separate claims as one.
A result the paper reports from its own data — it cites no other source for it, so there is none to check. The quote shows it is in the paper.
In the paper
“Finally, the CAM (macrophage) cluster (CD163, MRC1), separated out from the bulk of the microglia, and was easily-recognizable based on its MS40 score.”
§ Single-Nucleus RNA-Seq Is Not Suitable for Detection of Microglial Activation Genes in Humans > STAR★Methods > Quantification and Statistical Analysis
plaincorrelational- Asserted: passes — The authors put it forward as true.
- Checkable: passes — It can be checked against evidence.
- Load-bearing: fails — The paper’s conclusions may not depend on it.
- Based: passes — The paper gives a reason why it holds.
Probably not a substantial claim. The paper’s conclusions may not depend on it. It may state two separate claims as one.
A result the paper reports from its own data — it cites no other source for it, so there is none to check. The quote shows it is in the paper.
In the paper
“Selecting 40 markers allowed us to align cellular and nuclear clusters in an almost one-to-one fashion (see Figure S1F).”
§ Single-Nucleus RNA-Seq Is Not Suitable for Detection of Microglial Activation Genes in Humans > STAR★Methods > Quantification and Statistical Analysis
plaindirect- Asserted: passes — The authors put it forward as true.
- Checkable: passes — It can be checked against evidence.
- Load-bearing: fails — The paper’s conclusions may not depend on it.
- Based: passes — The paper gives a reason why it holds.
Probably not a substantial claim. The paper’s conclusions may not depend on it.
A conclusion the paper draws from its own results — it cites no other source for it, so there is none to check. The quote shows it is in the paper.
In the paper
“although snRNA-seq offers a viable alternative to scRNA-seq for the identification of cell types in tissue for which cell dissociation is problematic”
§ Single-Nucleus RNA-Seq Is Not Suitable for Detection of Microglial Activation Genes in Humans > Discussion
plain- Asserted: passes — The authors put it forward as true.
- Checkable: passes — It can be checked against evidence.
- Load-bearing: fails — The paper’s conclusions may not depend on it.
- Based: passes — The paper gives a reason why it holds.
Probably not a substantial claim. The paper’s conclusions may not depend on it.
What the paper did — it cites no source for this, so there is none to check. The quote shows it is in the paper.
In the paper
“One caveat of the present study is that we have used non-diseased tissue, and we cannot dismiss the possibility that mRNA localization distributions change in more activated populations of microglia.”
§ Single-Nucleus RNA-Seq Is Not Suitable for Detection of Microglial Activation Genes in Humans > Discussion
hedged- Asserted: passes — The authors put it forward as true.
- Checkable: passes — It can be checked against evidence.
- Load-bearing: passes — The paper’s conclusions depend on it.
- Based: passes — The paper gives a reason why it holds.
It may state two separate claims as one.
What the paper did — it cites no source for this, so there is none to check. The quote shows it is in the paper.
In the paper
“To ensure the high number of cells relative to nuclei did not affect the result (Figure S2C), we randomly sampled 3,927 cells from the count matrix.”
§ Single-Nucleus RNA-Seq Is Not Suitable for Detection of Microglial Activation Genes in Humans > STAR★Methods > Quantification and Statistical Analysis
plain- Asserted: passes — The authors put it forward as true.
- Checkable: passes — It can be checked against evidence.
- Load-bearing: fails — The paper’s conclusions may not depend on it.
- Based: passes — The paper gives a reason why it holds.
Probably not a substantial claim. The paper’s conclusions may not depend on it.
What the paper did — it cites no source for this, so there is none to check. The quote shows it is in the paper.
In the paper
“In the fresh nuclei and cells, examination of these markers in the clustering confirmed that all cells were microglial.”
§ Single-Nucleus RNA-Seq Is Not Suitable for Detection of Microglial Activation Genes in Humans > STAR★Methods > Quantification and Statistical Analysis
boostedn = 2- Asserted: passes — The authors put it forward as true.
- Checkable: passes — It can be checked against evidence.
- Load-bearing: fails — The paper’s conclusions may not depend on it.
- Based: passes — The paper gives a reason why it holds.
Probably not a substantial claim. The paper’s conclusions may not depend on it.
What the paper did — it cites no source for this, so there is none to check. The quote shows it is in the paper.
In the paper
“We confirm our results using publicly available data.”
§ Single-Nucleus RNA-Seq Is Not Suitable for Detection of Microglial Activation Genes in Humans > Introduction
plain- Asserted: passes — The authors put it forward as true.
- Checkable: passes — It can be checked against evidence.
- Load-bearing: fails — The paper’s conclusions may not depend on it.
- Based: passes — The paper gives a reason why it holds.
Probably not a substantial claim. The paper’s conclusions may not depend on it.
What the paper did — it cites no source for this, so there is none to check. The quote shows it is in the paper.
In the paper
“Following alignment, nuclei from one patient sample (RM101.1) were removed due to poor quality (low read and gene count).”
§ Single-Nucleus RNA-Seq Is Not Suitable for Detection of Microglial Activation Genes in Humans > STAR★Methods > Quantification and Statistical Analysis
plaindirectSingle case- Asserted: passes — The authors put it forward as true.
- Checkable: passes — It can be checked against evidence.
- Load-bearing: fails — The paper’s conclusions may not depend on it.
- Based: passes — The paper gives a reason why it holds.
Probably not a substantial claim. The paper’s conclusions may not depend on it.
What the paper did — it cites no source for this, so there is none to check. The quote shows it is in the paper.
In the paper
“Figure S1C, highlighting known microglial markers (P2RY12, CSF1R, DOCK8 and CX3CR1) as well as markers for other celltypes (MBP for oligodendrocytes, GRIA1 for neurons, AQP4 for astrocytes and CLDN5 for endothelial nuclei), confirms that we extracted only microglial clusters from the original data.”
§ Single-Nucleus RNA-Seq Is Not Suitable for Detection of Microglial Activation Genes in Humans > STAR★Methods > Quantification and Statistical Analysis
boosted- Asserted: passes — The authors put it forward as true.
- Checkable: passes — It can be checked against evidence.
- Load-bearing: passes — The paper’s conclusions depend on it.
- Based: passes — The paper gives a reason why it holds.
Probably not a substantial claim.
What the paper did — it cites no source for this, so there is none to check. The quote shows it is in the paper.
In the paper
“The neutrophil and ambiguous clusters were discarded, leaving only microglia and brain macrophages for downstream analysis (Figure S1D).”
§ Single-Nucleus RNA-Seq Is Not Suitable for Detection of Microglial Activation Genes in Humans > STAR★Methods > Quantification and Statistical Analysis
plain- Asserted: passes — The authors put it forward as true.
- Checkable: passes — It can be checked against evidence.
- Load-bearing: passes — The paper’s conclusions depend on it.
- Based: passes — The paper gives a reason why it holds.
Probably not a substantial claim.
The paper relies on this without support.
scRNA-seq of whole cells provides an accurate reference for the true cellular transcriptome against which snRNA-seq can be judged.
“To compare gene abundance in single microglial cells (14,823 cells) and nuclei (3,940 nuclei), we performed a differential abundance analysis between cells and nuclei from the 4 subjects (Figure 1A).”
The paper relies on this without support.
The limitations of snRNA-seq observed with the 10X Genomics v2 kit and frozen tissue generalize to snRNA-seq generally in human disease.
“we conclude that snRNA-seq is not suited for detecting cellular activation in microglia in human disease.”
The paper relies on this without support.
The four human subjects and non-diseased tissue are representative enough to support conclusions about human microglial activation in disease.
“One caveat of the present study is that we have used non-diseased tissue, and we cannot dismiss the possibility that mRNA localization distributions change in more activated populations of microglia.”
The paper relies on this without support.
The nuclei-depleted genes are depleted due to technical limitations of snRNA-seq rather than biological differences in nuclear mRNA localization.
“However, we are unable to attribute the differences in cellular and nuclear abundance to a biological mechanism (for instance, mRNA trafficking) or a technical artifact of the methodology.”
The authors state this as an assumption.
Nuclei with less than 700 counts from the original unfiltered raw count matrix were empty drops rather than nuclei.
“under the assumption that these were empty drops rather than nuclei”
Claims other papers make about this one
Each is checked against this paper’s own text: does it say what the citing paper says it does?
The cited source says what the claim attributes to it.
In the citing paper
“Our study has several limitations: isotropic fractionation and read depth cut-offs may bias cell recovery based on their nuclear content; nuclear RNA may not fully capture microglial states82 or localized transcriptomic changes; and pathology burden is based on per-sample averages instead of on the spatial context of each cell.”
From Single-cell multiregion dissection of Alzheimer’s disease (2024) · cites this paper as [82]
Self-check
Percentages, sums and reported differences re-computed from the paper’s own numbers.
Each contradiction between two passages listed here was confirmed by an independent check.
Rated minor: it would not touch a result — a value no result rests on, a p-value that stays on the same side of the significance level, or a conflict that is clerical, resolved elsewhere in the paper, or outside its own findings.
In the paper
§ Single-Nucleus RNA-Seq Is Not Suitable for Detection of Microglial Activation Genes in Humans > Results > snRNA-Seq Recovers Major Cell Types from Human Tissue but Not Microglial State
“interneurons (11.2%)”
§ Single-Nucleus RNA-Seq Is Not Suitable for Detection of Microglial Activation Genes in Humans > STAR★Methods > Quantification and Statistical Analysis
“interneurons (11.3%)”
Rated minor: it would not touch a result — a value no result rests on, a p-value that stays on the same side of the significance level, or a conflict that is clerical, resolved elsewhere in the paper, or outside its own findings.
In the paper
§ Single-Nucleus RNA-Seq Is Not Suitable for Detection of Microglial Activation Genes in Humans > Results > Gene Expression Profiling of Human Nuclei and Cells
“we detected 238 genes that were significantly less abundant in cells (fold change < −2, padj < 0.05; blue in Figure S2E), in comparison to the original 246 genes.”
§ Single-Nucleus RNA-Seq Is Not Suitable for Detection of Microglial Activation Genes in Humans > Results > Gene Expression Profiling of Human Nuclei and Cells
“we identified a group of 246 genes (1.1% of all genes detected) that was less abundant in nuclei”
Rated minor: it would not touch a result — a value no result rests on, a p-value that stays on the same side of the significance level, or a conflict that is clerical, resolved elsewhere in the paper, or outside its own findings.
In the paper
§ Single-Nucleus RNA-Seq Is Not Suitable for Detection of Microglial Activation Genes in Humans > Results > Gene Expression Profiling of Human Nuclei and Cells
“No changes were seen in the number of genes that were underrepresented in nuclei (67).”
§ Single-Nucleus RNA-Seq Is Not Suitable for Detection of Microglial Activation Genes in Humans > Results > Gene Expression Profiling of Human Nuclei and Cells
“A second population of 67 genes (0.3%) was found to be more abundant in nuclei”
Citations
Cites
Subramanian, A., Tamayo, P., Mootha, V. K., Mukherjee, S., Ebert, B. L., Gillette, M. A., Paulovich, A., Pomeroy, S. L., Golub, T. R., Lander, E. S., et al. (2005) · Proceedings of the National Academy of Sciences · doi:10.1073/pnas.0506580102 · Cited by 53,625 · cited 2×
“To assess functional enrichment among genes found to be more abundant in cells or nuclei, we ranked all genes according to log fold change (genes with a low abundance in nuclei had a negative log fold change) and performed a gene set enrichment analysis (GSEA; Subramanian et al., 2005) against gene markers from previo…”
MethodComprehensive Integration of Single-Cell Data
Stuart, T., Butler, A., Hoffman, P., Hafemeister, C., Papalexi, E., Mauck, W. M., Hao, Y., Stoeckius, M., Smibert, P., & Satija, R. (2019) · Cell · doi:10.1016/j.cell.2019.05.031 · Cited by 15,453
Integrating single-cell transcriptomic data across different conditions, technologies, and species
Butler, A., Hoffman, P., Smibert, P., Papalexi, E., & Satija, R. (2018) · Nature Biotechnology · doi:10.1038/nbt.4096 · Cited by 13,174
Molecular signatures database (MSigDB) 3.0
Liberzon, A., Subramanian, A., Pinchback, R., Thorvaldsdóttir, H., Tamayo, P., & Mesirov, J. P. (2011) · Bioinformatics · doi:10.1093/bioinformatics/btr260 · Cited by 7,111 · cited 1×
“Gene ontology (GO) sets were obtained from MSigDB (Liberzon et al., 2011; Subramanian et al., 2005).”
MethodHighly parallel genome-wide expression profiling of individual cells using nanoliter droplets.
Macosko, E. Z., Basu, A., Satija, R., Nemesh, J., Shekhar, K., Goldman, M., Tirosh, I., Bialas, A. R., Kamitaki, N., Martersteck, E. M., et al. (2015) · Cell · doi:10.1016/j.cell.2015.05.002 · Cited by 7,110 · cited 2×
“…enrichment of synaptosome genes (NES = 1.82, padj = 3.6e-05, Figure 2A; Hafner et al., 2019) and ambient RNA—mRNA originating not from intact cells/nuclei but from free-floating transcripts (Macosko et al., 2015)—(NES = 1.71, padj = 9.2e-05; Figure 2A; Figure S2D) within the nucleus-abundant genes.”
BackgroundInfluentialA Unique Microglia Type Associated with Restricting Development of Alzheimer’s Disease
Keren-Shaul, H., Spinrad, A., Weiner, A., Matcovitch-Natan, O., Dvir-Szternfeld, R., Ulland, T. K., David, E., Baruch, K., Lara-Astaiso, D., Toth, B., et al. (2017) · Cell · doi:10.1016/j.cell.2017.05.018 · Cited by 5,493 · cited 5×
“, 2019); DAM, disease-associated microglia (Keren-Shaul et al., 2017); LPS, lipopolysaccharide (Gerrits et al.”
BackgroundInfluentialMcGinnis, C. S., Murrow, L. M., & Gartner, Z. J. (2019) · Cell Systems · doi:10.1016/j.cels.2019.03.003 · Cited by 4,521
Meta-Analysis of 74,046 Individuals Identifies 11 New Susceptibility Loci for Alzheimer’s Disease
(EADI), E. A. D. I., Lambert, J.-C., (GERAD), G. A. E. R. I. A. D., Alzheimer's Disease Genetic Consortium (ADGC), (CHARGE), C. F. H. A. A. R. I. G. E., Ibrahim-Verbaas, C. A., Harold, D., Naj, A. C., Sims, R., Bellenguez, C., et al. (2013) · Nature Genetics · doi:10.1038/ng.2802 · Cited by 4,336 · cited 1×
“In addition, there is significant overlap between those genes involved in the mouse microglial response and AD risk genes identified in genome-wide association studies (Efthymiou and Goate, 2017; Gosselin et al., 2017; Jansen et al., 2019; Kunkle et al., 2019; Lambert et al., 2013; Marioni et al., 2018), for example,…”
BackgroundVisualization and analysis of gene expression in tissue sections by spatial transcriptomics
Ståhl, P. L., Salmén, F., Vickovic, S., Lundmark, A., Navarro, J. F., Magnusson, J., Giacomello, S., Asp, M., Westholm, J. O., Huss, M., et al. (2016) · Science · doi:10.1126/science.aaf2403 · Cited by 3,834 · cited 1×
“In situ spatial transcriptomics (STs) negates issues related to tissue dissociation and cell or nucleus isolation (Ståhl et al., 2016), while at the same time retaining spatial information.”
BackgroundFast gene set enrichment analysisPreprint
Korotkevich, G., Sukhov, V., Budin, N., Shpak, B., Artyomov, M. N., & Sergushichev, A. (2016) · bioRxiv (Cold Spring Harbor Laboratory) · doi:10.1101/060012 · Cited by 3,742
Cited by
Sorted by citations
Dysregulation of brain and choroid plexus cell types in severe COVID-19
Yang, A. C., Kern, F., Losada, P. M., Agam, M. R., Maat, C. A., Schmartz, G. P., Fehlmann, T., Stein, J. A., Schaum, N., Lee, D. P., et al. (2021) · Nature · doi:10.1038/s41586-021-03710-0 · Cited by 620
Applications of single-cell RNA sequencing in drug discovery and development
de Sande, B. V., Lee, J. S., Mutasa-Gottgens, E., Naughton, B. J., Bacon, W., Manning, J. R., Wang, Y., Pollard, J. R., Mendez, M., Hill, J., et al. (2023) · Nature Reviews Drug Discovery · doi:10.1038/s41573-023-00688-4 · Cited by 462
Silvin, A., Uderhardt, S., Piot, C., Da Mesquita, S., Yang, K., Geirsdottir, L., Mulder, K., Eyal, D., Liu, Z., Bridlance, C., et al. (2022) · Immunity · doi:10.1016/j.immuni.2022.07.004 · Cited by 368
Single-cell multiregion dissection of Alzheimer’s disease
Mathys, H., Boix, C. A., Akay, L. A., Xia, Z., Davila-Velderrain, J., Ng, A. P., Jiang, X., Abdelhady, G., Galani, K., Mantero, J., et al. (2024) · Nature · doi:10.1038/s41586-024-07606-7 · Cited by 343
Microglia in Alzheimer's disease at single-cell level. Are there common patterns in humans and mice?
Chen, Y., & Colonna, M. (2021) · Journal of Experimental Medicine · doi:10.1084/jem.20202717 · Cited by 339
“cytosol; accordingly, mRNA of key DAM markers was less abundant in nuclei than in whole cells obtained from the same individuals by neocortical resection (Thrupp et al., 2020).”
BackgroundProfiling cell identity and tissue architecture with single-cell and spatial transcriptomics
Gulati, G. S., D'Silva, J. P., Liu, Y., Wang, L., & Newman, A. M. (2024) · Nature Reviews Molecular Cell Biology · doi:10.1038/s41580-024-00768-2 · Cited by 347
“…for transcriptional profiling is susceptible to contamination with ambient RNA 22 and excludes key cytoplasmic transcripts, including those involved in microglial activation 23 , regulatory RNA stored in processing bodies 24 , and nuclear RNA during mitosis (when cells lack a nuclear membrane) 14 .”
The Contribution of Microglia to Neuroinflammation in Parkinson’s Disease
Badanjak, K., Fixemer, S., Smajić, S., Skupin, A., & Grünewald, A. (2021) · International Journal of Molecular Sciences · doi:10.3390/ijms22094676 · Cited by 296
Sobue, A., Komine, O., Hara, Y., Endo, F., Mizoguchi, H., Watanabe, S., Murayama, S., Saito, T., Saido, T. C., Sahara, N., et al. (2021) · Acta Neuropathologica Communications · doi:10.1186/s40478-020-01099-x · Cited by 253
“A recent study pointed out the low sensitivity of single nucleus RNA-seq to detect DAM genes in human postmortem brains [45].”
BackgroundA shared disease-associated oligodendrocyte signature among multiple CNS pathologies
Kenigsbuch, M., Bost, P., Halevi, S., Chang, Y., Chen, S., Ma, Q., Hajbi, R., Schwikowski, B., Bodenmiller, B., Fu, H., et al. (2022) · Nature Neuroscience · doi:10.1038/s41593-022-01104-7 · Cited by 233
Cholesterol and Alzheimer’s Disease; From Risk Genes to Pathological Effects
Feringa, F. M., & van der Kant, R. (2021) · Frontiers in Aging Neuroscience · doi:10.3389/fnagi.2021.690372 · Cited by 226
“, too few single microglial cells analyzed or the low sensitivity of single-nuclear RNAseq to detect microglial activation genes (Del-Aguila et al., 2019; Mathys et al., 2019; Thrupp et al., 2020).”
BackgroundZeng, H., Huang, J., Zhou, H., Meilandt, W. J., Dejanovic, B., Zhou, Y., Bohlen, C. J., Lee, S.-H., Ren, J., Liu, A., et al. (2023) · Nature Neuroscience · doi:10.1038/s41593-022-01251-x · Cited by 233
Tran, M. N., Maynard, K. R., Spangler, A., Huuki, L. A., Montgomery, K. D., Sadashivaiah, V., Tippani, M., Barry, B. K., Hancock, D. B., Hicks, S. C., et al. (2021) · Neuron · doi:10.1016/j.neuron.2021.09.001 · Cited by 219
Ayhan, F., Kulkarni, A., Berto, S., Sivaprakasam, K., Douglas, C., Lega, B. C., & Konopka, G. (2021) · Neuron · doi:10.1016/j.neuron.2021.05.003 · Cited by 207
The role of innate immune genes in Alzheimer's disease
Griciuc, A., & Tanzi, R. E. (2021) · Current Opinion in Neurology · doi:10.1097/wco.0000000000000911 · Cited by 192
“However, a new study suggested that snRNA-seq is not suitable for detection of microglial activation genes in human control brain due to the depletion of approximately 20% of DAM genes in nuclei compared with whole cells [34].”
BackgroundZernecke, A., Erhard, F., Weinberger, T., Schulz, C., Ley, K. F., Saliba, A., & Cochain, C. (2022) · Cardiovascular Research · doi:10.1093/cvr/cvac161 · Cited by 214
“Single-nucleus RNA-seq, which bypasses the need for enzymatic tissue digestion, might be particularly suited to the analysis of human atherosclerosis, although poor detection of key mononuclear phagocyte genes may need to be carefully accounted for.(55) Recent efforts at establishing cell atlases of healthy or disease…”
BackgroundResultInfluentialTREM2 dependent and independent functions of microglia in Alzheimer’s disease
Hou, J., Chen, Y., Grajales-Reyes, G., & Colonna, M. (2022) · Molecular Neurodegeneration · doi:10.1186/s13024-022-00588-y · Cited by 191
“These inconsistencies maybe caused by the heterogeneity of age, gender, and disease stage among study subjects and by the methodology used in sample processing [101, 102].”
MethodAbsence of microglia promotes diverse pathologies and early lethality in Alzheimer’s disease mice
Kiani Shabestari, S., Morabito, S., Danhash, E. P., McQuade, A., Sanchez, J. R., Miyoshi, E., Chadarevian, J. P., Claes, C., Coburn, M. A., Hasselmann, J., et al. (2022) · Cell Reports · doi:10.1016/j.celrep.2022.110961 · Cited by 167
“…brain cells likely provides diminished sensitivity in comparison with the previously used CD45 + immune cell enrichment approach, and (2) a recent report demonstrates that microglia genes are underrepresented in single-nuclei sequencing versus whole-cell sequencing methods (Thrupp et al., 2020).”
Microglia and Astrocyte Function and Communication: What Do We Know in Humans?
Garland, E. F., Hartnell, I. J., & Boche, D. (2022) · Frontiers in Neuroscience · doi:10.3389/fnins.2022.824888 · Cited by 165
“, APOE, SPP1, and CD74) were depleted in snRNAseq (Thrupp et al., 2020), implying a low sensitivity of the method and that microglial nuclei may not recapitulate the whole picture of microglial activation.”
A multi-pronged human microglia response to Alzheimer’s disease Aβ pathology
Mancuso, R., Fattorelli, N., Martinez-Muriana, A., Davis, E., Wolfs, L., Van Den Daele, J., Geric, I., Preman, P., Serneels, L., Poovathingal, S., et al. (2022) · doi:10.1101/2022.07.07.499139 · Cited by 169
“DAM response is conserved in the human brain 12,13 .”
BackgroundSelf-citationMaitra, M., Mitsuhashi, H., Rahimian, R., Chawla, A., Yang, J., Fiori, L. M., Davoli, M. A., Perlman, K., Aouabed, Z., Mash, D. C., et al. (2023) · Nature Communications · doi:10.1038/s41467-023-38530-5 · Cited by 168
“This may partly be due to the lack of cytoplasmic transcripts in snRNA-seq limiting the information about microglial states 74 .”
Insights into Alzheimer’s disease from single-cell genomic approaches
Murdock, M. H., & Tsai, L.-H. (2023) · Nature Neuroscience · doi:10.1038/s41593-022-01222-2 · Cited by 148
AD-linked R47H- TREM2 mutation induces disease-enhancing microglial states via AKT hyperactivation
Sayed, F. A., Kodama, L., Fan, L., Carling, G. K., Udeochu, J. C., Le, D., Li, Q., Zhou, L., Wong, M. Y., Horowitz, R., et al. (2021) · Science Translational Medicine · doi:10.1126/scitranslmed.abe3947 · Cited by 155
“N. Thrupp, C. Sala Frigerio, L. Wolfs, N. G. Skene, N. Fattorelli, S. Poovathingal, Y. Fourne, P. M. Matthews, T. Theys, R. Mancuso, B. de Strooper, M. Fiers, Single-nucleus RNA-seq is not suitable for detection of microglial activation genes in humans.”
MethodResultInfluentialSingle-cell dissection of the human motor and prefrontal cortices in ALS and FTLD
Pineda, S. S., Lee, H., Fitzwalter, B. E., Mohammadi, S., Pregent, L., Gardashli, M., Mantero, J. C., Engelberg-Cook, E., DeJesus‐Hernandez, M., van Blitterswijk, M., et al. (2024) · Cell · doi:10.1016/j.cell.2024.02.031 · Cited by 158
“94 Another limitation of the assay and use of human tissues is the expected variability in dissections and nuclei capture resulting in highly variable cell-type yields even from high-quality and rigorously dissected tissues, making it a poor method for evaluating changes in cell-type composition.”
MethodMulticellular communities are perturbed in the aging human brain and Alzheimer’s disease
Cain, A., Taga, M., McCabe, C., Green, G. S., Hekselman, I., White, C. C., Lee, D. I., Gaur, P., Rozenblatt-Rosen, O., Zhang, F., et al. (2023) · Nature Neuroscience · doi:10.1038/s41593-023-01356-x · Cited by 142
Astrocyte transcriptomic changes along the spatiotemporal progression of Alzheimer’s disease
Serrano-Pozo, A., Li, H., Li, Z., Muñoz-Castro, C., Jaisa-aad, M., Healey, M. A., Welikovitch, L. A., Jayakumar, R., Bryant, A. G., Noori, A., et al. (2024) · Nature Neuroscience · doi:10.1038/s41593-024-01791-4 · Cited by 140
Chen, S., Chang, Y., Li, L., Acosta, D., Li, Y., Guo, Q., Wang, C., Turkes, E., Morrison, C., Julian, D., et al. (2022) · Acta Neuropathologica Communications · doi:10.1186/s40478-022-01494-6 · Cited by 144
Complement factor C1q mediates sleep spindle loss and epileptic spikes after mild brain injury
Holden, S. S., Grandi, F. C., Aboubakr, O., Higashikubo, B., Cho, F. S., Chang, A. H., Forero, A. O., Morningstar, A. R., Mathur, V., Kuhn, L. J., et al. (2021) · Science · doi:10.1126/science.abj2685 · Cited by 133
“After correcting for ambient RNA (33) and removing potential doublets (34) or nuclei with a high percentage of mitochondrial reads, clustering analysis identified the expected cell types, including microglia (Cx3cr1, P2ry12), astrocytes (Cldn10, Fgfr3), oligodendrocytes (Mobp, Olig1), oligodendrocyte progenitors (Sox8…”
MethodInfluentialCaglayan, E., Liu, Y., & Konopka, G. (2022) · Neuron · doi:10.1016/j.neuron.2022.09.010 · Cited by 123
Neuroinflammation in Alzheimer’s disease: microglial signature and their relevance to disease
Sobue, A., Komine, O., & Yamanaka, K. (2023) · Inflammation and Regeneration · doi:10.1186/s41232-023-00277-3 · Cited by 134
“In addition, recent studies pointed out the low sensitivity of single nucleus RNAseq to detect DAM genes in human postmortem brains [38, 41].”
BackgroundMartins-Ferreira, R., Calafell-Segura, J., Leal, B., Rodríguez-Ubreva, J., Martínez-Saez, E., Mereu, E., Pinho E Costa, P., Laguna, A., & Ballestar, E. (2025) · Nature Communications · doi:10.1038/s41467-025-56124-1 · Cited by 123
“…expression of the full list of human genes in the DAM signature ( n =210), based on Keren-Shaul et al. 8 , and as previously reported for human data by Thrupp et al. 44 , and the summarized human gene signatures for DAM, YAM and DIMs provided by Silvin et al. 33 reinforces these patterns (Fig.”
InfluentialMatson, K. J. E., Russ, D. E., Kathe, C., Hua, I., Maric, D., Ding, Y., Krynitsky, J., Pursley, R. H., Sathyamurthy, A., Squair, J. W., et al. (2022) · Nature Communications · doi:10.1038/s41467-022-33184-1 · Cited by 142
Antignano, I., Liu, Y., Offermann, N., & Capasso, M. (2023) · Cellular and Molecular Life Sciences · doi:10.1007/s00018-023-04775-y · Cited by 117
“Indeed, some publications have highlighted the inherent technical challenges and questioned the validity of, for example, single nuclei RNAseq to investigate human microglia phenotypes [132].”
BackgroundMiyoshi, E., Morabito, S., Henningfield, C. M., Das, S., Rahimzadeh, N., Shabestari, S. K., Michael, N., Emerson, N., Reese, F., Shi, Z., et al. (2024) · Nature Genetics · doi:10.1038/s41588-024-01961-x · Cited by 115
Tzioras, M., Daniels, M. J. D., Davies, C., Baxter, P. S., King, D., McKay, S., Varga, B. V., Popovic, K., Hernandez, M., Stevenson, A. J., et al. (2023) · Cell Reports Medicine · doi:10.1016/j.xcrm.2023.101175 · Cited by 117
“47 With a clearer understanding of glia-synapse interactions, there is potential to develop effective therapeutics to protect synapse function.”
Wang, M., Song, W., Chen, M., Wang, Q., Zhou, X., Xu, P., Krek, A., Yoon, Y., Ho, L., Orr, M. E., et al. (2022) · Molecular Neurodegeneration · doi:10.1186/s13024-022-00517-z · Cited by 104
“However, we must note that snRNA-seq is limited for detecting cellular activation in microglia in human diseases [31], a potential explanation for inconsistent observation of microglia signatures between human studies and between human and mouse studies.”
BackgroundPerspectives on single-nucleus RNA sequencing in different cell types and tissues
Kim, N., Kang, H., Jo, A., Yoo, S.-A., & Lee, H.-O. (2023) · Journal of Pathology and Translational Medicine · doi:10.4132/jptm.2022.12.19 · Cited by 97
“Nonetheless, differences in the nuclear and cytoplasmic gene expression patterns, and limitations of snRNA-seq in the capture and characterization of non-neuronal cell types [32] necessitate the complementary use of scRNA-seq and snRNA-seq for cell type identification in the brain.”
MethodTsartsalis, S., Sleven, H., Fancy, N., Wessely, F., Smith, A. M., Willumsen, N., Cheung, T. K. D., Rokicki, M. J., Chau, V., Ifie, E., et al. (2024) · Nature Communications · doi:10.1038/s41467-024-46630-z · Cited by 95
“In the 3 rd paragraph of the “Quality control, dataset integration, dimension reduction and clustering” section, we briefly describe how cell type identification was performed based on the full of co-expressed genes that distinguish each cluster.”
Self-citationBayesian estimation of cell type–specific gene expression with prior derived from single-cell dataPreprint
Wang, J., Roeder, K., & Devlin, B. (2021) · Genome Research · doi:10.1101/gr.268722.120 · Cited by 89
“…studies of brain tissue have found that snRNA-seq fails to detect a fraction of the microglia population (Mathys et al. 2019) and microglial activation in the human brain (Thrupp et al. 2020), yet microglia are thought to be a key cell type related to critical diseases, such as Alzheimer’s disease.”
BackgroundBravo González-Blas, C., Matetovici, I., Hillen, H., Taskiran, I. I., Vandepoel, R., Christiaens, V., Sansores-García, L., Verboven, E., Hulselmans, G., Poovathingal, S., et al. (2024) · Nature Cell Biology · doi:10.1038/s41556-023-01316-4 · Cited by 85
Self-citationSung, Y. J., Yang, C., Norton, J., Johnson, M., Fagan, A., Bateman, R. J., Perrin, R. J., Morris, J. C., Farlow, M. R., Chhatwal, J. P., et al. (2023) · Science Translational Medicine · doi:10.1126/scitranslmed.abq5923 · Cited by 84
“SPP1 was recently implicated in microglia activation and AD (39).”
Liu, Z., Yang, J., Long, Y., Zhang, C., Wang, D., Zhang, X., Dong, W., Zhao, L., Liu, C., Zhai, J., et al. (2023) · Nature Plants · doi:10.1038/s41477-023-01524-8 · Cited by 89
LAG3 is not expressed in human and murine neurons and does not modulate α‐synucleinopathies
Emmenegger, M., Cecco, E. D., Hruška-Plocháň, M., Eninger, T., Schneider, M. M., Barth, M., Tantardini, E., Rossi, P. D., Bacioglu, M., Langston, R. G., et al. (2021) · EMBO Molecular Medicine · doi:10.15252/emmm.202114745 · Cited by 76
“It is unclear whether the lack of detection of LAG3 in human microglia relates to a crucial species difference or to technical limitations of snRNAseq versus scRNAseq, which may be particularly important for microglia (Thrupp et al , 2020).”
A human adipose tissue cell-type transcriptome atlas
Norreen-Thorsen, M., Struck, E. C., Öling, S., Zwahlen, M., von Feilitzen, K., Odeberg, J., Lindskog, C., Pontén, F., Uhlén, M., Dusart, P., et al. (2022) · Cell Reports · doi:10.1016/j.celrep.2022.111046 · Cited by 87
“Adipocytes have been analyzed using single-nuclei RNA-seq, circumventing some scRNA-seq limitations, but transcript expression can differ be-tween nuclei and cytoplasm (Thrupp et al., 2020).”
Lee, S.-H., Rezzonico, M. G., Friedman, B. A., Huntley, M. H., Meilandt, W. J., Pandey, S., Chen, Y.-J. J., Easton, A. E., Modrusan, Z. D., Hansen, D. V., et al. (2021) · Cell Reports · doi:10.1016/j.celrep.2021.110158 · Cited by 82
Microglia transcriptional states and their functional significance: Context drives diversity
Depp, C., Doman, J. L., Hingerl, M., Xia, J., & Stevens, B. (2025) · Immunity · doi:10.1016/j.immuni.2025.04.009 · Cited by 84
What are activated and reactive glia and what is their role in neurodegeneration?
Bennett, M. L., & Viaene, A. N. (2021) · Neurobiology of Disease · doi:10.1016/j.nbd.2020.105172 · Cited by 77
Yu, L., Wang, X., Mu, Q., Tam, S. S. T., Loi, D. S. C., Chan, A. K., Poon, W. S., Ng, H., Chan, D. T. M., Wang, J., et al. (2023) · Science Advances · doi:10.1126/sciadv.abp8901 · Cited by 76
“Genes that are enriched in the whole-cell dataset are highly expressed housekeeping genes including actin genes, adenosine triphosphate synthase genes, translation initiation factor genes, and ribosome subunit protein genes (RPL genes), which is in concordance with previous findings ( 31 ).”
Tosoni, G., Ayyildiz, D., Bryois, J., Macnair, W., Fitzsimons, C. P., Lucassen, P. J., & Salta, E. (2023) · Neuron · doi:10.1016/j.neuron.2023.03.010 · Cited by 79
“23,46,47 50 Such differences be-tween whole-cell versus nucleus RNA-seq could be partially attributed to technical issues associated with sampling and recovery of distinct subsets of the transcriptome.”
BackgroundImmune Activation in Alzheimer Disease
Mary, A., Mancuso, R., & Heneka, M. T. (2024) · Annual Review of Immunology · doi:10.1146/annurev-immunol-101921-035222 · Cited by 82
Self-citationLodder, C., Scheyltjens, I., Stancu, I., Lucena, P. B., de Ravé, M. G., Vanherle, S., Vanmierlo, T., Cremers, N., Vanrusselt, H., Brône, B., et al. (2021) · Acta Neuropathologica Communications · doi:10.1186/s40478-021-01204-8 · Cited by 71
“Alternatively, it may result from a shortcoming of the snRNA-Seq approach, which may fail to detect many activation genes in microglia [62].”
BackgroundAl‐Dalahmah, O., Argenziano, M., Kannan, A., Mahajan, A., Furnari, J. L., Paryani, F., Boyett, D. M., Save, A., Humala, N., Khan, F., et al. (2023) · Nature Communications · doi:10.1038/s41467-023-38186-1 · Cited by 75
“Also,whilesnRNAseq provides us insight into cell types that are underrepresented in scRNAseq, snRNAseq exhibits limitations in the ability to identify particular cell states, as has been shown for myeloid cells 35 .”
Yang, H. S., Onos, K. D., Choi, K., Keezer, K. J., Skelly, D. A., Carter, G. W., & Howell, G. R. (2021) · Cell Reports · doi:10.1016/j.celrep.2021.108739 · Cited by 69
“Recent work has demonstrated that single-nucleus RNA sequencing (RNA-seq) of stored human tissue fails to detect differences in microglia activation between AD and controls (Thrupp et al., 2020), further complicating direct comparisons between humans and mouse models.”
BackgroundFeleke, R., Reynolds, R. H., Smith, A. M., Tilley, B. S., Taliun, S. A. G., Hardy, J., Matthews, P. M., Gentleman, S., Owen, D. R., Johnson, M. R., et al. (2021) · Acta Neuropathologica · doi:10.1007/s00401-021-02343-x · Cited by 69
Self-citationMicroglia in Parkinson’s Disease
Stefanova, N. (2022) · Journal of Parkinson s Disease · doi:10.3233/jpd-223237 · Cited by 79
“The rea128 son for the discrepancies in the outcomes of the high 129 throughput screening systems may relate to differ130 ent sensitivity of the methods to identify microglial 131 subtypes as well as differences of the studied patient 132 populations [21].”
MethodWong, G. C., Chen, J., Zheng, Z., Lü, G., Chan, W., & Zhang, Y. (2021) · Neural Regeneration Research · doi:10.4103/1673-5374.330589 · Cited by 68
“The low sensitivity of single-nucleus RNA-sequencing for detecting gene activation means that it is not suitable for detecting microglial activation in human disease (Thrupp et al., 2020).”
BackgroundSeeker, L. A., Bestard-Cuche, N., Jäkel, S., Kazakou, N.-L., Bøstrand, S. M. K., Wagstaff, L. J., Cholewa-Waclaw, J., Kilpatrick, A. M., van Bruggen, D., Kabbe, M., et al. (2023) · Acta Neuropathologica Communications · doi:10.1186/s40478-023-01568-z · Cited by 72
Microglia: Friend and foe in tauopathy
Odfalk, K. F., Bieniek, K. F., & Hopp, S. C. (2022) · Progress in Neurobiology · doi:10.1016/j.pneurobio.2022.102306 · Cited by 60
Microglia Heterogeneity in Alzheimer’s Disease: Insights From Single-Cell Technologies
Wang, H. (2021) · Frontiers in Synaptic Neuroscience · doi:10.3389/fnsyn.2021.773590 · Cited by 62
Pettas, S., Karagianni, K., Kanata, Ε., Chatziefstathiou, A., Christoudia, N., Xanthopoulos, K., Sklaviadis, T., & Dafou, D. (2022) · Cells · doi:10.3390/cells11152383 · Cited by 70
“On the other hand, snRNAseq provides the ability to examine the transcriptional profile of frozen tissues, although its sensitivity is modest and it is unsuitable for identifying cellular activation in microglia [13].”
BackgroundCell type-specific changes identified by single-cell transcriptomics in Alzheimer’s disease
Luquez, T., Gaur, P., Kosater, I. M., Lam, M., Lee, D. I., Mares, J. A., Paryani, F., Yadav, A., & Menon, V. (2022) · Genome Medicine · doi:10.1186/s13073-022-01136-5 · Cited by 64
“This mirrors recent findings that disease-associated signatures in humans are substantially more heterogeneous than in mouse models on a single genetic background [25, 28, 29, 40, 42, 52].”
BackgroundPatel, T., Carnwath, T., Wang, X., Allen, M., Lincoln, S., Lewis‐Tuffin, L. J., Quicksall, Z., Lin, S., Tutor‐New, F. Q., Ho, C. C. G., et al. (2022) · Aging Cell · doi:10.1111/acel.13606 · Cited by 61
Tuddenham, J. F., Taga, M. F., Haage, V. C., Marshe, V. S., Roostaei, T., White, C. C., Lee, A., Fujita, M., Khairallah, A., Zhang, Y., et al. (2024) · Nature Neuroscience · doi:10.1038/s41593-024-01764-7 · Cited by 79
“…Nature Portfolio reporting summaries, source data, extended data, supplementary information, acknowledgements, peer review information; details of author contributions and competing interests; and statements of data and code availability are available at https://doi.org/10.1038/s41593-024-01764-7.”
InfluentialChatzinakos, C., Pernia, C. D., Morrison, F. G., Iatrou, A., McCullough, K. M., Schuler, H., Snijders, C., Bajaj, T., DiPietro, C. P., Estruch, M. S., et al. (2023) · American Journal of Psychiatry · doi:10.1176/appi.ajp.20220478 · Cited by 57
Moving from in vitro to in vivo CRISPR screens
Kuhn, M., Santinha, A. J., & Platt, R. J. (2021) · Gene and Genome Editing · doi:10.1016/j.ggedit.2021.100008 · Cited by 56
Podleśny-Drabiniok, A., Novikova, G., Liu, Y., Dunst, J., Temizer, R., Giannarelli, C., Marro, S., Kreslavsky, T., Marcora, E., & Goate, A. M. (2024) · Nature Communications · doi:10.1038/s41467-024-46315-7 · Cited by 52
“The DAM gene expression signature has been robustly identi fi ed in microglia from several mouse models of aging and disease, however its identi fi cation in human microglia has been more challenging 82 .”
Jiang, Y., Zhou, X., Wong, H. Y., Ouyang, L., Ip, F. C. F., Chau, V. M. N., Lau, S., Wu, W., Wong, D. Y. K., Seo, H., et al. (2022) · Nature Aging · doi:10.1038/s43587-022-00241-9 · Cited by 56
Comparison of single‑nucleus and single‑cell transcriptomes in hepatocellular carcinoma tissue
Wen, F., Tang, X., Lin, X., & Qu, H. (2022) · Molecular Medicine Reports · doi:10.3892/mmr.2022.12855 · Cited by 51
“For example, Thrupp et al (14) demonstrated that a small number of genes enriched in microglial activation genes were missing from snrna‐seq data compared with scrna‐seq data in human microglia.”
BackgroundAltered oligodendroglia and astroglia in chronic traumatic encephalopathy
Chancellor, K. B., Chancellor, S. E., Duke-Cohan, J. E., Huber, B. R., Stein, T. D., Alvarez, V. E., Okaty, B. W., Dymecki, S. M., & McKee, A. C. (2021) · Acta Neuropathologica · doi:10.1007/s00401-021-02322-2 · Cited by 51
“Given the difficulty in capturing microglia and endothelial cells using snRNA-seq [54], additional transcriptomic investigations of these cells in the white matter of CTE are warranted, especially in light of previous studies showing increases in neuroinflammatory microglia in DLF cortex in CTE [11–13].”
Immunologic Profiling of the Atlantic Salmon Gill by Single Nuclei Transcriptomics
West, A. C., Mizoro, Y., Wood, S. H., Ince, L. M., Iversen, M., Jørgensen, E. H., Nome, T., Sandve, S. R., Martín, S., Loudon, A. S. I., et al. (2021) · Frontiers in Immunology · doi:10.3389/fimmu.2021.669889 · Cited by 51
“Comparison between snRNAseq and scRNAseq report broadly comparable gene detection but it should be noted that nuclear depleted genes are less visible to a snRNAseq analysis (34, 35).”
BackgroundGupta, A., Shamsi, F., Altemose, N., Dorlhiac, G. F., Cypess, A. M., White, A. P., Yosef, N., Patti, M., Tseng, Y.-H., & Streets, A. (2022) · Genome Research · doi:10.1101/gr.275509.121 · Cited by 54
Current tools to interrogate microglial biology
Dumas, A. A., Borst, K., & Prinz, M. (2021) · Neuron · doi:10.1016/j.neuron.2021.07.004 · Cited by 47
Spatial proteomics of Alzheimer’s disease-specific human microglial states
Mrdjen, D., Cannon, B. J., Amouzgar, M., Kim, Y., Liu, C. C., Vijayaragavan, K., Fullaway, C. C., Spence, A., McCaffrey, E., Bharadwaj, A., et al. (2025) · Nature Immunology · doi:10.1038/s41590-025-02203-w · Cited by 58
“…open chromatin regions associated with genes encoding proteins associated with synaptic regulation (for example, GPR37, FGF10, KCNN2, MEOX2, CLEC14A and NKX2) 55–68 , hinting that these microglia might be specialized for synapse maintenance or remodeling rather than classical immune surveillance.”
Microglia Phenotypes Converge in Aging and Neurodegenerative Disease
Candlish, M., & Hefendehl, J. K. (2021) · Frontiers in Neurology · doi:10.3389/fneur.2021.660720 · Cited by 49
“found that many transcripts associated with microglial activation are concentrated in the cytosol as opposed to the nuclei, resulting in many transcripts remaining undetected with snRNAseq (16).”
BackgroundA Systems Approach to Brain Tumor Treatment
Park, J. H., de Lomana, A. L. G., Marzese, D. M., Juarez, T., Feroze, A. H., Hothi, P., Cobbs, C., Patel, A. P., Kesari, S., Huang, S., et al. (2021) · Cancers · doi:10.3390/cancers13133152 · Cited by 50
“One caveat to using snRNA-seq, however, should be noted—a recent report showed that snRNA-seq does not detect the expression of certain genes associated with microglial activation [93].”
Oh, J., An, M., Son, D., Choi, J., Cho, Y. B., Yoo, C. E., & Park, W. (2022) · Experimental & Molecular Medicine · doi:10.1038/s12276-022-00892-z · Cited by 52
The spatial landscape of glial pathology and T cell response in Parkinson’s disease substantia nigra
Ma, M., Paryani, F., Jakubiak, K. A., Xia, S., Antoku, S., Kannan, A., Lee, J., Madden, N., Kumar, S. S., Li, J., et al. (2025) · Nature Communications · doi:10.1038/s41467-025-62478-3 · Cited by 61
“Notably, snRNAseq has limitations in recapitulating myeloid states compared to scRNAseq 72 .”
Disease-associated microglia in neurodegenerative diseases: Friend or foe?
Cheng, Y.-H., & Ho, M. S.-C. (2025) · PLoS Biology · doi:10.1371/journal.pbio.3003426 · Cited by 57
“Given that scRNA-seq exhibits low sensitivity for detecting DAM genes in human postmortem brains [50], complementary approaches such as spatial transcriptomics or direct manipulation using inducible genetic tools are needed to fully characterize DAM.”
Revealing cell vulnerability in Alzheimer’s disease by single-cell transcriptomics
Saura, C. A., Deprada-Fernandez, Á., Capilla-López, M. D., & Parra‐Damas, A. (2022) · Seminars in Cell and Developmental Biology · doi:10.1016/j.semcdb.2022.05.007 · Cited by 48
Multi-omic insights into Parkinson's Disease: From genetic associations to functional mechanisms
Schilder, B. M., Navarro, E., & Raj, T. (2021) · Neurobiology of Disease · doi:10.1016/j.nbd.2021.105580 · Cited by 45
Single cell transcriptomes and multiscale networks from persons with and without Alzheimer’s disease
Wang, Q., Antone, J., Alsop, E. B., Reiman, R. A., Funk, C. C., Bendl, J. M., Dudley, J. T., Liang, W. S., Karr, T. L., Roussos, P., et al. (2024) · Nature Communications · doi:10.1038/s41467-024-49790-0 · Cited by 44
Extraction of nuclei from archived postmortem tissues for single-nucleus sequencing applications
Maitra, M., Nagy, C., Chawla, A., Wang, Y. C., Nascimento, C., Suderman, M., Théroux, J.-F., Mechawar, N., Ragoussis, J., & Turecki, G. (2021) · Nature Protocols · doi:10.1038/s41596-021-00514-4 · Cited by 42
Takata, K., Ginhoux, F., & Shimohama, S. (2021) · Biochemical Pharmacology · doi:10.1016/j.bcp.2021.114754 · Cited by 40
Pluvinage, J. V., Sun, J., Claes, C., Flynn, R. A., Haney, M. S., Iram, T., Meng, X., Lindemann, R. C., Riley, N. M., Danhash, E., et al. (2021) · Science Translational Medicine · doi:10.1126/scitranslmed.abg2919 · Cited by 40
Kim, K., Park, S.-E., Park, J.-S., & Choi, J. (2022) · Current Opinion in Lipidology · doi:10.1097/mol.0000000000000842 · Cited by 39
Multi-cellular communities are perturbed in the aging human brain and Alzheimer’s disease
Cain, A., Taga, M., McCabe, C., Green, G., Hekselman, I., White, C. C., Lee, D. I., Gaur, P., Rozenblatt-Rosen, O., Zhang, F., et al. (2020) · doi:10.1101/2020.12.22.424084 · Cited by 143
Associations of cortical SPP1 and ITGAX with cognition and common neuropathologies in older adults
Lopes, K. D. P., Yu, L., Shen, X., Qiu, Y., Tasaki, S., Iatrou, A., Beeri, M. S., Seyfried, N. T., Menon, V., Wang, Y., et al. (2023) · Alzheimer s & Dementia · doi:10.1002/alz.13474 · Cited by 37
Single cell genomics as a transformative approach for aquaculture research and innovation
Daniels, R. R., Taylor, R. S., Robledo, D., & Macqueen, D. J. (2023) · Reviews in Aquaculture · doi:10.1111/raq.12806 · Cited by 37
“This approach has been used with success in mammalian kidney, 145 brain 124 and solid tumour 146 samples, and will presumably greatly reduce dissociation induced artefacts in ectothermic species.”
BackgroundMethodMicroglial heterogeneity in chronic pain
Sideris-Lampretsas, G., & Malcangio, M. (2021) · Brain Behavior and Immunity · doi:10.1016/j.bbi.2021.06.005 · Cited by 40
Gao, C., Shen, X., Tan, Y., & Chen, S. (2022) · Journal of Neuroinflammation · doi:10.1186/s12974-022-02580-1 · Cited by 48
“The reasons for the discrepancies between human and mouse microglia profiles have been recently discussed elsewhere, including both biological and technical reasons [102, 109].”
BackgroundThe dense-core plaques of Alzheimer’s disease are granulomas
Lemke, G., & Huang, Y. (2022) · Journal of Experimental Medicine · doi:10.1084/jem.20212477 · Cited by 37
“AD has been questioned (Thrupp et al., 2020), we nonetheless Figure 3.”
BackgroundEpigenetic control of microglial immune responses
Scholz, R., Brösamle, D., Yuan, X., Beyer, M., & Neher, J. J. (2024) · Immunological Reviews · doi:10.1111/imr.13317 · Cited by 39
“121 Next, we asked whether our pilot multimodal data could corroborate some of the findings from the literature.”
Zhang, H., Yang, S., Lu, Y., Zhou, L., Dong, M., Chu, Y., Pang, X., Chen, L., Xu, L., Zhang, L., et al. (2024) · Redox Biology · doi:10.1016/j.redox.2024.103473 · Cited by 38
Targeting synaptic plasticity in schizophrenia: insights from genomic studies
Mould, A. W., Hall, N., Milošević, I., & Tunbridge, E. M. (2021) · Trends in Molecular Medicine · doi:10.1016/j.molmed.2021.07.014 · Cited by 34
Liu, Y., Tan, Y., Zhang, Z., Li, H., Yi, M., Zhang, Z., Hui, S., & Peng, W. (2022) · Ageing Research Reviews · doi:10.1016/j.arr.2022.101831 · Cited by 34
Takahashi, H., Bhagwagar, S. Z., Nies, S. H., Ye, H., Han, X., Chiasseu, M., Wang, G., Mackenzie, I. R., & Strittmatter, S. M. (2024) · Nature Communications · doi:10.1038/s41467-024-45692-3 · Cited by 32
“The less prominent transcriptomic changes for these pathways in our snRNA-seq may relate to the signi fi cant pools of RNA outside the nucleus being discarded during nuclei isolation, similar to a recent study on a different topic 87 .”
Brain aging and rejuvenation at single-cell resolution
Sun, E., Nagvekar, R., Pogson, A. N., & Brunet, A. (2025) · Neuron · doi:10.1016/j.neuron.2024.12.007 · Cited by 35
Schneeberger, S., Kim, S. J., Geesdorf, M., Friebel, E., Eede, P., Jendrach, M., Boltengagen, A., Braeuning, C., Ruhwedel, T., Hülsmeier, A. J., et al. (2025) · Nature Aging · doi:10.1038/s43587-025-00816-2 · Cited by 33
Gillispie, G. J., Sah, E., Krishnamurthy, S., Ahmidouch, M. Y., Zhang, B., & Orr, M. E. (2021) · Life · doi:10.3390/life11020153 · Cited by 31
“Single-cell RNA sequencing has recently been used identify a more broadly defined activation response microglia (ARM)/disease-associated microglia (DAM) to examine specific microglial activation gene signatures including APOE, CST3, and CD74 [188].”
MethodSantiago, C. P., Gimmen, M. Y., Lu, Y., McNally, M. M., Duncan, L. H., Creamer, T. J., Orzolek, L. D., Blackshaw, S., & Singh, M. S. (2023) · Ophthalmology Science · doi:10.1016/j.xops.2023.100335 · Cited by 28
Liver exerkine reverses aging- and Alzheimer’s-related memory loss via vasculature
Bieri, G., Pratt, K. J. B., Fuseya, Y., Aghayev, T., Sucharov, J., Horowitz, A. M., Philp, A. R., Fonseca-Valencia, K., Chu, R., Phan, M., et al. (2026) · Cell · doi:10.1016/j.cell.2026.01.024 · Cited by 35
Metadata
- Authors
- Thrupp, N., Sala Frigerio, C., Wolfs, L., Skene, N. G., Fattorelli, N., Poovathingal, S., Fourne, Y., Matthews, P. M., Theys, T., Mancuso, R., de Strooper, B., & Fiers, M.
- Affiliations
- Vlaams Instituut voor Biotechnologie (BE)
- UK Dementia Research Institute (GB)
- KU Leuven (BE)
- University of London (GB)
- Corresponding author
- Fiers, Mark
- ORCID
- Venue
- Cell Reports
- Publisher
- Elsevier BV
- Published
- 2020-09
- Volume
- 32
- Issue
- 13
- Pages
- 108189
- ISSN
- 2211-1247 (ISSN-L)
- PMC
- PMC7527779
- OpenAlex
- W3091491962
- Cited by
- 329
- References
- 50
- Citations by year
- 2026: 40 · 2025: 70 · 2024: 48 · 2023: 57 · 2022: 54 · 2021: 57 · 2020: 2
- FWCI
- 12.36
- Type
- journal article
- Language
- en
- Open access
- gold
- doi.org
- Licence
- Locations
- Cell Reports (publishedVersion, cc-by-nc-nd)
- PubMed (publishedVersion)
- Lirias (KU Leuven) (submittedVersion, other-oa)
- PubMed Central (submittedVersion, cc-by-nc-nd)
- UCL Discovery (University College London) (submittedVersion)
- Spiral (Imperial College London) (submittedVersion, cc-by-nc-nd)
- Funders
- Fonds Wetenschappelijk Onderzoek
- Roche
- KU Leuven
- Biogen
- Vlaams Instituut voor Biotechnologie
- European Resuscitation Council (834682)
- Alzheimer's Association
- Vlaamse regering
- Alzheimer Society
- NIHR Imperial Biomedical Research Centre
- European Commission
- Novartis
- UK Dementia Research Institute (FWO 1830717N)
- GlaxoSmithKline
- Topics
- Life Sciences › Biochemistry, Genetics and Molecular Biology › Molecular Biology › Single-cell and spatial transcriptomics
- Life Sciences › Neuroscience › Neurology › Neuroinflammation and Neurodegeneration Mechanisms
- Life Sciences › Biochemistry, Genetics and Molecular Biology › Biophysics › Cell Image Analysis Techniques
- Keywords
- single-nucleus RNA sequencing, microglial activation, human microglia, apolipoprotein E, CST3, osteopontin, CD74, Alzheimer's disease
- MeSH terms
- Humans, Sequence Analysis, RNA, Microglia, Gene Expression Profiling, Single-Cell Analysis
About these checks
Registry, retraction, Cites and statistics results are computed, not judged, with one exception: a printed reference that no index lists is read once by a model before it counts as a citation error. Claims are extracted by a model and kept only when their quote appears verbatim in the text; each cited source is then checked, with a model’s help, for whether it says what the claim relies on. Those verdicts can be wrong — read the claim’s quote and the cited source before relying on one.
A language model drew the claims from the paper on 2026-10-13, under version 3 of the claim definition (model deepseek-v4.1-flash, prompt extract-v3).
A second model labelled each claim on 2026-10-13 (model jev-1.13-20260917, definition revision gold-guideline-v0.2).
Cited sources are checked with a language model’s help (gpt-6-sol).
Statistics and arithmetic are recomputed, not judged.
Confidence bands are shown only for fields calibrated on our annotated test set. None is calibrated yet, so no band is shown.
What counts as a claim ›How we measure confidence ›How we check this ›
Are you an author, or do you see a problem with this page? Request a review
