

The DOI matches its Crossref record; 88 of the 92 references it cites were found in a registry or an index; 1 of the 53 sources its claims cite were checked for support.
NOX4 promotes ferroptosis of astrocytes by oxidative stress-induced lipid peroxidation via the impairment of mitochondrial metabolism in Alzheimer’s diseases
Open accessAbstract
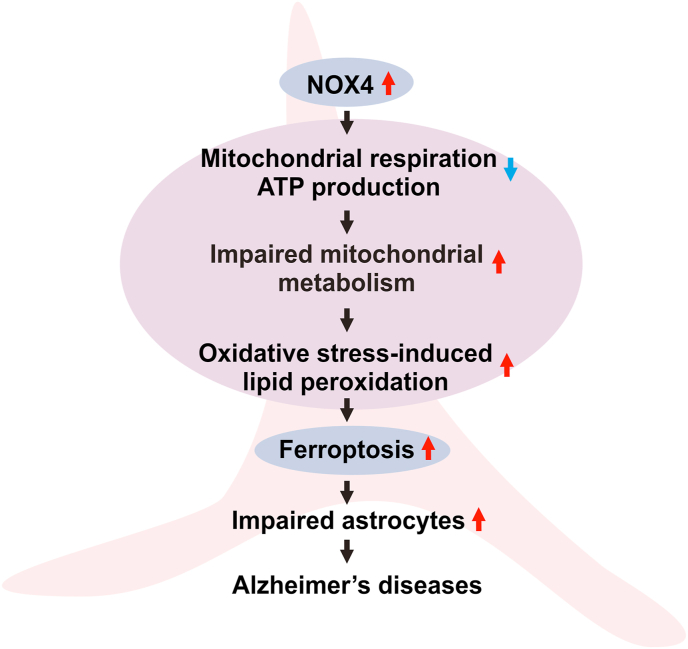
Oxidative stress has been implicated in the pathogenesis of Alzheimer's disease (AD). Mitochondrial dysfunction is linked to oxidative stress and reactive oxygen species (ROS) in neurotoxicity during AD. Impaired mitochondrial metabolism has been associated with mitochondrial dysfunction in brain damage of AD. While the role of NADPH oxidase 4 (NOX4), a major source of ROS, has been identified in brain damage, the mechanism by which NOX4 regulates ferroptosis of astrocytes in AD remains unclear. Here, we show that the protein levels of NOX4 were significantly elevated in impaired astrocytes of cerebral cortex from patients with AD and APP/PS1 double-transgenic mouse model of AD. The levels of 4-hydroxynonenal (4-HNE) and malondialdehyde (MDA), a marker of oxidative stress-induced lipid peroxidation, were significantly also elevated in impaired astrocytes of patients with AD and mouse AD. We demonstrate that the over-expression of NOX4 significantly increases the impairment of mitochondrial metabolism by inhibition of mitochondrial respiration and ATP production via the reduction of five protein complexes in the mitochondrial ETC in human astrocytes. Moreover, the elevation of NOX4 induces oxidative stress by mitochondrial ROS (mtROS) production, mitochondrial fragmentation, and inhibition of cellular antioxidant process in human astrocytes. Furthermore, the elevation of NOX4 increased ferroptosis-dependent cytotoxicity by the activation of oxidative stress-induced lipid peroxidation in human astrocytes. These results suggest that NOX4 promotes ferroptosis of astrocytes by oxidative stress-induced lipid peroxidation via the impairment of mitochondrial metabolism in AD.
Overview
AI snapshot
Written from the paper’s full text.
TL;DR
NOX4 protein is elevated in impaired astrocytes in AD patient cortex and APP/PS1 mouse cortex, where lipid peroxidation markers 4-HNE and MDA are also increased. In human astrocytes, NOX4 overexpression impairs mitochondrial metabolism, induces oxidative stress and antioxidant suppression, and promotes ferroptosis-like lipid peroxidation and cytotoxicity.
Key findings
- NOX4 levels were significantly elevated in GFAP-positive impaired astrocytes in AD cortex versus non-AD cortex (n = 3 per group, n = 10 images per subject; p < 0.01) and in APP/PS1 mouse cortex versus WT (n = 5 per group, n = 10 images per subject; p < 0.01).
- Oxidative stress-induced lipid peroxidation markers 4-HNE and MDA were significantly elevated in impaired astrocytes of AD patients and APP/PS1 mice, and 4-HNE co-localized with NOX4-positive astrocytes (p < 0.01).
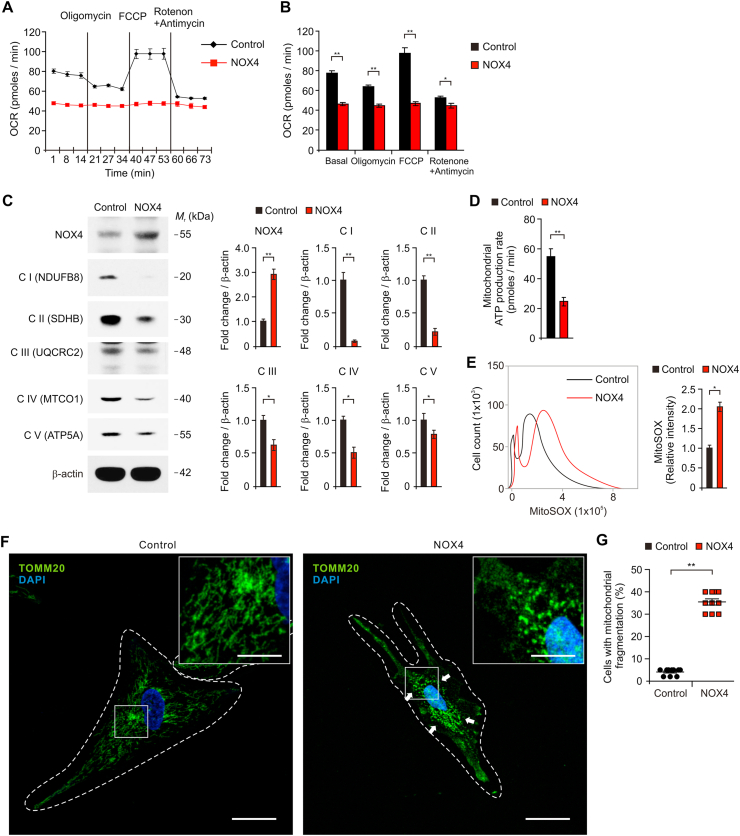
- In human astrocytes, NOX4 overexpression significantly suppressed basal and oligomycin/FCCP-responsive oxygen consumption rate, reduced mitochondrial ATP production, and reduced protein levels of all five mitochondrial ETC complexes: Complex I NDUFB8, Complex II SDHB, Complex III UQCRC2, Complex IV MTCO1, and Complex V ATP5F1A (p < 0.05 or p < 0.01).
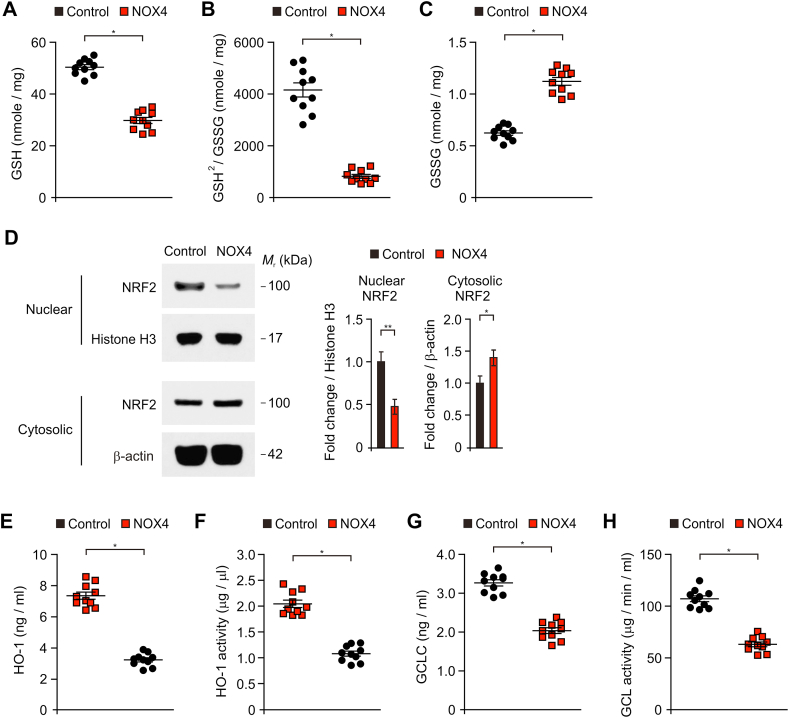
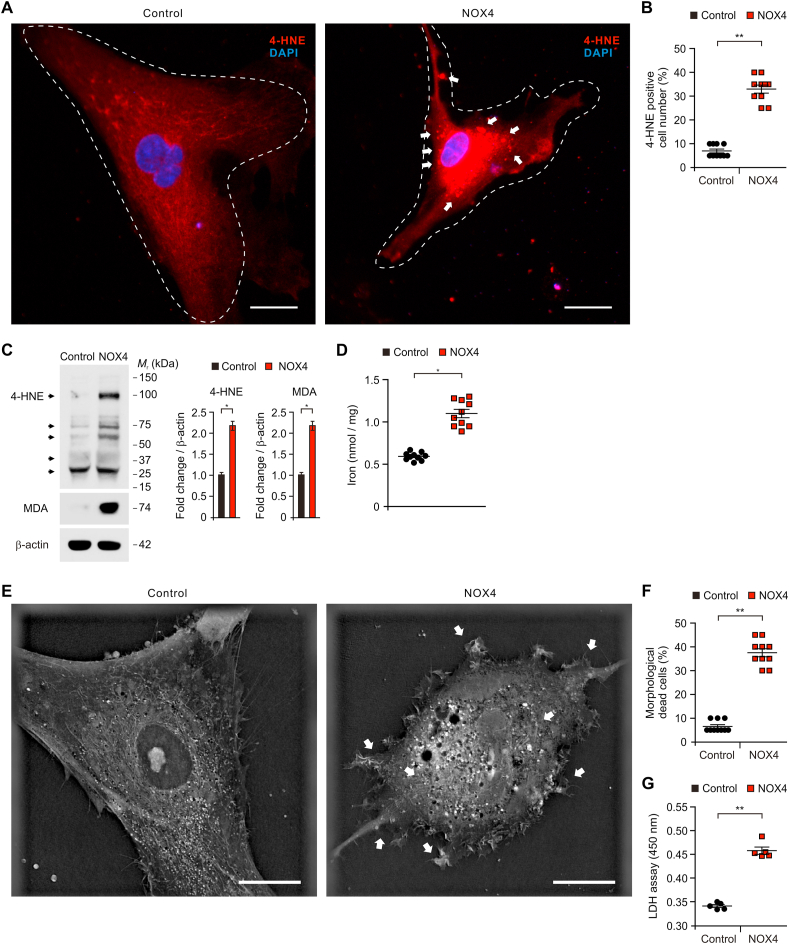
- NOX4 overexpression increased mtROS and mitochondrial fragmentation, reduced GSH and GSH/GSSG, increased GSSG, inhibited NRF2 nuclear translocation and HO-1/GCL, and increased 4-HNE, MDA, iron accumulation, morphological cell death, and LDH cytotoxicity (p < 0.05 or p < 0.01).
Methods
- Postmortem human brain tissues: 12 paraffin-embedded tissues from 3 AD donors (frontal, occipital, temporal, parietal cortex) and 4 normal adult brain tissues from 4 donors; immunofluorescence analyzed NOX4, 4-HNE, MDA, GFAP, and Tomm20. APP/PS1 double-transgenic mice were compared with WT mice.
- Human astrocytes were transduced with pCMV6-AC-GFP-NOX4 or vector. Assays included Seahorse XF96e OCR and real-time ATP rate, immunoblot for mitochondrial ETC complexes, MitoSOX flow for mtROS, GSH/GSSG and GSSG measurements, NRF2 nuclear/cytosolic fractionation, HO-1 and GCL levels/activity, iron colorimetric assay, LDH cytotoxicity, and 3D imaging.
- Statistics used Shapiro-Wilk and Levene’s tests, two-tailed Student’s t-test for two groups, and ANOVA with Dunnett’s post hoc for multiple groups; significance was p < 0.05, p < 0.01, or p < 0.001.
Limitations
- Stated: it remains unclear whether the impaired astrocytes with high NOX4 have reactive astrocyte function in AD, and further study is needed on the role of NOX4 in reactive astrocytes. The authors also state that further study is needed to identify secreted molecules from NOX4-induced ferroptosis as potential diagnostic markers.
- Evident from the text: the human sample is small (3 AD donors and 4 normal donors), and the mechanistic causality in human astrocytes relies mainly on NOX4 overexpression; the text does not report NOX4 knockdown, NOX4 inhibition, or ferroptosis-blockade rescue experiments.
- Evident from the text: APP/PS1 mouse data are descriptive immunofluorescence comparisons, without in vivo NOX4 manipulation reported.
Model-written summary. Check it against the paper before relying on it.
Integrity signals
Registry
Cites
Statistics
Figures
Verification
Claims the paper makes
58 Own result · 39 Not checked yet · 20 Own interpretation · 4 Own method · 1 Supported
A result the paper reports from its own data — it cites no other source for it, so there is none to check. The quote shows it is in the paper.
In the paper
“We demonstrate that the over-expression of NOX4 significantly increases the impairment of mitochondrial metabolism by inhibition of mitochondrial respiration and ATP production via the reduction of five protein complexes in the mitochondrial ETC in human astrocytes.”
- Also stated in: § Introduction · plain
“We found that the elevation of NOX4 promotes the impairment of mitochondrial metabolism by inhibition of mitochondrial respiration and ATP production in human astrocytes.”
§ NOX4 promotes ferroptosis of astrocytes by oxidative stress-induced lipid peroxidation via the impairment of mitochondrial metabolism in Alzheimer's diseases > Abstract
boosteddirect- Asserted: passes — The authors put it forward as true.
- Checkable: passes — It can be checked against evidence.
- Load-bearing: passes — The paper’s conclusions depend on it.
- Based: passes — The paper gives a reason why it holds.
- Also stated in: § Introduction · plain
A result the paper reports from its own data — it cites no other source for it, so there is none to check. The quote shows it is in the paper.
In the paper
“The levels of 4-hydroxynonenal (4-HNE) and malondialdehyde (MDA), a marker of oxidative stress-induced lipid peroxidation, were significantly also elevated in impaired astrocytes of patients with AD and mouse AD.”
- Also stated in: § Introduction · plain
“The levels of 4-HNE and MDA were also significantly elevated in impaired astrocytes of patients with AD and mouse AD.”
§ NOX4 promotes ferroptosis of astrocytes by oxidative stress-induced lipid peroxidation via the impairment of mitochondrial metabolism in Alzheimer's diseases > Abstract
plaincorrelational- Asserted: passes — The authors put it forward as true.
- Checkable: passes — It can be checked against evidence.
- Load-bearing: passes — The paper’s conclusions depend on it.
- Based: passes — The paper gives a reason why it holds.
- Also stated in: § Introduction · plain
A result the paper reports from its own data — it cites no other source for it, so there is none to check. The quote shows it is in the paper.
In the paper
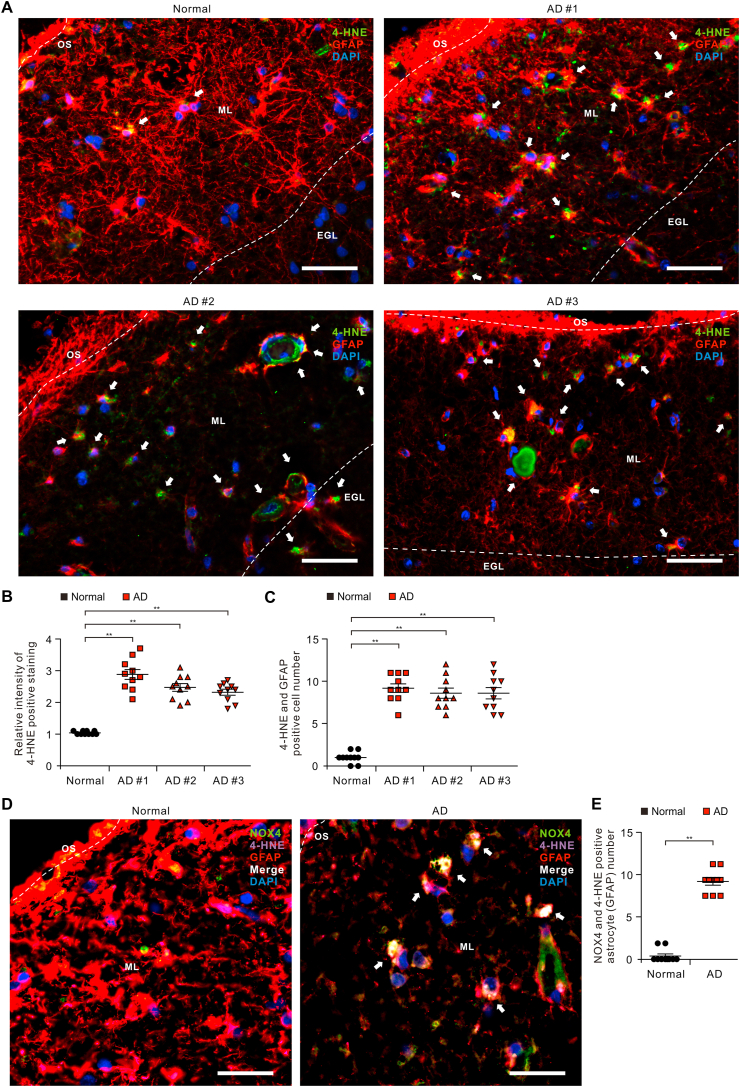
“The levels of 4-hydroxynonenal (4-HNE) and malondialdehyde (MDA), a marker of oxidative stress-induced lipid peroxidation, were significantly also elevated in impaired astrocytes of patients with AD and mouse AD.”
- Also stated in: § The levels of oxidative stress-induced lipid peroxidation are elevated in impaired astrocytes of the cortex region from patients with Alzheimer's diseases · hedged
“These results suggest that the levels of oxidative stress-induced lipid peroxidation are elevated in impaired astrocytes of patients with AD.”
- Also stated in: § The levels of oxidative stress-induced lipid peroxidation are elevated in impaired astrocytes of the cortex region from patients with Alzheimer's diseases · plain
“The levels of 4-HNE and MDA were generally higher in every individual patient with AD.”
§ NOX4 promotes ferroptosis of astrocytes by oxidative stress-induced lipid peroxidation via the impairment of mitochondrial metabolism in Alzheimer's diseases > Abstract
plaincorrelational- Asserted: passes — The authors put it forward as true.
- Checkable: passes — It can be checked against evidence.
- Load-bearing: passes — The paper’s conclusions depend on it.
- Based: passes — The paper gives a reason why it holds.
- Also stated in: § The levels of oxidative stress-induced lipid peroxidation are elevated in impaired astrocytes of the cortex region from patients with Alzheimer's diseases · hedged
A result the paper reports from its own data — it cites no other source for it, so there is none to check. The quote shows it is in the paper.
In the paper
“We demonstrate that the over-expression of NOX4 significantly increases the impairment of mitochondrial metabolism by inhibition of mitochondrial respiration and ATP production via the reduction of five protein complexes in the mitochondrial ETC in human astrocytes.”
§ NOX4 promotes ferroptosis of astrocytes by oxidative stress-induced lipid peroxidation via the impairment of mitochondrial metabolism in Alzheimer's diseases > Abstract
boosteddirect- Asserted: passes — The authors put it forward as true.
- Checkable: passes — It can be checked against evidence.
- Load-bearing: passes — The paper’s conclusions depend on it.
- Based: passes — The paper gives a reason why it holds.
A result the paper reports from its own data — it cites no other source for it, so there is none to check. The quote shows it is in the paper.
In the paper
“Moreover, the elevation of NOX4 induces oxidative stress by mitochondrial ROS (mtROS) production, mitochondrial fragmentation, and inhibition of cellular antioxidant process in human astrocytes.”
- Also stated in: § Introduction · plain
“The elevation of NOX4 induced mtROS production and mitochondrial fragmentation in human astrocytes.”
§ NOX4 promotes ferroptosis of astrocytes by oxidative stress-induced lipid peroxidation via the impairment of mitochondrial metabolism in Alzheimer's diseases > Abstract
plaindirect- Asserted: passes — The authors put it forward as true.
- Checkable: passes — It can be checked against evidence.
- Load-bearing: passes — The paper’s conclusions depend on it.
- Based: passes — The paper gives a reason why it holds.
- Also stated in: § Introduction · plain
A result the paper reports from its own data — it cites no other source for it, so there is none to check. The quote shows it is in the paper.
In the paper
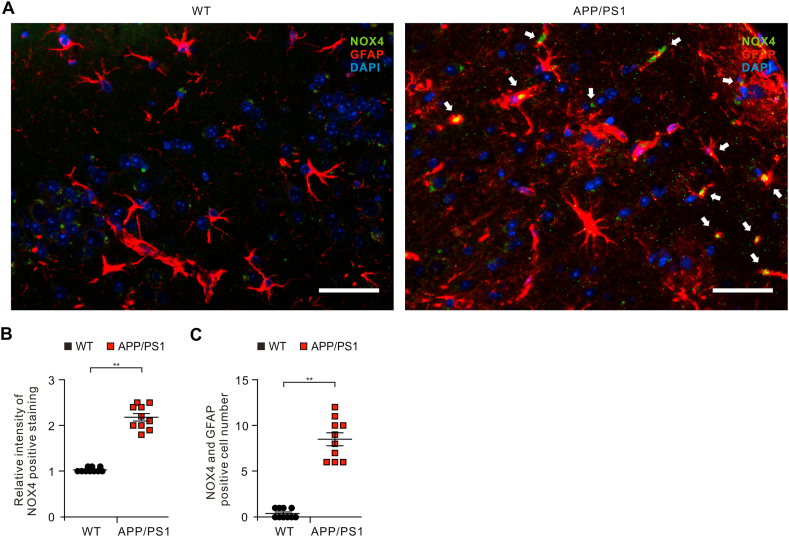
“Here, we show that the protein levels of NOX4 were significantly elevated in impaired astrocytes of cerebral cortex from patients with AD and APP/PS1 double-transgenic mouse model of AD.”
- Also stated in: § Introduction · plain
“Here, our results showed that the levels of NOX4 were significantly elevated in impaired astrocytes in patients with AD and APP/PS1 double-transgenic mouse model of AD.”
§ NOX4 promotes ferroptosis of astrocytes by oxidative stress-induced lipid peroxidation via the impairment of mitochondrial metabolism in Alzheimer's diseases > Abstract
plaincorrelational- Asserted: passes — The authors put it forward as true.
- Checkable: passes — It can be checked against evidence.
- Load-bearing: passes — The paper’s conclusions depend on it.
- Based: passes — The paper gives a reason why it holds.
- Also stated in: § Introduction · plain
A result the paper reports from its own data — it cites no other source for it, so there is none to check. The quote shows it is in the paper.
In the paper
“Moreover, the elevation of NOX4 induces oxidative stress by mitochondrial ROS (mtROS) production, mitochondrial fragmentation, and inhibition of cellular antioxidant process in human astrocytes.”
- Also stated in: § Introduction · plain
“The elevation of NOX4 induced mtROS production and mitochondrial fragmentation in human astrocytes.”
§ NOX4 promotes ferroptosis of astrocytes by oxidative stress-induced lipid peroxidation via the impairment of mitochondrial metabolism in Alzheimer's diseases > Abstract
plaindirect- Asserted: passes — The authors put it forward as true.
- Checkable: passes — It can be checked against evidence.
- Load-bearing: passes — The paper’s conclusions depend on it.
- Based: passes — The paper gives a reason why it holds.
- Also stated in: § Introduction · plain
A result the paper reports from its own data — it cites no other source for it, so there is none to check. The quote shows it is in the paper.
In the paper
“Furthermore, the elevation of NOX4 increased ferroptosis-dependent cytotoxicity by the activation of oxidative stress-induced lipid peroxidation in human astrocytes.”
- Also stated in: § Introduction · plain
“Notably, the elevation of NOX4 induced ferroptosis-dependent cytotoxicity by the activation of lipid peroxidation in human astrocytes.”
§ NOX4 promotes ferroptosis of astrocytes by oxidative stress-induced lipid peroxidation via the impairment of mitochondrial metabolism in Alzheimer's diseases > Abstract
plaindirect- Asserted: passes — The authors put it forward as true.
- Checkable: passes — It can be checked against evidence.
- Load-bearing: passes — The paper’s conclusions depend on it.
- Based: passes — The paper gives a reason why it holds.
- Also stated in: § Introduction · plain
A result the paper reports from its own data — it cites no other source for it, so there is none to check. The quote shows it is in the paper.
In the paper
“The levels of 4-hydroxynonenal (4-HNE) and malondialdehyde (MDA), a marker of oxidative stress-induced lipid peroxidation, were significantly also elevated in impaired astrocytes of patients with AD and mouse AD.”
- Also stated in: § Introduction · plain
“The levels of 4-HNE and MDA were also significantly elevated in impaired astrocytes of patients with AD and mouse AD.”
§ NOX4 promotes ferroptosis of astrocytes by oxidative stress-induced lipid peroxidation via the impairment of mitochondrial metabolism in Alzheimer's diseases > Abstract
plaincorrelational- Asserted: passes — The authors put it forward as true.
- Checkable: passes — It can be checked against evidence.
- Load-bearing: passes — The paper’s conclusions depend on it.
- Based: passes — The paper gives a reason why it holds.
- Also stated in: § Introduction · plain
A result the paper reports from its own data — it cites no other source for it, so there is none to check. The quote shows it is in the paper.
In the paper
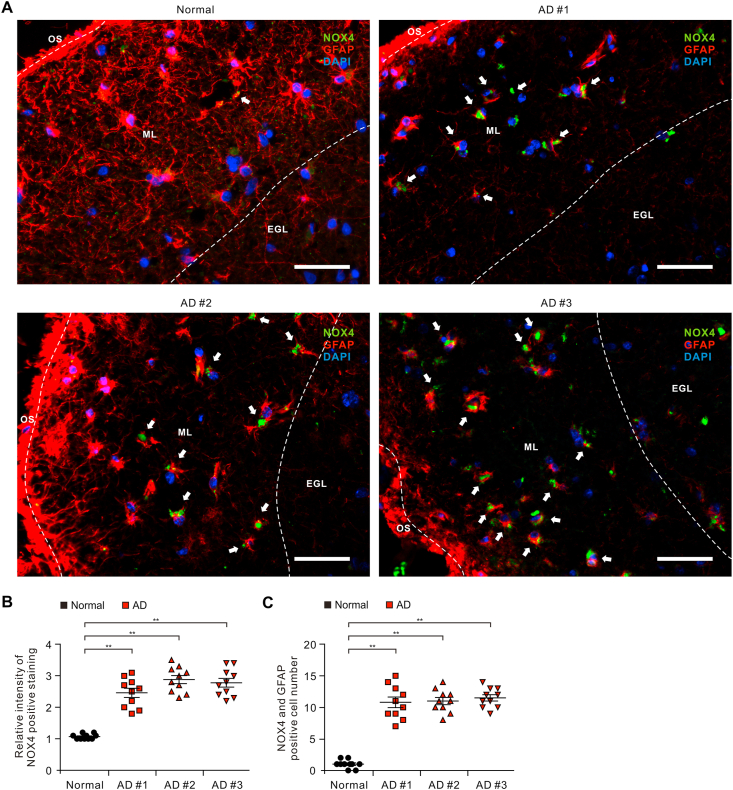
“Notably, the number of impaired astrocytes which have the positive subcellular co-localization between NOX4 and GFAP was significantly increased in patients with AD (AD) (Fig. 1C).”
§ NOX4 promotes ferroptosis of astrocytes by oxidative stress-induced lipid peroxidation via the impairment of mitochondrial metabolism in Alzheimer's diseases > Results > The levels of NOX4 are elevated in impaired astrocytes of the cortex region from patients with Alzheimer's diseases
plaincorrelational- Asserted: passes — The authors put it forward as true.
- Checkable: passes — It can be checked against evidence.
- Load-bearing: passes — The paper’s conclusions depend on it.
- Based: passes — The paper gives a reason why it holds.
- Probably not a substantial claim. 35
- It may state two separate claims as one. 5
Every source the paper cites for this claim was checked and supports it.
In the paper
“Similarly, a recent study has suggested that NOX4 in pericytes is the major source of ROS which is involved in the constriction of capillaries early in the response to Aβ [48].”
§ NOX4 promotes ferroptosis of astrocytes by oxidative stress-induced lipid peroxidation via the impairment of mitochondrial metabolism in Alzheimer's diseases > Discussion
What the sources say
- Supportedcites [48] Nortley, 2019, Amyloid β oligomers constrict human capillaries in Alzheimer's disease via signaling to pericytes, Science source
The section “Reactive oxygen species and endothelin-1 generate the capillary constriction” explicitly says the data suggest that NOX4 in pericytes is the main generator of ROS involved in capillary constriction early in the response to Aβ. The citing sentence preserves that tentative wording. (LLM, conf=0.95)
hedgeddirect- Asserted: passes — The authors put it forward as true.
- Checkable: passes — It can be checked against evidence.
- Load-bearing: fails — The paper’s conclusions may not depend on it.
- Based: passes — The paper gives a reason why it holds.
Probably not a substantial claim. The paper’s conclusions may not depend on it.
- Supported
A result the paper reports from its own data — it cites no other source for it, so there is none to check. The quote shows it is in the paper.
In the paper
“Furthermore, the length of GFAP-positive filaments was shortened and the shape of GFAP-positive filaments showed shrinkage in astrocytes of patients with AD (AD) compared to non-AD donor (Normal) (Fig. 1A).”
§ NOX4 promotes ferroptosis of astrocytes by oxidative stress-induced lipid peroxidation via the impairment of mitochondrial metabolism in Alzheimer's diseases > Results > The levels of NOX4 are elevated in impaired astrocytes of the cortex region from patients with Alzheimer's diseases
plaincorrelational- Asserted: passes — The authors put it forward as true.
- Checkable: passes — It can be checked against evidence.
- Load-bearing: unclear — It is unclear whether the paper’s conclusions depend on it.
- Based: passes — The paper gives a reason why it holds.
It may state two separate claims as one.
In the paper
“NOX4 produces ROS constitutively [37].”
§ NOX4 promotes ferroptosis of astrocytes by oxidative stress-induced lipid peroxidation via the impairment of mitochondrial metabolism in Alzheimer's diseases > Introduction
What the sources say
- Not checked yetcites [37] Serrander, 2007, NOX4 activity is determined by mRNA levels and reveals a unique pattern of ROS generation, Biochem. J. source
plaindirect- Asserted: passes — The authors put it forward as true.
- Checkable: passes — It can be checked against evidence.
- Load-bearing: passes — The paper’s conclusions depend on it.
- Based: passes — The paper gives a reason why it holds.
Probably not a substantial claim.
In the paper
“The impairment of mitochondrial ETC activity in mitochondrial metabolism leads to an increase of reactive oxygen species (ROS) production which occurs mainly at Complex I and Complex III [31].”
§ NOX4 promotes ferroptosis of astrocytes by oxidative stress-induced lipid peroxidation via the impairment of mitochondrial metabolism in Alzheimer's diseases > Introduction
What the sources say
- Not checked yetcites [31] Nemoto, 2000, Role for mitochondrial oxidants as regulators of cellular metabolism, Mol. Cell Biol. source
plaindirect- Asserted: passes — The authors put it forward as true.
- Checkable: passes — It can be checked against evidence.
- Load-bearing: fails — The paper’s conclusions may not depend on it.
- Based: passes — The paper gives a reason why it holds.
Probably not a substantial claim. The paper’s conclusions may not depend on it.
In the paper
“Among NOX isoforms, NOX4 is a major isoform in astrocytes [36].”
§ NOX4 promotes ferroptosis of astrocytes by oxidative stress-induced lipid peroxidation via the impairment of mitochondrial metabolism in Alzheimer's diseases > Introduction
What the sources say
- Not checked yetcites [36] Nayernia, 2014, New insights on NOX enzymes in the central nervous system, Antioxidants Redox Signal. source
plain- Asserted: passes — The authors put it forward as true.
- Checkable: passes — It can be checked against evidence.
- Load-bearing: passes — The paper’s conclusions depend on it.
- Based: passes — The paper gives a reason why it holds.
Probably not a substantial claim.
None of the sources cited for this claim have been checked yet.
In the paper
“The excessive production of ROS and the activation of lipid peroxidation are linked to ferroptosis-dependent cell death [32,33].”
§ NOX4 promotes ferroptosis of astrocytes by oxidative stress-induced lipid peroxidation via the impairment of mitochondrial metabolism in Alzheimer's diseases > Introduction
What the sources say
- Not checked yetcites [32] Stockwell, 2017, Ferroptosis: a regulated cell death Nexus linking metabolism, Redox Biol. Dis. Cell
- Not checked yetcites [33] Stockwell, 2020, The chemistry and biology of ferroptosis, Cell Chem Biol source
plaincorrelational- Asserted: passes — The authors put it forward as true.
- Checkable: passes — It can be checked against evidence.
- Load-bearing: passes — The paper’s conclusions depend on it.
- Based: passes — The paper gives a reason why it holds.
Probably not a substantial claim.
What the paper did — it cites no source for this, so there is none to check. The quote shows it is in the paper.
In the paper
“Data are random, independent, normally distributed, and have a common variance.”
§ NOX4 promotes ferroptosis of astrocytes by oxidative stress-induced lipid peroxidation via the impairment of mitochondrial metabolism in Alzheimer's diseases > Materials and methods > Statistical analysis
plain- Asserted: passes — The authors put it forward as true.
- Checkable: passes — It can be checked against evidence.
- Load-bearing: passes — The paper’s conclusions depend on it.
- Based: fails — The paper may give no reason why it holds.
Probably not a substantial claim. The paper may give no reason why it holds. It may state two separate claims as one.
None of the sources cited for this claim have been checked yet.
In the paper
“Loss of supportive function by impaired astrocytes has been implicated in neurodegenerative diseases via neuronal death [21,22].”
§ NOX4 promotes ferroptosis of astrocytes by oxidative stress-induced lipid peroxidation via the impairment of mitochondrial metabolism in Alzheimer's diseases > Introduction
What the sources say
- Not checked yetcites [21] Phatnani, 2015, Astrocytes in neurodegenerative disease, Cold Spring Harb Perspect Biol source
- Not checked yetcites [22] Karkkainen, 2012, Brain environment and Alzheimer's disease mutations affect the survival, migration and differentiation of neural progenitor cells, Curr. Alzheimer Res. source
plaindirect- Asserted: passes — The authors put it forward as true.
- Checkable: passes — It can be checked against evidence.
- Load-bearing: passes — The paper’s conclusions depend on it.
- Based: passes — The paper gives a reason why it holds.
Probably not a substantial claim.
In the paper
“Recent studies suggest that oxidative stress is a critical factor that contributes to the initiation and progression of AD [[2], [3], [4]].”
§ NOX4 promotes ferroptosis of astrocytes by oxidative stress-induced lipid peroxidation via the impairment of mitochondrial metabolism in Alzheimer's diseases > Introduction
What the sources say
- Not checked yetcites [[2], [3], [4]]
hedgeddirect- Asserted: passes — The authors put it forward as true.
- Checkable: passes — It can be checked against evidence.
- Load-bearing: passes — The paper’s conclusions depend on it.
- Based: passes — The paper gives a reason why it holds.
Probably not a substantial claim.
None of the sources cited for this claim have been checked yet.
In the paper
“Mitochondrial dysfunction plays an important role in the pathogenesis of AD as an early feature of AD [5,6].”
§ NOX4 promotes ferroptosis of astrocytes by oxidative stress-induced lipid peroxidation via the impairment of mitochondrial metabolism in Alzheimer's diseases > Introduction
What the sources say
- Not checked yetcites [5] Perez Ortiz, 2019, Mitochondrial dysfunction in Alzheimer's disease: role in pathogenesis and novel therapeutic opportunities, Br. J. Pharmacol. source
- Not checked yetcites [6] Wood, 2020, Mitochondrial dysfunction manifests in the early stages of Alzheimer disease, Nat. Rev. Neurol.
plaincorrelational- Asserted: passes — The authors put it forward as true.
- Checkable: passes — It can be checked against evidence.
- Load-bearing: passes — The paper’s conclusions depend on it.
- Based: passes — The paper gives a reason why it holds.
Probably not a substantial claim.
In the paper
“Recent studies have shown the impairment of mitochondrial metabolism by multiple mitochondrial alterations in major neurodegenerative diseases such as AD and Parkinson's disease (PD) [[11], [12], [13]].”
§ NOX4 promotes ferroptosis of astrocytes by oxidative stress-induced lipid peroxidation via the impairment of mitochondrial metabolism in Alzheimer's diseases > Introduction
What the sources say
- Not checked yetcites [[11], [12], [13]]
plaincorrelational- Asserted: passes — The authors put it forward as true.
- Checkable: passes — It can be checked against evidence.
- Load-bearing: fails — The paper’s conclusions may not depend on it.
- Based: passes — The paper gives a reason why it holds.
Probably not a substantial claim. The paper’s conclusions may not depend on it.
In the paper
“Mitochondrial damage has been found to be involved in lipid peroxidation and imbalance of iron homeostasis in neurodegenerative diseases such as AD and PD [34].”
§ NOX4 promotes ferroptosis of astrocytes by oxidative stress-induced lipid peroxidation via the impairment of mitochondrial metabolism in Alzheimer's diseases > Introduction
What the sources say
- Not checked yetcites [34] Conrad, 2018, Regulation of lipid peroxidation and ferroptosis in diverse species, Genes Dev. source
plaincorrelational- Asserted: passes — The authors put it forward as true.
- Checkable: passes — It can be checked against evidence.
- Load-bearing: passes — The paper’s conclusions depend on it.
- Based: passes — The paper gives a reason why it holds.
Probably not a substantial claim.
What the paper did — it cites no source for this, so there is none to check. The quote shows it is in the paper.
In the paper
“To ensure objectivity, all measurements were performed with blinded conditions by two observers per experiment under identical conditions.”
§ NOX4 promotes ferroptosis of astrocytes by oxidative stress-induced lipid peroxidation via the impairment of mitochondrial metabolism in Alzheimer's diseases > Materials and methods > Immunofluorescence analysis
plain- Asserted: passes — The authors put it forward as true.
- Checkable: passes — It can be checked against evidence.
- Load-bearing: fails — The paper’s conclusions may not depend on it.
- Based: passes — The paper gives a reason why it holds.
Probably not a substantial claim. The paper’s conclusions may not depend on it.
None of the sources cited for this claim have been checked yet.
In the paper
“NOX4 is linked to oxidative stress and ROS production in brain injury [42,43].”
§ NOX4 promotes ferroptosis of astrocytes by oxidative stress-induced lipid peroxidation via the impairment of mitochondrial metabolism in Alzheimer's diseases > Discussion
What the sources say
- Not checked yetcites [42] Casas, 2017, NOX4-dependent neuronal autotoxicity and BBB breakdown explain the superior sensitivity of the brain to ischemic damage, Proc. Natl. Acad. Sci. U. S. A. source
- Not checked yetcites [43] Ma, 2018, Deletion of NADPH oxidase 4 reduces severity of traumatic brain injury, Free Radic. Biol. Med. source
plaincorrelational- Asserted: passes — The authors put it forward as true.
- Checkable: passes — It can be checked against evidence.
- Load-bearing: passes — The paper’s conclusions depend on it.
- Based: passes — The paper gives a reason why it holds.
Probably not a substantial claim.
None of the sources cited for this claim have been checked yet.
In the paper
“Mitochondrial dysfunction has been associated with the pathogenesis of AD [5,6].”
§ NOX4 promotes ferroptosis of astrocytes by oxidative stress-induced lipid peroxidation via the impairment of mitochondrial metabolism in Alzheimer's diseases > Discussion
What the sources say
- Not checked yetcites [5] Perez Ortiz, 2019, Mitochondrial dysfunction in Alzheimer's disease: role in pathogenesis and novel therapeutic opportunities, Br. J. Pharmacol. source
- Not checked yetcites [6] Wood, 2020, Mitochondrial dysfunction manifests in the early stages of Alzheimer disease, Nat. Rev. Neurol.
plaincorrelational- Asserted: passes — The authors put it forward as true.
- Checkable: passes — It can be checked against evidence.
- Load-bearing: passes — The paper’s conclusions depend on it.
- Based: passes — The paper gives a reason why it holds.
Probably not a substantial claim.
None of the sources cited for this claim have been checked yet.
In the paper
“Oxidative stress is linked to amyloid-beta (Aβ) toxicity in AD [44,45].”
§ NOX4 promotes ferroptosis of astrocytes by oxidative stress-induced lipid peroxidation via the impairment of mitochondrial metabolism in Alzheimer's diseases > Discussion
What the sources say
plaincorrelational- Asserted: passes — The authors put it forward as true.
- Checkable: passes — It can be checked against evidence.
- Load-bearing: passes — The paper’s conclusions depend on it.
- Based: passes — The paper gives a reason why it holds.
Probably not a substantial claim.
In the paper
“The levels of cerebral blood (CBF) and cerebral metabolic rate for oxygen (CMRO2) in the medial temporal region were decreased in patient with AD [38].”
§ NOX4 promotes ferroptosis of astrocytes by oxidative stress-induced lipid peroxidation via the impairment of mitochondrial metabolism in Alzheimer's diseases > Discussion
What the sources say
- Not checked yetcites [38] Ishii, 1996, Decreased medial temporal oxygen metabolism in Alzheimer's disease shown by PET, J. Nucl. Med.
plaincorrelational- Asserted: passes — The authors put it forward as true.
- Checkable: passes — It can be checked against evidence.
- Load-bearing: fails — The paper’s conclusions may not depend on it.
- Based: passes — The paper gives a reason why it holds.
Probably not a substantial claim. The paper’s conclusions may not depend on it. It may state two separate claims as one.
In the paper
“In APP/PS1 mouse model of AD, the elevation of NOX activity is linked to cognitive impairment [47].”
§ NOX4 promotes ferroptosis of astrocytes by oxidative stress-induced lipid peroxidation via the impairment of mitochondrial metabolism in Alzheimer's diseases > Discussion
What the sources say
- Not checked yetcites [47] Bruce-Keller, 2011, Cognitive impairment in humanized APP×PS1 mice is linked to Aβ(1-42) and NOX activation, Neurobiol. Dis. source
plaincorrelational- Asserted: passes — The authors put it forward as true.
- Checkable: passes — It can be checked against evidence.
- Load-bearing: fails — The paper’s conclusions may not depend on it.
- Based: passes — The paper gives a reason why it holds.
Probably not a substantial claim. The paper’s conclusions may not depend on it.
In the paper
“Since NOX4 is a constitutively active form among the NOX isoforms, the activity of NOX4 depends on its expression [37].”
§ NOX4 promotes ferroptosis of astrocytes by oxidative stress-induced lipid peroxidation via the impairment of mitochondrial metabolism in Alzheimer's diseases > Discussion
What the sources say
- Not checked yetcites [37] Serrander, 2007, NOX4 activity is determined by mRNA levels and reveals a unique pattern of ROS generation, Biochem. J. source
plaindirect- Asserted: passes — The authors put it forward as true.
- Checkable: passes — It can be checked against evidence.
- Load-bearing: passes — The paper’s conclusions depend on it.
- Based: passes — The paper gives a reason why it holds.
It may state two separate claims as one.
In the paper
“the high levels of ceramide contribute to formation of amyloid β-peptides [[81], [82], [83]]”
§ NOX4 promotes ferroptosis of astrocytes by oxidative stress-induced lipid peroxidation via the impairment of mitochondrial metabolism in Alzheimer's diseases > Discussion
What the sources say
- Not checked yetcites [81], [82], [83]
plaindirect- Asserted: passes — The authors put it forward as true.
- Checkable: passes — It can be checked against evidence.
- Load-bearing: fails — The paper’s conclusions may not depend on it.
- Based: passes — The paper gives a reason why it holds.
Probably not a substantial claim. The paper’s conclusions may not depend on it.
None of the sources cited for this claim have been checked yet.
In the paper
“the role of lipid peroxidation has been discovered in cell dysfunction and death during neuronal degeneration [74,75]”
§ NOX4 promotes ferroptosis of astrocytes by oxidative stress-induced lipid peroxidation via the impairment of mitochondrial metabolism in Alzheimer's diseases > Discussion
What the sources say
- Not checked yetcites [74] Mattson, 1998, Modification of ion homeostasis by lipid peroxidation: roles in neuronal degeneration and adaptive plasticity, Trends Neurosci. source
- Not checked yetcites [75] Keller, 1998, Roles of lipid peroxidation in modulation of cellular signaling pathways, cell dysfunction, and death in the nervous system, Rev. Neurosci. source
plaincorrelational- Asserted: passes — The authors put it forward as true.
- Checkable: passes — It can be checked against evidence.
- Load-bearing: fails — The paper’s conclusions may not depend on it.
- Based: passes — The paper gives a reason why it holds.
Probably not a substantial claim. The paper’s conclusions may not depend on it.
In the paper
“High levels of 4-HNE found in pathological conditions or diseases which are associated with cellular stress and dysfunction, cellular damage and pro-apoptotic signaling [[68], [69], [70], [71], [72], [73]].”
§ NOX4 promotes ferroptosis of astrocytes by oxidative stress-induced lipid peroxidation via the impairment of mitochondrial metabolism in Alzheimer's diseases > Discussion
What the sources say
- Not checked yetcites [68], [69], [70]
plaincorrelational- Asserted: passes — The authors put it forward as true.
- Checkable: passes — It can be checked against evidence.
- Load-bearing: fails — The paper’s conclusions may not depend on it.
- Based: passes — The paper gives a reason why it holds.
Probably not a substantial claim. The paper’s conclusions may not depend on it.
None of the sources cited for this claim have been checked yet.
In the paper
“Ferroptosis-derived dead cells can release damage-associated molecular patterns (DAMPs) and lipid metabolites that can cause an elevation of inflammation [76,77].”
§ NOX4 promotes ferroptosis of astrocytes by oxidative stress-induced lipid peroxidation via the impairment of mitochondrial metabolism in Alzheimer's diseases > Discussion
What the sources say
plaindirect- Asserted: passes — The authors put it forward as true.
- Checkable: passes — It can be checked against evidence.
- Load-bearing: fails — The paper’s conclusions may not depend on it.
- Based: passes — The paper gives a reason why it holds.
Probably not a substantial claim. The paper’s conclusions may not depend on it.
In the paper
“Reactive aldehydes from lipid peroxidation have biological active functions [59].”
§ NOX4 promotes ferroptosis of astrocytes by oxidative stress-induced lipid peroxidation via the impairment of mitochondrial metabolism in Alzheimer's diseases > Discussion
What the sources say
- Not checked yetcites [59] Esterbauer, 1991, Chemistry and biochemistry of 4-hydroxynonenal, malonaldehyde and related aldehydes, Free Radic. Biol. Med. source
plain- Asserted: passes — The authors put it forward as true.
- Checkable: passes — It can be checked against evidence.
- Load-bearing: fails — The paper’s conclusions may not depend on it.
- Based: passes — The paper gives a reason why it holds.
Probably not a substantial claim. The paper’s conclusions may not depend on it.
In the paper
“The high production of ROS is associated with excessive intracellular lipid accumulation such as diacylglycerol (DAG) and ceramide [[78], [79], [80]].”
§ NOX4 promotes ferroptosis of astrocytes by oxidative stress-induced lipid peroxidation via the impairment of mitochondrial metabolism in Alzheimer's diseases > Discussion
What the sources say
- Not checked yetcites [78], [79], [80]
plaincorrelational- Asserted: passes — The authors put it forward as true.
- Checkable: passes — It can be checked against evidence.
- Load-bearing: fails — The paper’s conclusions may not depend on it.
- Based: passes — The paper gives a reason why it holds.
Probably not a substantial claim. The paper’s conclusions may not depend on it.
In the paper
“A previous study has shown that a product of lipid peroxidation is increased in brain of patients with AD [55].”
§ NOX4 promotes ferroptosis of astrocytes by oxidative stress-induced lipid peroxidation via the impairment of mitochondrial metabolism in Alzheimer's diseases > Discussion
What the sources say
- Not checked yetcites [55] Markesbery, 1998, Four-hydroxynonenal, a product of lipid peroxidation, is increased in the brain in Alzheimer's disease, Neurobiol. Aging source
plaincorrelational- Asserted: passes — The authors put it forward as true.
- Checkable: passes — It can be checked against evidence.
- Load-bearing: fails — The paper’s conclusions may not depend on it.
- Based: passes — The paper gives a reason why it holds.
Probably not a substantial claim. The paper’s conclusions may not depend on it.
None of the sources cited for this claim have been checked yet.
In the paper
“The role of reactive astrocytes remains unclear in terms of plaque formation, Aβ clearance and plaque growth restriction [50,51].”
§ NOX4 promotes ferroptosis of astrocytes by oxidative stress-induced lipid peroxidation via the impairment of mitochondrial metabolism in Alzheimer's diseases > Discussion
What the sources say
plain- Asserted: passes — The authors put it forward as true.
- Checkable: passes — It can be checked against evidence.
- Load-bearing: fails — The paper’s conclusions may not depend on it.
- Based: passes — The paper gives a reason why it holds.
Probably not a substantial claim. The paper’s conclusions may not depend on it.
In the paper
“Also, mitochondrial dysfunction including the excessive production of mtROS contributes to the induction of neuronal apoptosis [[84], [85], [86]].”
§ NOX4 promotes ferroptosis of astrocytes by oxidative stress-induced lipid peroxidation via the impairment of mitochondrial metabolism in Alzheimer's diseases > Discussion
What the sources say
- Not checked yetcites [84], [85], [86]
plaindirect- Asserted: passes — The authors put it forward as true.
- Checkable: passes — It can be checked against evidence.
- Load-bearing: fails — The paper’s conclusions may not depend on it.
- Based: passes — The paper gives a reason why it holds.
Probably not a substantial claim. The paper’s conclusions may not depend on it.
What the paper did — it cites no source for this, so there is none to check. The quote shows it is in the paper.
In the paper
“For immunoblots, β-actin was used as a loading control.”
- Also stated in: § NOX4-induced mitochondrial metabolic impairment induces oxidative stress by inhibition of cellular antioxidant process in human astrocytes · plain
“For immunoblots, Histone H3 (nuclear) and β-actin (cytosolic) was used as a loading control.”
- Also stated in: § NOX4 promotes ferroptosis by oxidative stress-induced lipid peroxidation in human astrocytes · plain
“For immunoblots, β-actin was used as a loading control.”
§ NOX4 promotes ferroptosis of astrocytes by oxidative stress-induced lipid peroxidation via the impairment of mitochondrial metabolism in Alzheimer's diseases > Results > The elevation of NOX4 promotes oxidative stress by impairment of mitochondrial metabolism via inhibition of mitochondrial respiration and ATP production in human astrocytes
plain- Asserted: passes — The authors put it forward as true.
- Checkable: passes — It can be checked against evidence.
- Load-bearing: fails — The paper’s conclusions may not depend on it.
- Based: passes — The paper gives a reason why it holds.
Probably not a substantial claim. The paper’s conclusions may not depend on it.
- Also stated in: § NOX4-induced mitochondrial metabolic impairment induces oxidative stress by inhibition of cellular antioxidant process in human astrocytes · plain
In the paper
“The redox imbalance and oxidative stress are linked to neurodegeneration in AD [[1], [2], [3], [4]].”
§ NOX4 promotes ferroptosis of astrocytes by oxidative stress-induced lipid peroxidation via the impairment of mitochondrial metabolism in Alzheimer's diseases > Discussion
What the sources say
- Not checked yetcites [1], [2], [3]
plaincorrelational- Asserted: passes — The authors put it forward as true.
- Checkable: passes — It can be checked against evidence.
- Load-bearing: passes — The paper’s conclusions depend on it.
- Based: passes — The paper gives a reason why it holds.
Probably not a substantial claim.
A conclusion the paper draws from its own results — it cites no other source for it, so there is none to check. The quote shows it is in the paper.
In the paper
“the accumulation of ceramide may have the effects of neurotoxicity in AD”
§ NOX4 promotes ferroptosis of astrocytes by oxidative stress-induced lipid peroxidation via the impairment of mitochondrial metabolism in Alzheimer's diseases > Discussion
hedgedconditional- Asserted: passes — The authors put it forward as true.
- Checkable: passes — It can be checked against evidence.
- Load-bearing: fails — The paper’s conclusions may not depend on it.
- Based: passes — The paper gives a reason why it holds.
Probably not a substantial claim. The paper’s conclusions may not depend on it.
What the paper did — it cites no source for this, so there is none to check. The quote shows it is in the paper.
In the paper
“Data are representative of three independent experiments.”
- Also stated in: § NOX4-induced mitochondrial metabolic impairment induces oxidative stress by inhibition of cellular antioxidant process in human astrocytes · plain
“Data are representative of three independent experiments.”
- Also stated in: § The elevation of NOX4 promotes oxidative stress by impairment of mitochondrial metabolism via inhibition of mitochondrial respiration and ATP production in human astrocytes · plain
“Data are representatives of three independent experiments.”
§ NOX4 promotes ferroptosis of astrocytes by oxidative stress-induced lipid peroxidation via the impairment of mitochondrial metabolism in Alzheimer's diseases > Results > The elevation of NOX4 promotes oxidative stress by impairment of mitochondrial metabolism via inhibition of mitochondrial respiration and ATP production in human astrocytes
plain- Asserted: passes — The authors put it forward as true.
- Checkable: passes — It can be checked against evidence.
- Load-bearing: passes — The paper’s conclusions depend on it.
- Based: passes — The paper gives a reason why it holds.
Probably not a substantial claim.
- Also stated in: § NOX4-induced mitochondrial metabolic impairment induces oxidative stress by inhibition of cellular antioxidant process in human astrocytes · plain
In the paper
“4-HNE, an electrophilic lipid peroxidation product, also has various cytotoxic effects of lipid peroxidation such as depletion of glutathione, dysfunction of structural proteins, reduction in enzyme activities, and induction of cell death [60].”
§ NOX4 promotes ferroptosis of astrocytes by oxidative stress-induced lipid peroxidation via the impairment of mitochondrial metabolism in Alzheimer's diseases > Discussion
What the sources say
- Not checked yetcites [60] Craighead, 1995
plaindirect- Asserted: passes — The authors put it forward as true.
- Checkable: passes — It can be checked against evidence.
- Load-bearing: fails — The paper’s conclusions may not depend on it.
- Based: passes — The paper gives a reason why it holds.
Probably not a substantial claim. The paper’s conclusions may not depend on it. It may state two separate claims as one.
In the paper
“Based on hormetic effects of 4-HNE, low physiological levels of 4-HNE can provide positive effects on cell function including cell proliferation and signaling pathway such as tyrosine kinase receptor (TKR) activation and downstream kinase signaling [[61], [62], [63], [64], [65], [66], [67]].”
§ NOX4 promotes ferroptosis of astrocytes by oxidative stress-induced lipid peroxidation via the impairment of mitochondrial metabolism in Alzheimer's diseases > Discussion
What the sources say
- Not checked yetcites [61], [62], [63]
plaindirect- Asserted: passes — The authors put it forward as true.
- Checkable: passes — It can be checked against evidence.
- Load-bearing: fails — The paper’s conclusions may not depend on it.
- Based: passes — The paper gives a reason why it holds.
Probably not a substantial claim. The paper’s conclusions may not depend on it.
In the paper
“In pathogenesis of neurodegenerative diseases, the high levels of 4-HNE are involved in oxidative stress of AD or Parkinson's diseases [[70], [71], [72], [73]].”
§ NOX4 promotes ferroptosis of astrocytes by oxidative stress-induced lipid peroxidation via the impairment of mitochondrial metabolism in Alzheimer's diseases > Discussion
What the sources say
- Not checked yetcites [70], [71], [72]
plaincorrelational- Asserted: passes — The authors put it forward as true.
- Checkable: passes — It can be checked against evidence.
- Load-bearing: fails — The paper’s conclusions may not depend on it.
- Based: passes — The paper gives a reason why it holds.
Probably not a substantial claim. The paper’s conclusions may not depend on it.
None of the sources cited for this claim have been checked yet.
In the paper
“The abundant diffusible products of lipid peroxidation are chemically reactive aldehydes including malondialdehyde (MDA), acrolein, 4-hydroxy-2-hexenal (4-HHE), and 4-hydroxy-2-nonenal (4-HNE) [57,58].”
§ NOX4 promotes ferroptosis of astrocytes by oxidative stress-induced lipid peroxidation via the impairment of mitochondrial metabolism in Alzheimer's diseases > Discussion
What the sources say
- Not checked yetcites [57] Schneider, 2001, Two distinct pathways of formation of 4-hydroxynonenal. Mechanisms of nonenzymatic transformation of the 9- and 13-hydroperoxides of linoleic acid to 4-hydroxyalkenals, J. Biol. Chem. source
- Not checked yetcites [58] Porter, 1995, Mechanisms of free radical oxidation of unsaturated lipids, Lipids source
plain- Asserted: passes — The authors put it forward as true.
- Checkable: passes — It can be checked against evidence.
- Load-bearing: fails — The paper’s conclusions may not depend on it.
- Based: passes — The paper gives a reason why it holds.
Probably not a substantial claim. The paper’s conclusions may not depend on it.
In the paper
“Regarding the form of astrocytes, reactive astrocytes are an activated form of astrocytes in response to toxic materials [49].”
§ NOX4 promotes ferroptosis of astrocytes by oxidative stress-induced lipid peroxidation via the impairment of mitochondrial metabolism in Alzheimer's diseases > Discussion
What the sources say
- Not checked yetcites [49] Wilhelmsson, 2006, Redefining the concept of reactive astrocytes as cells that remain within their unique domains upon reaction to injury, Proc. Natl. Acad. Sci. U. S. A. source
plaindirect- Asserted: passes — The authors put it forward as true.
- Checkable: passes — It can be checked against evidence.
- Load-bearing: fails — The paper’s conclusions may not depend on it.
- Based: passes — The paper gives a reason why it holds.
Probably not a substantial claim. The paper’s conclusions may not depend on it.
The paper relies on this without support.
The mechanisms by which NOX4 regulates ferroptosis of astrocytes by oxidative stress via impairment of mitochondrial metabolism in AD remain unclear.
“However, the mechanisms by which NOX4 regulates ferroptosis of astrocytes by oxidative stress via impairment of mitochondrial metabolism in AD remains unclear.”
The paper relies on this without support.
4-HNE is a marker for ferroptosis.
“Since the levels of 4-HNE, a marker for ferroptosis, were elevated in impaired astrocytes of patients with AD”
The paper relies on this without support.
Iron accumulation is a specific marker of ferroptosis.
“the accumulation of iron, a specific marker of ferroptosis”
The paper relies on this without support.
APP/PS1 mice model AD.
“APP/PS1 double-transgenic mouse model of AD”
The paper relies on this without support.
NRF2 is a key regulator of the cellular antioxidant response.
“nuclear factor erythroid 2–related factor 2 (NRF2) signaling pathway, a key regulator of the cellular antioxidant response”
The paper relies on this without support.
HO-1 and GCL are target genes of NRF2.
“heme oxygenase-1 (HO-1) (Fig. 6E and F) and glutamate cysteine ligase (GCL) (Fig. 6E and F) as target genes of NRF2”
The paper relies on this without support.
Mitochondrial fragmentation indicates mitochondrial impairment.
“We next analyzed morphological impairment of mitochondria caused by NOX4 over-expression through immunofluorescence staining with Tomm20”
The paper relies on this without support.
The upstream molecular target in the regulation of ferroptosis by lipid peroxidation in Alzheimer's disease remains unclear.
“the upstream molecular target in the regulation of ferroptosis by lipid peroxidation in AD remains unclear”
The paper relies on this without support.
NOX4 levels are high in the cortex of patients with Alzheimer's disease.
“the high levels of NOX4, in cortex of patients with AD”
The paper relies on this without support.
It is unclear whether impaired astrocytes in Alzheimer's disease have a function of reactive astrocytes.
“it was unclear whether these impaired astrocytes have a function of reactive astrocytes in AD”
Claims other papers make about this one
Each is checked against this paper’s own text: does it say what the citing paper says it does?
In the citing paper
“The levels of two products of oxidative damage, 4-HNE and MDA, were also significantly elevated, suggesting that the elevation of NOX4 promotes the impairment of mitochondrial metabolism, mitochondrial ROS production and fragmentation in human astrocytes [101].”
From Role of Oxidative Damage in Alzheimer’s Disease and Neurodegeneration: From Pathogenic Mechanisms to Biomarker Discovery (2021) · cites this paper as [101]
In the citing paper
“Ferroptosis-dependent cytotoxicity induced by the activation of OS has also been described in human astrocytes from AD patients [101].”
From Role of Oxidative Damage in Alzheimer’s Disease and Neurodegeneration: From Pathogenic Mechanisms to Biomarker Discovery (2021) · cites this paper as [101]
In the citing paper
“NO X4 is the astrocytes isoform, and its levels are reported significantly elevated in astrocytes of patients with AD and APP/PS1 double-transgenic mouse model of AD [101].”
From Role of Oxidative Damage in Alzheimer’s Disease and Neurodegeneration: From Pathogenic Mechanisms to Biomarker Discovery (2021) · cites this paper as [101]
Self-check
Percentages, sums and reported differences re-computed from the paper’s own numbers.
Each contradiction between two passages listed here was confirmed by an independent check.
Rated major: it would touch a result — a value a result rests on, reported and recomputed p-values on opposite sides of the significance level, two passages that conflict with no sign which is right, or a cited work retracted before this paper was published.
In the paper
§ NOX4 promotes ferroptosis of astrocytes by oxidative stress-induced lipid peroxidation via the impairment of mitochondrial metabolism in Alzheimer's diseases > Materials and methods > Human subjects study
“A total of four paraffin embedded adult normal brain tissues from four donors including frontal cortex (NBP2-77761), occipital cortex (NBP2-77766), temporal cortex (NBP2-77774) and parietal cortex (NBP2-77769) were obtained from Novus Biologicals”
§ NOX4 promotes ferroptosis of astrocytes by oxidative stress-induced lipid peroxidation via the impairment of mitochondrial metabolism in Alzheimer's diseases > Results > The levels of NOX4 are elevated in impaired astrocytes of the cortex region from patients with Alzheimer's diseases
“(B) Quantification of intensity for NOX4 positive staining in astrocytes from immunofluorescence images in the cerebral cortex region from patients with AD (AD #1, AD #2, AD #3) or non-AD (normal) (n = 3 per group, n = 10 images per individual subject).”
Rated minor: it would not touch a result — a value no result rests on, a p-value that stays on the same side of the significance level, or a conflict that is clerical, resolved elsewhere in the paper, or outside its own findings.
In the paper
§ NOX4 promotes ferroptosis of astrocytes by oxidative stress-induced lipid peroxidation via the impairment of mitochondrial metabolism in Alzheimer's diseases > Materials and methods > Reagents and antibodies
“polyclonal rabbit anti-4-HNE antibody (ab3517, Abcam, Cambridge, UK)”
§ NOX4 promotes ferroptosis of astrocytes by oxidative stress-induced lipid peroxidation via the impairment of mitochondrial metabolism in Alzheimer's diseases > Materials and methods > Immunofluorescence analysis
“polyclonal rabbit anti-4-HNE antibody (1:100) (ab46545, Abcam, Cambridge, UK)”
Rated minor: it would not touch a result — a value no result rests on, a p-value that stays on the same side of the significance level, or a conflict that is clerical, resolved elsewhere in the paper, or outside its own findings.
In the paper
§ NOX4 promotes ferroptosis of astrocytes by oxidative stress-induced lipid peroxidation via the impairment of mitochondrial metabolism in Alzheimer's diseases > Results > The elevation of NOX4 promotes oxidative stress by impairment of mitochondrial metabolism via inhibition of mitochondrial respiration and ATP production in human astrocytes
“(G) Quantification of cells with mitochondrial fragmentation from immunofluorescence images of mitochondrial morphology in control (Control) and NOX4 overexpressing (NOX4) human astrocytes (n = 10 per group).”
§ NOX4 promotes ferroptosis of astrocytes by oxidative stress-induced lipid peroxidation via the impairment of mitochondrial metabolism in Alzheimer's diseases > Results > The elevation of NOX4 promotes oxidative stress by impairment of mitochondrial metabolism via inhibition of mitochondrial respiration and ATP production in human astrocytes
“(The percent of morphological dead cells in a total of 100 cells of 10 individual images per group was calculated).”
Rated minor: it would not touch a result — a value no result rests on, a p-value that stays on the same side of the significance level, or a conflict that is clerical, resolved elsewhere in the paper, or outside its own findings.
In the paper
§ NOX4 promotes ferroptosis of astrocytes by oxidative stress-induced lipid peroxidation via the impairment of mitochondrial metabolism in Alzheimer's diseases > Results > The levels of oxidative stress-induced lipid peroxidation are elevated in impaired astrocytes of the cortex region from brains of APP/PS1 mice
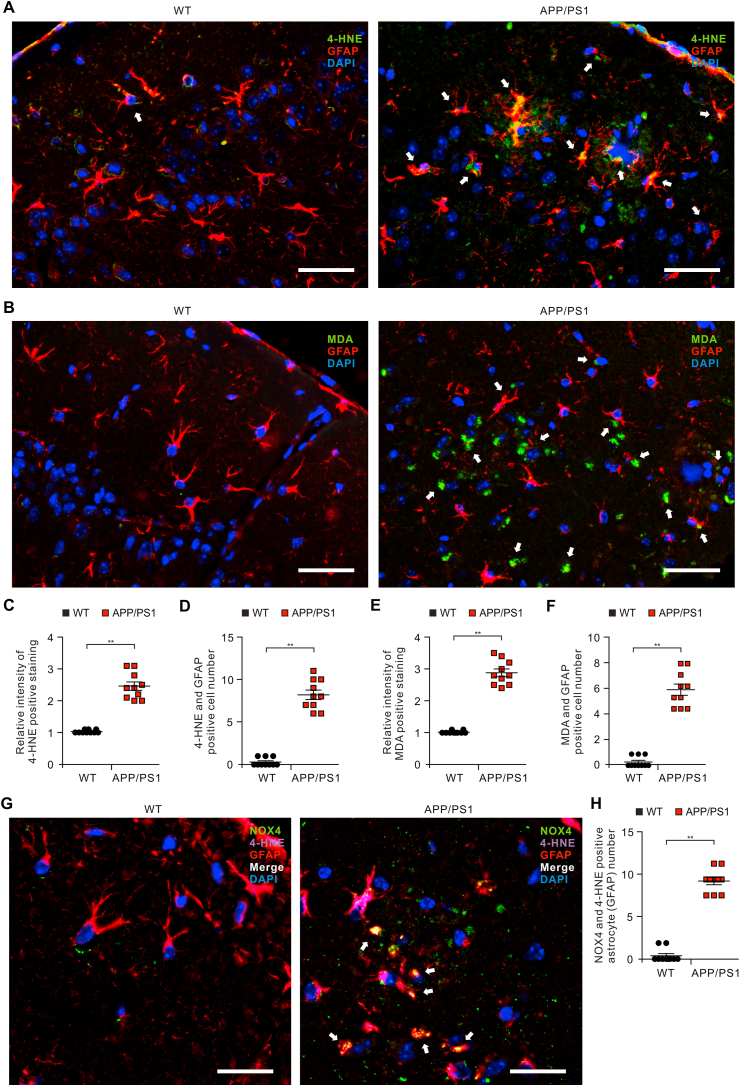
“Immunofluorescence staining revealed that the intensity of 4-HNE-positive staining in GFAP-positive astrocytes was increased of the cortex region of APP/PS1 mice compared to WT mice (Fig. 4A and C and Fig. S6).”
§ NOX4 promotes ferroptosis of astrocytes by oxidative stress-induced lipid peroxidation via the impairment of mitochondrial metabolism in Alzheimer's diseases > Results > The levels of oxidative stress-induced lipid peroxidation are elevated in impaired astrocytes of the cortex region from brains of APP/PS1 mice
“(B) Quantification of 4-HNE positive staining in astrocytes from immunofluorescence images in the cortex region from brains of APP/PS1 mice (APP/PS1) or wild-type mice (WT) (n = 5 per group, n = 10 images per individual subject). Data are mean ± standard deviation (SD). **, p < 0.01 by Student's two-tailed t-test. (C) Quantification of 4-HNE positive astrocytes”
Citations
Cites
Ferroptosis: A Regulated Cell Death Nexus Linking Metabolism, Redox Biology, and Disease
Stockwell, B. R., Friedmann Angeli, J. P., Bayir, H., Bush, A. I., Conrad, M., Dixon, S. J., Fulda, S., Gascón, S., Hatzios, S. K., Kagan, V. E., et al. (2017) · Cell · doi:10.1016/j.cell.2017.09.021 · Cited by 7,695 · cited 2×
“Ferroptosis is a type of programmed cell death that is dependent on iron and the accumulation of lipid peroxides, mainly lipid hydroperoxides, which cause damage to the lipid bilayer of the plasma membrane through accelerated oxidation of membrane lipids [32,33].”
BackgroundThe NOX Family of ROS-Generating NADPH Oxidases: Physiology and Pathophysiology
Bedard, K., & Krause, K.-H. (2007) · Physiological Reviews · doi:10.1152/physrev.00044.2005 · Cited by 6,989 · cited 3×
“In most mammals, there are seven NOX isoforms (NOX1, NOX2, NOX3, NOX4, NOX5, dual oxidase (DUOX)1, and DUOX2) [35].”
BackgroundInfluentialChemistry and biochemistry of 4-hydroxynonenal, malonaldehyde and related aldehydes
Esterbauer, H., Schaur, R. J., & Zollner, H. (1991) · Free Radical Biology and Medicine · doi:10.1016/0891-5849(91)90192-6 · Cited by 6,672
Mitochondrial Dysfunction and Oxidative Stress in Neurodegenerative Diseases
Lin, M. T., & Beal, M. F. (2006) · Nature · doi:10.1038/nature05292 · Cited by 6,455
Alzheimer's Disease: Genes, Proteins, and Therapy
Selkoe, D. J. (2001) · Physiological Reviews · doi:10.1152/physrev.2001.81.2.741 · Cited by 6,063
Oxidative Stress, Glutamate, and Neurodegenerative Disorders
Coyle, J. T., & Puttfarcken, P. (1993) · Science · doi:10.1126/science.7901908 · Cited by 3,762
Inactivation of the ferroptosis regulator Gpx4 triggers acute renal failure in mice
Friedmann Angeli, J. P., Schneider, M., Proneth, B., Tyurina, Y. Y., Tyurin, V. A., Hammond, V. J., Herbach, N., Aichler, M., Walch, A., Eggenhofer, E., et al. (2014) · Nature Cell Biology · doi:10.1038/ncb3064 · Cited by 3,732
Neurodegenerative diseases and oxidative stress
Barnham, K. J., Masters, C. L., & Bush, A. I. (2004) · Nature Reviews Drug Discovery · doi:10.1038/nrd1330 · Cited by 3,683
Ferroptosis: Death by Lipid Peroxidation
Yang, W. S., & Stockwell, B. R. (2016) · Trends in Cell Biology · doi:10.1016/j.tcb.2015.10.014 · Cited by 3,088 · cited 1×
“As the driving force of ferroptosis, a high level of lipid peroxidation can disrupt cellular function [56].”
BackgroundOxidative stress hypothesis in Alzheimer’s disease
Markesbery, W. R. (1997) · Free Radical Biology and Medicine · doi:10.1016/s0891-5849(96)00629-6 · Cited by 2,383 · cited 1×
“Oxidative stress is characterized by the over-production of reactive oxygen species (ROS), damage of the mitochondrial respiratory chain, and imbalance of Ca2+ homeostasis [9,10].”
Background
Research works printed but not linked: 1
- Stockwell, 2017, Ferroptosis: a regulated cell death Nexus linking metabolism, Redox Biol. Dis. Cell, 171, 273
Cited by
Sorted by citations
Items 201–300 of 679
Diaconescu, B. I., Dumitru, A. V., Tătaru, C. P., Toader, C., Șerban, M., Covache-Busuioc, R.-A., & Eva, L. (2025) · International Journal of Molecular Sciences · doi:10.3390/ijms262210835 · Cited by 25
“…the bioenergetics impinged but also the activation of poly-ADP ribose polymerase (PARP) uses NAD for DNA repair, whilst inhibition of the sirtuins along altered histone acetylation causes a rewiring of the transcription from the bioenergetic elements to those associated with the apoptotic [37,38].”
Khan, S., Bano, N., Ahamad, S., John, U., Dar, N. J., & Bhat, S. A. (2024) · Aging and Disease · doi:10.14336/ad.2024.0125-1 · Cited by 27
“Additionally, studies have supported the association of functionally impaired mitochondria with ROS generation, oxidative stress and neurodegeneration [57, 58].”
Lu, Q., Shao, N., Fang, Z., Ouyang, Z., Shen, Y., Yang, R., Liu, H., Cai, B., & Wei, T. (2025) · Chemico-Biological Interactions · doi:10.1016/j.cbi.2025.111459 · Cited by 25
Ferroptosis‑related long non‑coding RNAs and the roles of LASTR in stomach adenocarcinoma
Wang, G., Sun, L., Wang, S., Guo, J., Li, H., Xiao, R., Qi, W., Lv, J., Qiu, W., & Qi, W. (2022) · Molecular Medicine Reports · doi:10.3892/mmr.2022.12634 · Cited by 21
“it was previously reported that ferroptosis induced by oxidative stress is associated with various diseases, such as alzheimer's disease (28), intervertebral disc degen‐ eration (29) and cancer (30).”
BackgroundChen, S., Hu, N., Wang, H., & Li, G. (2022) · Journal of Functional Foods · doi:10.1016/j.jff.2022.105104 · Cited by 21
Hu, X., Wang, Y., Du, W., Liang, L., Wang, W., & Jin, X. (2022) · Oxidative Medicine and Cellular Longevity · doi:10.1155/2022/7762078 · Cited by 21
“Studies have shown that NOX4 is expressed in astrocytes, and its expression regulates oxidative stress in astrocytes [84, 85].”
BackgroundRetractedDepleted uranium causes renal mitochondrial dysfunction through the ETHE1/Nrf2 pathway
Liu, S., Wang, S., Zhao, Y., Li, J., Shu, C., Li, Y., Li, J., Lu, B., Xu, Z., Ran, Y., et al. (2023) · Chemico-Biological Interactions · doi:10.1016/j.cbi.2023.110356 · Cited by 20
Song, Q., Cui, Q., Wang, Y.-S., & Zhang, L.-X. (2023) · Neural Regeneration Research · doi:10.4103/1673-5374.367838 · Cited by 21
“In addition, the occurrence of lipid peroxidation leads to mitochondrial damage (Park et al., 2021) and even cell rupture (Zhang et al., 2021) in spinal cord neurons, accelerating SCI progression.”
Zhu, M., Zhang, Y., Zhang, C., Chen, L., & Kuang, Y. (2023) · Journal of Biomaterials Applications · doi:10.1177/08853282231182765 · Cited by 21
“According to reports, H2O2 can trigger the secretion of proinflammatory cytokines, such as TNF-α and IL-1β.47 In the microenvironment, the excessive accumulation of these cytokines may lead to the deterioration of nerve cell function, thereby promoting the progress of AD.48 Therefore, we evaluated the inhibitory effec…”
BackgroundInfluentialLv, J., Shi, S., Fu, Z., et al. (2024) · Phytomedicine · doi:10.1016/j.phymed.2024.155879 · Cited by 20
Castellani, S., Iaconisi, G. N., Tripaldi, F., Porcelli, V., Trapani, A., Messina, E., Guerra, L., Franco, C. D., Maruccio, G., Monteduro, A. G., et al. (2024) · Pharmaceutics · doi:10.3390/pharmaceutics16081048 · Cited by 21
“…(i.e., the imbalance between the biochemical production pathways of the reactive oxygen species (ROS) and the cellular antioxidant cascade resulting in molecular damage) and mitochondrial dysfunction play a crucial role in the pathogenesis of neurodegenerative diseases, including AD and PD [16–18].”
BackgroundTang, S., Zhang, Y., Botchway, B. O. A., Wang, X., Huang, M., & Liu, X. (2024) · Molecular Neurobiology · doi:10.1007/s12035-024-04498-6 · Cited by 23
“A study showed oxidative stress to inhibit mitochondrial respiration and ATP production by upregulating the expression of NADPH oxidase 4 (NOX4) [34].”
Feng, Y., Wang, X., Li, P., Shi, X., Prokosch, V., & Liu, H. (2025) · Biochimica et Biophysica Acta (BBA) - Molecular Basis of Disease · doi:10.1016/j.bbadis.2025.167705 · Cited by 22
The rise of astrocytes: are they guardians or troublemakers of the brain disorder?
Kim, H. Y., Kim, S., Akaydin, A. N., Kim, S. S., Hyeon, S. J., Lee, J.-H., & Ryu, H. (2026) · Experimental & Molecular Medicine · doi:10.1038/s12276-025-01627-6 · Cited by 28
“In AD models, NOX2 upregulation following A β stimulation promotes astrocyte reactivity, whereas NOX4 over-expression triggers oxidative stress-induced lipid peroxidation and mitochondrial dysfunction 94 .”
Sun, J., Xu, J., Liu, Y., et al. (2023) · Biomolecules and Biomedicine · doi:10.17305/bb.2022.8846 · Cited by 20
Liu, L., Zhang, Y., Fu, J., Ai, X., Long, D., Leng, X., Zhang, Y., Huang, B. S., Li, C., Zhou, Y., et al. (2023) · Journal of Orthopaedic Translation · doi:10.1016/j.jot.2023.05.008 · Cited by 20
Lin, L., Li, C., Zhang, L., Zhang, Y., Gao, L., Li, T., Jin, L., Shen, Y., & Ren, D. (2023) · Food & Function · doi:10.1039/d3fo01602a · Cited by 20
Chen, S., Huang, W., Tan, H., Yin, G., Chen, S., Zhao, K., Huang, Y., Zhang, Y., Li, H., & Wu, C. (2023) · The Analyst · doi:10.1039/d3an00956d · Cited by 21
Özdemir, A. Y., Hofbauerová, K., Kopecký, V., Novotný, J., & Rudajev, V. (2024) · Cellular & Molecular Biology Letters · doi:10.1186/s11658-024-00657-8 · Cited by 27
“Elevated and phosphorylated RIPK1 and MLKL were monitored in AD [36].”
The TBX1/miR‐193a‐3p/TGF‐β2 Axis Mediates CHD by Promoting Ferroptosis
Zhong, L., Yang, H., Zhu, B., Zhao, X., Xie, M., Cao, M., Liu, C., Zhao, D., Lyu, Y., Shang, W., et al. (2022) · Oxidative Medicine and Cellular Longevity · doi:10.1155/2022/5130546 · Cited by 20
“ACSL4 catalyses the conversion of polyunsaturated fatty acids of phospholipids (PUFA-PL) into lipid peroxides, and NOX4 induces an increase in reactive oxygen species levels in mitochondria [28, 31].”
Self-citationYang, N., Zhang, K., Guan, Q.-W., et al. (2022) · Antioxidants · doi:10.3390/antiox11081602 · Cited by 19
“Since OS is always a contributing factor for triggering ferroptotsis via activation of lipid peroxidation [22], it is rational to speculate that DPA regulates ferroptosis and has a therapeutic potential against neuronal injury after seizure.”
BackgroundTargeting calcium signaling in Alzheimer’s disease: challenges and promising therapeutic avenues
Song, L., Tang, Y. P., & Law, B. Y. K. (2023) · Neural Regeneration Research · doi:10.4103/1673-5374.380898 · Cited by 19
“Some antioxidant and mitochondrial-targeted drugs have shown promising efficacy in preclinical studies and are undergoing clinical trial evaluations (Park et al., 2021).”
BackgroundJiang, Y., Li, Y., Wang, Y., et al. (2024) · Biochemical Pharmacology · doi:10.1016/j.bcp.2024.116456 · Cited by 19
Transcriptomic Profile of Blood–Brain Barrier Remodeling in Cerebral Amyloid Angiopathy
Situ, M., Citalán‐Madrid, A. F., Stamatovic, S. M., Keep, R. F., & Andjelkovic, A. V. (2022) · Frontiers in Cellular Neuroscience · doi:10.3389/fncel.2022.931247 · Cited by 21
“Upregulation of Nox1, Nox 4, and Nox5 occurs during brain endothelial aging, cerebral ischemia, and in the AD brain (Lee et al., 2020; Zhang and Li, 2020; Park et al., 2021; Shen et al., 2021).”
BackgroundLipid-derived electrophiles inhibit the function of membrane channels during ferroptosis
Kessel, A. T. M. V., & Cosa, G. (2024) · Proceedings of the National Academy of Sciences · doi:10.1073/pnas.2317616121 · Cited by 21
“NOX4) play in the initiation of lipid peroxidation by hydroxyl radicals during fer-roptosis (61–63).”
Nanomedicines Targeting Ferroptosis to Treat Stress-Related Diseases
Kang, H., Meng, F., Liu, F., Xie, M., Lai, H., Li, P., & Zhang, X. (2024) · International Journal of Nanomedicine · doi:10.2147/ijn.s476948 · Cited by 20
“51 Mechanistic investigation indicated that NOX4 promoted ferroptosis of astrocytes as a result of oxidative stress-induced lipid peroxidation via mitochondrial metabolic impairment.”
BackgroundXiong, L., Hu, H., Zhu, F., Shi, H., Fan, X., Pan, S., Zhu, F., Zhang, J., Yu, Z., & Shi, Y. (2024) · International Journal of Molecular Medicine · doi:10.3892/ijmm.2024.5436 · Cited by 23
“Subsequently, NOX4 was shown to be a facilitator of ferroptosis (29).”
BackgroundFerroptosis in Alzheimer’s Disease: The Regulatory Role of Glial Cells
Xu, J., Shen, R., Qian, M., Zhou, Z., Xie, B., Jiang, Y. Q., Yu, Y., & Dong, W. (2025) · Journal of Integrative Neuroscience · doi:10.31083/jin25845 · Cited by 20
“…metabolism was impaired in APP/PS1 double transgenic mice through oxidative stress-induced lipid peroxidation, which promoted iron toxicity in astrocytes [12], NOX4 silencing alleviated mitochondrial abnormalities, decreased A β and p-Tau levels, enhanced cognition and lessened ferroptosis [184].”
The role of ferroptosis in epilepsy: mechanisms and targeted therapies
Shen, D., Zhao, Z., Ji, Y., Zhang, J., Yao, X., Qi, L., & Sun, H. (2026) · Biochemical Pharmacology · doi:10.1016/j.bcp.2026.117912 · Cited by 24
Wu, Q., Xiang, Y., Yu, W., et al. (2022) · Medicine · doi:10.1097/md.0000000000031583 · Cited by 18
“Some studies have demonstrated that NOX4 contributes to ferroptosis of astrocytes through oxidative stress-induced lipid peroxidation in Alzheimer’s disease.[47] NOX4 was upregulating through the activation of endoplasmic reticulum stress-induced activation of ATF3 thereby which led to produce hydrogen peroxide to pro…”
BackgroundEffects of Natural Products on Enzymes Involved in Ferroptosis: Regulation and Implications
Zuo, H., Huang, H., Huang, H., et al. (2023) · Molecules · doi:10.3390/molecules28237929 · Cited by 18
Anti‐skin aging effect of sea buckthorn proanthocyanidins in D‐galactose‐induced aging mice
Liu, X., Yuen, M., Yuen, T., Yuen, H., Wang, M., & Peng, Q. (2023) · Food Science & Nutrition · doi:10.1002/fsn3.3823 · Cited by 19
“MDA is a product of lipid peroxidation damage in cell membranes and an indicator of the oxidative stress response (Park et al., 2021).”
BackgroundShao, M., Qi, K., Wang, L., et al. (2024) · Cellular Signalling · doi:10.1016/j.cellsig.2024.111148 · Cited by 18
Liu, X., Wang, F.-Y., Chi, S., et al. (2024) · Brain Research · doi:10.1016/j.brainres.2024.148882 · Cited by 18
Self-citationYang, S. K., Chen, M., Meng, J., Hao, C., Xu, L., Wang, J., & Chen, J. (2024) · Environmental Research · doi:10.1016/j.envres.2024.118221 · Cited by 17
Ma, M., Jing, G., Tian, Y., Yin, R., & Zhang, M. (2024) · Molecular Neurobiology · doi:10.1007/s12035-024-04417-9 · Cited by 22
Guo, Z., Chi, R., Peng, Y., Sun, K., Liu, H., Guo, F., & Guo, J. (2024) · Biomolecules · doi:10.3390/biom14111369 · Cited by 17
The role of ALDHs in lipid peroxidation-related diseases
Wang, Y.-N., & Liu, S. (2024) · International Journal of Biological Macromolecules · doi:10.1016/j.ijbiomac.2024.138760 · Cited by 18
Liu, Y., Li, T., Niu, C., Yuan, Z., Sun, S., & Liu, D. (2025) · Molecular Medicine · doi:10.1186/s10020-024-00993-7 · Cited by 18
Treating incurable non-communicable diseases by targeting iron metabolism and ferroptosis
Ni, R., Jiang, J., Wang, F., & Min, J. (2025) · Science China Life Sciences · doi:10.1007/s11427-024-2787-y · Cited by 19
“Furthermore, ferroptosis of microglia and astrocytes have been found both in patients with AD and in APP/ Presenilin 1(PS1) double-transgenic mice, a model of AD (Park et al., 2021).”
Zheng, S., Zhao, N., Lin, X., Jiang, L., Qiu, C., Jiang, J., Shu, Z., Qian, Y., Liang, B., & Qiu, L. (2025) · Environmental Health Perspectives · doi:10.1289/ehp14447 · Cited by 19
“68,69 It has been reported that some natural antioxidants protected against ferroptosis in pubertal mice, 70,71 which suggested that such antioxidants might be able to be used as nutritive supplements to reduce the harmful e ff ects induced by exposure to PM 2 : 5 .”
Wang, M., Li, M., Jiang, Y.-K., Wang, S., Yang, X., Naseem, A., Algradi, A. M., Hao, Z., Guan, W., Chen, Q., et al. (2025) · Journal of Agricultural and Food Chemistry · doi:10.1021/acs.jafc.4c10497 · Cited by 18
Liu, Y., Xin, L., Wang, S., Tan, J., Zhu, X., Chen, X., Song, J., Chen, T., & Zhai, Q. (2025) · Biomaterials · doi:10.1016/j.biomaterials.2025.123468 · Cited by 18
Ji, J., Li, S., Jiang, Z., Yu, J., Sun, Y., Cai, Z., Dong, Y., & Sun, X. (2022) · International Journal of Molecular Sciences · doi:10.3390/ijms231810822 · Cited by 17
Li, S., Wang, Y., Zhang, X., Xiong, X., Zhou, F., Li, X., Fan, J., Liang, X., Li, G., Peng, Y., et al. (2023) · Metabolomics · doi:10.1007/s11306-023-02023-9 · Cited by 18
Xiao, H., Wang, D., Yi, Y., et al. (2023) · Cell Death Discovery · doi:10.1038/s41420-023-01653-1 · Cited by 17
Ren, X., Wen, Y., Yuan, M., Li, C., Zhang, J., Li, S., Zhang, X., Wang, L., & Wang, S. (2024) · European Journal of Pharmacology · doi:10.1016/j.ejphar.2024.176820 · Cited by 17
The emerging role of oxygen redox in pathological progression of disorders
Li, S.-Y., Gong, X., Ndikuryayo, F., & Yang, W. (2025) · Ageing Research Reviews · doi:10.1016/j.arr.2025.102660 · Cited by 17
Ferroptosis and its implications in bone-related diseases
Wang, Z., Yan, Q., Wang, Z., Hu, Z., Wang, C., Zhang, X., Gao, X., Bai, X., Chen, X., Zhang, L., et al. (2024) · PeerJ · doi:10.7717/peerj.18626 · Cited by 23
Wu, S., He, Y., Li, J., Zhuang, H., Wang, P., He, X., Guo, Y., Li, Z., Shen, H., Liu, Y., et al. (2025) · Free Radical Biology and Medicine · doi:10.1016/j.freeradbiomed.2025.01.022 · Cited by 17
Wang, Y., Yan, C., Qi, Y., Zhao, R., Wan, Y., Lyu, Z., Li, Y., Wang, Z., Li, C., Lin, Y., et al. (2025) · Chemical Engineering Journal · doi:10.1016/j.cej.2025.161138 · Cited by 16
Zhu, Y., Dou, H., Liu, Y., Yu, P., Li, F., Wang, Y., & Xiao, M. (2022) · Oxidative Medicine and Cellular Longevity · doi:10.1155/2022/5266627 · Cited by 16
RetractedSIRT1/APE1 promotes the viability of gastric cancer cells by inhibiting p53 to suppress ferroptosis
Zhao, H., Ding, Y., & Zhang, L. (2023) · Open Medicine · doi:10.1515/med-2022-0620 · Cited by 17
“We uncovered that in GC cells with SIRT1 silencing, GSH content and GPX4 expression were diminished, while the Fe2+ content and the level of MDA, a marker of oxidative stress-induced lipid peroxidation [50], were all augmented.”
BackgroundIdentification and validation of ferroptosis-related hub genes in obstructive sleep apnea syndrome
Liu, P., Zhao, D. H., Pan, Z., Tang, W., Chen, H., & Hu, K. (2023) · Frontiers in Neurology · doi:10.3389/fneur.2023.1130378 · Cited by 16
“increasing oxidative stress-induced lipid peroxidation (51).”
Yan, C., Wang, Y., Ma, Y., Liu, H., Tang, S., Li, Y., Shi, J., Ding, S., & Lyu, Z. (2024) · Materials Today Chemistry · doi:10.1016/j.mtchem.2024.102222 · Cited by 17
McMillen, S. A., Thomas, S. P., Liang, E., Nonnecke, E. B., Slupsky, C. M., & Lönnerdal, B. L. (2022) · Nutrients · doi:10.3390/nu14030412 · Cited by 15
“No effect of treatment was observed in Nox4 or p22-phox, genes involved in NADPH oxidase, suggesting ferroptosis was not induced due to iron loading [62,65].”
BackgroundHe, Y., Guo, L., Wang, L., Li, Z., Lu, R., Wan, X., Liu, N., Yan, W., Wang, H., Zhāng, Q., et al. (2026) · Journal of Advanced Research · doi:10.1016/j.jare.2026.02.023 · Cited by 16
Xiong, F., Jiang, K., Wu, Y., Lou, C., Ding, C., Zhang, W., Zhang, X., Li, C., Zheng, H. X., & Gao, H. (2023) · Biochimica et Biophysica Acta (BBA) - Molecular Basis of Disease · doi:10.1016/j.bbadis.2023.166725 · Cited by 17
Indoxyl sulfate induces apoptotic cell death by inhibiting glycolysis in human astrocytes
Jeong, S.-H., Park, S., Choi, J.-S., Cho, N., Moon, J., & Gil, H. (2023) · Kidney Research and Clinical Practice · doi:10.23876/j.krcp.23.005 · Cited by 15
“We imaged morphological changes of astrocytes with a three-dimensional (3D) cell imaging machine (3D Explore; Nanolive) as in our previous studies [17,18].”
BackgroundMethodSelf-citationProminent and conspicuous astrocyte atrophy in human sporadic and familial Alzheimer’s disease
Rodríguez, J. J., Zallo, F., Gardenal, E., Cabot, J., & Busquets, X. (2023) · Brain Structure and Function · doi:10.1007/s00429-023-02707-x · Cited by 15
“…have to forget that this atrophy could be directly related with the oxidative stress via NADPH oxidase 4 (NOX4) impairing mitochondrial function (Park et al. 2021), affecting the morphology, functionality and metabolism, as well as glutamate and GABA production together with their dysregulation…”
BackgroundLiao, Y., Huang, J., Wang, Z., Yang, Z., Shu, Y., Gan, S., Wang, Z., & Lu, W. (2023) · CNS Neuroscience & Therapeutics · doi:10.1111/cns.14537 · Cited by 15
Li, P., He, X., Feng, E.-X., Wei, J., Tu, H., & Chen, T. (2023) · Probiotics and Antimicrobial Proteins · doi:10.1007/s12602-023-10190-3 · Cited by 16
“Liver oxidative stress-induced lipid peroxidation should lead to liver lipid metabolism disruption [41].”
Zhen, J., Wan, T., Sun, G., et al. (2023) · Heliyon · doi:10.1016/j.heliyon.2023.e23589 · Cited by 15
“Recent studies have highlighted the significant role of NOX4 in ferroptosis, a form of regulated cell death, by modulating the iron metabolism pathway through the production of ROS [15].”
BackgroundShi, B., He, E., Chang, K., Xu, G., Meng, Q., Xu, H., Chen, Z., Wang, X., Jia, M., Sun, W., et al. (2024) · Journal of Hazardous Materials · doi:10.1016/j.jhazmat.2024.133537 · Cited by 15
Gao, X., Mao, H., Zhao, L., Li, X., Liao, Y., Li, W., Li, H., & Chen, Y. (2024) · Antioxidants · doi:10.3390/antiox13060714 · Cited by 16
“In conditions such as stroke [31–33], acute kidney injury [34–36], and certain neurodegenerative diseases [37–39], ferroptosis is considered a critical factor contributing to disease initiation or progression.”
BackgroundChen, X., Guo, C.-H., Yang, Y., Wang, Z., Liang, Y., Cai, Y.-Q., Cui, X., Fan, L., & Wang, W. (2024) · Cell & Bioscience · doi:10.1186/s13578-024-01309-2 · Cited by 16
“In addition, the process of ferroptosis is accompanied by oxidative stress, which promotes each other and jointly leads to cell damage and death [52].”
BackgroundNiu, J., Wan, X., Yu, G., Jiang, S., Yi, R.-N., Wu, Y., Ouyang, S., Liang, L., Kurihara, H., Sun, W., et al. (2022) · Redox Biology · doi:10.1016/j.redox.2022.102437 · Cited by 19
“This explosive burst of phospholipid peroxidation products produces a large amount of 4-HNE [65,66], which promotes carbonylation Fig.”
BackgroundLv, L., Jia, F., Deng, M., Di, S., Chu, T., & Wang, Y. (2024) · The Science of The Total Environment · doi:10.1016/j.scitotenv.2024.172022 · Cited by 14
Wang, Z., Zhu, M., Li, Q., Cao, J., Zhong, Q., Jin, Z., Huang, Y., Lan, Q., Gao, Y., & Xiong, Z. (2024) · Molecular Medicine · doi:10.1186/s10020-024-01003-6 · Cited by 16
“MDA and NOX4 can induce lipid peroxidation via OS, which in turn exacerbates ferroptosis (Park et al. 2021).”
Wang, X., Xu, D., Chen, B., et al. (2022) · Oxidative Medicine and Cellular Longevity · doi:10.1155/2022/8619275 · Cited by 14
RetractedLuo, W., Li, Y., Xiang, C., Aizawa, T., Niu, R., Wang, Y., Zhao, J., Liu, Z., Li, C., Liu, W., et al. (2023) · Materials Today Bio · doi:10.1016/j.mtbio.2023.100888 · Cited by 15
Oxidative stress in acute pulmonary embolism: emerging roles and therapeutic implications
Yang, J., Xu, S., Xu, S., Fan, Z., Zhu, C., Yang, J., Yang, J., & Xing, X. (2024) · Thrombosis Journal · doi:10.1186/s12959-023-00577-1 · Cited by 15
Ferrostatin 1 ameliorates UVB‐induced damage of HaCaT cells by regulating ferroptosis
Teng, Y., Tang, H., Tao, X., Huang, Y., & Fan, Y. (2024) · Experimental Dermatology · doi:10.1111/exd.15018 · Cited by 15
“32 In the study, we found that UVB significantly”
BackgroundMarín-Castañeda, L. A., González-Garibay, G., Garcia-Quintana, I., Aispuro, G. P., & Rubio, C. (2024) · Frontiers in Aging Neuroscience · doi:10.3389/fnagi.2024.1494356 · Cited by 16
Chen, Y., Zhang, M., Jia, R., Qian, B., Jing, C., Caihong, Z., Zhu, D., Liu, Z., Zen, K., & Li, L. (2024) · Redox Biology · doi:10.1016/j.redox.2024.103439 · Cited by 17
Jie, H., Zhang, J., Wu, S., Yu, L., Li, S., Dong, B., & Feng, Y. (2025) · Frontiers in Pharmacology · doi:10.3389/fphar.2024.1503824 · Cited by 15
Behavioral and Neuronal Effects of Inhaled Bromine Gas: Oxidative Brain Stem Damage
Shakil, S., Juncos, J. X. M., Mariappan, N., Zafar, I., Amudhan, A., Amudhan, A., Aishah, D., Siddiqui, S., Manzoor, S., Santana, C. M., et al. (2021) · International Journal of Molecular Sciences · doi:10.3390/ijms22126316 · Cited by 14
“The significance of 4-HNE in cognitive dysfunction is underscored by the fact that patients with Alzheimer’s have elevated 4-HNE levels [35].”
BackgroundJin, R., Li, Y., Jin, H. M., Yoon, H. S., Choi, J. S., Kim, J.-H., Yoon, H. J., & Yoon, K. C. (2022) · International Journal of Molecular Sciences · doi:10.3390/ijms231911341 · Cited by 16
Self-citationWang, C., Jiang, H., Liu, H., Chen, S., Guo, H., Ma, S., Han, W., Li, Y., & Wang, D. (2023) · Food Science and Human Wellness · doi:10.1016/j.fshw.2023.02.035 · Cited by 16
Removing non-resonant background of CARS signal with generative adversarial network
Luo, Z., Xu, X., Lin, D., Qu, J., Lin, F., & Li, J. (2024) · Applied Physics Letters · doi:10.1063/5.0201616 · Cited by 13
Peng, L., Zhang, Z., Li, Q., Song, Z., Yan, C., & Ling, H. (2024) · Heliyon · doi:10.1016/j.heliyon.2024.e39217 · Cited by 18
“NADPH oxidase 4 is a major source of ROS and induces ferroptosis by impairing mitochondrial function in astrocytes [101].”
ALOX15‐Mediated Neuron Ferroptosis Was Involved in Diabetic Peripheral Neuropathic Pain
Feng, Z., Li, F., Lin, Z., Liu, J., Chen, X., Yan, W., & Liu, Z. (2025) · CNS Neuroscience & Therapeutics · doi:10.1111/cns.70440 · Cited by 14
“Since neural tissues contain high levels of PUFA, lipid peroxidation is likely a primary characteristic of ferroptosis in DPNP patients [42–44].”
Targeting ferroptosis: novel therapeutic approaches and intervention strategies for kidney diseases
Luo, Y., Long, M., Wu, X., & Zeng, L. (2025) · Frontiers in Immunology · doi:10.3389/fimmu.2025.1700004 · Cited by 18
Fang, G., Shen, Y., & Liao, D. (2023) · Cell Stress and Chaperones · doi:10.1007/s12192-023-01324-1 · Cited by 13
“Oxidative stress is characterized by the excessive production of ROS and the activation of excessive lipid peroxidation, which is precisely the cause of ferroptosis, and leads to the damage of mitochondrial respiratory chain and the imbalance of homeostasis (Park et al. 2021; Wu et al. 2018).”
BackgroundTang, Y., Gu, W., & Cheng, L. (2023) · Environmental Toxicology · doi:10.1002/tox.24035 · Cited by 13
“31 As ferroptosis is closely associated with oxidative stress, the antioxidant effects of EVO might help alleviate lipid peroxidation-triggered ferroptosis.”
BackgroundLiu, L., Wang, L., Xiao, Y., Liu, Y., Meng, X., & Shen, X. (2024) · Pharmacological Research - Modern Chinese Medicine · doi:10.1016/j.prmcm.2024.100377 · Cited by 14
Viroporins Manipulate Cellular Powerhouses and Modulate Innate Immunity
Cedillo‐Barrón, L., García‐Cordero, J., Visoso-Carvajal, G., & León‐Juárez, M. (2024) · Viruses · doi:10.3390/v16030345 · Cited by 12
“However, basal ROS levels are mediators that activate cell signaling pathways, and excessive ROS production results in cell and tissue damage because these molecules can react with proteins, lipids, and nucleic acids [82,83].”
BackgroundYe, Y., Fu, C., Li, Z., Sun, J., Li, X., Chai, S.-F., Li, S., Hou, M., Cai, H.-Y., Wang, Z., et al. (2024) · Experimental Neurology · doi:10.1016/j.expneurol.2024.114920 · Cited by 16
Ferroptosis in the neurovascular unit after spinal cord injury
Huang, Y., & Bai, J. (2024) · Experimental Neurology · doi:10.1016/j.expneurol.2024.114943 · Cited by 15
“Park et al. (2021) demonstrated that NOX4 induces ROS production by impairing mitochondrial metabolism, which exacerbates oxidative stress and consequently induces ferroptosis in astrocytes.”
Zou, H.-X., Hu, T., Zhao, J.-Y., Qiu, B., Zou, C.-C., Xu, Q., Liu, J., Lai, S., & Huang, H. (2023) · Journal of Inflammation Research · doi:10.2147/jir.s400107 · Cited by 13
cGAS/STING/NLRP3 Signaling Pathway-Mediated Pyroptosis in Hypertrophic Cardiomyopathy Radiotherapy
Li, H., Wang, X., Luo, X., Shi, H., & Li, J. (2025) · Frontiers in Bioscience-Landmark · doi:10.31083/fbl26084 · Cited by 14
“As a result, the mechanisms associated with radiosensitization primarily concentrate on promoting apoptosis, modifying cell cycle distribution, enhancing the indirect cellular effects of ROS generated by radiotherapy, and impairing the cellular capacity to repair DNA damage [19].”
Ji, F., Lee, H., Rheem, H., Liu, J., & Kim, J.-H. (2025) · Scientific Reports · doi:10.1038/s41598-025-09519-5 · Cited by 15
“Markers of lipid peroxidation, including 4-HNE and MDA, were elevated in obese mice, further substantiating the role of oxidative stress in triggering ferroptosis 45,46 .”
Self-citationMao, S., Qiao, R., Wang, Q., Shen, L., Li, D., Huo, X., Wang, J., Liu, K., Chen, W., Zhu, T., et al. (2025) · MedComm · doi:10.1002/mco2.70329 · Cited by 17
“For example, studies have revealed the contributions of astrocytes to neuroinflammation, oxidative stress, and synaptic regulation through mechanisms such as glutamate excitotoxicity and calcium signaling [2, 41, 261, 262].”
Mitophagy in Alzheimer's disease and its potential as a therapeutic target
Wei, J., Xiao, T., Lyu, J., Zhao, Y., Zhang, Y., Du, X., He, Y., Zhao, M., Yang, X., Yao, Y., et al. (2025) · Neurobiology of Disease · doi:10.1016/j.nbd.2025.107162 · Cited by 13
Zhimin, H., Zhao, D., Han, M., et al. (2022) · Oxidative Medicine and Cellular Longevity · doi:10.1155/2022/4342755 · Cited by 12
“Furthermore, the oxidative stress could directly destroy the ECs and further inhibits the expression of HIF-1α, so the suppression of oxidative stress or the activation of PI3K is the key promoter for neovascularization [19, 37, 38, 51, 54].”
BackgroundRetractedLayrolle, P., Orssaud, C., Leleu, M., Payoux, P., & Chavanas, S. (2024) · Biomedicines · doi:10.3390/biomedicines12030584 · Cited by 14
“Alcohol was shown to upregulate NADPH oxidase 4 (NOX4) in mouse alveolar macrophages [74], and NOX4 was found to impede the expression of the five ETC complexes, therefore inhibiting mitochondrial respiration and ATP production, and inducing oxidative stress in human astrocytes grown in vitro [75].”
BackgroundInvolvement of ferroptosis in eribulin-induced cytotoxicity in ovarian clear cell carcinoma
Azumi, M., Kusama, K., Yoshie, M., Nakano, S., Tsuru, A., Kato, T., & Tamura, K. (2024) · European Journal of Pharmacology · doi:10.1016/j.ejphar.2024.176544 · Cited by 13
Tan, X., He, Y., Yu, P., Deng, Y., Xie, Z., Guo, J., Hou, Q., Li, P., Lin, X., Ouyang, S., et al. (2024) · Molecular Medicine · doi:10.1186/s10020-024-00861-4 · Cited by 13
“Ferroptosis and necroptosis have been identified as potential drivers of nerve injury, ischemia–reperfusion injury, and kidney degeneration, suggesting inhibitors of these processes have huge potential as novel drug candidates (Park et al. 2021; Yuan et al. 2022; Tonnus et al. 2021).”
BackgroundWei, W., Jiang, Y. Y., Hu, G., He, Y., & Chen, H. (2024) · Journal of Alzheimer s Disease · doi:10.3233/jad-240092 · Cited by 13
“24 Inhibiting the activities of cytochrome C, pyruvate dehydrogenase and ketog-lutarate dehydrogenase 25 reduces the production of ATP and H 2 O 2 and disrupts lipid peroxidation in HT22-A (cid:2) PPswe cells 26 and the brains of AD patients, 27 and subsequently disturbs electron transport chain…”
MDH2 Promotes Hepatocellular Carcinoma Growth Through Ferroptosis Evasion via Stabilizing GPX4
Yu, W., Li, Y., Gao, C., Li, D., Chen, L., Dai, B., Yang, H., Han, L., Deng, Q., & Bian, X. (2024) · International Journal of Molecular Sciences · doi:10.3390/ijms252111604 · Cited by 13
“Excessive ROS can induce lipid peroxidation on the cell membrane, thereby triggering ferroptosis [11].”
BackgroundSelf-citation
Metadata
- Authors
- Park, M. W., Cha, H. W., Kim, J., Kim, J. H., Yang, H., Yoon, S., Boonpraman, N., Yi, S. S., Yoo, I. D., & Moon, J.-S.
- Affiliations
- Soonchunhyang University (KR)
- Soonchunhyang University Hospital Cheonan (KR)
- Corresponding author
- Yoo, Ik Dong
- Moon, Jong-Seok
- ORCID
- Venue
- Redox Biology
- Publisher
- Elsevier BV
- Published
- 2021-05
- Volume
- 41
- Pages
- 101947
- ISSN
- 2213-2317 (ISSN-L)
- PMC
- PMC8027773
- OpenAlex
- W3136661179
- Cited by
- 683
- References
- 92
- Citations by year
- 2026: 139 · 2025: 145 · 2024: 187 · 2023: 128 · 2022: 74 · 2021: 10
- FWCI
- 62.90
- Type
- journal article
- Language
- en
- Open access
- gold
- doi.org
- Licence
- Locations
- Redox Biology (publishedVersion, cc-by-nc-nd)
- PubMed Central (publishedVersion, cc-by-nc-nd)
- PubMed (publishedVersion)
- DOAJ (DOAJ: Directory of Open Access Journals) (submittedVersion, cc-by-sa)
- Funders
- Soonchunhyang University
- National Research Foundation of Korea
- Topics
- Life Sciences › Neuroscience › Cellular and Molecular Neuroscience › Alzheimer's disease research and treatments
- Life Sciences › Biochemistry, Genetics and Molecular Biology › Molecular Biology › Mitochondrial Function and Pathology
- Life Sciences › Biochemistry, Genetics and Molecular Biology › Molecular Biology › Redox biology and oxidative stress
- Keywords
- NOX4, ferroptosis, astrocytes, Alzheimer's disease, oxidative stress, lipid peroxidation, mitochondrial dysfunction, mitochondrial respiration, mitochondrial electron transport chain, mitochondrial reactive oxygen species, mitochondrial fragmentation, 4-hydroxynonenal, malondialdehyde, APP/PS1 mice, reactive oxygen species
- MeSH terms
- NADPH Oxidase 4, Ferroptosis, Alzheimer Disease, Animals, Astrocytes, Humans, Mitochondria, Lipid Peroxidation, Reactive Oxygen Species, Oxidative Stress, Mice
About these checks
Registry, retraction, Cites and statistics results are computed, not judged, with one exception: a printed reference that no index lists is read once by a model before it counts as a citation error. Claims are extracted by a model and kept only when their quote appears verbatim in the text; each cited source is then checked, with a model’s help, for whether it says what the claim relies on. Those verdicts can be wrong — read the claim’s quote and the cited source before relying on one.
A language model drew the claims from the paper on 2026-10-10, under version 3 of the claim definition (model deepseek-v4.1-flash, prompt extract-v3).
A second model labelled each claim on 2026-10-10 (model jev-1.13-20260917, definition revision gold-guideline-v0.2).
Cited sources are checked with a language model’s help (gpt-6-sol).
Statistics and arithmetic are recomputed, not judged.
Confidence bands are shown only for fields calibrated on our annotated test set. None is calibrated yet, so no band is shown.
What counts as a claim ›How we measure confidence ›How we check this ›
Are you an author, or do you see a problem with this page? Request a review
