

The DOI matches its Crossref record; 54 of the 54 references it cites were found in a registry or an index.
Human MIEF1 recruits Drp1 to mitochondrial outer membranes and promotes mitochondrial fusion rather than fission
Open accessAbstract
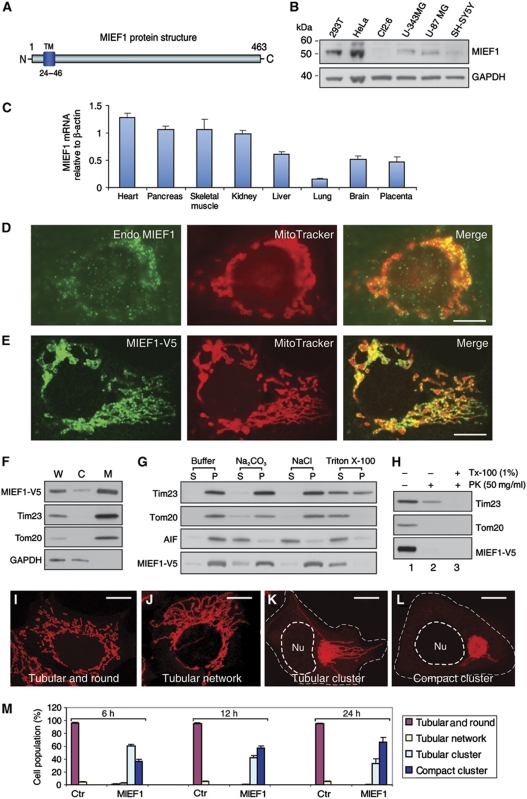
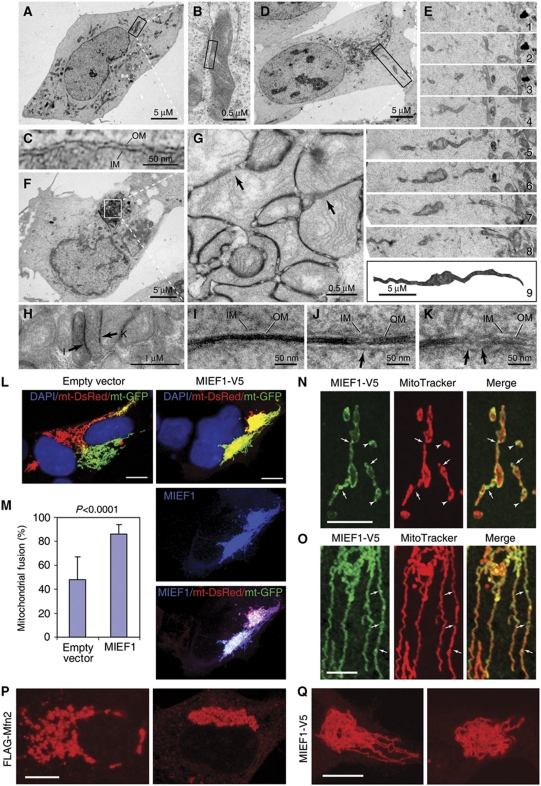
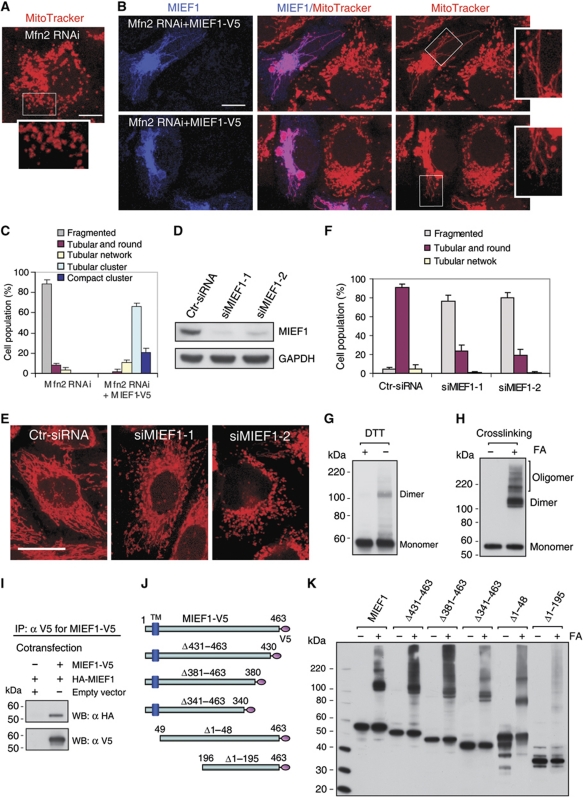
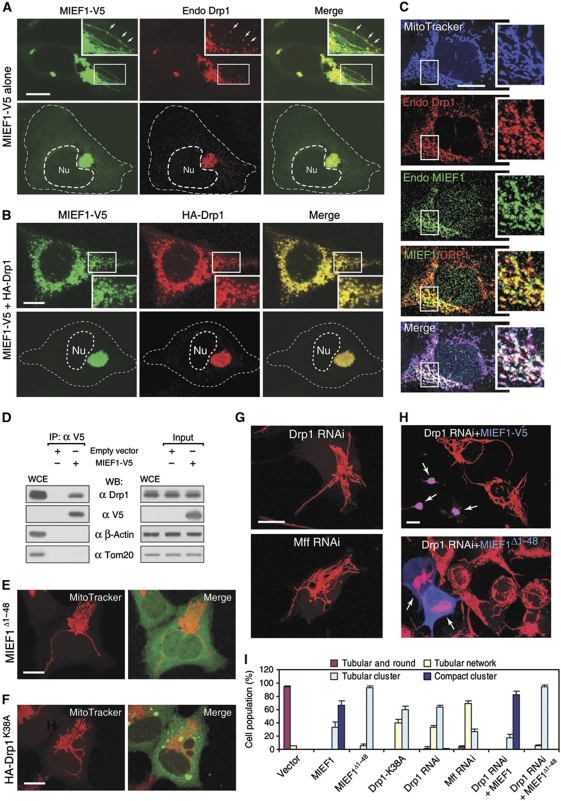
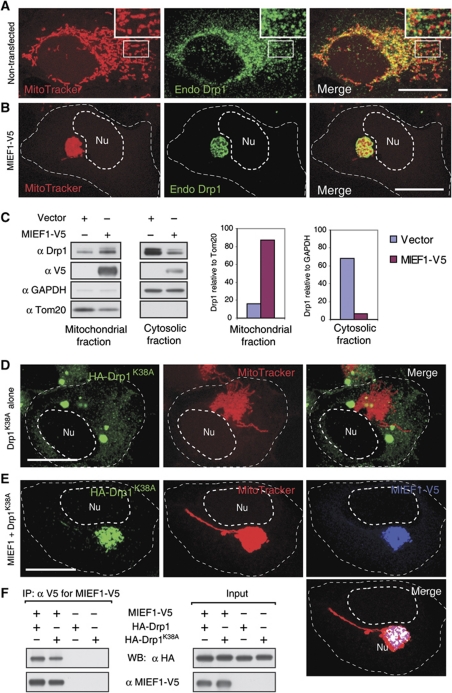
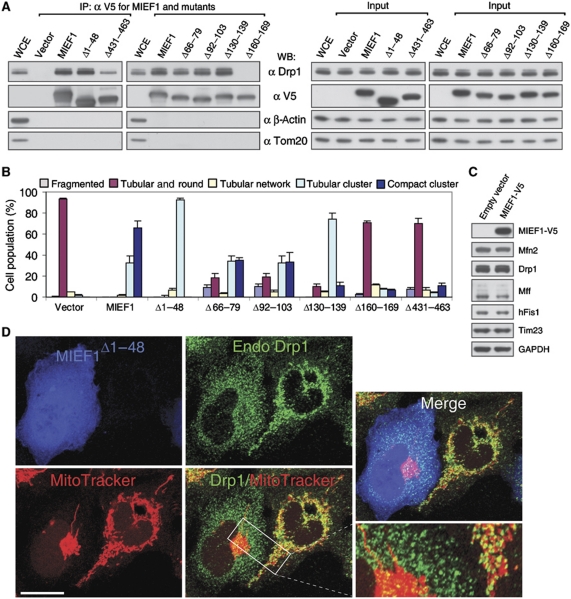
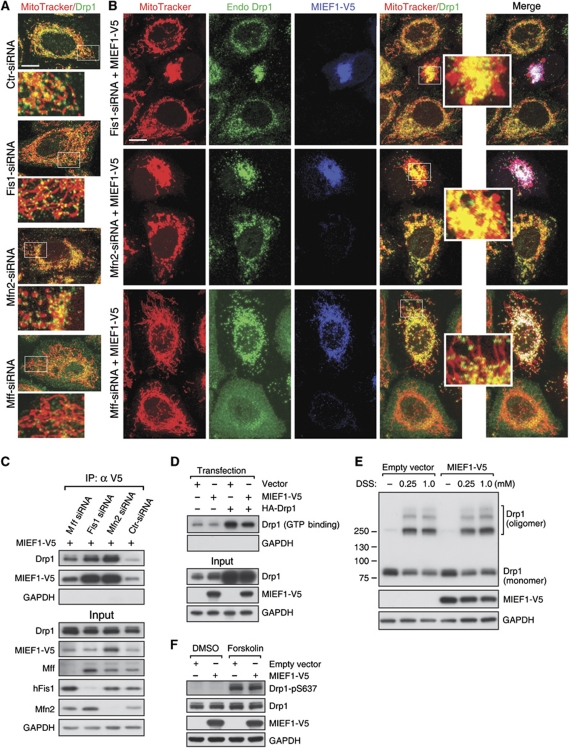
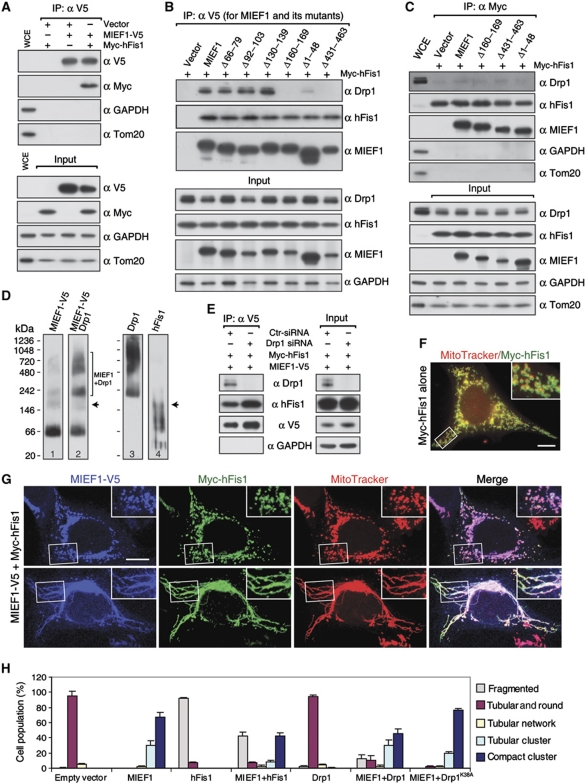
Mitochondrial morphology is controlled by two opposing processes: fusion and fission. Drp1 (dynamin-related protein 1) and hFis1 are two key players of mitochondrial fission, but how Drp1 is recruited to mitochondria and how Drp1-mediated mitochondrial fission is regulated in mammals is poorly understood. Here, we identify the vertebrate-specific protein MIEF1 (mitochondrial elongation factor 1; independently identified as MiD51), which is anchored to the outer mitochondrial membrane. Elevated MIEF1 levels induce extensive mitochondrial fusion, whereas depletion of MIEF1 causes mitochondrial fragmentation. MIEF1 interacts with and recruits Drp1 to mitochondria in a manner independent of hFis1, Mff (mitochondrial fission factor) and Mfn2 (mitofusin 2), but inhibits Drp1 activity, thus executing a negative effect on mitochondrial fission. MIEF1 also interacts with hFis1 and elevated hFis1 levels partially reverse the MIEF1-induced fusion phenotype. In addition to inhibiting Drp1, MIEF1 also actively promotes fusion, but in a manner distinct from mitofusins. In conclusion, our findings uncover a novel mechanism which controls the mitochondrial fusion-fission machinery in vertebrates. As MIEF1 is vertebrate-specific, these data also reveal important differences between yeast and vertebrates in the regulation of mitochondrial dynamics.
Overview
The claims and statistics of this paper haven’t been checked yet.
Run the check — free, no account needed. It reads the open-access text and checks the sources it cites.
Integrity signals
Registry
Cites
Statistics
Figures
Verification
Claims the paper makes
The claims and statistics of this paper haven’t been checked yet.
Run the check — free, no account needed. It reads the open-access text and checks the sources it cites.
Claims other papers make about this one
Each is checked against this paper’s own text: does it say what the citing paper says it does?
In the citing paper
“MIEF1/MiD51 and the variant MIEF2/MiD49 recruit DRP1 to mitochondria independent of MFF, but in contrast to MFF, inhibit DRP1 GTPase activity leading to mitochondrial elongation when MiD49/51 is overexpressed [92, 95, 96].”
From The connection between the dynamic remodeling of the mitochondrial network and the regulation of muscle mass (2021) · cites this paper as [95]
Self-check
Percentages, sums and reported differences re-computed from the paper’s own numbers.
The self-check needs the paper’s full text.
Citations
Cites
Site-directed mutagenesis by overlap extension using the polymerase chain reaction
Ho, S. N., Hunt, H. D., Horton, R. M., Pullen, J. K., & Pease, L. R. (1989) · Gene · doi:10.1016/0378-1119(89)90358-2 · Cited by 7,414
Mitochondrial fusion and fission in cell life and death
Westermann, B. (2010) · Nature Reviews Molecular Cell Biology · doi:10.1038/nrm3013 · Cited by 2,002
Dynamin-related Protein Drp1 Is Required for Mitochondrial Division in Mammalian Cells
Smirnova, E., Griparić, L., Shurland, D., & van der Bliek, A. M. (2001) · Molecular Biology of the Cell · doi:10.1091/mbc.12.8.2245 · Cited by 1,938
Delettre, C., Lenaers, G., Griffoin, J.-M., Gigarel, N., Lorenzo, C., Belenguer, P., Pelloquin, L., Grosgeorge, J., Turc-Carel, C., Perret, E., et al. (2000) · Nature Genetics · doi:10.1038/79936 · Cited by 1,446
Disruption of Fusion Results in Mitochondrial Heterogeneity and Dysfunction
Chen, H., Chomyn, A., & Chan, D. C. (2005) · Journal of Biological Chemistry · doi:10.1074/jbc.m503062200 · Cited by 1,376
Mitochondrial dynamics and apoptosis
Suen, D.-F., Norris, K. L., & Youle, R. J. (2008) · Genes & Development · doi:10.1101/gad.1658508 · Cited by 1,270
Otera, H., Wang, C., Cleland, M. M., Setoguchi, K., Yokota, S., Youle, R. J., & Mihara, K. (2010) · Journal of Cell Biology · doi:10.1083/jcb.201007152 · Cited by 1,110
Mitochondria in neuroplasticity and neurological disorders
Mattson, M. P., Gleichmann, M., & Cheng, A. (2008) · Neuron · doi:10.1016/j.neuron.2008.10.010 · Cited by 1,081
Ishihara, N., Nomura, M., Jofuku, A., Kato, H., Suzuki, S. O., Masuda, K., Otera, H., Nakanishi, Y., Nonaka, I., Goto, Y.-I., et al. (2009) · Nature Cell Biology · doi:10.1038/ncb1907 · Cited by 1,066
Cribbs, J. T., & Strack, S. (2007) · EMBO Reports · doi:10.1038/sj.embor.7401062 · Cited by 1,061
Cited by
Sorted by citations
Mitochondrial dynamics: overview of molecular mechanisms
Tilokani, L., Nagashima, S., Paupe, V., & Prudent, J. (2018) · Essays in Biochemistry · doi:10.1042/ebc20170104 · Cited by 1,397
Fis1, Mff, MiD49, and MiD51 mediate Drp1 recruitment in mitochondrial fission
Losón, O. C., Song, Z., Chen, H., & Chan, D. C. (2013) · Molecular Biology of the Cell · doi:10.1091/mbc.e12-10-0721 · Cited by 1,235
Fusion and fission: interlinked processes critical for mitochondrial health
Chan, D. C. (2012) · Annual Review of Genetics · doi:10.1146/annurev-genet-110410-132529 · Cited by 1,196
Mitochondrial Dynamics — Mitochondrial Fission and Fusion in Human Diseases
Archer, S. L. (2013) · New England Journal of Medicine · doi:10.1056/nejmra1215233 · Cited by 1,120
Mechanisms of Mitochondrial Fission and FusionPreprint
van der Bliek, A. M., Shen, Q., & Kawajiri, S. (2013) · Cold Spring Harbor Perspectives in Biology · doi:10.1101/cshperspect.a011072 · Cited by 903
The i -AAA protease YME1L and OMA1 cleave OPA1 to balance mitochondrial fusion and fission
Anand, R., Wai, T., Baker, M. J., Kladt, N., Schauss, A. C., Rugarli, E., & Langer, T. (2014) · Journal of Cell Biology · doi:10.1083/jcb.201308006 · Cited by 812
Pernas, L. F., & Scorrano, L. (2015) · Annual Review of Physiology · doi:10.1146/annurev-physiol-021115-105011 · Cited by 845
Mitochondrial Defects and Oxidative Stress in Alzheimer Disease and Parkinson Disease
Yan, M. H., Wang, X., & Zhu, X. (2013) · Free Radical Biology and Medicine · doi:10.1016/j.freeradbiomed.2012.11.014 · Cited by 718
Self-citationHere, there, and everywhere: The importance of ER membrane contact sites
Wu, H., Carvalho, P., & Voeltz, G. K. (2018) · Science · doi:10.1126/science.aan5835 · Cited by 689
Inhibition of mitochondrial fission prevents cell cycle progression in lung cancer
Rehman, J., Zhang, H. J., Tóth, P. T., Zhang, Y., Marsboom, G., Hong, Z., Salgia, R., Husain, A. N., Wietholt, C., & Archer, S. L. (2012) · The FASEB Journal · doi:10.1096/fj.11-196543 · Cited by 610
The endoplasmic reticulum–mitochondria connection: One touch, multiple functions
Marchi, S., Patergnani, S., & Pinton, P. (2014) · Biochimica et Biophysica Acta (BBA) - Bioenergetics · doi:10.1016/j.bbabio.2013.10.015 · Cited by 475
New insights into the function and regulation of mitochondrial fission
Otera, H., Ishihara, N., & Mihara, K. (2013) · Biochimica et Biophysica Acta (BBA) - Molecular Cell Research · doi:10.1016/j.bbamcr.2013.02.002 · Cited by 501
Mitochondrial dynamics in neurodegeneration
Itoh, K., Nakamura, K., Iijima, M., & Sesaki, H. (2012) · Trends in Cell Biology · doi:10.1016/j.tcb.2012.10.006 · Cited by 486
Novel Drp1 inhibitor diminishes aberrant mitochondrial fission and neurotoxicity
Qi, X., Qvit, N., Su, Y.-C., & Mochly‐Rosen, D. (2012) · Journal of Cell Science · doi:10.1242/jcs.114439 · Cited by 441
Mitochondrial quality control and muscle mass maintenance.
Romanello, V., & Sandri, M. (2016) · Frontiers in Physiology · doi:10.3389/fphys.2015.00422 · Cited by 434
Mitochondria: from cell death executioners to regulators of cell differentiation
Kasahara, A., & Scorrano, L. (2014) · Trends in Cell Biology · doi:10.1016/j.tcb.2014.08.005 · Cited by 433
Molecular mechanisms of mitochondrial dynamics
Tábara, L. C., Segawa, M., & Prudent, J. (2024) · Nature Reviews Molecular Cell Biology · doi:10.1038/s41580-024-00785-1 · Cited by 445
Guo, X. L., Disatnik, M., Monbureau, M., Shamloo, M., Mochly‐Rosen, D., & Qi, X. (2013) · Journal of Clinical Investigation · doi:10.1172/jci70911 · Cited by 379
Mitochondrial fusion/fission dynamics in neurodegeneration and neuronal plasticity
Bertholet, A. M., Delerue, T., Millet, A. M., Moulis, M. F., David, C., Daloyau, M., Arnauné-Pelloquin, L., Davezac, N., Mils, V., Miquel, M. C., et al. (2016) · Neurobiology of Disease · doi:10.1016/j.nbd.2015.10.011 · Cited by 363
Wu, W., Lin, C., Wu, K., Jiang, L., Wang, X., Li, W., Zhuang, H., Zhang, X., Chen, H. H., Li, S., et al. (2016) · The EMBO Journal · doi:10.15252/embj.201593102 · Cited by 370
Self-citationSharp, W. W., Fang, Y. H., Han, M., Zhang, H. J., Hong, Z., Banathy, A., Morrow, E., Ryan, J. J., & Archer, S. L. (2013) · The FASEB Journal · doi:10.1096/fj.12-226225 · Cited by 361
Determinants and outcomes of mitochondrial dynamics
Quintana–Cabrera, R., & Scorrano, L. (2023) · Molecular Cell · doi:10.1016/j.molcel.2023.02.012 · Cited by 362
Cooperative and independent roles of the Drp1 adaptors Mff, MiD49 and MiD51 in mitochondrial fission
Osellame, L. D., Singh, A. P., Stroud, D. A., Palmer, C. S., Stojanovski, D., Ramachandran, R., & Ryan, M. T. (2016) · Journal of Cell Science · doi:10.1242/jcs.185165 · Cited by 336
Disatnik, M., Ferreira, J. C. B., Campos, J. C., Gomes, M. K., Dourado, P. M. M., Qi, X., & Mochly‐Rosen, D. (2013) · Journal of the American Heart Association · doi:10.1161/jaha.113.000461 · Cited by 340
Wang, W., Wang, X., Fujioka, H., Hoppel, C. L., Whone, A. L., Caldwell, M. A., Cullen, P. J., Liu, J., & Zhu, X. (2015) · Nature Medicine · doi:10.1038/nm.3983 · Cited by 331
Self-citationDeterminants and Functions of Mitochondrial Behavior
Labbè, K., Murley, A., & Nunnari, J. M. (2014) · Annual Review of Cell and Developmental Biology · doi:10.1146/annurev-cellbio-101011-155756 · Cited by 324
Mitochondrial Rab GAPs govern autophagosome biogenesis during mitophagy
Yamano, K., Fogel, A. I., Wang, C., van der Bliek, A. M., & Youle, R. J. (2014) · eLife · doi:10.7554/elife.01612 · Cited by 307
Palmer, C. S., Elgass, K. D., Parton, R. G., Osellame, L. D., Stojanovski, D., & Ryan, M. T. (2013) · Journal of Biological Chemistry · doi:10.1074/jbc.m113.479873 · Cited by 301
How mitochondrial dynamism orchestrates mitophagy
Shirihai, O. S., Song, M., & Dorn, G. W. (2015) · Circulation Research · doi:10.1161/circresaha.116.306374 · Cited by 311
Hu, C., Huang, Y., & Li, L. (2017) · International Journal of Molecular Sciences · doi:10.3390/ijms18010144 · Cited by 302
Structural insights into oligomerization and mitochondrial remodelling of dynamin 1‐like protein
Fröhlich, C., Grabiger, S., Schwefel, D., Faelber, K., Rosenbaum, E., Mears, J. A., Rocks, O., & Daumke, O. (2013) · The EMBO Journal · doi:10.1038/emboj.2013.74 · Cited by 292
Mitochondrial Dynamics: Coupling Mitochondrial Fitness with Healthy Aging
Sebastián, D., Palacı́n, M., & Antonio Zorzano, A. (2017) · Trends in Molecular Medicine · doi:10.1016/j.molmed.2017.01.003 · Cited by 292
Prieto, J., León, M., Ponsoda, X., Sendra, R., Bort, R., Ferrer‐Lorente, R., Raya, Á., López‐García, C., & Torres, J. (2016) · Nature Communications · doi:10.1038/ncomms11124 · Cited by 286
Lewis, T. L., Kwon, S.-K., Lee, A., Shaw, R., & Polleux, F. (2018) · Nature Communications · doi:10.1038/s41467-018-07416-2 · Cited by 260
Mitochondrial quality control in health and in Parkinson’s disease
Eldeeb, M. A., Thomas, R. A., Ragheb, M. A., Fallahi, A., & Fon, E. A. (2022) · Physiological Reviews · doi:10.1152/physrev.00041.2021 · Cited by 281
Recent advances into the understanding of mitochondrial fission
Elgass, K., Pakay, J. L., Ryan, M. T., & Palmer, C. S. (2012) · Biochimica et Biophysica Acta (BBA) - Molecular Cell Research · doi:10.1016/j.bbamcr.2012.05.002 · Cited by 274
Human Fis1 regulates mitochondrial dynamics through inhibition of the fusion machinery
Yu, R., Jin, S., Lendahl, U., Nistér, M., & Zhao, J. (2019) · The EMBO Journal · doi:10.15252/embj.201899748 · Cited by 253
Self-citationStructure, function, and regulation of mitofusin‐2 in health and disease
Chandhok, G., Lazarou, M., & Neumann, B. (2017) · Biological reviews/Biological reviews of the Cambridge Philosophical Society · doi:10.1111/brv.12378 · Cited by 263
Abnormal Mitochondrial Dynamics in the Pathogenesis of Alzheimer's Disease
Zhu, X., Perry, G., Smith, M. A., & Wang, X. (2012) · Journal of Alzheimer's Disease · doi:10.3233/jad-2012-129005 · Cited by 242
Self-citationDrp1-dependent mitochondrial fission via MiD49/51 is essential for apoptotic cristae remodeling
Otera, H., Miyata, N., Kuge, O., & Mihara, K. (2016) · Journal of Cell Biology · doi:10.1083/jcb.201508099 · Cited by 229
Su, Y.-C., & Qi, X. (2013) · Human Molecular Genetics · doi:10.1093/hmg/ddt301 · Cited by 233
Mutations in Fis1 disrupt orderly disposal of defective mitochondria
Shen, Q., Yamano, K., Head, B. P., Kawajiri, S., Cheung, J. T. M., Wang, C., Cho, J.-H., Hattori, N., Youle, R. J., & van der Bliek, A. M. (2014) · Molecular Biology of the Cell · doi:10.1091/mbc.e13-09-0525 · Cited by 209
Mitochondrial Dynamics in Cardiovascular Health and Disease
Ong, S., Hall, A. R., & Hausenloy, D. J. (2012) · Antioxidants and Redox Signaling · doi:10.1089/ars.2012.4777 · Cited by 213
Mitochondrial division and fusion in metabolism
Roy, M., Reddy, P. H., Iijima, M., & Sesaki, H. (2015) · Current Opinion in Cell Biology · doi:10.1016/j.ceb.2015.02.001 · Cited by 215
Mitochondrial Dynamics in Stem Cells and Differentiation
Seo, B. J., Yoon, S. H., & Tae, J. (2018) · International Journal of Molecular Sciences · doi:10.3390/ijms19123893 · Cited by 208
Gawlowski, T., Suárez, J., Scott, B. T., Torres‐Gonzalez, M., Wang, H., Schwappacher, R., Han, X., Yates, J. R., Hoshijima, M., & DILLMANN, W. H. (2012) · Journal of Biological Chemistry · doi:10.1074/jbc.m112.390682 · Cited by 214
Romanello, V., & Sandri, M. (2021) · Cellular and Molecular Life Sciences · doi:10.1007/s00018-020-03662-0 · Cited by 197
Interchangeable adaptors regulate mitochondrial dynamin assembly for membrane scission
Koirala, S., Guo, Q., Kalia, R., Bui, H., Eckert, D. M., Frost, A. S., & Shaw, J. M. (2013) · Proceedings of the National Academy of Sciences · doi:10.1073/pnas.1300855110 · Cited by 201
Fission and proliferation of peroxisomes
Schrader, M., Bonekamp, N. A., & Islinger, M. (2012) · Biochimica et Biophysica Acta (BBA) - Molecular Basis of Disease · doi:10.1016/j.bbadis.2011.12.014 · Cited by 189
Zerihun, M., Sukumaran, S., & Qvit, N. (2023) · International Journal of Molecular Sciences · doi:10.3390/ijms24065785 · Cited by 198
The mitochondrial fission receptor Mff selectively recruits oligomerized Drp1
Liu, R., & Chan, D. C. (2015) · Molecular Biology of the Cell · doi:10.1091/mbc.e15-08-0591 · Cited by 193
Mitochondrial fission and fusion
Lee, H., & Yoon, Y. (2016) · Biochemical Society Transactions · doi:10.1042/bst20160129 · Cited by 183
Mitochondrial Fission in Human Diseases
Serasinghe, M. N., & Chipuk, J. E. (2016) · Handbook of experimental pharmacology · doi:10.1007/164_2016_38 · Cited by 186
At the right distance: ER-mitochondria juxtaposition in cell life and death
Naon, D., & Scorrano, L. (2014) · Biochimica et Biophysica Acta (BBA) - Molecular Cell Research · doi:10.1016/j.bbamcr.2014.05.011 · Cited by 178
Mitochondrial quality control in human health and disease
Liu, B., Xu, C.-Z., Liu, Y., Lu, Z., Fu, T.-L., Li, G., Deng, Y., Luo, G., Ding, S. Z., Li, N., et al. (2024) · Military Medical Research · doi:10.1186/s40779-024-00536-5 · Cited by 211
Regulation of Mammalian Mitochondrial Dynamics: Opportunities and Challenges
Yu, R., Lendahl, U., Nistér, M., & Zhao, J. (2020) · Frontiers in Endocrinology · doi:10.3389/fendo.2020.00374 · Cited by 183
Self-citationMechanical force induces mitochondrial fission
Helle, S. C. J., Feng, Q., Aebersold, M. J., Hirt, L., Grüter, R. R., Vahid, A., Sirianni, A., Mostowy, S., Snedeker, J. G., Šarić, A., et al. (2017) · eLife · doi:10.7554/elife.30292 · Cited by 171
Chen, K., Dasgupta, A., Lin, J.-H., Potus, F., Bonnet, S., Iremonger, J., Fu, J. M., Mewburn, J. D., Wu, D., Dunham‐Snary, K. J., et al. (2018) · Circulation · doi:10.1161/circulationaha.117.031258 · Cited by 167
Xian, H., & Liou, Y. (2020) · Cell Death and Differentiation · doi:10.1038/s41418-020-00657-z · Cited by 177
Functional interplay between Parkin and Drp1 in mitochondrial fission and clearance
Buhlman, L. M., Damiano, M. G., Bertolin, G., Ferrando-Miguel, R., Lombès, A., Brice, A., & Corti, O. (2014) · Biochimica et Biophysica Acta (BBA) - Molecular Cell Research · doi:10.1016/j.bbamcr.2014.05.012 · Cited by 173
Onoue, K., Jofuku, A., Ban-Ishihara, R., Ishihara, T., Maeda, M., Koshiba, T., Itoh, T., Fukuda, M., Otera, H., Oka, T., et al. (2012) · Journal of Cell Science · doi:10.1242/jcs.111211 · Cited by 161
Proliferation and fission of peroxisomes — An update
Schrader, M., Costello, J. L., Godinho, L. F., Azadi, A. S., & Islinger, M. (2015) · Biochimica et Biophysica Acta (BBA) - Molecular Cell Research · doi:10.1016/j.bbamcr.2015.09.024 · Cited by 170
Filichia, E., Hoffer, B. J., Qi, X., & Luo, Y. (2016) · Scientific Reports · doi:10.1038/srep32656 · Cited by 157
Roles of mitochondrial dynamics modulators in cardiac ischaemia/reperfusion injury
Maneechote, C., Palee, S., Chattipakorn, S. C., & Chattipakorn, N. (2017) · Journal of Cellular and Molecular Medicine · doi:10.1111/jcmm.13330 · Cited by 154
Shaping the dynamic mitochondrial network
Lackner, L. L. (2014) · BMC Biology · doi:10.1186/1741-7007-12-35 · Cited by 156
Mitochondrial morphology—emerging role in bioenergetics
Galloway, C. A., Lee, H., & Yoon, Y. (2012) · Free Radical Biology and Medicine · doi:10.1016/j.freeradbiomed.2012.09.035 · Cited by 159
Mitochondrial Morphology in Metabolic Diseases
Galloway, C. A., & Yoon, Y. (2012) · Antioxidants and Redox Signaling · doi:10.1089/ars.2012.4779 · Cited by 143
Fission and Fusion of Plant Mitochondria, and Genome Maintenance
Arimura, S. (2017) · PLANT PHYSIOLOGY · doi:10.1104/pp.17.01025 · Cited by 137
STX17 dynamically regulated by Fis1 induces mitophagy via hierarchical macroautophagic mechanism
Xian, H., Yang, Q., Xiao, L., Shen, H., & Liou, Y. (2019) · Nature Communications · doi:10.1038/s41467-019-10096-1 · Cited by 137
Mitochondrial Dynamics in Diabetic Cardiomyopathy
Galloway, C. A., & Yoon, Y. (2015) · Antioxidants and Redox Signaling · doi:10.1089/ars.2015.6293 · Cited by 135
Mitochondrial fission‐fusion as an emerging key regulator of cell proliferation and differentiation
Mitra, K. (2013) · BioEssays · doi:10.1002/bies.201300011 · Cited by 134
Mitoconfusion: Noncanonical Functioning of Dynamism Factors in Static Mitochondria of the Heart
Song, M., & Dorn, G. W. (2015) · Cell Metabolism · doi:10.1016/j.cmet.2014.12.019 · Cited by 128
Phosphatidic Acid (PA)-preferring Phospholipase A1 Regulates Mitochondrial Dynamics
Baba, T., Kashiwagi, Y., Arimitsu, N. N., Kogure, T., Edo, A., Maruyama, T., Nakao, K., Nakanishi, H., Kinoshita, M., Frohman, M. A., et al. (2014) · Journal of Biological Chemistry · doi:10.1074/jbc.m113.531921 · Cited by 131
Ceramide induced mitophagy and tumor suppression
Dany, M., & Öğretmen, B. (2015) · Biochimica et Biophysica Acta (BBA) - Molecular Cell Research · doi:10.1016/j.bbamcr.2014.12.039 · Cited by 130
Mitochondrial Dynamics: Functional Link with Apoptosis
Otera, H., & Mihara, K. (2012) · International Journal of Cell Biology · doi:10.1155/2012/821676 · Cited by 131
Intra- and Intercellular Quality Control Mechanisms of Mitochondria
Kiriyama, Y., & Nochi, H. (2017) · Cells · doi:10.3390/cells7010001 · Cited by 131
The role of mitochondria-associated membranes in cellular homeostasis and diseases
Perrone, M., Caroccia, N., Genovese, I., Missiroli, S., Modesti, L., Pedriali, G., Vezzani, B., Vitto, V. A. M., Antenori, M., Lebiedzińska, M., et al. (2019) · International review of cytology · doi:10.1016/bs.ircmb.2019.11.002 · Cited by 132
Mitochondrial Morphofunction in Mammalian Cells
Bulthuis, E. P., Adjobo-Hermans, M. J. W., Willems, P. H. G. M., & Koopman, W. J. H. (2018) · Antioxidants and Redox Signaling · doi:10.1089/ars.2018.7534 · Cited by 133
Cho, B., Choi, S. Y., Cho, H. M., Kim, H. J., & Sun, W. (2013) · Experimental Neurobiology · doi:10.5607/en.2013.22.3.149 · Cited by 129
Atkins, K., Dasgupta, A., Chen, K., Mewburn, J., & Archer, S. L. (2016) · Clinical Science · doi:10.1042/cs20160030 · Cited by 130
Mitochondrial Biology and Neurological Diseases
Arun, S., Liu, L., & Dönmez, G. (2015) · Current Neuropharmacology · doi:10.2174/1570159x13666150703154541 · Cited by 123
Deconstructing Mitochondrial Dysfunction in Alzheimer Disease
García‐Escudero, V., Martín-Maestro, P., Perry, G. L., & Ávila, J. (2013) · Oxidative Medicine and Cellular Longevity · doi:10.1155/2013/162152 · Cited by 120
Adaniya, S. M., O‐Uchi, J., Cypress, M. W., Kusakari, Y., & Jhun, B. S. (2019) · American Journal of Physiology-Cell Physiology · doi:10.1152/ajpcell.00523.2018 · Cited by 123
Ihenacho, U. K., Nolden, K. A., Harwig, M. C., Widlansky, M. E., & Hill, R. B. (2021) · Frontiers in Endocrinology · doi:10.3389/fendo.2021.660095 · Cited by 117
Zhang, Z., Liu, L., Wu, S., & Xing, D. (2015) · The FASEB Journal · doi:10.1096/fj.15-274258 · Cited by 117
Circadian Control of Mitochondria in Reactive Oxygen Species Homeostasis
Mezhnina, V., Ebeigbe, O. P., Poe, A., & Kondratov, R. V. (2022) · Antioxidants and Redox Signaling · doi:10.1089/ars.2021.0274 · Cited by 123
OPA1 regulation of mitochondrial dynamics in skeletal and cardiac muscle
Noone, J., O’Gorman, D. J., & Kenny, H. (2022) · Trends in Endocrinology and Metabolism · doi:10.1016/j.tem.2022.07.003 · Cited by 120
Mechanisms for Countering Oxidative Stress and Damage in Retinal Pigment Epithelium
Plafker, S. M., O'Mealey, G. B., & Szweda, L. I. (2012) · International review of cytology · doi:10.1016/b978-0-12-394309-5.00004-3 · Cited by 121
Dynamin Assembly Strategies and Adaptor Proteins in Mitochondrial Fission
Bui, H., & Shaw, J. M. (2013) · Current Biology · doi:10.1016/j.cub.2013.08.040 · Cited by 114
Bosnjak, Z. J., Logan, S., Liu, Y., & Bai, X. (2016) · Anesthesia & Analgesia · doi:10.1213/ane.0000000000001544 · Cited by 111
Tian, L., Neuber‐Hess, M. S., Mewburn, J. D., Dasgupta, A., Dunham‐Snary, K. J., Wu, D., Chen, K., Hong, Z., Sharp, W. W., Kutty, S., et al. (2017) · Journal of Molecular Medicine · doi:10.1007/s00109-017-1522-8 · Cited by 112
Yang, D., Ying, J., Wang, X., Zhao, T., Yoon, S., Yang, F., Zheng, Q., Liu, X., Yu, W., & Hua, F. (2021) · Frontiers in Neuroscience · doi:10.3389/fnins.2021.654785 · Cited by 121
Self-citationYu, R., Liu, T., Ning, F. C., Tan, F., Jin, S., Lendahl, U., Zhao, J., & Nistér, M. (2019) · Journal of Biological Chemistry · doi:10.1074/jbc.ra119.008202 · Cited by 109
Self-citationDiabetic Retinopathy and Damage to Mitochondrial Structure and Transport Machinery
Zhong, Q. P. W., & Kowluru, R. A. (2011) · Investigative Ophthalmology & Visual Science · doi:10.1167/iovs.11-8045 · Cited by 109
MIEF1 Microprotein Regulates Mitochondrial Translation
Rathore, A., Chu, Q., Tan, D., Martinez, T. F., Donaldson, C. J., Diedrich, J. K., Yates, J. R., & Saghatelian, A. (2018) · Biochemistry · doi:10.1021/acs.biochem.8b00726 · Cited by 109
Structural and functional analysis of MiD51, a dynamin receptor required for mitochondrial fission
Richter, V., Palmer, C. S., Osellame, L. D., Singh, A. P., Elgass, K., Stroud, D. A., Sesaki, H., Kvansakul, M., & Ryan, M. T. (2014) · The Journal of Cell Biology · doi:10.1083/jcb.201311014 · Cited by 106
Regulation of mitochondrial dynamics: convergences and divergences between yeast and vertebrates
Zhao, J., Lendahl, U., & Nistér, M. (2012) · Cellular and Molecular Life Sciences · doi:10.1007/s00018-012-1066-6 · Cited by 105
Self-citationVeeresh, P., Kaur, H., Sarmah, D., Mounica, L., Verma, G., Kotian, V., Kesharwani, R., Kalia, K., Borah, A., Wang, X., et al. (2019) · Annals of the New York Academy of Sciences · doi:10.1111/nyas.14212 · Cited by 98
Self-citationMacdonald, P. J., Francy, C. A., Stepanyants, N., Lehman, L., Baglio, A. J., Mears, J. A., Qi, X., & Ramachandran, R. (2015) · Journal of Biological Chemistry · doi:10.1074/jbc.m115.680181 · Cited by 100
Multipolar functions of BCL-2 proteins link energetics to apoptosis
Hardwick, J. M., Chen, Y., & Jonas, E. A. (2012) · Trends in Cell Biology · doi:10.1016/j.tcb.2012.03.005 · Cited by 96
Metadata
- Authors
- Zhao, J., Liu, T., Jin, S., Wang, X., Qu, M., Uhlén, P., Tomilin, N., Shupliakov, O., Lendahl, U., & Nistér, M.
- Affiliations
- Karolinska University Hospital (SE)
- Karolinska Institutet (SE)
- Corresponding author
- Zhao, Jian
- Lendahl, Urban
- Nistér, Monica
- Venue
- The EMBO Journal
- Published
- 2011-06-24
- Volume
- 30
- Issue
- 14
- Pages
- 2762-2778
- ISSN
- 0261-4189 (ISSN-L)
- 1460-2075
- PMC
- PMC3160255
- OpenAlex
- W1960363048
- Cited by
- 370
- References
- 54
- Citations by year
- 2026: 8 · 2025: 13 · 2024: 14 · 2023: 22 · 2022: 17 · 2021: 30 · 2020: 25 · 2019: 19 · 2018: 27 · 2017: 27 · 2016: 27 · 2015: 33 · 2014: 38 · 2013: 37 · 2012: 26
- FWCI
- 14.04
- Type
- journal article
- Language
- en
- Open access
- hybrid
- doi.org
- Licence
- Locations
- The EMBO Journal (publishedVersion, cc-by-nc-sa)
- Europe PMC (PubMed Central) (publishedVersion, cc-by-nc-sa)
- PubMed Central (publishedVersion, cc-by-nc-sa)
- PubMed (publishedVersion)
- Funders
- University of Rochester
- Cancerfonden
- Karolinska Institutet
- Knut och Alice Wallenbergs Stiftelse
- Vetenskapsrådet
- Deutsches Zentrum für Neurodegenerative Erkrankungen
- Barncancerfonden
- Cancerföreningen i Stockholm
- National Institutes of Health
- National Institute of Neurological Disorders and Stroke
- Topics
- Life Sciences › Biochemistry, Genetics and Molecular Biology › Molecular Biology › Mitochondrial Function and Pathology
- Life Sciences › Biochemistry, Genetics and Molecular Biology › Cell Biology › Autophagy in Disease and Therapy
- Life Sciences › Biochemistry, Genetics and Molecular Biology › Molecular Biology › Cell death mechanisms and regulation
- Keywords
- MiD51, Drp1, mitochondrial fusion, mitochondrial fission, mitochondrial dynamics, mitochondrial outer membrane, mitochondrial fragmentation, mitofusins
- MeSH terms
- Cross-Linking Reagents, Cytoplasm, Fluorescent Antibody Technique, Glioma, HeLa Cells, Humans, Immunoenzyme Techniques, Membrane Fusion, Membrane Proteins, Microtubule-Associated Proteins, Mitochondria, Neuroblastoma, Peptide Elongation Factors, Protein Binding, RNA, Messenger, Subcellular Fractions, Tumor Cells, Cultured, Blotting, Western, Apoptosis, Reverse Transcriptase Polymerase Chain Reaction, GTP Phosphohydrolases, Mitochondrial Proteins, Dynamins, RNA, Small Interfering, Immunoprecipitation, Mitochondrial Membranes
About these checks
Registry, retraction, Cites and statistics results are computed, not judged, with one exception: a printed reference that no index lists is read once by a model before it counts as a citation error. Claims are extracted by a model and kept only when their quote appears verbatim in the text; each cited source is then checked, with a model’s help, for whether it says what the claim relies on. Those verdicts can be wrong — read the claim’s quote and the cited source before relying on one.
Statistics and arithmetic are recomputed, not judged.
Confidence bands are shown only for fields calibrated on our annotated test set. None is calibrated yet, so no band is shown.
What counts as a claim ›How we measure confidence ›How we check this ›
Are you an author, or do you see a problem with this page? Request a review
