

The DOI matches its Crossref record; 37 of the 37 references it cites were found in a registry or an index.
Composition and temporal stability of the gut microbiota in older persons
Open accessAbstract
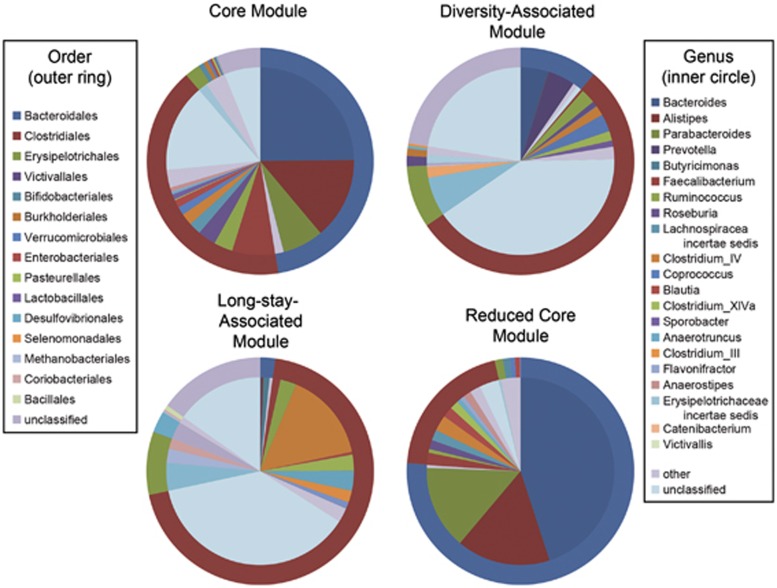
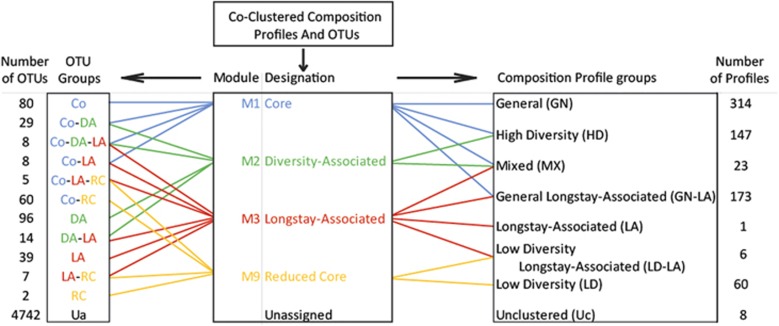
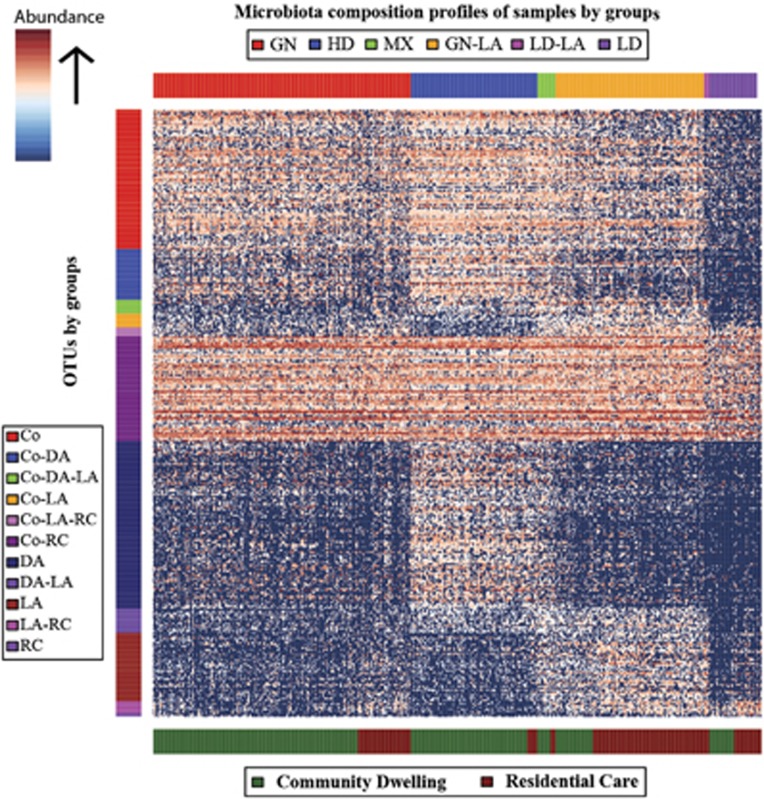
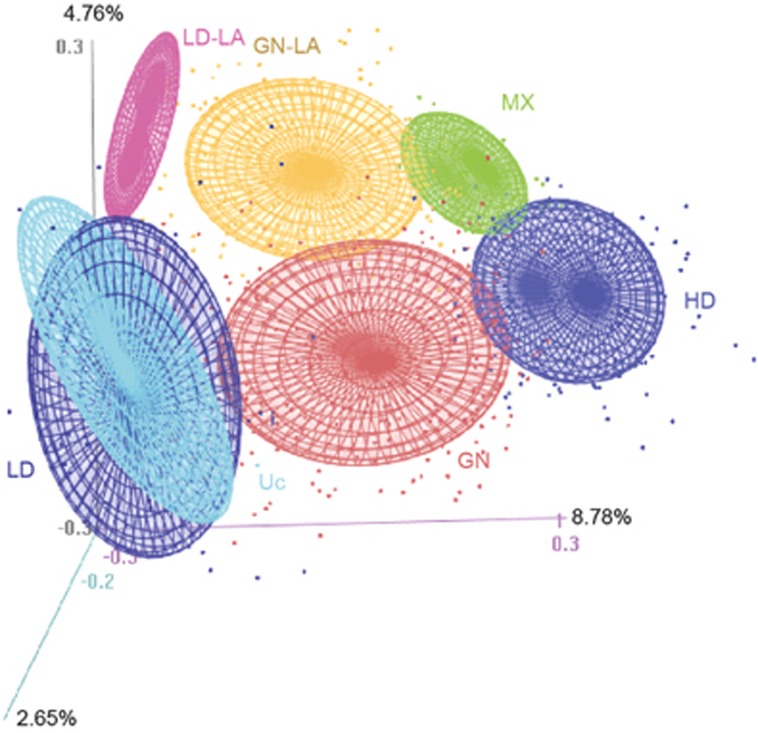
The composition and function of the human gut microbiota has been linked to health and disease. We previously identified correlations between habitual diet, microbiota composition gradients and health gradients in an unstratified cohort of 178 elderly subjects. To refine our understanding of diet–microbiota associations and differential taxon abundance, we adapted an iterative bi-clustering algorithm (iterative binary bclustering of gene sets (iBBiG)) and applied it to microbiota composition data from 732 faecal samples from 371 ELDERMET cohort subjects, including longitudinal samples. We thus identified distinctive microbiota configurations associated with ageing in both community and long-stay residential care elderly subjects. Mixed-taxa populations were identified that had clinically distinct associations. Microbiota temporal instability was observed in both community-dwelling and long-term care subjects, particularly in those with low initial microbiota diversity. However, the stability of the microbiota of subjects had little impact on the directional change of the microbiota as observed for long-stay subjects who display a gradual shift away from their initial microbiota. This was not observed in community-dwelling subjects. This directional change was associated with duration in long-stay. Changes in these bacterial populations represent the loss of the health-associated and youth-associated microbiota components and gain of an elderly associated microbiota. Interestingly, community-associated microbiota configurations were impacted more by the use of antibiotics than the microbiota of individuals in long-term care, as the community-associated microbiota showed more loss but also more recovery following antibiotic treatment. This improved definition of gut microbiota composition patterns in the elderly will better inform the design of dietary or antibiotic interventions targeting the gut microbiota.
Overview
The claims and statistics of this paper haven’t been checked yet.
Run the check — free, no account needed. It reads the open-access text and checks the sources it cites.
Integrity signals
Registry
Cites
Statistics
Figures
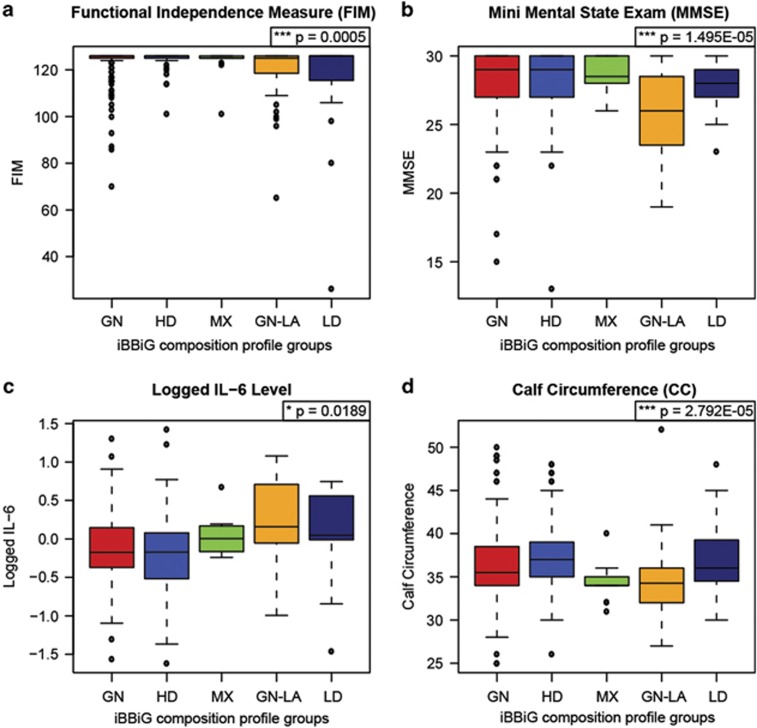
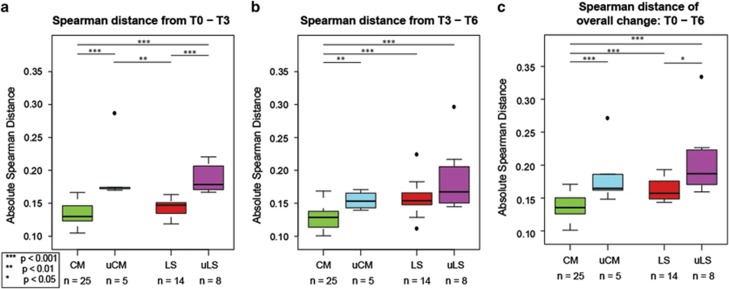
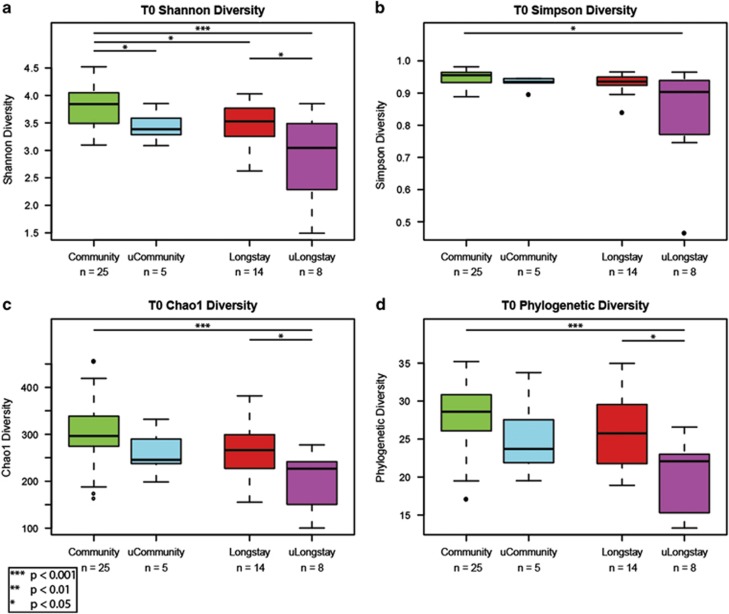
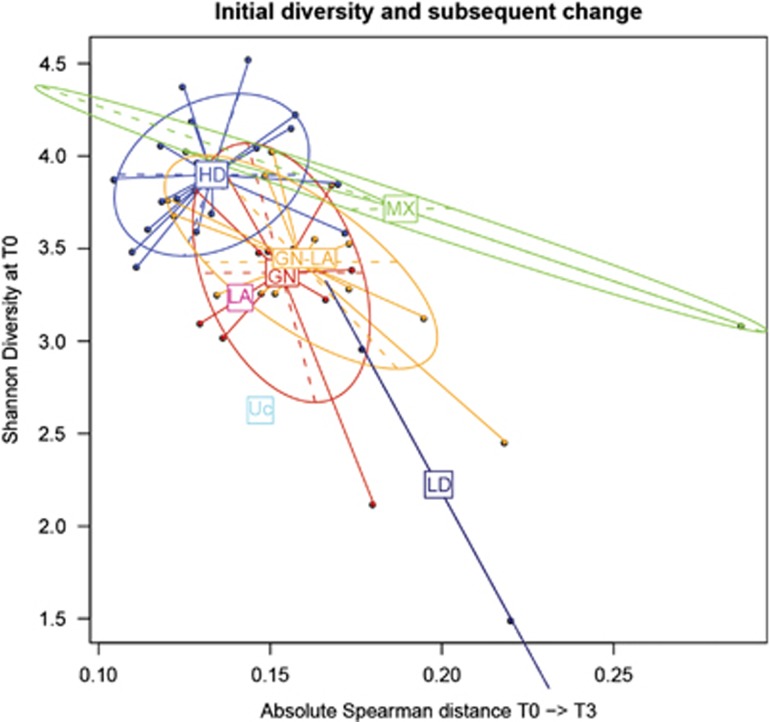
Verification
Claims the paper makes
The claims and statistics of this paper haven’t been checked yet.
Run the check — free, no account needed. It reads the open-access text and checks the sources it cites.
Claims other papers make about this one
Each is checked against this paper’s own text: does it say what the citing paper says it does?
In the citing paper
“Others have found advanced age to be associated with variations in the gut microbiota composition characterized by a loss of diversity of specific taxa46.”
From Gut microbiome diversity is an independent predictor of survival in cervical cancer patients receiving chemoradiation (2021) · cites this paper as [46]
In the citing paper
“Data indicate a narrowing of diversity and distinctive microbiota configurations associated with ageing in long-stay care individuals compared with that of community dwellers (Claesson et al., 2012;Jeffery et al., 2016).”
From Gut reactions: Breaking down xenobiotic–microbiome interactions (2019) · cites this paper as Jeffery et al., 2016
In the citing paper
“Stability begins to decline as we age, and studies suggest that there is greater inter-individual variation in older adults than younger adults (<65 years old) (91, 92)”
From Signalling cognition: The gut microbiota and hypothalamic-pituitary-adrenal axis (2023) · cites this paper as [91]
In the citing paper
“investigations of age-related changes in gut microbiota describe a bacterial community that is both less diverse and lacking in microorganisms responsible for the production of butyrate (indicative of gastrointestinal health) [15, 84, 98, 99], and more abundant in pathogens belonging to the Proteobacteria phylum (e.g., Enterobacteriaceae) [15, 68, 83].”
From Gut Microbiota Contribute to Age-Related Changes in Skeletal Muscle Size, Composition, and Function: Biological Basis for a Gut-Muscle Axis (2018) · cites this paper as [99]
Self-check
Percentages, sums and reported differences re-computed from the paper’s own numbers.
The self-check needs the paper’s full text.
Citations
Cites
Schloss, P. D., Westcott, S. L., Ryabin, T., Hall, J. R., Hartmann, M., Hollister, E. B., Lesniewski, R. A., Oakley, B. B., Parks, D. H., Robinson, C. J., et al. (2009) · Applied and Environmental Microbiology · doi:10.1128/aem.01541-09 · Cited by 19,549
Diet rapidly and reproducibly alters the human gut microbiome
David, L. A., Maurice, C. F., Carmody, R. N., Gootenberg, D. B., Button, J. E., Wolfe, B. E., Ling, A. V., Devlin, A. S., Varma, Y., Fischbach, M. A., et al. (2014) · Nature · doi:10.1038/nature12820 · Cited by 10,100
Human gut microbes associated with obesity
Ley, R. E., Turnbaugh, P. J., Klein, S., & Gordon, J. I. (2006) · Nature · doi:10.1038/4441022a · Cited by 8,785
A core gut microbiome in obese and lean twins
Turnbaugh, P. J., Hamady, M., Yatsunenko, T., Cantarel, B. L., Duncan, A., Ley, R. E., Sogin, M. L., Jones, W. J., Roe, B. A., Affourtit, J. P., et al. (2009) · Nature · doi:10.1038/nature07540 · Cited by 7,823
Enterotypes of the human gut microbiome
MetaHIT Consortium (additional members), Arumugam, M., Raes, J., Pelletier, E., Le Paslier, D., Yamada, T., Mende, D. R., Fernandes, G. R., Tap, J., Bruls, T., et al. (2011) · Nature · doi:10.1038/nature09944 · Cited by 7,548
Linking long-term dietary patterns with gut microbial enterotypes
Wu, G. D., Chen, J., Hoffmann, C., Bittinger, K., Chen, Y.-Y., Keilbaugh, S. A., Bewtra, M., Knights, D., Walters, W. A., Knight, R., et al. (2011) · Science · doi:10.1126/science.1208344 · Cited by 6,513
Gut microbiota composition correlates with diet and health in the elderly
Claesson, M. J., Jeffery, I. B., Conde, S., Power, S. E., O’Connor, E. M., Cusack, S., Harris, H. M. B., Coakley, M., Lakshminarayanan, B., O’Sullivan, O., et al. (2012) · Nature · doi:10.1038/nature11319 · Cited by 3,314
Self-citationThe Treatment-Naive Microbiome in New-Onset Crohn’s Disease
Gevers, D., Kugathasan, S., Denson, L. A., Vázquez-Baeza, Y., Van Treuren, W., Ren, B., Schwager, E., Knights, D., Song, S. J., Yassour, M., et al. (2014) · Cell Host & Microbe · doi:10.1016/j.chom.2014.02.005 · Cited by 3,220
Gut Microbiota in Human Adults with Type 2 Diabetes Differs from Non-Diabetic Adults
Larsen, N., Vogensen, F. K., van den Berg, F. W. J., Nielsen, D. S., Andreasen, A. S., Pedersen, B. K., Al-Soud, W. A., Sørensen, S. J., Hansen, L. H., & Jakobsen, M. (2010) · PLoS ONE · doi:10.1371/journal.pone.0009085 · Cited by 2,952
Dethlefsen, L., Huse, S., Sogin, M. L., & Relman, D. A. (2008) · PLoS Biology · doi:10.1371/journal.pbio.0060280 · Cited by 2,361
Cited by
Sorted by citations
You are what you eat: Diet, health and the gut microbiota
Zmora, N., Suez, J., & Elinav, E. (2019) · Nature Reviews Gastroenterology & Hepatology · doi:10.1038/s41575-018-0061-2 · Cited by 1,792
O’Toole, P. W., & Jeffery, I. B. (2015) · Science · doi:10.1126/science.aac8469 · Cited by 1,202
Self-citationGhosh, T. S., Rampelli, S., Jeffery, I. B., Santoro, A., Neto, M., Capri, M., Giampieri, E., Jennings, A., Candela, M., Turroni, S., et al. (2020) · Gut · doi:10.1136/gutjnl-2019-319654 · Cited by 991
Self-citationThe Human Gut Microbiome: From Association to Modulation
Schmidt, T. S. B., Raes, J., & Bork, P. (2018) · Cell · doi:10.1016/j.cell.2018.02.044 · Cited by 845
The gut microbiome as a modulator of healthy ageing
Ghosh, T. S., Shanahan, F., & O’Toole, P. W. (2022) · Nature Reviews Gastroenterology & Hepatology · doi:10.1038/s41575-022-00605-x · Cited by 817
Self-citationGut microbiome pattern reflects healthy ageing and predicts survival in humans
Wilmanski, T., Diener, C., Rappaport, N., Patwardhan, S., Wiedrick, J., Lapidus, J., Earls, J. C., Zimmer, A., Glusman, G., Robinson, M., et al. (2021) · Nature Metabolism · doi:10.1038/s42255-021-00348-0 · Cited by 675
Gut microbiome and aging: physiological and mechanistic insights
Nagpal, R., Mainali, R., Ahmadi, S., Wang, S., Singh, R., Kavanagh, K., Kitzman, D. W., Kushugulova, A., Marotta, F., & Yadav, H. (2018) · Nutrition and Healthy Aging · doi:10.3233/nha-170030 · Cited by 670
Antibiotics as deep modulators of gut microbiota: between good and evil
Ianiro, G., Tilg, H., & Gasbarrini, A. (2016) · Gut · doi:10.1136/gutjnl-2016-312297 · Cited by 653
The Gut Microbiome, Aging, and Longevity: A Systematic Review
Badal, V. D., Vaccariello, E. D., Murray, E. R., Yu, K. E., Knight, R., Jeste, D. V., & Nguyen, T. T. (2020) · Nutrients · doi:10.3390/nu12123759 · Cited by 551
Gut microbiota: A player in aging and a target for anti-aging intervention
Vaiserman, A. M., Koliada, A. K., & Marotta, F. (2017) · Ageing Research Reviews · doi:10.1016/j.arr.2017.01.001 · Cited by 465
Signatures of early frailty in the gut microbiota
Jackson, M. A., Jeffery, I. B., Beaumont, M., Bell, J. T., Clark, A. G., Ley, R. E., O’Toole, P. W., Spector, T. D., & Steves, C. J. (2016) · Genome Medicine · doi:10.1186/s13073-016-0262-7 · Cited by 436
Self-citationThe aging gut microbiome and its impact on host immunity
Bosco, N., & Noti, M. (2021) · Genes and Immunity · doi:10.1038/s41435-021-00126-8 · Cited by 435
Signalling cognition: The gut microbiota and hypothalamic-pituitary-adrenal axis
Rusch, J. A., Layden, B. T., & Dugas, L. R. (2023) · Frontiers in Endocrinology · doi:10.3389/fendo.2023.1130689 · Cited by 415
(Dis)Trust your gut: the gut microbiome in age-related inflammation, health, and disease
Buford, T. W. (2017) · Microbiome · doi:10.1186/s40168-017-0296-0 · Cited by 409
Gut microbiota as the key controllers of 'healthy' aging of elderly people
Ragonnaud, E., & Biragyn, A. (2021) · Immunity & Ageing · doi:10.1186/s12979-020-00213-w · Cited by 383
Ticinesi, A., Lauretani, F., Milani, C., Nouvenne, A., Tana, C., Del Rio, D., Maggio, M., Ventura, M., & Meschi, T. (2017) · Nutrients · doi:10.3390/nu9121303 · Cited by 401
The microbiome–gut–brain axis in Parkinson disease — from basic research to the clinic
Tan, A. H., Lim, S. Y., & Lang, A. E. (2022) · Nature Reviews Neurology · doi:10.1038/s41582-022-00681-2 · Cited by 392
Age- and Sex-Dependent Patterns of Gut Microbial Diversity in Human Adults
de la Cuesta‐Zuluaga, J., Kelley, S. T., Chen, Y., Escobar, J. S., Mueller, N. T., Ley, R. E., McDonald, D. T., Huang, S. W., Swafford, A. D.-E., Knight, R. D., et al. (2019) · mSystems · doi:10.1128/msystems.00261-19 · Cited by 413
Hooks, K. B., & O’Malley, M. A. (2017) · mBio · doi:10.1128/mbio.01492-17 · Cited by 404
Grosicki, G. J., Fielding, R. A., & Lustgarten, M. S. (2018) · Calcified Tissue International · doi:10.1007/s00223-017-0345-5 · Cited by 388
The Gut Microbiota and Unhealthy Aging: Disentangling Cause from Consequence
DeJong, E. N., Surette, M. G., & Bowdish, D. M. E. (2020) · Cell Host & Microbe · doi:10.1016/j.chom.2020.07.013 · Cited by 370
Microbiome and colorectal cancer: Roles in carcinogenesis and clinical potential
Saus, E., Iraola‐Guzmán, S., Willis, J. R., Brunet‐Vega, A., & Gabaldón, T. (2019) · Molecular Aspects of Medicine · doi:10.1016/j.mam.2019.05.001 · Cited by 363
Gut reactions: Breaking down xenobiotic–microbiome interactions
Clarke, G., Sandhu, K. V., Griffin, B. T., Dinan, T. G., Cryan, J. F., & Hyland, N. P. (2019) · Pharmacological Reviews · doi:10.1124/pr.118.015768 · Cited by 319
Dysbiosis of human gut microbiome in young-onset colorectal cancer
Yang, Y., Du, L., Shi, D., Kong, C., Liu, J., Liu, G., Li, X., & Ma, Y. (2021) · Nature Communications · doi:10.1038/s41467-021-27112-y · Cited by 303
Sex differences in the gut microbiome–brain axis across the lifespan
Jašarević, E., Morrison, K. E., & Bale, T. L. (2016) · Philosophical Transactions of the Royal Society B Biological Sciences · doi:10.1098/rstb.2015.0122 · Cited by 307
Nutrition and the gut microbiome in the elderly
Salazar, N., Valdés-Varela, L., González, S., Gueimonde, M., & de los Reyes-Gavilán, C. G. (2017) · Gut Microbes · doi:10.1080/19490976.2016.1256525 · Cited by 282
Stability of the human faecal microbiome in a cohort of adult men
Mehta, R. S., Abu-Ali, G. S., Drew, D. A., Lloyd-Price, J., Subramanian, A., Lochhead, P., Joshi, A. D., Ivey, K. L., Khalili, H., Brown, G. T., et al. (2018) · Nature Microbiology · doi:10.1038/s41564-017-0096-0 · Cited by 273
Bacteroides utilization for dietary polysaccharides and their beneficial effects on gut health
Cheng, J., Hu, J., Geng, F., & Nie, S. (2022) · Food Science and Human Wellness · doi:10.1016/j.fshw.2022.04.002 · Cited by 291
Bäuerl, C., Collado, M. C., Diaz Cuevas, A., Viña, J., & Pérez Martínez, G. (2018) · Letters in Applied Microbiology · doi:10.1111/lam.12882 · Cited by 238
Aging, Frailty, and the Microbiome—How Dysbiosis Influences Human Aging and Disease
Haran, J. P., & McCormick, B. A. (2020) · Gastroenterology · doi:10.1053/j.gastro.2020.09.060 · Cited by 225
Gut microbiota, cognitive frailty and dementia in older individuals: A systematic review
Ticinesi, A., Tana, C., Nouvenne, A., Prati, B., Lauretani, F., & Meschi, T. (2018) · Clinical Interventions in Aging · doi:10.2147/cia.s139163 · Cited by 215
Age-dependent changes in GI physiology and microbiota: time to reconsider?
An, R., Wilms, E., Masclee, A. A. M., Smidt, H., Zoetendal, E. G., & Jonkers, D. (2018) · Gut · doi:10.1136/gutjnl-2017-315542 · Cited by 209
Investigations of Bacteroides spp. towards next-generation probiotics
Tan, H., Zhai, Q., & Chen, W. (2018) · Food Research International · doi:10.1016/j.foodres.2018.08.088 · Cited by 228
Gut microbiota composition is associated with polypharmacy in elderly hospitalized patients
Ticinesi, A., Milani, C., Lauretani, F., Nouvenne, A., Mancabelli, L., Lugli, G. A., Turroni, F., Duranti, S., Mangifesta, M., Viappiani, A., et al. (2017) · Scientific Reports · doi:10.1038/s41598-017-10734-y · Cited by 211
Gut dysbiosis: a potential link between increased cancer risk in ageing and inflammaging
Biragyn, A., & Ferrucci, L. (2018) · The Lancet Oncology · doi:10.1016/s1470-2045(18)30095-0 · Cited by 209
Wu, L. H., Zeng, T., Zinellu, A., Rubino, S., Kelvin, D. J., & Carru, C. (2019) · mSystems · doi:10.1128/msystems.00325-19 · Cited by 201
Aging and InflammationPreprint
Singh, A., Schurman, S. H., Bektas, A., Kaileh, M., Roy, R., Wilson, D. M., Sen, R., & Ferrucci, L. (2023) · Cold Spring Harbor Perspectives in Medicine · doi:10.1101/cshperspect.a041197 · Cited by 201
Gut microbiota alterations associated with reduced bone mineral density in older adults
Das, M., Cronin, O., Keohane, D. M., Cormac, E. M., Nugent, H., Nugent, M., Molloy, C., O’Toole, P. W., Shanahan, F., Molloy, M. G., et al. (2019) · Rheumatology · doi:10.1093/rheumatology/kez302 · Cited by 185
Self-citationFood additives, contaminants and other minor components: effects on human gut microbiota—a review
Roca-Saavedra, P., Mendez-Vilabrille, V., Miranda, J. M., Lamas, A., Nebot, C., Cardelle‐Cobas, A., Cepeda, A., & Cepeda, A. (2017) · Journal of Physiology and Biochemistry · doi:10.1007/s13105-017-0564-2 · Cited by 204
The Gut Microbiota of Healthy Aged Chinese Is Similar to That of the Healthy Young
Bian, G., Gloor, G. B., Gong, A., Jia, C., Zhang, W., Hu, J., Zhang, H., Zhang, Y., Zhou, Z., Zhang, J., et al. (2017) · mSphere · doi:10.1128/msphere.00327-17 · Cited by 188
Kang, L., Li, P., Wang, D., Wang, T., Dong, H., & Qu, X. (2021) · Scientific Reports · doi:10.1038/s41598-021-84031-0 · Cited by 197
The gut microbiota as a novel regulator of cardiovascular function and disease
Battson, M. L., Lee, D. M., Weir, T. L., & Gentile, C. L. (2017) · The Journal of Nutritional Biochemistry · doi:10.1016/j.jnutbio.2017.12.010 · Cited by 191
Strasser, B., Wolters, M., Weyh, C., Krüger, K., & Ticinesi, A. (2021) · Nutrients · doi:10.3390/nu13062045 · Cited by 192
The human gut microbiome and aging
Bradley, E. S., & Haran, J. P. (2024) · Gut Microbes · doi:10.1080/19490976.2024.2359677 · Cited by 197
Longevity of centenarians is reflected by the gut microbiome with youth-associated signatures
Pang, S., Chen, X., Lu, Z., Meng, L., Huang, Y., Yu, X., Huang, L., Ye, P., Chen, X., Liang, J., et al. (2023) · Nature Aging · doi:10.1038/s43587-023-00389-y · Cited by 173
Microbiota–Gut–Brain Axis and Epilepsy: A Review on Mechanisms and Potential Therapeutics
Ding, M., Lang, Y., Shu, H., Shao, J., & Cui, L. (2021) · Frontiers in Immunology · doi:10.3389/fimmu.2021.742449 · Cited by 177
Examining the healthy human microbiome concept
Joos, R., Boucher, K., Lavelle, A., Arumugam, M., Blaser, M. J., Claesson, M. J., Clarke, G. A., Cotter, P. D., Sordi, L. D., Domínguez-Bello, M. G., et al. (2024) · Nature Reviews Microbiology · doi:10.1038/s41579-024-01107-0 · Cited by 193
Agudelo-Ochoa, G. M., Valdés-Duque, B. E., Giraldo-Giraldo, N. A., Jaillier-Ramírez, A. M., Giraldo-Villa, A., Acevedo-Castaño, I., Yepes-Molina, M. A., Barbosa-Barbosa, J., & Benítez-Paéz, A. (2020) · Gut Microbes · doi:10.1080/19490976.2019.1707610 · Cited by 166
Rajoka, M. S. R., Shi, J., Mehwish, H. M., Zhu, J., Li, Q., Shao, D., Huang, Q., & Yang, H. (2017) · Food Science and Human Wellness · doi:10.1016/j.fshw.2017.07.003 · Cited by 174
Intestinal Permeability Biomarker Zonulin is Elevated in Healthy Aging
Qi, Y., Goel, R., Kim, S., Richards, E. M., Carter, C. S., Pepine, C. J., Raizada, M. K., & Buford, T. W. (2017) · Journal of the American Medical Directors Association · doi:10.1016/j.jamda.2017.05.018 · Cited by 165
The gut microbiome as a driver of individual variation in cognition and functional behaviour
Davidson, G. L., Cooke, A. C., Johnson, C. N., & Quinn, J. L. (2018) · Philosophical Transactions of the Royal Society B Biological Sciences · doi:10.1098/rstb.2017.0286 · Cited by 155
Maynard, C., & Weinkove, D. (2018) · Sub-cellular biochemistry/Subcellular biochemistry · doi:10.1007/978-981-13-2835-0_12 · Cited by 152
Linking microbiota to human diseases: a systems biology perspective
Wu, H., Tremaroli, V., & Bäckhed, F. (2015) · Trends in Endocrinology & Metabolism · doi:10.1016/j.tem.2015.09.011 · Cited by 150
Faye, A. S., Allin, K. H., Iversen, A. T., Agrawal, M., Faith, J. J., Colombel, J., & Jess, T. (2023) · Gut · doi:10.1136/gutjnl-2022-327845 · Cited by 151
Microbiota y diabetes mellitus tipo 2
Muñoz‐Garach, A., Díaz-Perdigones, C. M., & Tinahones, F. J. (2016) · Endocrinología y Nutrición · doi:10.1016/j.endonu.2016.07.008 · Cited by 153
Dysbiosis, malnutrition and enhanced gut-lung axis contribute to age-related respiratory diseases
Saint‐Criq, V., Lugo‐Villarino, G., & Thomas, M. (2020) · Ageing Research Reviews · doi:10.1016/j.arr.2020.101235 · Cited by 152
Antibiotic-induced collateral damage to the microbiota and associated infections
de Nies, L., Kobras, C. M., & Stracy, M. (2023) · Nature Reviews Microbiology · doi:10.1038/s41579-023-00936-9 · Cited by 156
Dietary Protein and Muscle in Aging People: The Potential Role of the Gut Microbiome
Lochlainn, M. N., Bowyer, R. C. E., & Steves, C. J. (2018) · Nutrients · doi:10.3390/nu10070929 · Cited by 142
Genomics and metagenomics of trimethylamine-utilizing Archaea in the human gut microbiome
Borrel, G., McCann, A., Deane, J., Neto, M. C., Lynch, D. B., Brugère, J., & O’Toole, P. W. (2017) · The ISME Journal · doi:10.1038/ismej.2017.72 · Cited by 137
Self-citationSims, T. T., El Alam, M. B., Karpinets, T. V., Dorta-Estremera, S., Hegde, V. L., Nookala, S., Yoshida-Court, K., Wu, X., Biegert, G. W. G., Delgado Medrano, A. Y., et al. (2021) · Communications Biology · doi:10.1038/s42003-021-01741-x · Cited by 135
Toward an improved definition of a healthy microbiome for healthy aging
Ghosh, T. S., Shanahan, F., & O’Toole, P. W. (2022) · Nature Aging · doi:10.1038/s43587-022-00306-9 · Cited by 133
Self-citationSynthetic microbial communities (SynComs) of the human gut: design, assembly, and applications
van Leeuwen, P. T., Brul, S., Zhang, J., & Wortel, M. T. (2023) · FEMS Microbiology Reviews · doi:10.1093/femsre/fuad012 · Cited by 132
Tottey, W., Feria-Gervasio, D., Gaci, N., Laillet, B., Pujos, E., Martin, J.-F., Sebedio, J.-L., Sion, B., Jarrige, J.-F., Alric, M., et al. (2017) · Journal of Neurogastroenterology and Motility · doi:10.5056/jnm16042 · Cited by 125
Age-related changes in intestinal immunity and the microbiome
Walrath, T., Dyamenahalli, K. U., Hulsebus, H. J., McCullough, R. L., Idrovo, J., Boe, D. M., McMahan, R. H., & Kovacs, E. J. (2020) · Journal of Leukocyte Biology · doi:10.1002/jlb.3ri0620-405rr · Cited by 129
New insights into therapeutic strategies for gut microbiota modulation in inflammatory diseases
Vieira, A. T., Fukumori, C., & Ferreira, C. M. (2016) · Clinical & Translational Immunology · doi:10.1038/cti.2016.38 · Cited by 125
Gut microbiota and old age: Modulating factors and interventions for healthy longevity
Coman, V., & Vodnar, D. C. (2020) · Experimental Gerontology · doi:10.1016/j.exger.2020.111095 · Cited by 129
Microbiome-health interactions in older people
O’Toole, P. W., & Jeffery, I. B. (2018) · Cellular and Molecular Life Sciences · doi:10.1007/s00018-017-2673-z · Cited by 117
Gut microbiota and type 2 diabetes mellitus
Muñoz‐Garach, A., Díaz-Perdigones, C. M., & Tinahones, F. J. (2016) · Endocrinología y Nutrición (English Edition) · doi:10.1016/j.endoen.2016.07.004 · Cited by 119
Caenorhabditis elegans: a model to understand host–microbe interactions
Kumar, A., Baruah, A., Tomioka, M., Iino, Y., Kalita, M. C., & Khan, M. R. (2019) · Cellular and Molecular Life Sciences · doi:10.1007/s00018-019-03319-7 · Cited by 126
Metagenomic Approaches to Assess Bacteriophages in Various Environmental Niches
Hayes, S., Mahony, J., Nauta, A., & van Sinderen, D. (2017) · Viruses · doi:10.3390/v9060127 · Cited by 119
Rethinking Diet to Aid Human–Microbe Symbiosis
Derrien, M., & Veiga, P. (2016) · Trends in Microbiology · doi:10.1016/j.tim.2016.09.011 · Cited by 118
Role of gut microbiota in aging-related health decline: insights from invertebrate models
Clark, R. I., & Walker, D. W. (2017) · Cellular and Molecular Life Sciences · doi:10.1007/s00018-017-2671-1 · Cited by 121
Three New Escherichia coli Phages from the Human Gut Show Promising Potential for Phage Therapy
Dalmasso, M., Strain, R., Neve, H., Franz, C. M. A. P., Cousin, F., Ross, R. P., & Hill, C. (2016) · PLoS ONE · doi:10.1371/journal.pone.0156773 · Cited by 110
Tran, T. T. T., Cousin, F., Lynch, D. B., Menon, R., Brulc, J. M., Brown, J. R.-M., O’Herlihy, E. A., Buttó, L. F., Power, K., Jeffery, I. B., et al. (2019) · Microbiome · doi:10.1186/s40168-019-0654-1 · Cited by 112
Self-citationImpact of Melatonin on Skeletal Muscle and Exercise
Stacchiotti, A., Favero, G., & Rodella, L. F. (2020) · Cells · doi:10.3390/cells9020288 · Cited by 116
Sims, T. T., Colbert, L. E., Zheng, J., Delgado Medrano, A. Y., Hoffman, K. L., Ramondetta, L., Jazaeri, A., Jhingran, A., Schmeler, K. M., Daniel, C. R., et al. (2019) · Gynecologic Oncology · doi:10.1016/j.ygyno.2019.09.002 · Cited by 100
The gut microbiota–brain axis in neurological disorders
You, M., Chen, N., Yang, Y., Cheng, L., He, H., Cai, Y., Liu, Y., Liu, H., & Hong, G. (2024) · MedComm · doi:10.1002/mco2.656 · Cited by 113
The gut microbiota as a key regulator of visceral pain
O’Mahony, S. M., Dinan, T. G., & Cryan, J. F. (2016) · Pain · doi:10.1097/j.pain.0000000000000779 · Cited by 104
Microbiota and Diabetes Mellitus: Role of Lipid Mediators
Salazar, J. J., Angarita, L., Morillo, V., Navarro, C., Martínez, M. S., Chacín, M., Torres, W., Rajotia, A., Rojas, M., Cano, C., et al. (2020) · Nutrients · doi:10.3390/nu12103039 · Cited by 97
Figueroa-Romero, C., Guo, K., Murdock, B. J., Paez-Colasante, X., Bassis, C. M., Mikhail, K. A., Raue, K. D., Evans, M. C., Taubman, G. F., McDermott, A. J., et al. (2019) · Disease Models & Mechanisms · doi:10.1242/dmm.041947 · Cited by 94
Wu, L. H., Zeng, T., Deligios, M., Milanesi, L., Langille, M. G. I., Zinellu, A., Rubino, S., Carru, C., & Kelvin, D. J. (2020) · mSphere · doi:10.1128/msphere.00558-19 · Cited by 96
Ali, A. M., & Kunugi, H. (2020) · Foods · doi:10.3390/foods9101362 · Cited by 103
The Intestinal Barrier Dysfunction as Driving Factor of Inflammaging
Untersmayr, E., Brandt, A., Koidl, L., & Bergheim, I. (2022) · Nutrients · doi:10.3390/nu14050949 · Cited by 104
Evolving trends in next-generation probiotics: a 5W1H perspective
Almeida, D., Machado, D., Andrade, J. C., Mendo, S., Gomes, A. M., & Freitas, A. C. (2020) · Critical Reviews in Food Science and Nutrition · doi:10.1080/10408398.2019.1599812 · Cited by 92
Microbiota-gut-brain axis and toll-like receptors in Alzheimer’s disease
Lin, C., Zhao, S., Zhu, Y., Fan, Z., Wang, J., Zhang, B., & Chen, Y. (2019) · Computational and Structural Biotechnology Journal · doi:10.1016/j.csbj.2019.09.008 · Cited by 94
Gut microbiota development across the lifespan: Disease links and health‐promoting interventions
Schoultz, I., Claesson, M. J., Domínguez-Bello, M. G., Hållenius, F. F., Konturek, P. C., Korpela, K., Laursen, M. F., Penders, J., Roager, H. M., Vatanen, T., et al. (2025) · Journal of Internal Medicine · doi:10.1111/joim.20089 · Cited by 108
Interventions on Gut Microbiota for Healthy Aging
Zeppa, S. D., Agostini, D., Ferrini, F., Gervasi, M., Barbieri, E., Bartolacci, A., Piccoli, G., Saltarelli, R., Sestili, P., & Stocchi, V. (2022) · Cells · doi:10.3390/cells12010034 · Cited by 98
Bartley, J. M., Zhou, X., Kuchel, G. A., Weinstock, G. M., & Haynes, L. (2017) · Frontiers in Immunology · doi:10.3389/fimmu.2017.01164 · Cited by 87
The Influence of Nutrition on Intestinal Permeability and the Microbiome in Health and Disease
Inczefi, O., Bacsúr, P., Resál, T., Keresztes, C., & Molnár, T. (2022) · Frontiers in Nutrition · doi:10.3389/fnut.2022.718710 · Cited by 90
Wolters, M., Volkert, D., Streicher, M., Kiesswetter, E., Torbahn, G., O’Connor, E. M., O’Keeffe, M., Kelly, M. P., O’Herlihy, E. A., O’Toole, P. W., et al. (2018) · Clinical Nutrition · doi:10.1016/j.clnu.2018.10.020 · Cited by 84
Self-citationInfluence of the Mediterranean Diet on Healthy Aging
Andreo-López, M. C., Contreras-Bolívar, V., Muñoz‐Torres, M., García-Fontana, B., & García‐Fontana, C. (2023) · International Journal of Molecular Sciences · doi:10.3390/ijms24054491 · Cited by 94
The influence of gut microbiota alteration on age-related neuroinflammation and cognitive decline
Shah, Z., & Alsegiani, A. S. (2022) · Neural Regeneration Research · doi:10.4103/1673-5374.335837 · Cited by 89
Age-dependent remodeling of gut microbiome and host serum metabolome in mice
Wu, C., Muthyala, S. D. V., Klemashevich, C. L., Ufondu, A., Menon, R., Chen, Z., Devaraj, S., Jayaraman, A., & Sun, Y. (2021) · Aging · doi:10.18632/aging.202525 · Cited by 88
How Microbiomes Affect Skin Aging: The Updated Evidence and Current Perspectives
Ratanapokasatit, Y., Laisuan, W., Rattananukrom, T., Petchlorlian, A., Thaipisuttikul, I., & Sompornrattanaphan, M. (2022) · Life · doi:10.3390/life12070936 · Cited by 88
Advances in the Involvement of Gut Microbiota in Pathophysiology of NAFLD
Jiang, X., Zheng, J., Zhang, S., Wang, B., Wu, C., & Guo, X. (2020) · Frontiers in Medicine · doi:10.3389/fmed.2020.00361 · Cited by 80
Interaction between the microbiota and the skin barrier in aging skin: a comprehensive review
Woo, Y. R., & Kim, H. S. (2024) · Frontiers in Physiology · doi:10.3389/fphys.2024.1322205 · Cited by 93
Composition and richness of the serum microbiome differ by age and link to systemic inflammation
Buford, T. W., Carter, C. S., Pol, W. J. V. D., Chen, D., Lefkowitz, E. J., Eipers, P. G., Morrow, C. D., & Bamman, M. M. (2018) · GeroScience · doi:10.1007/s11357-018-0026-y · Cited by 77
Gut Microbiota Associations with Metabolic Health and Obesity Status in Older Adults
Zhong, X., Harrington, J. M., Millar, S., Perry, I. J., O’Toole, P. W., & Phillips, C. M. (2020) · Nutrients · doi:10.3390/nu12082364 · Cited by 76
Self-citationLiu, W., Russel, J., Røder, H. L., Madsen, J. S., Burmølle, M., & Sørensen, S. J. (2017) · Environmental Microbiology · doi:10.1111/1462-2920.13816 · Cited by 75
Metadata
- Authors
- Jeffery, I. B., Lynch, D. B., & O’Toole, P. W.
- Affiliations
- University College Cork (IE)
- Venue
- The ISME Journal
- Publisher
- Oxford University Press (OUP)
- Published
- 2015-06-19
- Volume
- 10
- Issue
- 1
- Pages
- 170-182
- ISSN
- 1751-7362 (ISSN-L)
- 1751-7370
- PMC
- PMC4681863
- OpenAlex
- W1549775244
- Cited by
- 421
- References
- 37
- Citations by year
- 2026: 30 · 2025: 40 · 2024: 49 · 2023: 29 · 2022: 45 · 2021: 66 · 2020: 43 · 2019: 35 · 2018: 26 · 2017: 34 · 2016: 21 · 2015: 3
- FWCI
- 12.16
- Type
- journal article
- Language
- en
- Open access
- hybrid
- doi.org
- Licence
- Locations
- The ISME Journal (publishedVersion, cc-by-nc-sa)
- PubMed Central (publishedVersion, cc-by-nc-sa)
- PubMed (publishedVersion)
- Arrow@dit (Dublin Institute of Technology) (submittedVersion, cc-by-nc-sa)
- Cork Open Research Archive (University College Cork, Ireland) (submittedVersion, cc-by-nc-sa)
- Funders
- General Mills
- Science Foundation Ireland (SFI/12/RC/, 12/RC/2273, 12/RC/, SFI/12/RC/2273., 13/SIRG/2128)
- Topics
- Life Sciences › Biochemistry, Genetics and Molecular Biology › Molecular Biology › Gut microbiota and health
- Health Sciences › Dentistry › Periodontics › Oral microbiology and periodontitis research
- Physical Sciences › Environmental Science › Ecology › Microbial Community Ecology and Physiology
- Keywords
- gut microbiota, aging, older adults, temporal stability, microbiota composition, long-term care, community-dwelling older adults, antibiotic use, microbiome diversity, change of direction
- MeSH terms
- Gastrointestinal Microbiome, Aged, Aged, 80 and over, Aging, Bacteria, Diet, Feces, Female, Humans, Male, Phylogeny, Residential Facilities, Gastrointestinal Tract
About these checks
Registry, retraction, Cites and statistics results are computed, not judged, with one exception: a printed reference that no index lists is read once by a model before it counts as a citation error. Claims are extracted by a model and kept only when their quote appears verbatim in the text; each cited source is then checked, with a model’s help, for whether it says what the claim relies on. Those verdicts can be wrong — read the claim’s quote and the cited source before relying on one.
Statistics and arithmetic are recomputed, not judged.
Confidence bands are shown only for fields calibrated on our annotated test set. None is calibrated yet, so no band is shown.
What counts as a claim ›How we measure confidence ›How we check this ›
Are you an author, or do you see a problem with this page? Request a review
