

The DOI matches its Crossref record; 64 of the 64 references it cites were found in a registry or an index; 5 of the 52 sources its claims cite were checked for support.
Perineuronal nets decrease membrane capacitance of peritumoral fast spiking interneurons in a model of epilepsy
Open accessAbstract
Brain tumor patients commonly present with epileptic seizures. We show that tumor-associated seizures are the consequence of impaired GABAergic inhibition due to an overall loss of peritumoral fast spiking interneurons (FSNs) concomitant with a significantly reduced firing rate of those that remain. The reduced firing is due to the degradation of perineuronal nets (PNNs) that surround FSNs. We show that PNNs decrease specific membrane capacitance of FSNs permitting them to fire action potentials at supra-physiological frequencies. Tumor-released proteolytic enzymes degrade PNNs, resulting in increased membrane capacitance, reduced firing, and hence decreased GABA release. These studies uncovered a hitherto unknown role of PNNs as an electrostatic insulator that reduces specific membrane capacitance, functionally akin to myelin sheaths around axons, thereby permitting FSNs to exceed physiological firing rates. Disruption of PNNs may similarly account for excitation-inhibition imbalances in other forms of epilepsy and PNN protection through proteolytic inhibition may provide therapeutic benefits.
Overview
AI snapshot
Written from the paper’s full text.
TL;DR
In a patient-derived glioma mouse model, peritumoral fast-spiking interneurons (FSNs) lose perineuronal nets (PNNs) through tumor-released MMPs, increasing membrane capacitance and reducing firing. PNNs act as an electrostatic insulator that lowers specific membrane capacitance, allowing FSNs to sustain supra-physiological firing; MMP inhibition preserves PNNs and FSN excitability.
Key findings
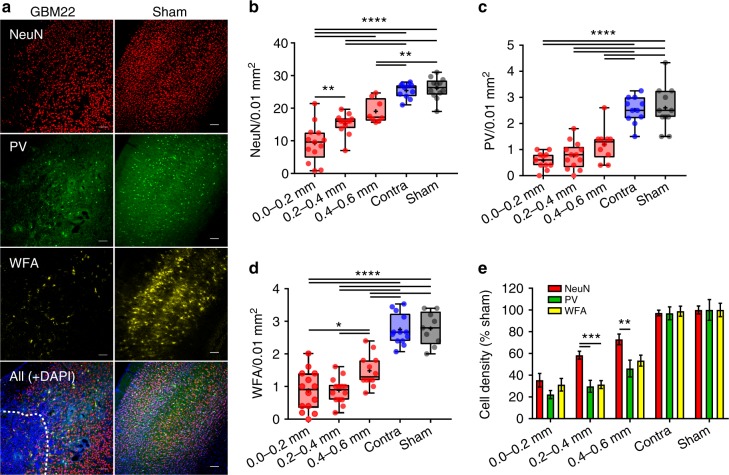
- Peritumoral cortex within 0.6 mm showed distance-dependent neuronal loss: NeuN+ density at 0.0–0.2 mm was 9.25 ± 1.63 vs contralateral 25.41 ± 0.68 and sham 26.12 ± 0.94; PV+ density at 0.0–0.2 mm was 0.58 ± 0.1 vs contralateral 2.52 ± 0.15 and sham 2.6 ± 0.25; WFA+ PNN density at 0.0–0.2 mm was 0.87 ± 0.16 vs contralateral 2.75 ± 0.13 and sham 2.78 ± 0.17.
- Glioma-released gelatinases/MMPs degraded PNNs: gelatinase activity was higher in glioma mass (1851.47 ± 120.17) and PTC than sham (669.96 ± 34.56); the MMP inhibitor GM6001 reduced gelatinase activity and preserved PNN structure, with more WFA peaks in PNNs (GM6001 15.16 ± 0.65 vs GBM22 7.08 ± 0.63).
- Peritumoral FSNs had higher membrane capacitance (43.84 ± 3.74 pF) than contralateral (28.82 ± 2.14 pF) and sham (30.11 ± 1.99 pF), and firing frequency was reduced by ~50%; GM6001 restored FSN capacitance (28.27 ± 1.36 pF) and input–output curves toward sham.
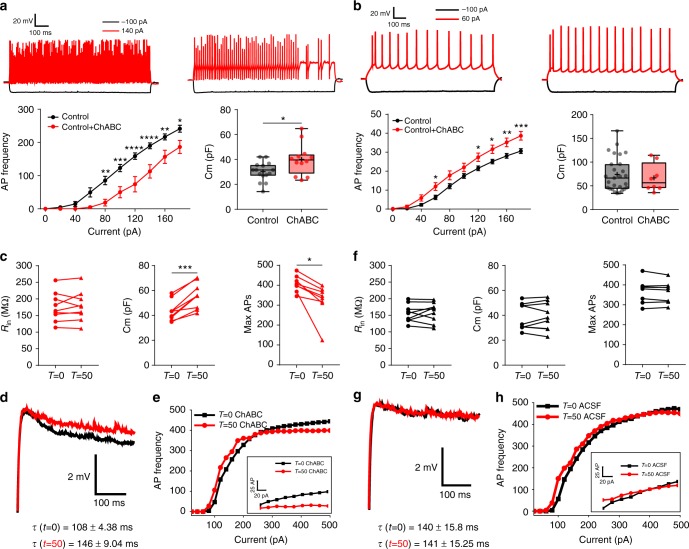
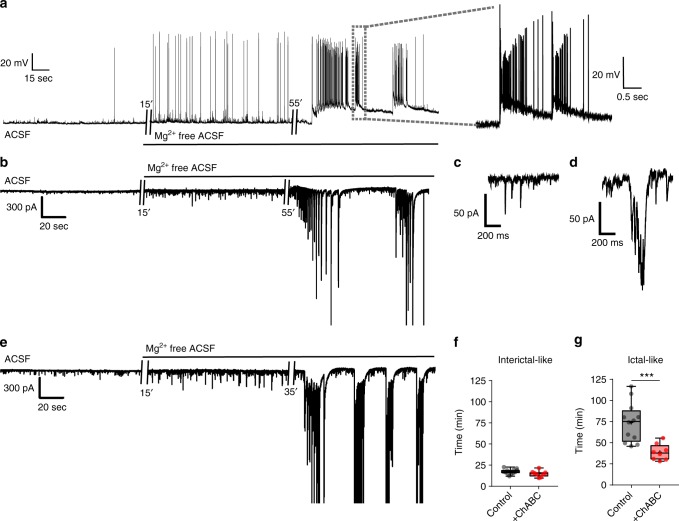
- ChABC digestion of PNNs phenocopied the FSN changes: capacitance increased ~20–25%, maximal firing frequency fell ~20%, and real-time ChABC increased Cm from 43.53 ± 2.70 to 55.76 ± 3.43 pF while max AP frequency fell from 406.62 ± 14.39 to 322.5 ± 30.27 Hz; PNN degradation also shortened latency to ictal-like activity (control 73.67 ± 6.69 min vs ChABC 38.83 ± 3.40 min).
Methods
- Patient-derived glioma xenolines GBM22 (glutamate-releasing via SXC) and GBM14 (non-glutamate-releasing) were implanted into C.B.17 scid mouse cortex; sham and contralateral controls were used, along with an astrocyte-specific β1-integrin knockout mouse model of astrogliosis and GM6001 MMP-inhibitor treatment.
- Immunohistochemistry and confocal imaging quantified NeuN, PV, WFA-labeled PNNs, and GFAP; in situ zymography measured MMP-2/9 gelatinase activity; PNN integrity was assessed by WFA intensity and line-profile peak counts.
- Acute slice patch-clamp electrophysiology recorded excitatory neurons and FSNs, with Lucifer yellow postrecording identification; PNNs were digested with ChABC, and Hodgkin–Huxley/Neuronify modeling plus ANOVA/t-tests were used for analysis.
Limitations
- Stated in the paper: experimental limitations including incubation duration and low enzymatic activity prevented sufficient PNN degradation using an MMP cocktail, so ChABC was used instead.
- Stated in the paper: PNN degradation may also alter synaptic activity and network excitability beyond the membrane-capacitance mechanism, and additional studies are warranted.
- Evident from the text: the core evidence comes from mouse glioma models and acute slices, not human tissue; ChABC degrades CSPGs broadly rather than only PNNs, and some mechanistic links between tumor-released MMPs and PNN loss rely on spatial correlation plus inhibitor rescue rather than direct causal isolation.
Model-written summary. Check it against the paper before relying on it.
Integrity signals
Registry
Cites
Statistics
Figures
Verification
Claims the paper makes
72 Own result · 35 Own interpretation · 25 Not checked yet · 11 Own method · 2 No basis given · 1 Supported · 1 Supported so far · 1 Partly supported · accuracy not yet measured
The cited sources support only part of this claim — read each source’s verdict below.
In the paper
“the remaining GABAergic neurons show a significantly reduced inhibitory potential.”
§ Perineuronal nets decrease membrane capacitance of peritumoral fast spiking interneurons in a model of epilepsy > Introduction
What the sources say
- Supportedcites [3] Campbell, S. L. et al. GABAergic disinhibition and impaired KCC2 cotransporter activity underlie tumor‐associated epilepsy. Glia 63, 23–36 (2015). source
The Discussion says that, in addition to interneuron loss, GABA activity changed in a significant percentage of surviving interneurons. The Results section on altered inhibitory synaptic transmission also reports significantly reduced inhibitory currents in peritumoral cortex. Together, these support the claim of reduced inhibitory potential, though the currents were recorded from pyramidal cells rather than directly from the surviving interneurons. (LLM, conf=0.88)
- Partly supportedcites [5] Pallud, J. et al. Cortical GABAergic excitation contributes to epileptic activities around human glioma. Sci. Transl. Med. 6, 244ra289 (2014). sourceExperimental — accuracy not yet measured
The Results (Depolarizing responses to GABA during IIDs; page unavailable) show that GABAergic signaling depolarized about 60% of pyramidal cells near an interictal-discharge focus. The Discussion describes reduced efficacy of GABAergic inhibition, but the paper attributes this to altered chloride handling in the cells receiving GABA; it does not show that the remaining GABAergic neurons themselves have a significantly reduced inhibitory potential. (LLM, conf=0.84)
plain- Asserted: passes — The authors put it forward as true.
- Checkable: passes — It can be checked against evidence.
- Load-bearing: passes — The paper’s conclusions depend on it.
- Based: passes — The paper gives a reason why it holds.
- Supported
A result the paper reports from its own data — it cites no other source for it, so there is none to check. The quote shows it is in the paper.
In the paper
“This was not due to altered Vm of FSNs in GBM22 PTC as clamping them at −60, −65, or −70 mV did not change their firing frequency (Supplementary Fig. 5a).”
§ Perineuronal nets decrease membrane capacitance of peritumoral fast spiking interneurons in a model of epilepsy > Results > Biophysical changes in peritumoral neurons
plainSingle case- Asserted: passes — The authors put it forward as true.
- Checkable: passes — It can be checked against evidence.
- Load-bearing: passes — The paper’s conclusions depend on it.
- Based: passes — The paper gives a reason why it holds.
The paper states this without a source or data behind it here, so there is nothing to check it against. The quote shows it is in the paper.
In the paper
“As our results attribute peritumoral PNN degradation primarily to glioma-released MMPs (MMP-2, MMP-3, and MMP-9), we used a cocktail of these MMPs to degrade PNNs experimentally.”
§ Perineuronal nets decrease membrane capacitance of peritumoral fast spiking interneurons in a model of epilepsy > Results > PNNs modulate firing of FSNs
plaindirect- Asserted: passes — The authors put it forward as true.
- Checkable: passes — It can be checked against evidence.
- Load-bearing: passes — The paper’s conclusions depend on it.
- Based: passes — The paper gives a reason why it holds.
A result the paper reports from its own data — it cites no other source for it, so there is none to check. The quote shows it is in the paper.
In the paper
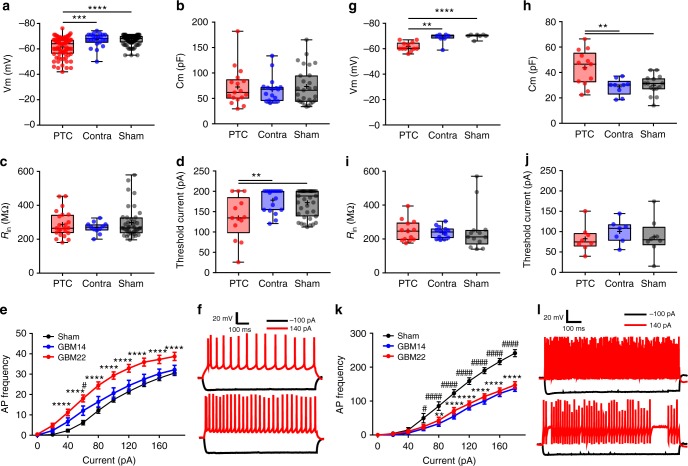
“but showed significantly higher Cm (Fig. 6h).”
§ Perineuronal nets decrease membrane capacitance of peritumoral fast spiking interneurons in a model of epilepsy > Results > Biophysical changes in peritumoral neurons
plain- Asserted: passes — The authors put it forward as true.
- Checkable: passes — It can be checked against evidence.
- Load-bearing: passes — The paper’s conclusions depend on it.
- Based: passes — The paper gives a reason why it holds.
A result the paper reports from its own data — it cites no other source for it, so there is none to check. The quote shows it is in the paper.
In the paper
“Spike frequency in GBM22 contralateral half remained similar to sham (Supplementary Fig. 4e).”
§ Perineuronal nets decrease membrane capacitance of peritumoral fast spiking interneurons in a model of epilepsy > Results > Biophysical changes in peritumoral neurons
plain- Asserted: passes — The authors put it forward as true.
- Checkable: passes — It can be checked against evidence.
- Load-bearing: unclear — It is unclear whether the paper’s conclusions depend on it.
- Based: passes — The paper gives a reason why it holds.
A result the paper reports from its own data — it cites no other source for it, so there is none to check. The quote shows it is in the paper.
In the paper
“Peritumoral FSNs were similarly depolarized (Fig. 6g)”
§ Perineuronal nets decrease membrane capacitance of peritumoral fast spiking interneurons in a model of epilepsy > Results > Biophysical changes in peritumoral neurons
plain- Asserted: passes — The authors put it forward as true.
- Checkable: passes — It can be checked against evidence.
- Load-bearing: unclear — It is unclear whether the paper’s conclusions depend on it.
- Based: passes — The paper gives a reason why it holds.
A result the paper reports from its own data — it cites no other source for it, so there is none to check. The quote shows it is in the paper.
In the paper
“and showed even greater distance-dependent decrease in density with >5-fold decrease in the closest proximity of tumor (Fig. 1c).”
§ Perineuronal nets decrease membrane capacitance of peritumoral fast spiking interneurons in a model of epilepsy > Results > Neuronal loss and PNN disruption in the peritumoral brain
plaincorrelational- Asserted: passes — The authors put it forward as true.
- Checkable: passes — It can be checked against evidence.
- Load-bearing: passes — The paper’s conclusions depend on it.
- Based: passes — The paper gives a reason why it holds.
A result the paper reports from its own data — it cites no other source for it, so there is none to check. The quote shows it is in the paper.
In the paper
“NeuN+ cells showed ~3-fold lower density in the immediate tumor vicinity than that in contralateral or sham-injected controls (Fig. 1a, b).”
§ Perineuronal nets decrease membrane capacitance of peritumoral fast spiking interneurons in a model of epilepsy > Results > Neuronal loss and PNN disruption in the peritumoral brain
plaincorrelational- Asserted: passes — The authors put it forward as true.
- Checkable: passes — It can be checked against evidence.
- Load-bearing: passes — The paper’s conclusions depend on it.
- Based: passes — The paper gives a reason why it holds.
A result the paper reports from its own data — it cites no other source for it, so there is none to check. The quote shows it is in the paper.
In the paper
“whereas the Glu-releasing tumors (GBM22) decreased NeuN+ cells to ~50–60% within 0.2–0.6 mm PTC.”
§ Perineuronal nets decrease membrane capacitance of peritumoral fast spiking interneurons in a model of epilepsy > Results > Neuronal loss and PNN disruption in the peritumoral brain
plaindirect- Asserted: passes — The authors put it forward as true.
- Checkable: passes — It can be checked against evidence.
- Load-bearing: passes — The paper’s conclusions depend on it.
- Based: passes — The paper gives a reason why it holds.
A result the paper reports from its own data — it cites no other source for it, so there is none to check. The quote shows it is in the paper.
In the paper
“PTC neurons were also significantly depolarized (Fig. 6a)”
§ Perineuronal nets decrease membrane capacitance of peritumoral fast spiking interneurons in a model of epilepsy > Results > Biophysical changes in peritumoral neurons
plain- Asserted: passes — The authors put it forward as true.
- Checkable: passes — It can be checked against evidence.
- Load-bearing: passes — The paper’s conclusions depend on it.
- Based: passes — The paper gives a reason why it holds.
- It may state two separate claims as one. 57
- Probably not a substantial claim. 25
- The quote only partly states this claim. 1
Every source the paper cites for this claim was checked and supports it.
In the paper
“Glu release, while necessary, is insufficient to drive peritumoral epilepsy3. Rather an additional loss of GABAergic inhibition is required”
§ Perineuronal nets decrease membrane capacitance of peritumoral fast spiking interneurons in a model of epilepsy > Introduction
What the sources say
- Supportedcites [3] Campbell, S. L. et al. GABAergic disinhibition and impaired KCC2 cotransporter activity underlie tumor‐associated epilepsy. Glia 63, 23–36 (2015). source
The Discussion (page unavailable) says that peritumoral glutamate is necessary but not sufficient for tumor-associated epilepsy and identifies altered GABAergic inhibition as the additional factor that increases seizure susceptibility. The Introduction (page unavailable) reports that epilepsy developed only when increased glutamate-release capacity and decreased KCC2 were both present. (LLM, conf=0.91)
plaindirect- Asserted: passes — The authors put it forward as true.
- Checkable: passes — It can be checked against evidence.
- Load-bearing: passes — The paper’s conclusions depend on it.
- Based: passes — The paper gives a reason why it holds.
It may state two separate claims as one.
- Supported
The sources with a verdict support this claim; the rest weren’t checked yet, have no full text we could read, or their verdicts aren’t rated yet.
In the paper
“While we suggest a pivotal role for the MMP activity in glioma-associated epilepsy, heightened MMP activity has also been reported in other models of epilepsy46 with elevated MMP level being associated with epileptiform activity47–50.”
§ Perineuronal nets decrease membrane capacitance of peritumoral fast spiking interneurons in a model of epilepsy > Discussion
What the sources say
- Supportedcites [46] Dubey, D. et al. Increased metalloproteinase activity in the hippocampus following status epilepticus. Epilepsy Res. 132, 50–58 (2017). source
The citation to this paper is attached to the claim that heightened MMP activity has been reported in another epilepsy model, not to the subsequent claim cited to references 47–50. The Discussion reports increased global MMP activity in the hippocampus following status epilepticus, including increased MMP13 activity. (LLM, conf=0.93)
- Not checked yetcites [47] Jourquin, J. et al. Neuronal activity‐dependent increase of net matrix metalloproteinase activity is associated with MMP‐9 neurotoxicity after kainate. Eur. J. Neurosci. 18, 1507–1517 (2003). source
- Not checked yetcites [48] Kim, G. W. et al. The role of MMP-9 in integrin-mediated hippocampal cell death after pilocarpine-induced status epilepticus. Neurobiol. Dis. 36, 169–180 (2009). source
- Supportedcites [49] Szklarczyk, A., Lapinska, J., Rylski, M., McKay, R. D. & Kaczmarek, L. Matrix metalloproteinase-9 undergoes expression and activation during dendritic remodeling in adult hippocampus. J. Neurosci. 22, 920–930 (2002). source
The section “Kainate differentially regulates MMP-9 and MMP-2 gene expression and enzymatic activity” reports increased MMP-9 activity after kainate treatment in a rat model involving limbic seizures. The section on regulation of MMP-9 further reports increased MMP-9 protein after seizures, followed by enzymatic activation. This supports the cited paper as an example of elevated MMP activity associated with epileptiform activity. (LLM, conf=0.91)
- Not checked yetcites [50] Takács, E. et al. Matrix metalloproteinase-9 activity increased by two different types of epileptic seizures that do not induce neuronal death: a possible role in homeostatic synaptic plasticity. Neurochem. Int. 56, 799–809 (2010). source
plaincorrelational- Asserted: passes — The authors put it forward as true.
- Checkable: passes — It can be checked against evidence.
- Load-bearing: fails — The paper’s conclusions may not depend on it.
- Based: passes — The paper gives a reason why it holds.
Probably not a substantial claim. The paper’s conclusions may not depend on it. It may state two separate claims as one.
- Supported
A result the paper reports from its own data — it cites no other source for it, so there is none to check. The quote shows it is in the paper.
In the paper
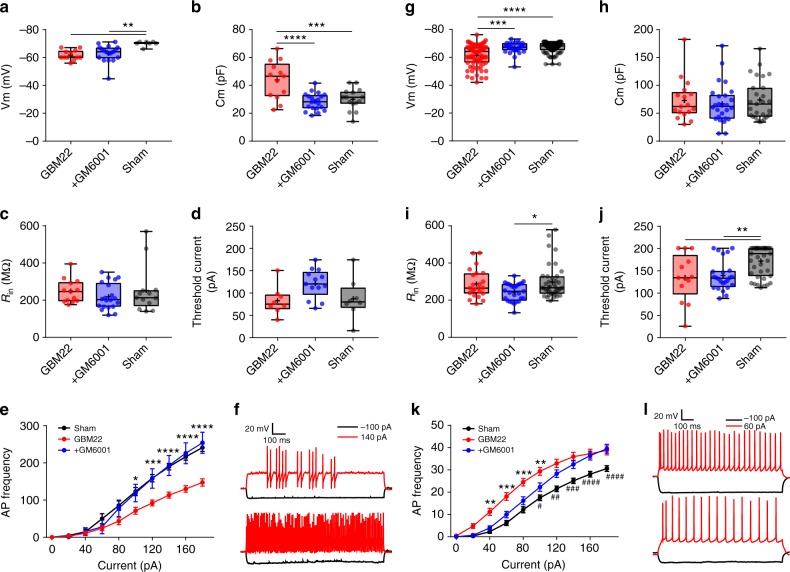
“This indeed nullified the changes in firing threshold and Vm with no apparent difference to sham or contralateral brains (Fig. 6e, Supplementary Fig. 4b, c).”
§ Perineuronal nets decrease membrane capacitance of peritumoral fast spiking interneurons in a model of epilepsy > Results > Biophysical changes in peritumoral neurons
plain- Asserted: passes — The authors put it forward as true.
- Checkable: passes — It can be checked against evidence.
- Load-bearing: passes — The paper’s conclusions depend on it.
- Based: passes — The paper gives a reason why it holds.
It may state two separate claims as one.
A result the paper reports from its own data — it cites no other source for it, so there is none to check. The quote shows it is in the paper.
In the paper
“Lower Cm of FSNs in the PTC of GM6001-treated (28.27 ± 1.36, n = 20(5)) than nontreated (43.84 ± 3.74, n = 13(8)), but similar to sham (30.11 ± 1.99, n = 15(6)).”
- Also stated in: § Biophysical changes in peritumoral neurons · boosted
“Most importantly, FSNs in GM6001-treated mice brain slices showed profound differences in Cm and input−output curves, and both were essentially identical to the sham (Fig. 7b, e, f).”
§ Perineuronal nets decrease membrane capacitance of peritumoral fast spiking interneurons in a model of epilepsy > Results > Biophysical changes in peritumoral neurons
boostedn = 20- Asserted: passes — The authors put it forward as true.
- Checkable: passes — It can be checked against evidence.
- Load-bearing: passes — The paper’s conclusions depend on it.
- Based: passes — The paper gives a reason why it holds.
It may state two separate claims as one.
- Also stated in: § Biophysical changes in peritumoral neurons · boosted
A result the paper reports from its own data — it cites no other source for it, so there is none to check. The quote shows it is in the paper.
In the paper
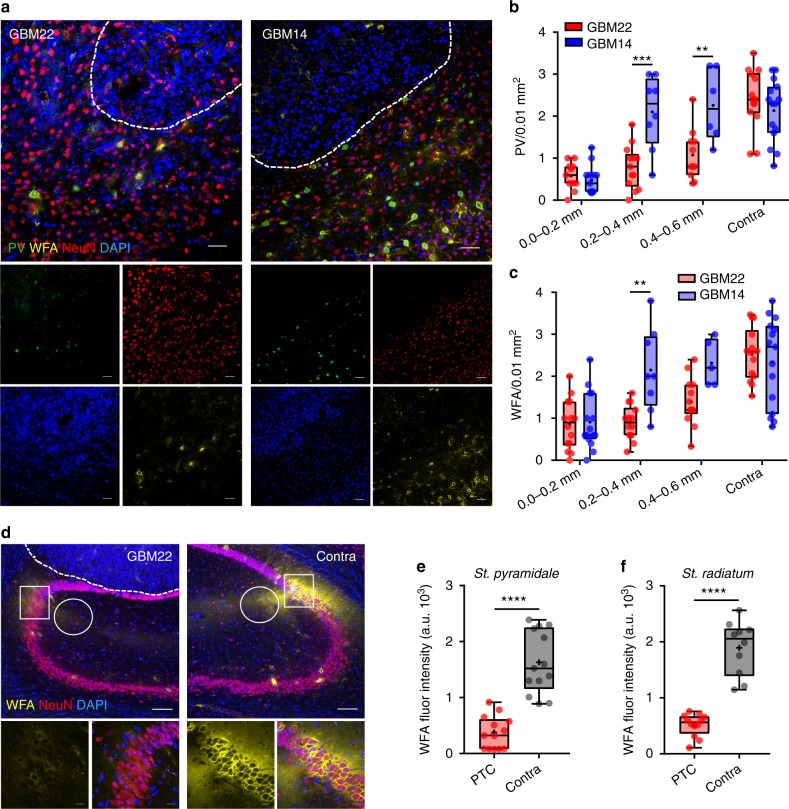
“In GBM14, WFA staining showed largely intact PNNs even in close proximity to the tumor (0.2–0.4 mm), whereas in GBM22, PNNs were largely degraded (Fig. 3a, c).”
§ Perineuronal nets decrease membrane capacitance of peritumoral fast spiking interneurons in a model of epilepsy > Results > Neuronal loss and PNN disruption in the peritumoral brain
plain- Asserted: passes — The authors put it forward as true.
- Checkable: passes — It can be checked against evidence.
- Load-bearing: passes — The paper’s conclusions depend on it.
- Based: passes — The paper gives a reason why it holds.
It may state two separate claims as one.
A result the paper reports from its own data — it cites no other source for it, so there is none to check. The quote shows it is in the paper.
In the paper
“Input resistance (Rin) of excitatory neurons in GM6001-treated PTC (244.64 ± 9.24, n = 27(6)) was not significantly different than in nontreated PTC (288.18 ± 15.82, n = 23(10)), but than in sham (298.63 ± 14.47, n = 39(10)).”
§ Perineuronal nets decrease membrane capacitance of peritumoral fast spiking interneurons in a model of epilepsy > Results > Biophysical changes in peritumoral neurons
plainn = 27- Asserted: passes — The authors put it forward as true.
- Checkable: passes — It can be checked against evidence.
- Load-bearing: unclear — It is unclear whether the paper’s conclusions depend on it.
- Based: passes — The paper gives a reason why it holds.
It may state two separate claims as one.
A result the paper reports from its own data — it cites no other source for it, so there is none to check. The quote shows it is in the paper.
In the paper
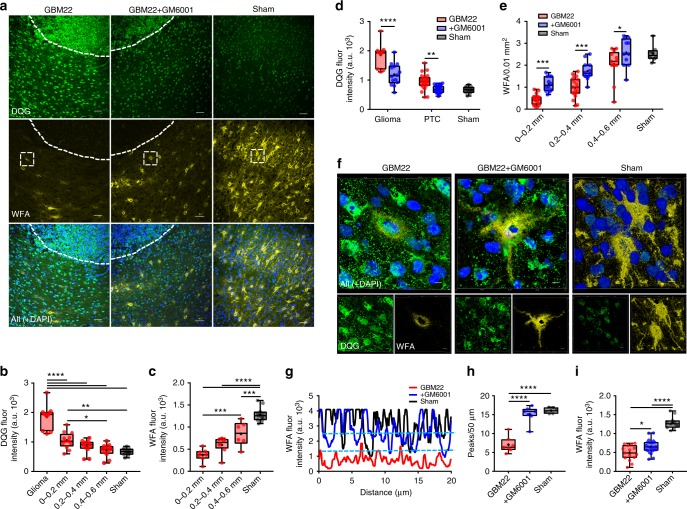
“Indeed, GM6001-treated mice retained structural integrity of PNNs in the PTC (Fig. 5f−i) as evident by the presence of PNNs around cell body and proximal dendrites (Fig. 5f, middle panels), more WFA peaks (Fig. 5g, h), and higher WFA intensity (Fig. 5i) compared to sham-treated mice.”
§ Perineuronal nets decrease membrane capacitance of peritumoral fast spiking interneurons in a model of epilepsy > Results > Glioma-released proteases cause PNN degradation
plaincorrelational- Asserted: passes — The authors put it forward as true.
- Checkable: passes — It can be checked against evidence.
- Load-bearing: passes — The paper’s conclusions depend on it.
- Based: passes — The paper gives a reason why it holds.
It may state two separate claims as one.
A result the paper reports from its own data — it cites no other source for it, so there is none to check. The quote shows it is in the paper.
In the paper
“Confirming our prediction, GM6001 treatment reduced gelatinase activity within the glioma (Fig. 5a, middle panels) and in the PTC (Fig. 5d).”
§ Perineuronal nets decrease membrane capacitance of peritumoral fast spiking interneurons in a model of epilepsy > Results > Glioma-released proteases cause PNN degradation
plaindirect- Asserted: passes — The authors put it forward as true.
- Checkable: passes — It can be checked against evidence.
- Load-bearing: passes — The paper’s conclusions depend on it.
- Based: passes — The paper gives a reason why it holds.
It may state two separate claims as one.
A result the paper reports from its own data — it cites no other source for it, so there is none to check. The quote shows it is in the paper.
In the paper
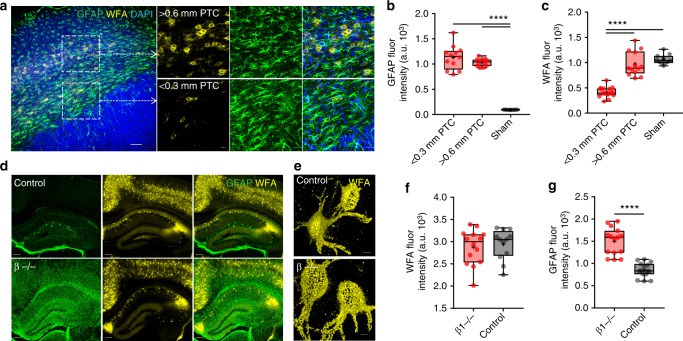
“while the PTC in close proximity to the tumor (<0.3 mm) showed disintegrated PNNs surrounded by highly reactive astrocytes (Fig. 4a (bottom square), Fig. 4b, c), we observed essentially intact PNNs around equally high GFAP (glial fibrillary acidic protein) expressing astrocytes in more distal (>0.6 mm) PTC (Fig. 4a (top square), 4b, c).”
§ Perineuronal nets decrease membrane capacitance of peritumoral fast spiking interneurons in a model of epilepsy > Results > Glioma-released proteases cause PNN degradation
plaincorrelational- Asserted: passes — The authors put it forward as true.
- Checkable: passes — It can be checked against evidence.
- Load-bearing: passes — The paper’s conclusions depend on it.
- Based: passes — The paper gives a reason why it holds.
It may state two separate claims as one.
A result the paper reports from its own data — it cites no other source for it, so there is none to check. The quote shows it is in the paper.
In the paper
“Higher AP frequency of FSNs in GM6001-treated PTC (n = 12(5)) than in nontreated PTC (n = 18(11)) but not than in sham (n = 10(7)).”
§ Perineuronal nets decrease membrane capacitance of peritumoral fast spiking interneurons in a model of epilepsy > Results > Biophysical changes in peritumoral neurons
plainn = 12- Asserted: passes — The authors put it forward as true.
- Checkable: passes — It can be checked against evidence.
- Load-bearing: passes — The paper’s conclusions depend on it.
- Based: passes — The paper gives a reason why it holds.
It may state two separate claims as one.
A result the paper reports from its own data — it cites no other source for it, so there is none to check. The quote shows it is in the paper.
In the paper
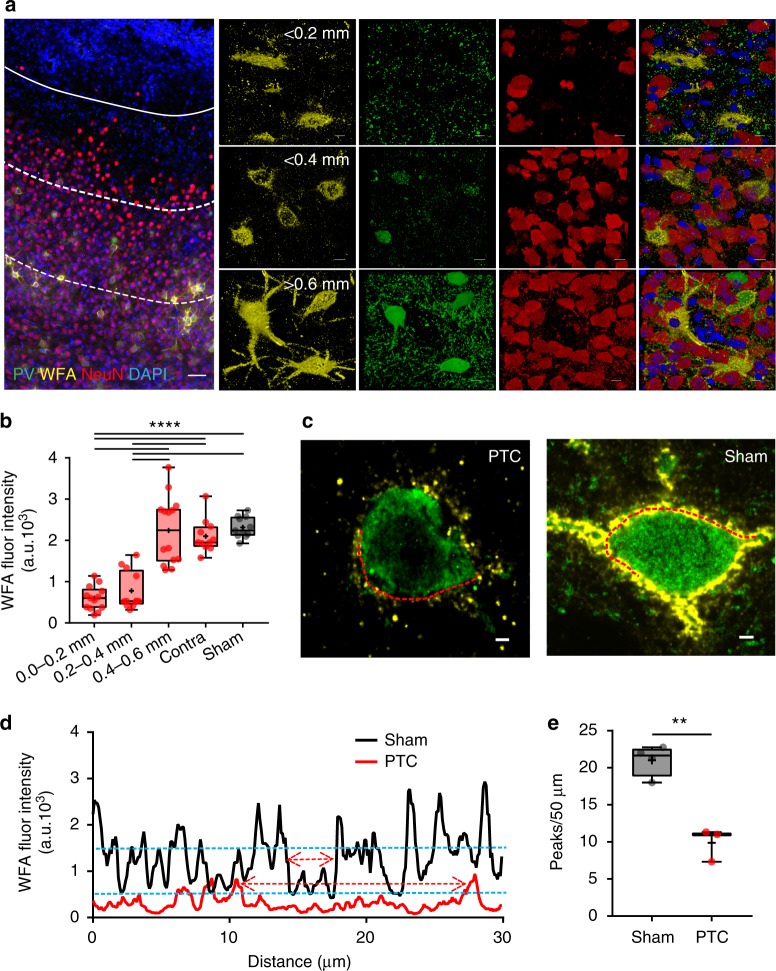
“We confirmed the same by observing significant reduction in the WFA intensity peaks (see methods) in the line profile of peritumoral PNNs, an indicative of large holes in the PNN (Fig. 2c−e).”
§ Perineuronal nets decrease membrane capacitance of peritumoral fast spiking interneurons in a model of epilepsy > Results > Neuronal loss and PNN disruption in the peritumoral brain
hedgedcorrelational- Asserted: passes — The authors put it forward as true.
- Checkable: passes — It can be checked against evidence.
- Load-bearing: passes — The paper’s conclusions depend on it.
- Based: passes — The paper gives a reason why it holds.
It may state two separate claims as one.
A result the paper reports from its own data — it cites no other source for it, so there is none to check. The quote shows it is in the paper.
In the paper
“however, their membrane capacitance (Cm) and input resistance (Rin) remained unaffected (Fig. 6b, c).”
§ Perineuronal nets decrease membrane capacitance of peritumoral fast spiking interneurons in a model of epilepsy > Results > Biophysical changes in peritumoral neurons
plain- Asserted: passes — The authors put it forward as true.
- Checkable: passes — It can be checked against evidence.
- Load-bearing: unclear — It is unclear whether the paper’s conclusions depend on it.
- Based: passes — The paper gives a reason why it holds.
It may state two separate claims as one.
A result the paper reports from its own data — it cites no other source for it, so there is none to check. The quote shows it is in the paper.
In the paper
“Unaltered resting membrane potential (Vm) of FSNs in the PTC of GM6001-treated (62.88 ± 1.40, n = 18(5)) than in nontreated (GBM22) PTC (61.67 ± 1.01, n = 12(8)), but significantly different than in sham (69.85 ± 0.67, n = 7(6)).”
§ Perineuronal nets decrease membrane capacitance of peritumoral fast spiking interneurons in a model of epilepsy > Results > Biophysical changes in peritumoral neurons
plainn = 18- Asserted: passes — The authors put it forward as true.
- Checkable: passes — It can be checked against evidence.
- Load-bearing: unclear — It is unclear whether the paper’s conclusions depend on it.
- Based: passes — The paper gives a reason why it holds.
It may state two separate claims as one.
A result the paper reports from its own data — it cites no other source for it, so there is none to check. The quote shows it is in the paper.
In the paper
“The gradient of NeuN+ cell loss was observed up to 0.6 mm from the tumor margin, the furthest distance evaluated, with significantly lower cell density compared to sham and contralateral brains (Fig. 1a).”
§ Perineuronal nets decrease membrane capacitance of peritumoral fast spiking interneurons in a model of epilepsy > Results > Neuronal loss and PNN disruption in the peritumoral brain
plaincorrelational- Asserted: passes — The authors put it forward as true.
- Checkable: passes — It can be checked against evidence.
- Load-bearing: passes — The paper’s conclusions depend on it.
- Based: passes — The paper gives a reason why it holds.
It may state two separate claims as one.
A result the paper reports from its own data — it cites no other source for it, so there is none to check. The quote shows it is in the paper.
In the paper
“Resting membrane potential (Vm) of excitatory neurons in GM6001-treated PTC (66.62 ± 0.77, n = 27(8)) remained similar to sham (67.02 ± 0.38, n = 98(15)), but was significantly higher than the nontreated PTC (61.49 ± 0.86, n = 80(11)).”
- Also stated in: § Biophysical changes in peritumoral neurons · plain
“Excitatory neurons in GM6001-treated PTC were depolarized (Fig. 7g);”
§ Perineuronal nets decrease membrane capacitance of peritumoral fast spiking interneurons in a model of epilepsy > Results > Biophysical changes in peritumoral neurons
plaincorrelationaln = 27- Asserted: passes — The authors put it forward as true.
- Checkable: passes — It can be checked against evidence.
- Load-bearing: unclear — It is unclear whether the paper’s conclusions depend on it.
- Based: passes — The paper gives a reason why it holds.
It may state two separate claims as one.
- Also stated in: § Biophysical changes in peritumoral neurons · plain
A result the paper reports from its own data — it cites no other source for it, so there is none to check. The quote shows it is in the paper.
In the paper
“Moreover, the input−output curve showed a lower excitability with small current injections, similar to that of sham, yet still showed somewhat increased excitability with larger current injections than sham (Fig. 7k, l).”
§ Perineuronal nets decrease membrane capacitance of peritumoral fast spiking interneurons in a model of epilepsy > Results > Biophysical changes in peritumoral neurons
plaincorrelational- Asserted: passes — The authors put it forward as true.
- Checkable: passes — It can be checked against evidence.
- Load-bearing: unclear — It is unclear whether the paper’s conclusions depend on it.
- Based: passes — The paper gives a reason why it holds.
It may state two separate claims as one.
A result the paper reports from its own data — it cites no other source for it, so there is none to check. The quote shows it is in the paper.
In the paper
“Excitatory neurons gradually depolarized during ChABC superfusion (Supplementary Fig. 8a, b (right)), a phenomenon we did not study further.”
§ Perineuronal nets decrease membrane capacitance of peritumoral fast spiking interneurons in a model of epilepsy > Results > PNNs modulate firing of FSNs
plaindirect- Asserted: passes — The authors put it forward as true.
- Checkable: passes — It can be checked against evidence.
- Load-bearing: fails — The paper’s conclusions may not depend on it.
- Based: passes — The paper gives a reason why it holds.
Probably not a substantial claim. The paper’s conclusions may not depend on it.
A result the paper reports from its own data — it cites no other source for it, so there is none to check. The quote shows it is in the paper.
In the paper
“Maximal firing rate (z-axis) increased nonlinearly with increasing stimulation (y-axis), and decreased progressively with increasing specific membrane capacitance (x-axis).”
§ Perineuronal nets decrease membrane capacitance of peritumoral fast spiking interneurons in a model of epilepsy > Results > PNN regulates FSN firing by modulating specific capacitance
plaindirect- Asserted: passes — The authors put it forward as true.
- Checkable: passes — It can be checked against evidence.
- Load-bearing: passes — The paper’s conclusions depend on it.
- Based: passes — The paper gives a reason why it holds.
It may state two separate claims as one.
- Rests on an assumption: The first-order Hodgkin−Huxley approximation and Neuronify model with identical electrical properties adequately represent the biophysical behavior of FSNs.
A result the paper reports from its own data — it cites no other source for it, so there is none to check. The quote shows it is in the paper.
In the paper
“In agreement with prior studies, we observed a 2–5-fold decrease in the PV interneurons density within 0.6 mm of glutamate-releasing tumor suggesting their excitotoxic loss.”
§ Perineuronal nets decrease membrane capacitance of peritumoral fast spiking interneurons in a model of epilepsy > Discussion
hedgeddirect- Asserted: passes — The authors put it forward as true.
- Checkable: passes — It can be checked against evidence.
- Load-bearing: passes — The paper’s conclusions depend on it.
- Based: passes — The paper gives a reason why it holds.
It may state two separate claims as one.
A result the paper reports from its own data — it cites no other source for it, so there is none to check. The quote shows it is in the paper.
In the paper
“ChABC pretreatment significantly shortened the latency of ictal-like events (Fig. 9e−g) but not interictal-like events (Fig. 9f).”
- Also stated in: § PNN degradation facilitates cortical epileptiform activity · plain
“ictal-like activity (control, 73.67 ± 6.69 min, n = 12(6); ChABC-treated, 38.83 ± 3.40 min, n = 8(5); ***P < 0.001, Welch's t test).”
§ Perineuronal nets decrease membrane capacitance of peritumoral fast spiking interneurons in a model of epilepsy > Results > PNN degradation facilitates cortical epileptiform activity
plaindirectn = 8- Asserted: passes — The authors put it forward as true.
- Checkable: passes — It can be checked against evidence.
- Load-bearing: passes — The paper’s conclusions depend on it.
- Based: passes — The paper gives a reason why it holds.
It may state two separate claims as one.
- Also stated in: § PNN degradation facilitates cortical epileptiform activity · plain
A result the paper reports from its own data — it cites no other source for it, so there is none to check. The quote shows it is in the paper.
In the paper
“Interestingly, the surviving PV interneurons show ~50% reduction in firing frequency, a phenomenon that was independent of the tumor-released Glu.”
§ Perineuronal nets decrease membrane capacitance of peritumoral fast spiking interneurons in a model of epilepsy > Discussion
plain- Asserted: passes — The authors put it forward as true.
- Checkable: passes — It can be checked against evidence.
- Load-bearing: passes — The paper’s conclusions depend on it.
- Based: passes — The paper gives a reason why it holds.
It may state two separate claims as one.
A result the paper reports from its own data — it cites no other source for it, so there is none to check. The quote shows it is in the paper.
In the paper
“Prior studies had already implicated the assiduous release of Glu from the tumor as instrumental, and we indeed find that peritumoral excitatory neurons are significantly depolarized, have a reduced activation threshold and increased discharge frequency but only when proximal to a tumor that expresses the Glu-releasing SXC transporter.”
§ Perineuronal nets decrease membrane capacitance of peritumoral fast spiking interneurons in a model of epilepsy > Discussion
plaindirect- Asserted: passes — The authors put it forward as true.
- Checkable: passes — It can be checked against evidence.
- Load-bearing: passes — The paper’s conclusions depend on it.
- Based: passes — The paper gives a reason why it holds.
It may state two separate claims as one.
A result the paper reports from its own data — it cites no other source for it, so there is none to check. The quote shows it is in the paper.
In the paper
“We observed that the amplitudes of APs shortened as the firing frequency increased; therefore, we set a minimum 15 mV deflection from the steady-state response as a qualifying criterion for a spike to be identified as an AP.”
§ Perineuronal nets decrease membrane capacitance of peritumoral fast spiking interneurons in a model of epilepsy > Methods > Acute slice electrophysiology
plaindirect- Asserted: passes — The authors put it forward as true.
- Checkable: passes — It can be checked against evidence.
- Load-bearing: fails — The paper’s conclusions may not depend on it.
- Based: passes — The paper gives a reason why it holds.
Probably not a substantial claim. The paper’s conclusions may not depend on it.
A result the paper reports from its own data — it cites no other source for it, so there is none to check. The quote shows it is in the paper.
In the paper
“The observed saturating/maximum firing frequency was found to be achieved by injecting 400−500 pA; therefore, we capped the highest injected current to 500 pA.”
§ Perineuronal nets decrease membrane capacitance of peritumoral fast spiking interneurons in a model of epilepsy > Methods > Acute slice electrophysiology
plaindirect- Asserted: passes — The authors put it forward as true.
- Checkable: passes — It can be checked against evidence.
- Load-bearing: fails — The paper’s conclusions may not depend on it.
- Based: passes — The paper gives a reason why it holds.
Probably not a substantial claim. The paper’s conclusions may not depend on it.
A conclusion the paper draws from its own results — it cites no other source for it, so there is none to check. The quote shows it is in the paper.
In the paper
“These studies uncovered a hitherto unknown role of PNNs as an electrostatic insulator that reduces specific membrane capacitance, functionally akin to myelin sheaths around axons, thereby permitting FSNs to exceed physiological firing rates.”
§ Perineuronal nets decrease membrane capacitance of peritumoral fast spiking interneurons in a model of epilepsy > Abstract
plaindirect- Asserted: passes — The authors put it forward as true.
- Checkable: passes — It can be checked against evidence.
- Load-bearing: passes — The paper’s conclusions depend on it.
- Based: passes — The paper gives a reason why it holds.
It may state two separate claims as one.
In the paper
“The enhanced glutamatergic drive is the result of glutamate (Glu) being assiduously released from gliomas via system Xc transporter (SXC) encoded by the SLC7A11 gene that is upregulated in about 54% of glioma patients4.”
§ Perineuronal nets decrease membrane capacitance of peritumoral fast spiking interneurons in a model of epilepsy > Introduction
What the sources say
- Not checked yetcites [4] Robert, S. M. et al. SLC7A11 expression is associated with seizures and predicts poor survival in patients with malignant glioma. Sci. Transl. Med. 7, 289ra286 (2015). source
plaindirect- Asserted: passes — The authors put it forward as true.
- Checkable: passes — It can be checked against evidence.
- Load-bearing: passes — The paper’s conclusions depend on it.
- Based: passes — The paper gives a reason why it holds.
It may state two separate claims as one.
None of the sources cited for this claim have been checked yet.
In the paper
“The cellular and molecular changes underlying tumor-associated epilepsy collectively point to a decrease in GABAergic and increase in glutamatergic transmission as the major contributors3–6.”
§ Perineuronal nets decrease membrane capacitance of peritumoral fast spiking interneurons in a model of epilepsy > Introduction
What the sources say
- Not checked yetcites [3] Campbell, S. L. et al. GABAergic disinhibition and impaired KCC2 cotransporter activity underlie tumor‐associated epilepsy. Glia 63, 23–36 (2015). source
- Not checked yetcites [4] Robert, S. M. et al. SLC7A11 expression is associated with seizures and predicts poor survival in patients with malignant glioma. Sci. Transl. Med. 7, 289ra286 (2015). source
- Not checked yetcites [5] Pallud, J. et al. Cortical GABAergic excitation contributes to epileptic activities around human glioma. Sci. Transl. Med. 6, 244ra289 (2014). source
- Not checked yetcites [6] Buckingham, S. C. et al. Glutamate release by primary brain tumors induces epileptic activity. Nat. Med. 17, 1269–1274 (2011). source
plaindirect- Asserted: passes — The authors put it forward as true.
- Checkable: passes — It can be checked against evidence.
- Load-bearing: fails — The paper’s conclusions may not depend on it.
- Based: passes — The paper gives a reason why it holds.
Probably not a substantial claim. The paper’s conclusions may not depend on it.
A conclusion the paper draws from its own results — it cites no other source for it, so there is none to check. The quote shows it is in the paper.
In the paper
“Tumor-released proteolytic enzymes degrade PNNs, resulting in increased membrane capacitance, reduced firing, and hence decreased GABA release.”
§ Perineuronal nets decrease membrane capacitance of peritumoral fast spiking interneurons in a model of epilepsy > Abstract
plaindirect- Asserted: passes — The authors put it forward as true.
- Checkable: passes — It can be checked against evidence.
- Load-bearing: passes — The paper’s conclusions depend on it.
- Based: passes — The paper gives a reason why it holds.
It may state two separate claims as one.
A conclusion the paper draws from its own results — it cites no other source for it, so there is none to check. The quote shows it is in the paper.
In the paper
“We show that PNNs decrease specific membrane capacitance of FSNs permitting them to fire action potentials at supra-physiological frequencies.”
§ Perineuronal nets decrease membrane capacitance of peritumoral fast spiking interneurons in a model of epilepsy > Abstract
plaindirect- Asserted: passes — The authors put it forward as true.
- Checkable: passes — It can be checked against evidence.
- Load-bearing: passes — The paper’s conclusions depend on it.
- Based: passes — The paper gives a reason why it holds.
It may state two separate claims as one.
In the paper
“About 80% of PV+ FSNs14 are surrounded by perineuronal nets (PNNs)”
§ Perineuronal nets decrease membrane capacitance of peritumoral fast spiking interneurons in a model of epilepsy > Introduction
What the sources say
- Not checked yetcites [14] Carulli, D. et al. Animals lacking link protein have attenuated perineuronal nets and persistent plasticity. Brain 133, 2331–2347 (2010). source
plaincorrelational- Asserted: passes — The authors put it forward as true.
- Checkable: passes — It can be checked against evidence.
- Load-bearing: fails — The paper’s conclusions may not depend on it.
- Based: passes — The paper gives a reason why it holds.
Probably not a substantial claim. The paper’s conclusions may not depend on it.
None of the sources cited for this claim have been checked yet.
In the paper
“PNNs may also restrict local ionic concentration due to a high density of their negatively charged constituent glycosaminoglycans (GAGs)18, thereby regulating the microenvironment of FSNs and influencing their intrinsic properties19.”
§ Perineuronal nets decrease membrane capacitance of peritumoral fast spiking interneurons in a model of epilepsy > Introduction
What the sources say
- Not checked yetcites [18] Morawski, M. et al. Ion exchanger in the brain: quantitative analysis of perineuronally fixed anionic binding sites suggests diffusion barriers with ion sorting properties. Sci. Rep. 5, 16471 (2015). source
- Not checked yetcites [19] Härtig, W. et al. Cortical neurons immunoreactive for the potassium channel Kv3. 1b subunit are predominantly surrounded by perineuronal nets presumed as a buffering system for cations. Brain Res. 842, 15–29 (1999). source
hedgedconditional- Asserted: passes — The authors put it forward as true.
- Checkable: passes — It can be checked against evidence.
- Load-bearing: passes — The paper’s conclusions depend on it.
- Based: passes — The paper gives a reason why it holds.
Probably not a substantial claim. It may state two separate claims as one.
A conclusion the paper draws from its own results — it cites no other source for it, so there is none to check. The quote shows it is in the paper.
In the paper
“We show that tumor-associated seizures are the consequence of impaired GABAergic inhibition due to an overall loss of peritumoral fast spiking interneurons (FSNs) concomitant with a significantly reduced firing rate of those that remain.”
§ Perineuronal nets decrease membrane capacitance of peritumoral fast spiking interneurons in a model of epilepsy > Abstract
plaindirect- Asserted: passes — The authors put it forward as true.
- Checkable: passes — It can be checked against evidence.
- Load-bearing: passes — The paper’s conclusions depend on it.
- Based: passes — The paper gives a reason why it holds.
It may state two separate claims as one.
A conclusion the paper draws from its own results — it cites no other source for it, so there is none to check. The quote shows it is in the paper.
In the paper
“PTC exhibited a spatial gradient of higher to lower gelatinase activity from the glioma border to the distal PTC (Fig. 5b) that appeared negatively correlated with the WFA intensity (Fig. 5c), suggesting the tumor as the likely source of MMPs.”
§ Perineuronal nets decrease membrane capacitance of peritumoral fast spiking interneurons in a model of epilepsy > Results > Glioma-released proteases cause PNN degradation
hedgedcorrelational- Asserted: passes — The authors put it forward as true.
- Checkable: passes — It can be checked against evidence.
- Load-bearing: passes — The paper’s conclusions depend on it.
- Based: passes — The paper gives a reason why it holds.
It may state two separate claims as one.
None of the sources cited for this claim have been checked yet.
In the paper
“In agreement with the literature24–26, ~10% of all NeuN+ neurons in cortex were PV+ (Fig. 1b, c)”
§ Perineuronal nets decrease membrane capacitance of peritumoral fast spiking interneurons in a model of epilepsy > Results > Neuronal loss and PNN disruption in the peritumoral brain
What the sources say
- Not checked yetcites [24] Ren, J., Aika, Y., Heizmann, C. & Kosaka, T. Quantitative analysis of neurons and glial cells in the rat somatosensory cortex, with special reference to GABAergic neurons and parvalbumin-containing neurons. Exp. Brain Res. 92, 1–14 (1992). source
- Not checked yetcites [25] Le Magueresse, C. & Monyer, H. GABAergic interneurons shape the functional maturation of the cortex. Neuron 77, 388–405 (2013). source
- Not checked yetcites [26] Beaulieu, C. Numerical data on neocortical neurons in adult rat, with special reference to the GABA population. Brain Res. 609, 284–292 (1993). source
hedged- Asserted: passes — The authors put it forward as true.
- Checkable: passes — It can be checked against evidence.
- Load-bearing: fails — The paper’s conclusions may not depend on it.
- Based: passes — The paper gives a reason why it holds.
Probably not a substantial claim. The paper’s conclusions may not depend on it.
None of the sources cited for this claim have been checked yet.
In the paper
“Seizures originate from the PTC, and previous studies3,5,6 show altered excitation−inhibition balance in the PTC due to changes in glutamatergic and GABAergic activity.”
§ Perineuronal nets decrease membrane capacitance of peritumoral fast spiking interneurons in a model of epilepsy > Results > Biophysical changes in peritumoral neurons
What the sources say
- Not checked yetcites [3] Campbell, S. L. et al. GABAergic disinhibition and impaired KCC2 cotransporter activity underlie tumor‐associated epilepsy. Glia 63, 23–36 (2015). source
- Not checked yetcites [5] Pallud, J. et al. Cortical GABAergic excitation contributes to epileptic activities around human glioma. Sci. Transl. Med. 6, 244ra289 (2014). source
- Not checked yetcites [6] Buckingham, S. C. et al. Glutamate release by primary brain tumors induces epileptic activity. Nat. Med. 17, 1269–1274 (2011). source
plaindirect- Asserted: passes — The authors put it forward as true.
- Checkable: passes — It can be checked against evidence.
- Load-bearing: passes — The paper’s conclusions depend on it.
- Based: passes — The paper gives a reason why it holds.
It may state two separate claims as one.
A conclusion the paper draws from its own results — it cites no other source for it, so there is none to check. The quote shows it is in the paper.
In the paper
“Importantly, real-time digestion of PNNs suggests that PNNs act as an insulator that decreases specific membrane capacitance of the cell thereby permitting an increase in the maximally achievable firing rate of FSNs.”
§ Perineuronal nets decrease membrane capacitance of peritumoral fast spiking interneurons in a model of epilepsy > Introduction
hedgeddirect- Asserted: passes — The authors put it forward as true.
- Checkable: passes — It can be checked against evidence.
- Load-bearing: passes — The paper’s conclusions depend on it.
- Based: passes — The paper gives a reason why it holds.
It may state two separate claims as one.
What the paper did — it cites no source for this, so there is none to check. The quote shows it is in the paper.
In the paper
“Unfortunately, experimental limitations including incubation duration and low enzymatic activity prevented us to achieve sufficient PNN degradation.”
§ Perineuronal nets decrease membrane capacitance of peritumoral fast spiking interneurons in a model of epilepsy > Results > PNNs modulate firing of FSNs
plaindirect- Asserted: passes — The authors put it forward as true.
- Checkable: passes — It can be checked against evidence.
- Load-bearing: passes — The paper’s conclusions depend on it.
- Based: passes — The paper gives a reason why it holds.
The quote only partly states this claim.
A conclusion the paper draws from its own results — it cites no other source for it, so there is none to check. The quote shows it is in the paper.
In the paper
“We show that PNN degradation alone is sufficient to reduce the firing frequency of FSNs thereby decreasing inhibitory tone”
§ Perineuronal nets decrease membrane capacitance of peritumoral fast spiking interneurons in a model of epilepsy > Introduction
boosteddirect- Asserted: passes — The authors put it forward as true.
- Checkable: passes — It can be checked against evidence.
- Load-bearing: passes — The paper’s conclusions depend on it.
- Based: passes — The paper gives a reason why it holds.
It may state two separate claims as one.
A conclusion the paper draws from its own results — it cites no other source for it, so there is none to check. The quote shows it is in the paper.
In the paper
“Preventing PNN degradation significantly rescued the biophysical characteristics of inhibitory neurons but without affecting excitatory neurons, which were still under the influence of tumor-released glutamate.”
§ Perineuronal nets decrease membrane capacitance of peritumoral fast spiking interneurons in a model of epilepsy > Results > Biophysical changes in peritumoral neurons
plaindirect- Asserted: passes — The authors put it forward as true.
- Checkable: passes — It can be checked against evidence.
- Load-bearing: passes — The paper’s conclusions depend on it.
- Based: passes — The paper gives a reason why it holds.
It may state two separate claims as one.
- Rests on an assumption: The elevation in glioma-released glutamate persists in GM6001-treated animals and continues to drive heightened excitability of excitatory neurons.
A conclusion the paper draws from its own results — it cites no other source for it, so there is none to check. The quote shows it is in the paper.
In the paper
“In contrast to excitatory cells, neither resting membrane potential nor input−output curve (Fig. 6j−l) could be attributed to the tumor-released Glu as they were identical in neurons with disintegrated PNNs recorded in the PTCs of GBM14 and GBM22-implanted brains (Fig. 6k).”
§ Perineuronal nets decrease membrane capacitance of peritumoral fast spiking interneurons in a model of epilepsy > Results > Biophysical changes in peritumoral neurons
plain- Asserted: passes — The authors put it forward as true.
- Checkable: passes — It can be checked against evidence.
- Load-bearing: passes — The paper’s conclusions depend on it.
- Based: passes — The paper gives a reason why it holds.
It may state two separate claims as one.
A conclusion the paper draws from its own results — it cites no other source for it, so there is none to check. The quote shows it is in the paper.
In the paper
“Taken together, these data suggest that tumor-secreted molecules, likely Glu and proteolytic enzymes, cause a distance-dependent loss of interneurons and degradation of PNNs, respectively.”
§ Perineuronal nets decrease membrane capacitance of peritumoral fast spiking interneurons in a model of epilepsy > Results > Neuronal loss and PNN disruption in the peritumoral brain
hedgedconditional- Asserted: passes — The authors put it forward as true.
- Checkable: passes — It can be checked against evidence.
- Load-bearing: passes — The paper’s conclusions depend on it.
- Based: passes — The paper gives a reason why it holds.
It may state two separate claims as one.
A conclusion the paper draws from its own results — it cites no other source for it, so there is none to check. The quote shows it is in the paper.
In the paper
“In contrast, changes in the excitability of FSNs appear intrinsic, and are associated with disintegration of PNNs and ~25% increase in cell capacitance as the primary differences between PTC and control cortex.”
§ Perineuronal nets decrease membrane capacitance of peritumoral fast spiking interneurons in a model of epilepsy > Results > PNNs modulate firing of FSNs
hedgedcorrelational- Asserted: passes — The authors put it forward as true.
- Checkable: passes — It can be checked against evidence.
- Load-bearing: passes — The paper’s conclusions depend on it.
- Based: passes — The paper gives a reason why it holds.
It may state two separate claims as one.
A conclusion the paper draws from its own results — it cites no other source for it, so there is none to check. The quote shows it is in the paper.
In the paper
“In addition, the spike frequency of excitatory neurons in GBM22 PTC was significantly reduced on blocking the glutamatergic neurotransmission, further confirming them driven by glioma-released Glu rather than intrinsic to the cell (Supplementary Fig. 5b).”
§ Perineuronal nets decrease membrane capacitance of peritumoral fast spiking interneurons in a model of epilepsy > Results > Biophysical changes in peritumoral neurons
boosteddirect- Asserted: passes — The authors put it forward as true.
- Checkable: passes — It can be checked against evidence.
- Load-bearing: passes — The paper’s conclusions depend on it.
- Based: passes — The paper gives a reason why it holds.
It may state two separate claims as one.
None of the sources cited for this claim have been checked yet.
In the paper
“Moreover, metalloproteinase inhibitors prevented seizures51 and MMP-9 knockout mice were less susceptible to pentylenetetrazole-induced seizures52.”
§ Perineuronal nets decrease membrane capacitance of peritumoral fast spiking interneurons in a model of epilepsy > Discussion
What the sources say
- Not checked yetcites [51] Pollock, E., Everest, M., Brown, A. & Poulter, M. O. Metalloproteinase inhibition prevents inhibitory synapse reorganization and seizure genesis. Neurobiol. Dis. 70, 21–31 (2014). source
- Not checked yetcites [52] Wilczynski, G. M. et al. Important role of matrix metalloproteinase 9 in epileptogenesis. J. Cell. Biol. 180, 1021–1035 (2008). source
plaindirect- Asserted: passes — The authors put it forward as true.
- Checkable: passes — It can be checked against evidence.
- Load-bearing: passes — The paper’s conclusions depend on it.
- Based: passes — The paper gives a reason why it holds.
It may state two separate claims as one.
A conclusion the paper draws from its own results — it cites no other source for it, so there is none to check. The quote shows it is in the paper.
In the paper
“Experimental digestion of PNNs in normal brain phenocopied the change in capacitance and the observed excitability changes.”
§ Perineuronal nets decrease membrane capacitance of peritumoral fast spiking interneurons in a model of epilepsy > Discussion
plaindirect- Asserted: passes — The authors put it forward as true.
- Checkable: passes — It can be checked against evidence.
- Load-bearing: passes — The paper’s conclusions depend on it.
- Based: passes — The paper gives a reason why it holds.
It may state two separate claims as one.
A conclusion the paper draws from its own results — it cites no other source for it, so there is none to check. The quote shows it is in the paper.
In the paper
“Akin to the myelin sheaths surrounding axons, the PNN that extends from the proximal dendrites across the cell body to the axon hillock increases the membrane thickness, which in turn decreases the specific membrane capacitance.”
§ Perineuronal nets decrease membrane capacitance of peritumoral fast spiking interneurons in a model of epilepsy > Discussion
plaindirect- Asserted: passes — The authors put it forward as true.
- Checkable: passes — It can be checked against evidence.
- Load-bearing: passes — The paper’s conclusions depend on it.
- Based: unclear — It is unclear why the paper says it holds.
It may state two separate claims as one.
A conclusion the paper draws from its own results — it cites no other source for it, so there is none to check. The quote shows it is in the paper.
In the paper
“PNN damage was found to be primarily attributed to the proteolytic activity of glioma-released MMPs and consequently caused the cell’s membrane capacitance to increase.”
§ Perineuronal nets decrease membrane capacitance of peritumoral fast spiking interneurons in a model of epilepsy > Discussion
plaindirect- Asserted: passes — The authors put it forward as true.
- Checkable: passes — It can be checked against evidence.
- Load-bearing: passes — The paper’s conclusions depend on it.
- Based: passes — The paper gives a reason why it holds.
It may state two separate claims as one.
A conclusion the paper draws from its own results — it cites no other source for it, so there is none to check. The quote shows it is in the paper.
In the paper
“Further biophysical analysis and modeling results revealed that the PNNs must act as an electrostatic insulator that decreases the cell’s effective membrane capacitance and concomitantly increase the cell’s maximally attainable firing frequency, which is directly linked to GABA release and maintenance of inhibitory tone.”
§ Perineuronal nets decrease membrane capacitance of peritumoral fast spiking interneurons in a model of epilepsy > Discussion
boosteddirect- Asserted: passes — The authors put it forward as true.
- Checkable: passes — It can be checked against evidence.
- Load-bearing: passes — The paper’s conclusions depend on it.
- Based: passes — The paper gives a reason why it holds.
It may state two separate claims as one.
- Rests on an assumption: The first-order Hodgkin−Huxley approximation and Neuronify model with identical electrical properties adequately represent the biophysical behavior of FSNs.
A conclusion the paper draws from its own results — it cites no other source for it, so there is none to check. The quote shows it is in the paper.
In the paper
“Taken together, these data suggest that an intact PNN reduces membrane capacitance and is essential to allow FSNs to sustain their maximum firing frequency.”
§ Perineuronal nets decrease membrane capacitance of peritumoral fast spiking interneurons in a model of epilepsy > Results > PNNs modulate firing of FSNs
hedgeddirect- Asserted: passes — The authors put it forward as true.
- Checkable: passes — It can be checked against evidence.
- Load-bearing: passes — The paper’s conclusions depend on it.
- Based: passes — The paper gives a reason why it holds.
It may state two separate claims as one.
None of the sources cited for this claim have been checked yet.
In the paper
“PNNs and CSPGs play crucial roles in protecting neurons from oxidative stress33 and glutamate excitotoxicity42 and combined actions of glioma-released proteases and Glu might explain the selective vulnerability of PV neurons over principle neurons in the PTC.”
§ Perineuronal nets decrease membrane capacitance of peritumoral fast spiking interneurons in a model of epilepsy > Discussion
What the sources say
- Not checked yetcites [33] Okamoto, M., Mori, S. & Endo, H. A protective action of chondroitin sulfate proteoglycans against neuronal cell death induced by glutamate. Brain Res. 637, 57–67 (1994). source
- Not checked yetcites [42] Rempe, R. G. et al. Matrix metalloproteinase-mediated blood−brain barrier dysfunction in epilepsy. J. Neurosci. 38, 4301–4315 (2018). source
hedgedconditional- Asserted: passes — The authors put it forward as true.
- Checkable: passes — It can be checked against evidence.
- Load-bearing: passes — The paper’s conclusions depend on it.
- Based: passes — The paper gives a reason why it holds.
It may state two separate claims as one.
None of the sources cited for this claim have been checked yet.
In the paper
“However, it is important to recognize that in addition to changes in the excitability of inhibitory neurons as suggested here and by others55, PNN degradation may also alter synaptic activity56 and hence network excitability.”
§ Perineuronal nets decrease membrane capacitance of peritumoral fast spiking interneurons in a model of epilepsy > Discussion
What the sources say
- Not checked yetcites [55] Balmer, T. S. Perineuronal nets enhance the excitability of fast-spiking neurons. eNeuro 3, ENEURO.0112-0116.2016 (2016). source
- Not checked yetcites [56] McRae, P. A. & Porter, B. E. The perineuronal net component of the extracellular matrix in plasticity and epilepsy. Neurochem. Int. 61, 963–972 (2012). source
hedgedconditional- Asserted: passes — The authors put it forward as true.
- Checkable: passes — It can be checked against evidence.
- Load-bearing: fails — The paper’s conclusions may not depend on it.
- Based: passes — The paper gives a reason why it holds.
Probably not a substantial claim. The paper’s conclusions may not depend on it.
The paper states this without a source or data behind it here, so there is nothing to check it against. The quote shows it is in the paper.
In the paper
“ChABC degrades CSPGs in the interstitial matrix and PNNs irrespective of their structural arrangement.”
§ Perineuronal nets decrease membrane capacitance of peritumoral fast spiking interneurons in a model of epilepsy > Results > PNNs modulate firing of FSNs
plaindirect- Asserted: passes — The authors put it forward as true.
- Checkable: passes — It can be checked against evidence.
- Load-bearing: passes — The paper’s conclusions depend on it.
- Based: fails — The paper may give no reason why it holds.
Probably not a substantial claim. The paper may give no reason why it holds.
In the paper
“Staley and colleagues demonstrated that CSPGs digestion changes the transmembrane Cl− gradient, which can alter GABAergic neurotransmission20.”
§ Perineuronal nets decrease membrane capacitance of peritumoral fast spiking interneurons in a model of epilepsy > Discussion
What the sources say
- Not checked yetcites [20] Glykys, J. et al. Local impermeant anions establish the neuronal chloride concentration. Science 343, 670–675 (2014). source
boostedconditional- Asserted: passes — The authors put it forward as true.
- Checkable: passes — It can be checked against evidence.
- Load-bearing: fails — The paper’s conclusions may not depend on it.
- Based: passes — The paper gives a reason why it holds.
Probably not a substantial claim. The paper’s conclusions may not depend on it.
In the paper
“Gliomas act as a localized source of seizure provoking Glu and PNN degrading metalloproteinases28 thereby establishing a gradient of spread, which explains the observed gradient of excitotoxic cell loss and PNN destruction that decreases with distance from the tumor.”
§ Perineuronal nets decrease membrane capacitance of peritumoral fast spiking interneurons in a model of epilepsy > Discussion
What the sources say
- Not checked yetcites [28] Rao, J. S. Molecular mechanisms of glioma invasiveness: the role of proteases. Nat. Rev. Cancer 3, 489–501 (2003). source
plaindirect- Asserted: passes — The authors put it forward as true.
- Checkable: passes — It can be checked against evidence.
- Load-bearing: passes — The paper’s conclusions depend on it.
- Based: passes — The paper gives a reason why it holds.
It may state two separate claims as one.
None of the sources cited for this claim have been checked yet.
In the paper
“Others have suggested altered lateral mobility of AMPAR53 or changes in the local diffusion of Ca2+ in brain tissue54 following PNN degradation.”
§ Perineuronal nets decrease membrane capacitance of peritumoral fast spiking interneurons in a model of epilepsy > Discussion
What the sources say
- Not checked yetcites [53] Frischknecht, R. et al. Brain extracellular matrix affects AMPA receptor lateral mobility and short-term synaptic plasticity. Nat. Neurosci. 12, 897–904 (2009). source
- Not checked yetcites [54] Hrabětová, S., Masri, D., Tao, L., Xiao, F. & Nicholson, C. Calcium diffusion enhanced after cleavage of negatively charged components of brain extracellular matrix by chondroitinase ABC. J. Physiol. 587, 4029–4049 (2009). source
hedgedconditional- Asserted: passes — The authors put it forward as true.
- Checkable: passes — It can be checked against evidence.
- Load-bearing: fails — The paper’s conclusions may not depend on it.
- Based: passes — The paper gives a reason why it holds.
Probably not a substantial claim. The paper’s conclusions may not depend on it. It may state two separate claims as one.
In the paper
“In addition, GM6001 increased the number of FSNs most likely due to the known neuroprotective effect of the PNNs33 shielding FSNs from glutamate excitotoxicity33.”
§ Perineuronal nets decrease membrane capacitance of peritumoral fast spiking interneurons in a model of epilepsy > Discussion
What the sources say
- Not checked yetcites [33] Okamoto, M., Mori, S. & Endo, H. A protective action of chondroitin sulfate proteoglycans against neuronal cell death induced by glutamate. Brain Res. 637, 57–67 (1994). source
hedgedconditional- Asserted: passes — The authors put it forward as true.
- Checkable: passes — It can be checked against evidence.
- Load-bearing: unclear — It is unclear whether the paper’s conclusions depend on it.
- Based: passes — The paper gives a reason why it holds.
It may state two separate claims as one.
A conclusion the paper draws from its own results — it cites no other source for it, so there is none to check. The quote shows it is in the paper.
In the paper
“Hence, these data suggest that not only does the presence of PNN increases maximal sustainable firing frequency, but also the evoked activity is indeed greatly enhanced even at lower frequencies.”
§ Perineuronal nets decrease membrane capacitance of peritumoral fast spiking interneurons in a model of epilepsy > Results > PNN regulates FSN firing by modulating specific capacitance
hedgeddirect- Asserted: passes — The authors put it forward as true.
- Checkable: passes — It can be checked against evidence.
- Load-bearing: passes — The paper’s conclusions depend on it.
- Based: passes — The paper gives a reason why it holds.
It may state two separate claims as one.
- Rests on an assumption: The first-order Hodgkin−Huxley approximation and Neuronify model with identical electrical properties adequately represent the biophysical behavior of FSNs.
A conclusion the paper draws from its own results — it cites no other source for it, so there is none to check. The quote shows it is in the paper.
In the paper
“Other populations of FSNs in brain may be similarly modulated by PNNs, and similarly vulnerable to enzymatic damage of PNNs following injury and disease.”
§ Perineuronal nets decrease membrane capacitance of peritumoral fast spiking interneurons in a model of epilepsy > Discussion
hedgedconditional- Asserted: passes — The authors put it forward as true.
- Checkable: passes — It can be checked against evidence.
- Load-bearing: fails — The paper’s conclusions may not depend on it.
- Based: fails — The paper may give no reason why it holds.
Probably not a substantial claim. The paper’s conclusions may not depend on it. The paper may give no reason why it holds. It may state two separate claims as one.
A conclusion the paper draws from its own results — it cites no other source for it, so there is none to check. The quote shows it is in the paper.
In the paper
“As illustrated in summary Supplementary Fig. 10, our data suggest that PNN tunes cell’s membrane capacitance thereby modulating its firing frequency.”
§ Perineuronal nets decrease membrane capacitance of peritumoral fast spiking interneurons in a model of epilepsy > Discussion
hedgeddirect- Asserted: passes — The authors put it forward as true.
- Checkable: passes — It can be checked against evidence.
- Load-bearing: passes — The paper’s conclusions depend on it.
- Based: passes — The paper gives a reason why it holds.
It may state two separate claims as one.
What the paper did — it cites no source for this, so there is none to check. The quote shows it is in the paper.
In the paper
“The membrane capacitance (Cm) and series resistance were not compensated unless otherwise stated.”
§ Perineuronal nets decrease membrane capacitance of peritumoral fast spiking interneurons in a model of epilepsy > Methods > Acute slice electrophysiology
plain- Asserted: passes — The authors put it forward as true.
- Checkable: passes — It can be checked against evidence.
- Load-bearing: fails — The paper’s conclusions may not depend on it.
- Based: passes — The paper gives a reason why it holds.
Probably not a substantial claim. The paper’s conclusions may not depend on it.
What the paper did — it cites no source for this, so there is none to check. The quote shows it is in the paper.
In the paper
“A line profile intensity graph showing almost flat line with only few low intensity peaks indicates disintegrated PNN by glioma as exemplified in Fig. 2d.”
§ Perineuronal nets decrease membrane capacitance of peritumoral fast spiking interneurons in a model of epilepsy > Methods > Line profile intensity and PNN integrity analysis
hedgeddirectSingle case- Asserted: passes — The authors put it forward as true.
- Checkable: passes — It can be checked against evidence.
- Load-bearing: passes — The paper’s conclusions depend on it.
- Based: passes — The paper gives a reason why it holds.
Probably not a substantial claim.
What the paper did — it cites no source for this, so there is none to check. The quote shows it is in the paper.
In the paper
“All animal procedures were approved and performed in accordance with the ethical guidelines set by Virginia Tech Institutional Animal Care and Use Committee (IACUC).”
§ Perineuronal nets decrease membrane capacitance of peritumoral fast spiking interneurons in a model of epilepsy > Methods > Animals
plain- Asserted: passes — The authors put it forward as true.
- Checkable: passes — It can be checked against evidence.
- Load-bearing: fails — The paper’s conclusions may not depend on it.
- Based: passes — The paper gives a reason why it holds.
Probably not a substantial claim. The paper’s conclusions may not depend on it. It may state two separate claims as one.
In the paper
“Note that Glu may also cause an increase in MMP expression and activity level as reported by a recent study41.”
§ Perineuronal nets decrease membrane capacitance of peritumoral fast spiking interneurons in a model of epilepsy > Discussion
What the sources say
- Not checked yetcites [41] Lukes, A., Mun-Bryce, S., Lukes, M. & Rosenberg, G. A. Extracellular matrix degradation by metalloproteinases and central nervous system diseases. Mol. Neurobiol. 19, 267–284 (1999). source
hedgedconditional- Asserted: passes — The authors put it forward as true.
- Checkable: passes — It can be checked against evidence.
- Load-bearing: fails — The paper’s conclusions may not depend on it.
- Based: passes — The paper gives a reason why it holds.
Probably not a substantial claim. The paper’s conclusions may not depend on it.
None of the sources cited for this claim have been checked yet.
In the paper
“This similar methodology, both model interactions and parameter values, has been used in recent studies61–63.”
§ Perineuronal nets decrease membrane capacitance of peritumoral fast spiking interneurons in a model of epilepsy > Methods > HH modeling of PNN
What the sources say
- Not checked yetcites [61] Guerrier, C. & Holcman, D. Hybrid Markov-mass action law model for cell activation by rare binding events: application to calcium induced vesicular release at neuronal synapses. Sci. Rep. 6, 35506 (2016). source
- Not checked yetcites [62] Howell, B., Medina, L. E. & Grill, W. M. Effects of frequency-dependent membrane capacitance on neural excitability. J. Neural Eng. 12, 056015 (2015). source
- Not checked yetcites [63] Weinberg, S. H. Membrane capacitive memory alters spiking in neurons described by the fractional-order Hodgkin−Huxley model. PLoS ONE 10, e0126629 (2015). source
plain- Asserted: passes — The authors put it forward as true.
- Checkable: passes — It can be checked against evidence.
- Load-bearing: fails — The paper’s conclusions may not depend on it.
- Based: passes — The paper gives a reason why it holds.
Probably not a substantial claim. The paper’s conclusions may not depend on it.
What the paper did — it cites no source for this, so there is none to check. The quote shows it is in the paper.
In the paper
“Data are sufficiently normal distributed and variance within groups is sufficiently similar to be used for parametric tests.”
§ Perineuronal nets decrease membrane capacitance of peritumoral fast spiking interneurons in a model of epilepsy > Methods > Statistical analysis
plain- Asserted: passes — The authors put it forward as true.
- Checkable: passes — It can be checked against evidence.
- Load-bearing: passes — The paper’s conclusions depend on it.
- Based: fails — The paper may give no reason why it holds.
Probably not a substantial claim. The paper may give no reason why it holds. It may state two separate claims as one.
What the paper did — it cites no source for this, so there is none to check. The quote shows it is in the paper.
In the paper
“This protocol also reliably degraded PNNs but left identifiable traces around the FSNs to confirm the presence of PNNs around patched cells prior to the digestion (Supplementary Fig. 7).”
§ Perineuronal nets decrease membrane capacitance of peritumoral fast spiking interneurons in a model of epilepsy > Methods > Acute slice PNN degradation and identification of PNN+ cells
plaindirect- Asserted: passes — The authors put it forward as true.
- Checkable: passes — It can be checked against evidence.
- Load-bearing: passes — The paper’s conclusions depend on it.
- Based: passes — The paper gives a reason why it holds.
It may state two separate claims as one.
What the paper did — it cites no source for this, so there is none to check. The quote shows it is in the paper.
In the paper
“These parameters of PNNs digestion by ChABC (enzyme concentration—0.5 U/ml, incubation time—45 min, incubation temperature—33 °C) reliably degraded PNNs but spared traces around the FSNs thereby allowing the identification of PNN-positive cells (Supplementary Fig. 6a, b).”
§ Perineuronal nets decrease membrane capacitance of peritumoral fast spiking interneurons in a model of epilepsy > Methods > Acute slice PNN degradation and identification of PNN+ cells
plaindirect- Asserted: passes — The authors put it forward as true.
- Checkable: passes — It can be checked against evidence.
- Load-bearing: passes — The paper’s conclusions depend on it.
- Based: passes — The paper gives a reason why it holds.
It may state two separate claims as one.
What the paper did — it cites no source for this, so there is none to check. The quote shows it is in the paper.
In the paper
“For few experiments, we superfused ACSF containing 50 µM D-2-amino-5-phosphonovalerate (D-AP-5) and 20 µM 6-cyano-7-nitroquinoxaline-2,3-dione (CNQX) to block glutamatergic neurotransmission and confirmed the blockage by observing disappearance of spontaneous EPSCs.”
§ Perineuronal nets decrease membrane capacitance of peritumoral fast spiking interneurons in a model of epilepsy > Methods > Acute slice electrophysiology
plaindirect- Asserted: passes — The authors put it forward as true.
- Checkable: passes — It can be checked against evidence.
- Load-bearing: fails — The paper’s conclusions may not depend on it.
- Based: passes — The paper gives a reason why it holds.
Probably not a substantial claim. The paper’s conclusions may not depend on it. It may state two separate claims as one.
What the paper did — it cites no source for this, so there is none to check. The quote shows it is in the paper.
In the paper
“To minimize procedure-related variability, we preformed staining in a large batch of duplicate sections from 5 to 7 mice of each treatment group.”
§ Perineuronal nets decrease membrane capacitance of peritumoral fast spiking interneurons in a model of epilepsy > Methods > Immunohistochemistry
plainn = 7- Asserted: passes — The authors put it forward as true.
- Checkable: passes — It can be checked against evidence.
- Load-bearing: fails — The paper’s conclusions may not depend on it.
- Based: passes — The paper gives a reason why it holds.
Probably not a substantial claim. The paper’s conclusions may not depend on it.
None of the sources cited for this claim have been checked yet.
In the paper
“This model was first described in the seminal work by Hodgkin and Huxley, and modified by Abbot and Kepler59,60.”
§ Perineuronal nets decrease membrane capacitance of peritumoral fast spiking interneurons in a model of epilepsy > Methods > HH modeling of PNN
What the sources say
- Not checked yetcites [59] Abbott, L. & Kepler, T. B. Model neurons: from Hodgkin−Huxley to Hopfield. In Statistical Mechanics of Neural Networks (ed. Garrido, I.) (Springer, Berlin, 1990).
- Not checked yetcites [60] Hodgkin, A. L. & Huxley, A. F. A quantitative description of membrane current and its application to conduction and excitation in nerve. J. Physiol. 117, 500–544 (1952). source
plain- Asserted: passes — The authors put it forward as true.
- Checkable: passes — It can be checked against evidence.
- Load-bearing: fails — The paper’s conclusions may not depend on it.
- Based: passes — The paper gives a reason why it holds.
Probably not a substantial claim. The paper’s conclusions may not depend on it. It may state two separate claims as one.
None of the sources cited for this claim have been checked yet.
In the paper
“Although PNNs are stable structures and known to lock synapses in place upon closure of the developmental window of plasticity17,38,39, several CNS pathologies40, including glioma and epilepsy, present with upregulated ECM and PNN remodeling enzymes including MMPs.”
§ Perineuronal nets decrease membrane capacitance of peritumoral fast spiking interneurons in a model of epilepsy > Discussion
What the sources say
- Not checked yetcites [17] Tsien, R. Y. Very long-term memories may be stored in the pattern of holes in the perineuronal net. Proc. Natl. Acad. Sci. USA 110, 12456–12461 (2013). source
- Not checked yetcites [38] Hu, H., Gan, J. & Jonas, P. Fast-spiking, parvalbumin + GABAergic interneurons: From cellular design to microcircuit function. Science 345, 1255263 (2014). source
- Not checked yetcites [39] Pizzorusso, T. et al. Reactivation of ocular dominance plasticity in the adult visual cortex. Science 298, 1248–1251 (2002). source
boostedcorrelational- Asserted: passes — The authors put it forward as true.
- Checkable: passes — It can be checked against evidence.
- Load-bearing: fails — The paper’s conclusions may not depend on it.
- Based: passes — The paper gives a reason why it holds.
Probably not a substantial claim. The paper’s conclusions may not depend on it. It may state two separate claims as one.
What the paper did — it cites no source for this, so there is none to check. The quote shows it is in the paper.
In the paper
“Different patterns of PV and NeuN intensity peaks flanked by WFA peaks indicate whether a cell is present inside the PNN and the status of PNN.”
§ Perineuronal nets decrease membrane capacitance of peritumoral fast spiking interneurons in a model of epilepsy > Methods > Line profile intensity and PNN integrity analysis
hedgedcorrelational- Asserted: passes — The authors put it forward as true.
- Checkable: passes — It can be checked against evidence.
- Load-bearing: fails — The paper’s conclusions may not depend on it.
- Based: passes — The paper gives a reason why it holds.
Probably not a substantial claim. The paper’s conclusions may not depend on it.
What the paper did — it cites no source for this, so there is none to check. The quote shows it is in the paper.
In the paper
“A potential damage to the PNNs was minimized during the patching procedure by applying minimum positive pressure while approaching cells.”
§ Perineuronal nets decrease membrane capacitance of peritumoral fast spiking interneurons in a model of epilepsy > Methods > Acute slice electrophysiology
plaindirect- Asserted: passes — The authors put it forward as true.
- Checkable: passes — It can be checked against evidence.
- Load-bearing: fails — The paper’s conclusions may not depend on it.
- Based: passes — The paper gives a reason why it holds.
Probably not a substantial claim. The paper’s conclusions may not depend on it.
A conclusion the paper draws from its own results — it cites no other source for it, so there is none to check. The quote shows it is in the paper.
In the paper
“The aforementioned mechanisms could alter the excitation−inhibition balance in favor of seizures and may well contribute to a loss of inhibition in tumor-associated cortex.”
§ Perineuronal nets decrease membrane capacitance of peritumoral fast spiking interneurons in a model of epilepsy > Discussion
hedgedconditional- Asserted: passes — The authors put it forward as true.
- Checkable: passes — It can be checked against evidence.
- Load-bearing: passes — The paper’s conclusions depend on it.
- Based: passes — The paper gives a reason why it holds.
It may state two separate claims as one.
The paper relies on this without support.
The elevation in glioma-released glutamate persists in GM6001-treated animals and continues to drive heightened excitability of excitatory neurons.
“Note, however, that under these conditions the elevation in glioma-released glutamate remains a driver of heightened excitability in GM6001-treated animals.”
The paper relies on this without support.
The first-order Hodgkin−Huxley approximation and Neuronify model with identical electrical properties adequately represent the biophysical behavior of FSNs.
“we employed a computer simulation to generate a first-order approximation to the Hodgkin−Huxley (HH) differential equation model (Supplementary Fig. 9a, b).”
Claims other papers make about this one
Each is checked against this paper’s own text: does it say what the citing paper says it does?
In the citing paper
“As PNNs are implicated in neuronal health and function, protecting cells against neurotoxins such as Aβ1–42 [39] and oxidative stress [65] in addition to modulating neuronal activity [63, 66], the microglia-mediated loss of these structures in disease likely plays an important role in AD pathogenesis.”
From Microglia facilitate loss of perineuronal nets in the Alzheimer's disease brain (2020) · cites this paper as [66]
In the citing paper
“PNN degradation impairs the inhibitory firing of GABAergic interneurons, thus contributing to tumour-associated seizures”
From Microglial depletion prevents extracellular matrix changes and striatal volume reduction in a model of Huntington's disease (2020) · cites this paper as Tewari et al., 2018
In the citing paper
“which has before been shown to contribute to tumour-associated seizures (Tewari et al. , 2018) due to impaired GABAergic inhibitory firing”
From Microglial depletion prevents extracellular matrix changes and striatal volume reduction in a model of Huntington's disease (2020) · cites this paper as Tewari et al. , 2018
Self-check
Percentages, sums and reported differences re-computed from the paper’s own numbers.
Each contradiction between two passages listed here was confirmed by an independent check.
Rated minor: it would not touch a result — a value no result rests on, a p-value that stays on the same side of the significance level, or a conflict that is clerical, resolved elsewhere in the paper, or outside its own findings.
In the paper
§ Perineuronal nets decrease membrane capacitance of peritumoral fast spiking interneurons in a model of epilepsy > Results > Neuronal loss and PNN disruption in the peritumoral brain
“whereas the Glu-releasing tumors (GBM22) decreased NeuN+ cells to ~50–60% within 0.2–0.6 mm PTC.”
§ Perineuronal nets decrease membrane capacitance of peritumoral fast spiking interneurons in a model of epilepsy > Results > Neuronal loss and PNN disruption in the peritumoral brain
“0.4–0.6 mm (PV+, 46.18 ± 7.7%; NeuN+, 72.99 ± 4.88%) distance from the tumor border.”
Rated minor: it would not touch a result — a value no result rests on, a p-value that stays on the same side of the significance level, or a conflict that is clerical, resolved elsewhere in the paper, or outside its own findings.
In the paper
§ Perineuronal nets decrease membrane capacitance of peritumoral fast spiking interneurons in a model of epilepsy > Results > Biophysical changes in peritumoral neurons
“Excitatory neurons in GM6001-treated PTC were depolarized (Fig. 7g);”
§ Perineuronal nets decrease membrane capacitance of peritumoral fast spiking interneurons in a model of epilepsy > Results > Biophysical changes in peritumoral neurons
“g Resting membrane potential (Vm) of excitatory neurons in GM6001-treated PTC (66.62 ± 0.77, n = 27(8)) remained similar to sham (67.02 ± 0.38, n = 98(15)), but was significantly higher than the nontreated PTC (61.49 ± 0.86, n = 80(11)).”
Citations
Cites
Hodgkin, A. L., & Huxley, A. F. (1952) · The Journal of Physiology · doi:10.1113/jphysiol.1952.sp004764 · Cited by 23,191
Shrestha, S., & Offer, S. M. (2016) · Medical Epigenetics · doi:10.1159/000444713 · Cited by 8,951
Reactivation of Ocular Dominance Plasticity in the Adult Visual Cortex
Pizzorusso, T., Medini, P., Berardi, N., Chierzi, S., Fawcett, J. W., & Maffei, L. (2002) · Science · doi:10.1126/science.1072699 · Cited by 1,679
Glutamate as a neurotransmitter in the brain: review of physiology and pathology
Meldrum, B. S. (2000) · The Journal of Nutrition · doi:10.1093/jn/130.4.1007s · Cited by 1,667
Petilla terminology: nomenclature of features of GABAergic interneurons of the cerebral cortex
The Petilla Interneuron Nomenclature Group (PING) (2008) · Nature Reviews Neuroscience · doi:10.1038/nrn2402 · Cited by 1,491
Three groups of interneurons account for nearly 100% of neocortical GABAergic neurons
Rudy, B., Fishell, G., Lee, S., & Hjerling‐Leffler, J. (2011) · Developmental Neurobiology · doi:10.1002/dneu.20853 · Cited by 1,420
Fast-spiking, parvalbumin + GABAergic interneurons: From cellular design to microcircuit function
Hu, H., Gan, J., & Jonas, P. (2014) · Science · doi:10.1126/science.1255263 · Cited by 1,197
Matrix metalloproteinases in neuroinflammation
Rosenberg, G. A. (2002) · Glia · doi:10.1002/glia.10108 · Cited by 868
Molecular mechanisms of glioma invasiveness: the role of proteases
Rao, J. S. (2003) · Nature Reviews Cancer · doi:10.1038/nrc1121 · Cited by 847
Perineuronal Nets Protect Fear Memories from Erasure
Gogolla, N., Caroni, P., Lüthi, A., & Herry, C. (2009) · Science · doi:10.1126/science.1174146 · Cited by 760
Research works printed but not linked: 1
- Abbott, L. & Kepler, T. B. Model neurons: from Hodgkin−Huxley to Hopfield. In Statistical Mechanics of Neural Networks (ed. Garrido, I.) (Springer, Berlin, 1990).
Cited by
Sorted by citations
Items 101–200 of 211
Molecular mechanisms and diagnostic model of glioma-related epilepsy
Li, J., Long, S., Zhang, Y., Wei, W., Yu, S., Liu, Q., Hui, X., Li, X., & Wang, Y. (2024) · npj Precision Oncology · doi:10.1038/s41698-024-00721-8 · Cited by 11
Jetsonen, E., Didio, G., Suleymanova, I., Teino, I., Ċastrén, E., & Umemori, J. (2025) · Neuropsychopharmacology · doi:10.1038/s41386-025-02219-8 · Cited by 11
Perineuronal nets in the developing brain: implications for neurodevelopmental disorders
Ackerman, J. M., Ford, T. J. L., Kattewar, S. S., & Kim, W.-Y. (2025) · Molecular Brain · doi:10.1186/s13041-025-01261-3 · Cited by 10
Glioma‐induced peritumoral hyperexcitability in a pediatric glioma model
Chaunsali, L., Tewari, B. P., Gallucci, A., Thompson, E. G., Savoia, A., Feld, N., & Campbell, S. L. (2020) · Physiological Reports · doi:10.14814/phy2.14567 · Cited by 9
Self-citationUsende, I. L., Olopade, J. O., Azeez, I. A., Andrioli, A., Bankole, M. O., Olopade, F. E., Nafady, A. A., & Bentivoglio, M. (2022) · IBRO Neuroscience Reports · doi:10.1016/j.ibneur.2022.08.008 · Cited by 10
Patel, D. C., Swift, N. A., Tewari, B. P., Browning, J. L., Prim, C. E., Chaunsali, L., Kimbrough, I. F., Olsen, M. L., & Sontheimer, H. W. (2023) · Brain · doi:10.1093/brain/awad430 · Cited by 10
Self-citationProtocol to Quantitatively Assess the Structural Integrity of Perineuronal Nets ex vivo
Tewari, B. P., & Sontheimer, H. W. (2019) · BIO-PROTOCOL · doi:10.21769/bioprotoc.3234 · Cited by 9
Self-citationWhole Genome Sequence Data From Captive Baboons Implicate RBFOX1 in Epileptic Seizure Risk
Kos, M. Z., Carless, M. A., Blondell, L., Leland, M. M., Knape, K. D., Göring, H. H. H., & Szabó, C. Á. (2021) · Frontiers in Genetics · doi:10.3389/fgene.2021.714282 · Cited by 9
Neuroglia and extracellular matrix molecules
Dzyubenko, E., & Hermann, D. M. (2025) · Handbook of clinical neurology · doi:10.1016/b978-0-443-19104-6.00010-3 · Cited by 8
Contribution of perineuronal nets to hyperexcitability in pilocarpine‐induced status epilepticus
Woo, A. M., Fleischel, E. J., Patel, D. C., & Sontheimer, H. W. (2025) · Epilepsia · doi:10.1111/epi.18489 · Cited by 8
Self-citationCortical Excitability and Connectivity in Patients With Brain Tumors
Rizzo, V., Terranova, C., Raffa, G., Cardali, S. M., Angileri, F. F., Marzano, G., Quattropani, M. C. A., Germanò, A., Girlanda, P., & Quartarone, A. (2021) · Frontiers in Neurology · doi:10.3389/fneur.2021.673836 · Cited by 8
Tantillo, E., Scalera, M., Santis, E. D., Meneghetti, N., Cerri, C., Menicagli, M., Mazzoni, A., Costa, M., Mazzanti, C. M., Vannini, E., et al. (2023) · Neuro-Oncology · doi:10.1093/neuonc/noad035 · Cited by 8
Yu, S., Park, M.-C., Kang, J., Lee, E., Jung, J., & Kim, T. (2022) · Journal of Personalized Medicine · doi:10.3390/jpm12020318 · Cited by 8
Honeycutt, S. C., Mukherjee, A., Paladino, M. S., Gilles‐Thomas, E. A., & Loney, G. C. (2024) · Addiction Neuroscience · doi:10.1016/j.addicn.2024.100150 · Cited by 7
Short‐term exposure to HIV Tat induces glial activation and changes in perineuronal nets
Carey, S. D., Conant, K. E., & Maguire‐Zeiss, K. A. (2024) · European Journal of Neuroscience · doi:10.1111/ejn.16427 · Cited by 7
Sasuclark, A. R., Watanabe, M., Roshto, K., Kilonzo, V. W., Zhang, Y., & Pitts, M. W. (2025) · Redox Biology · doi:10.1016/j.redox.2025.103548 · Cited by 8
Blanco, I., Deasy, S., Amontree, M., Gabriel, M., Caccavano, A., Vicini, S., Glasgow, E. F., & Conant, K. E. (2025) · Molecular Psychiatry · doi:10.1038/s41380-025-03007-y · Cited by 7
Tewari, B. P., Harshad, P. A., Singh, M., Joshi, N. B., & Joshi, P. G. (2023) · Brain Research · doi:10.1016/j.brainres.2023.148444 · Cited by 8
Self-citationFu, S., Gao, H., Wang, S., Wang, X., Woodard, T. L., Wang, Z., Kong, J., Lovley, D. R., & Yao, J. (2025) · Nature Communications · doi:10.1038/s41467-025-63640-7 · Cited by 6
Perineuronal Net Microscopy: From Brain Pathology to Artificial Intelligence
Paveliev, M., Egorchev, A. A., Musin, F., Lipachev, N., Melnikova, A., Gimadutdinov, R. M., Kashipov, A., Molotkov, D., Chickrin, D. E., & Aganov, A. V. (2024) · International Journal of Molecular Sciences · doi:10.3390/ijms25084227 · Cited by 8
Structural and material basis of neuron–glioma interactions
Wang, J., Shen, T.-H., Liu, J., Wen, Q., Yang, X., Deng, Y., Duan, J., & Yu, S. (2025) · Cancer Letters · doi:10.1016/j.canlet.2025.217843 · Cited by 7
Mei, Y.-X., Chen, H.-S., Cao, Q.-L., Lv, W., Liu, Y., Deng, S., Zhou, Q., Zhang, Z., Wang, F., Hu, Z., et al. (2025) · Molecular Psychiatry · doi:10.1038/s41380-025-03239-y · Cited by 7
Environmental enrichment counteracts the effects of glioma in primary visual cortex
Castro, M. A. D., Garofalo, S., Felice, E. D., Meneghetti, N., Pietro, E. D., Mormino, A., Mazzoni, A., Caleo, M., Maggi, L., & Limatola, C. (2022) · Neurobiology of Disease · doi:10.1016/j.nbd.2022.105894 · Cited by 6
Jakovljević, A., Stamenković, V., Poleksić, J., Hamad, M. I. K., Reiss, G., Jakovčevski, I., & Anđjus, P. R. (2024) · Biomolecules · doi:10.3390/biom14040508 · Cited by 7
Recording and modeling of pinched hysteresis loops, the fingerprint of a memristor, in neurons
Pabst, O., Schülke, C., Balasingham, I., Krauss, S., Glover, J. C., & Martinsen, Ø. (2025) · Scientific Reports · doi:10.1038/s41598-025-21035-0 · Cited by 3
Spalletti, C., Scalera, M., Mori, E., Haddad, S., Mainardi, M., Cangi, D., Pillai, V., Parmigiani, E., Landi, S., Caleo, M., et al. (2025) · Neurobiology of Disease · doi:10.1016/j.nbd.2025.106997 · Cited by 7
Gallo, M. T., Virenque, A., Golinelli, A., Fumagalli, F., Ċastrén, E., Brivio, P., & Calabrese, F. (2025) · Molecular Psychiatry · doi:10.1038/s41380-025-03223-6 · Cited by 5
Gilbert, K. F., Amontree, M., Deasy, S., Ma, J., & Conant, K. E. (2024) · European Journal of Neuroscience · doi:10.1111/ejn.16570 · Cited by 5
The molecular landscape of glioblastoma-associated epilepsy
Scheffel, T. B., Diz, F. M., Wieck, A., Begnini, K. R., & da Costa, J. C. (2025) · Journal of Molecular Medicine · doi:10.1007/s00109-025-02567-4 · Cited by 6
Nashawi, H., Foltz, C. T., Smail, M. A., Buesing, D. R., Herman, J. P., & Ulrich‐Lai, Y. M. (2024) · Physiology & Behavior · doi:10.1016/j.physbeh.2024.114774 · Cited by 4
Chaunsali, L., Li, J., Fleischel, E. J., Prim, C. E., Kasprzak, I., Jiang, S., Hou, S., Escalante, M., Cope, E. C., Olsen, M. L., et al. (2025) · Alzheimer s & Dementia · doi:10.1002/alz.70813 · Cited by 5
Self-citationMandal, A., Moneme, C., Tewari, B. P., Goldstein, A. M., Sontheimer, H. W., Cheng, L. S., Moore, S. R., & Levin, D. E. (2024) · Journal of Neuroscience Methods · doi:10.1016/j.jneumeth.2024.110144 · Cited by 3
Self-citationHyaluronidase-induced matrix remodeling contributes to long-term synaptic changes
Sokolov, R., Krut’, V. G., Belousov, V. V., Rozov, A. V., & Mukhina, I. V. (2025) · Frontiers in Neural Circuits · doi:10.3389/fncir.2024.1441280 · Cited by 4
Historical Overview of the “Firing” Liaison between Brain Tumors and Epilepsy
Natale, G., Cucchiara, F., & Bocci, G. (2021) · The Neuroscientist · doi:10.1177/1073858421992316 · Cited by 4
Brain on Fire: How Brain Infection and Neuroinflammation Drive Worldwide Epilepsy Burden
Barker‐Haliski, M. L., DePaula-Silva, A. B., Pitsch, J., Sontheimer, H. W., Hirsch, L. J., Galanopoulou, A. S., & Kearney, J. A. (2024) · Epiliepsy currents/Epilepsy currents · doi:10.1177/15357597241242238 · Cited by 4
Self-citationTewari, B. P., & Conant, K. E. (2024) · Frontiers in Cellular Neuroscience · doi:10.3389/fncel.2024.1400652 · Cited by 4
Self-citationPerineuronal Nets: Old Structures, New Functions
Tewari, B. P., Chaunsali, L., & Sontheimer, H. W. (2026) · The Neuroscientist · doi:10.1177/10738584261421180 · Cited by 3
Self-citationGarcía-Cerro, S., Gómez-Garrido, A., Soria, F. N., Loucera, C., & Crespo‐Facorro, B. (2025) · Neuropsychopharmacology · doi:10.1038/s41386-025-02210-3 · Cited by 3
Descriptive study of perineuronal net in enteric nervous system of humans and mice
da Silva, M. D. V., Bacarin, C. C., Machado, C. C. A., Franciosi, A., Mendes, J. D. D. L., Watanabe, P. D. S., Miqueloto, C. A., Fattori, V., Albarracin, O. Y. E., Verri, W. A., Jr., et al. (2024) · Journal of Neurochemistry · doi:10.1111/jnc.16159 · Cited by 3
Setkowicz, Z., Gzieło, K., Kiełbiński, M., & Janeczko, K. J. (2021) · The Journal of Comparative Neurology · doi:10.1002/cne.25282 · Cited by 3
A dynamic clamp protocol to artificially modify cell capacitance
Pfeiffer, P., Tomás, F. J. B., Wu, J., Schleimer, J., Vida, I., & Schreiber, S. (2022) · eLife · doi:10.7554/elife.75517 · Cited by 3
Seizure Disorders and Epilepsy
Sontheimer, H. W. (2021) · Elsevier eBooks · doi:10.1016/b978-0-12-821228-8.00003-2 · Cited by 3
Self-citationGrødem, S., Thompson, E. H., Røe, M. B., Vatne, G. H., Nymoen, I., Buccino, A. P., Madland, T., Hafting, T., Fyhn, M., & Lensjø, K. K. (2024) · bioRxiv (Cold Spring Harbor Laboratory) · doi:10.1101/2024.03.20.585910 · Cited by 3
Dentate Granule Cell Capacitance Is Stable across the Light/Dark Cycle
Gonzalez, J., Pennock, R. L., Abdulkareem, A. F., Luikart, B. W., Wadiche, J. I., & Overstreet‐Wadiche, L. (2025) · eNeuro · doi:10.1523/eneuro.0213-25.2025 · Cited by 2
Evolutionary neuroeconomic adaptations of fast-spiking neurons in the human neocortex
Szegedi, V., Douida, A., Hutóczki, G., Novák, L., & Lamsa, K. P. (2026) · Frontiers in Synaptic Neuroscience · doi:10.3389/fnsyn.2026.1741452 · Cited by 2
Huang, Y.-F., Liu, C., Liu, Z., Zhuang, X., Chen, J.-H., Zhang, Z.-N., Shen, C., & Hu, Y. (2026) · Brain · doi:10.1093/brain/awag058 · Cited by 3
Emerging Therapeutic Role of Chondroitinase (ChABC) in Neurological Disorders and Cancer
Kolathur, K. K., Kumar, A., Biswas, A., Bojja, S. L., & Subrahmanyam, V. M. (2022) · Current Drug Therapy · doi:10.2174/1574885517666220331151619 · Cited by 3
Perineuronal nets in motor circuitry regulate the performance of learned vocalizations in songbirds
Wan, X., Wang, A. S., Storch, D.-S., Li, V. Y., & Sakata, J. T. (2025) · Communications Biology · doi:10.1038/s42003-025-07520-2 · Cited by 2
Hussain, A., & Razak, K. A. (2025) · Neuroscience · doi:10.1016/j.neuroscience.2025.05.026 · Cited by 4
Emery, B. A., Everett, M., Dunn, L. R., Lau, B. Y. B., & Krishnan, K. (2026) · Frontiers in Neuroscience · doi:10.3389/fnins.2026.1769195 · Cited by 2
Vasilenko, А. V., Николаевич, Ч. С., Ulitin, А. Y., Makhortova, S. A., Rasulov, Z. M., Bubnova, P. D., Sokolov, I. А., Булаева, М. А., Lavrovsky, P. V., Vershinin, A. E., et al. (2022) · Medical alphabet · doi:10.33667/2078-5631-2022-21-43-50 · Cited by 2
Neonatal Zika virus infection causes transient perineuronal net degradation
Engel, K., Lee, H., Tewari, B. P., Lewkowicz, A. P., Ireland, D. D. C., Manangeeswaran, M., & Verthelyi, D. I. (2023) · Frontiers in Cellular Neuroscience · doi:10.3389/fncel.2023.1187425 · Cited by 2
Self-citationSontheimer, H. W. (2021) · Elsevier eBooks · doi:10.1016/b978-0-12-821228-8.00009-3 · Cited by 3
Self-citationDzyubenko, E., Fleischer, M., Manrique‐Castano, D., Borbor, M., Kleinschnitz, C., Faissner, A., & Hermann, D. M. (2020) · bioRxiv (Cold Spring Harbor Laboratory) · doi:10.1101/2020.07.13.200113 · Cited by 3
Jetsonen, E., Suleymanova, I., Ċastrén, E., & Umemori, J. (2024) · bioRxiv (Cold Spring Harbor Laboratory) · doi:10.1101/2024.09.27.615344 · Cited by 2
Denholtz, L. E., Liu, J., Nahmoud, I., Casaccia, P., & Likhtik, E. (2025) · bioRxiv (Cold Spring Harbor Laboratory) · doi:10.1101/2025.07.25.666881 · Cited by 2
SYNAPTIC MECHANISMS OF EPILEPSY: CONTEMPORARY VIEW
Mukhamedzyanov, R. D., & Martynov, A. V. (2024) · Ulyanovsk Medico-biological Journal · doi:10.34014/2227-1848-2024-2-18-29 · Cited by 1
Sloviter, R. S. (2024) · Oxford University Press eBooks · doi:10.1093/med/9780197549469.003.0024 · Cited by 1
Nowacka, A., Śniegocki, M., Bożiłow, D., & Ziółkowska, E. (2025) · International Journal of Molecular Sciences · doi:10.3390/ijms262110766 · Cited by 2
Blanco, I., Chen, S., Yeo, E., Reasonover, S. R., & Santisteban, M. M. (2025) · Cellular and Molecular Neurobiology · doi:10.1007/s10571-025-01628-z · Cited by 1
Lucente, E., Domi, A., Ericson, M., & Adermark, L. (2026) · Neuropharmacology · doi:10.1016/j.neuropharm.2026.110879 · Cited by 1
Rhythmic network activity in human brain slices: variability, mechanisms, and translational insights
Yang, D., & Feldmeyer, D. (2026) · Frontiers in Synaptic Neuroscience · doi:10.3389/fnsyn.2026.1798456 · Cited by 2
Herr, S. J., Oten, S., Bernstock, J. D., Rolston, J. D., & Hervey‐Jumper, S. L. (2025) · Neuro-Oncology Advances · doi:10.1093/noajnl/vdaf109 · Cited by 1
Cellular mechanisms regulating the timing of organizational effects of sex steroid hormones
Sakata, J. T., & Balthazart, J. (2026) · Hormones and Behavior · doi:10.1016/j.yhbeh.2026.105923 · Cited by 1
WONOEP XVII appraisal: The role of the extracellular matrix in epilepsy
Lugarà, E., van Vliet, E. A., Romagnolo, A., Staley, K. J., Lillis, K. P., Dulla, C. G., Henshall, D. C., & Kobow, K. (2026) · Epilepsia · doi:10.1002/epi.70278 · Cited by 1
Sharlow, E. R., Llaneza, D. C., Tewari, B. P., Mingledorff, G. A., Mendelson, A. J., Sontheimer, H. W., Bloom, G. S., & Lazo, J. S. (2023) · FEBS Journal · doi:10.1111/febs.16901 · Cited by 1
Self-citationExciting insights into tumour-associated epilepsy with electrophysiological and optical recording
French, C. R. (2022) · Brain · doi:10.1093/brain/awac351 · Cited by 1
Daily membrane capacitance changes in mouse neuronsPreprint
Severín, D., Moreno, C., Tran, T., Wesselborg, C., Shirley, S., Kirkwood, A., & Golowasch, J. (2022) · bioRxiv (Cold Spring Harbor Laboratory) · doi:10.1101/2022.12.09.519806 · Cited by 1
Patel, D. C., Swift, N. A., Tewari, B. P., Browning, J. L., Prim, C. E., Chaunsali, L., Kimbrough, I. F., Olsen, M. L., & Sontheimer, H. W. (2023) · bioRxiv (Cold Spring Harbor Laboratory) · doi:10.1101/2023.05.16.541066 · Cited by 1
Self-citationDeasy, S., Amontree, M., Colon, Z. A., Thorland, E., Modi, K., Hummel, K., Blanco, I., Greco, G. A., Maguire‐Zeiss, K. A., & Conant, K. E. (2025) · bioRxiv (Cold Spring Harbor Laboratory) · doi:10.1101/2025.11.09.687435 · Cited by 1
Perineural Net Degradation Could Play Key Role in Acquired Seizures
Samson, K. (2019) · Neurology Today · doi:10.1097/01.nt.0000553300.18506.9b
Pater, B. A. (2020) · eDiss (Georg-August-Universität Göttingen) · doi:10.53846/goediss-8059
Potential involvement of perineuronal nets in brain aging
Yamada, J., & Jinno, S. (2021) · Elsevier eBooks · doi:10.1016/b978-0-12-817990-1.00015-9
Komiyama, K., Iijima, K., Kawabata‐Iwakawa, R., Fujihara, K., Kakizaki, T., Yanagawa, Y., Yoshimoto, Y., & Miyata, S. (2021) · Research Square · doi:10.21203/rs.3.rs-1047051/v1
Usende, I. L., Olopade, J. O., Azeez, I. A., Andrioli, A., Bankole, O. O., Olopade, F. E., Nafady, A. A., & Bentivoglio, M. (2022) · Research Square · doi:10.21203/rs.3.rs-1525939/v1
Sajikumar, S., & Benoy, A. (2020) · Faculty Opinions – Post-Publication Peer Review of the Biomedical Literature · doi:10.3410/f.737102802.793571039
Wu, L., & Bosco, D. B. (2021) · Faculty Opinions – Post-Publication Peer Review of the Biomedical Literature · doi:10.3410/f.740425005.793587748
Comprehensive bioinformatic analysis of key genes and signaling pathways in glioma
Zhang, X., Jiang, M., Tang, S., Niu, C., & Hu, S. (2022) · JUSTC · doi:10.52396/justc-2022-0010
Hanssen, K. Ø., Ness, T. V., & Halnes, G. (2023) · bioRxiv (Cold Spring Harbor Laboratory) · doi:10.1101/2023.06.05.543694
การพฒนารปแบบการทำนายการเกดชกในผปวยภาวะวกฤตทตรวจพบคลนไฟฟาสมองแบบเพรออดกดสชารต (periodic discharges)
สุรวัฒนาวงศ์, ท., & ลิโมทัย, ช. (2022) · doi:10.58837/chula.the.2022.1025
Research Progress on the Pathogenesis of Brain Tumor Related Epilepsy
焦, 菲. (2023) · Advances in Clinical Medicine · doi:10.12677/acm.2023.13122712
Activity-dependent turnover of the Perineural Extracellular Matrix
Petersen, G. C. (2024) · eDiss (Georg-August-Universität Göttingen) · doi:10.53846/goediss-10429
Dzyubenko, E., Willig, K. I., Yin, D., Sardari, M., Tokmak, E., Labus, P., Schmermund, B., & Hermann, D. M. (2023) · Figshare · doi:10.6084/m9.figshare.24076907
Dzyubenko, E., Willig, K. I., Yin, D., Sardari, M., Tokmak, E., Labus, P., Schmermund, B., & Hermann, D. M. (2023) · Figshare · doi:10.6084/m9.figshare.24076901
Dzyubenko, E., Willig, K. I., Yin, D., Sardari, M., Tokmak, E., Labus, P., Schmermund, B., & Hermann, D. M. (2023) · Figshare · doi:10.6084/m9.figshare.24076904
Preface to the Special Issue “Matrix Metalloproteinases in Health and Disease”
Amontree, M., & Conant, K. E. (2025) · Journal of Neurochemistry · doi:10.1111/jnc.70032
The Effect of Dopamine on Neuroplasticity in Spinal Cord Injury
Chesnokov, A. A., Kalinina, D. S., Makhortykh, A. E., Khuzin, D. V., & Евгеньевич, М. П. (2025) · Journal of Evolutionary Biochemistry and Physiology · doi:10.1134/s0022093025040015
Hummel, K., Stefansson, L., Gilbert, K. F., Amontree, M., Ma, J., Pak, D. T. S., & Conant, K. E. (2025) · bioRxiv (Cold Spring Harbor Laboratory) · doi:10.1101/2025.09.12.675856
Zhao, Y., Xie, W.-L., Liu, Y., He, J., Chen, J., & Wang, F. (2025) · Molecular Therapy · doi:10.1016/j.ymthe.2025.10.045
Seto, M., Klinger, H. M., Clifton, M. J., Janve, V. A., Brown, J. A., Birkenbihl, C., Coughlan, G., Townsend, D. L., Wang, T., Properzi, M. J., et al. (2025) · bioRxiv (Cold Spring Harbor Laboratory) · doi:10.1101/2025.11.21.689770
Dzyubenko, E., Willig, K. I., Yin, D., Sardari, M., Tokmak, E., Labus, P., Schmermund, B., & Hermann, D. M. (2023) · Figshare · doi:10.6084/m9.figshare.24076910
Hummel, K., Shautidze, G., Thorland, E., Amontree, M., Wonnenberg, P. M., Blanco, I., & Conant, K. (2025) · bioRxiv (Cold Spring Harbor Laboratory) · doi:10.64898/2025.12.12.693967
Subramanian, D., Contreras, E. M., Dovek, L., Jaberi, R., Green, E., Lao, Y. K., Ethell, I. M., & Santhakumar, V. (2026) · bioRxiv (Cold Spring Harbor Laboratory) · doi:10.64898/2026.01.09.698505
Ventral pallidal perineuronal nets regulate opioid relapsePreprint
Nogueira, M., Giannotti, G., Miller, C. N., Guaderrama, S. D., Kregar, N. P., Wiedmeyer, B., Fayette, N., & Heinsbroek, J. A. (2026) · bioRxiv (Cold Spring Harbor Laboratory) · doi:10.64898/2026.01.21.700926
Radford, A. F., Whitten, C. J., Wells, A. N., Hooker, M. K., & Cooper, M. A. (2026) · Physiology & Behavior · doi:10.1016/j.physbeh.2026.115246
Disruption of psychostimulant-associated memories by single, low dose ketamine in rats
Gonzalez, A. E., Ramos, J. D., Anderson, Z., Sewell, C. M., Modaberi, S., Hentges, S. T., Brown, T. E., & Sorg, B. A. (2026) · Neuropharmacology · doi:10.1016/j.neuropharm.2026.110912
Douceau, S. (2020) · theses.fr (ABES) · doi:10.70675/6f1007f2z8468z4365zb07dz7d863bf32cd5
Retrosplenial perineuronal nets support hippocampal-cortical coupling and spatial memory recall
Mayne, P., Xiao, D., Sullivan, R., Burne, T. H. J., & Balbi, M. (2026) · Cell Reports · doi:10.1016/j.celrep.2026.117440
Metadata
- Authors
- Tewari, B. P., Chaunsali, L., Campbell, S. L., Patel, D. C., Goode, A. E., & Sontheimer, H.
- Affiliations
- Carilion Clinic (US)
- Corresponding author
- Sontheimer, Harald
- Venue
- Nature Communications
- Published
- 2018-11-09
- Volume
- 9
- Issue
- 1
- Pages
- 4724-4724
- ISSN
- 2041-1723 (ISSN-L)
- PMC
- PMC6226462
- OpenAlex
- W2900125538
- Cited by
- 208
- References
- 64
- Citations by year
- 2026: 24 · 2025: 38 · 2024: 28 · 2023: 30 · 2022: 31 · 2021: 24 · 2020: 20 · 2019: 13
- FWCI
- 11.14
- Type
- journal article
- Language
- en
- Open access
- gold
- doi.org
- Locations
- Nature Communications (publishedVersion, cc-by)
- Europe PMC (PubMed Central) (publishedVersion, other-oa)
- PubMed Central (publishedVersion, cc-by)
- PubMed (publishedVersion)
- RePEc: Research Papers in Economics (submittedVersion)
- DOAJ (DOAJ: Directory of Open Access Journals) (submittedVersion, cc-by-sa)
- DOAJ (DOAJ: Directory of Open Access Journals) (submittedVersion)
- VTechWorks (Virginia Tech) (submittedVersion, cc-by)
- Funders
- National Institutes of Health
- National Institute of Neurological Disorders and Stroke (R01NS052634, R01NS036692, R01NS082851)
- Topics
- Health Sciences › Medicine › Clinical Neurology › Epilepsy research and treatment
- Life Sciences › Neuroscience › Cellular and Molecular Neuroscience › Neuroscience and Neuropharmacology Research
- Life Sciences › Neuroscience › Cognitive Neuroscience › Neural dynamics and brain function
- Keywords
- perineuronal nets, fast-spiking interneurons, membrane capacitance, tumor-associated epilepsy, GABAergic inhibition, proteolytic enzymes, tumor microenvironment, excitatory-inhibitory imbalance, epilepsy treatment
- MeSH terms
- Action Potentials, Animals, Brain Neoplasms, Cell Membrane, Disease Models, Animal, Epilepsy, Extracellular Matrix, Female, Glioma, Gliosis, Interneurons, Male, Mice, Nude, Peptide Hydrolases, Mice, SCID, Electric Capacitance, Biophysical Phenomena
About these checks
Registry, retraction, Cites and statistics results are computed, not judged, with one exception: a printed reference that no index lists is read once by a model before it counts as a citation error. Claims are extracted by a model and kept only when their quote appears verbatim in the text; each cited source is then checked, with a model’s help, for whether it says what the claim relies on. Those verdicts can be wrong — read the claim’s quote and the cited source before relying on one.
A language model drew the claims from the paper on 2026-10-06, under version 3 of the claim definition (model deepseek-v4.1-flash, prompt extract-v3).
A second model labelled each claim on 2026-10-06 (model jev-1.13-20260917, definition revision gold-guideline-v0.2).
Cited sources are checked with a language model’s help (gpt-6-sol).
Statistics and arithmetic are recomputed, not judged.
Confidence bands are shown only for fields calibrated on our annotated test set. None is calibrated yet, so no band is shown.
What counts as a claim ›How we measure confidence ›How we check this ›
Are you an author, or do you see a problem with this page? Request a review
