

The DOI matches its Crossref record; 70 of the 70 references it cites were found in a registry or an index; 60 of the 72 sources its claims cite were checked for support.
Endosomal PI(3)P regulation by the COMMD/CCDC22/CCDC93 (CCC) complex controls membrane protein recycling
Open accessAbstract
Protein recycling through the endolysosomal system relies on molecular assemblies that interact with cargo proteins, membranes, and effector molecules. Among them, the COMMD/CCDC22/CCDC93 (CCC) complex plays a critical role in recycling events. While CCC is closely associated with retriever, a cargo recognition complex, its mechanism of action remains unexplained. Herein we show that CCC and retriever are closely linked through sharing a common subunit (VPS35L), yet the integrity of CCC, but not retriever, is required to maintain normal endosomal levels of phosphatidylinositol-3-phosphate (PI(3)P). CCC complex depletion leads to elevated PI(3)P levels, enhanced recruitment and activation of WASH (an actin nucleation promoting factor), excess endosomal F-actin and trapping of internalized receptors. Mechanistically, we find that CCC regulates the phosphorylation and endosomal recruitment of the PI(3)P phosphatase MTMR2. Taken together, we show that the regulation of PI(3)P levels by the CCC complex is critical to protein recycling in the endosomal compartment.
Overview
AI snapshot
Written from the paper’s full text.
TL;DR
The CCC complex is a distinct ~700 kDa assembly from retriever (~250 kDa) that shares VPS35L and negatively regulates WASH-dependent endosomal F-actin by controlling PI(3)P turnover via MTMR2. CCC loss elevates endosomal PI(3)P, recruits/activates WASH, traps recycling receptors, and VPS34 inhibition or phosphorylation-resistant MTMR2 S58A rescues these phenotypes.
Key findings
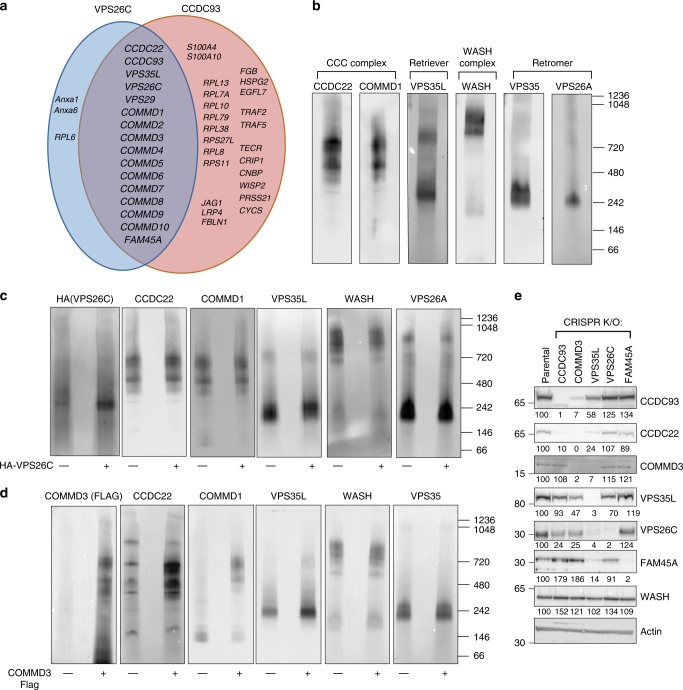
- CCC and retriever are separable: blue native gel analysis places CCC components COMMD1/CCDC22 near 700 kDa, while VPS35L migrates in both ~700 kDa and ~250 kDa complexes; retriever is ~250 kDa, and VPS35L is a shared subunit. CCC loss collapses the 700 kDa complex, whereas VPS26C loss affects the lower complex.
- CCC depletion, but not VPS26C or FAM45A depletion, increases endosomal PI(3)P: a dsRed-EEA1-FYVE reporter shows ~2.5-fold higher PI(3)P in COMMD3 and CCDC93 KO cells, and HPLC shows ~3.2-fold higher total PI(3)P in COMMD3 KO cells.
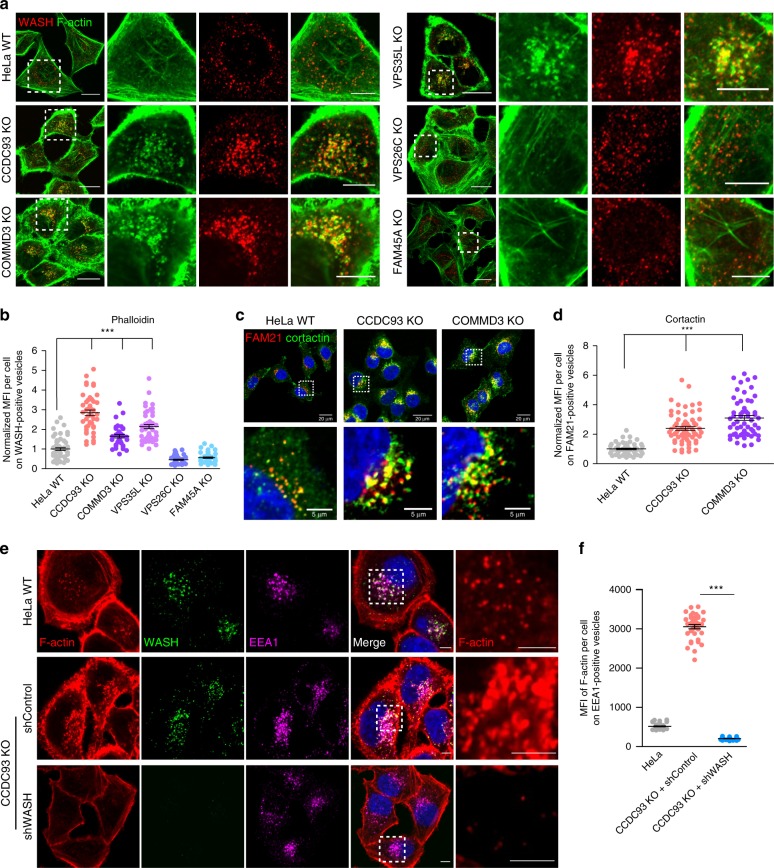
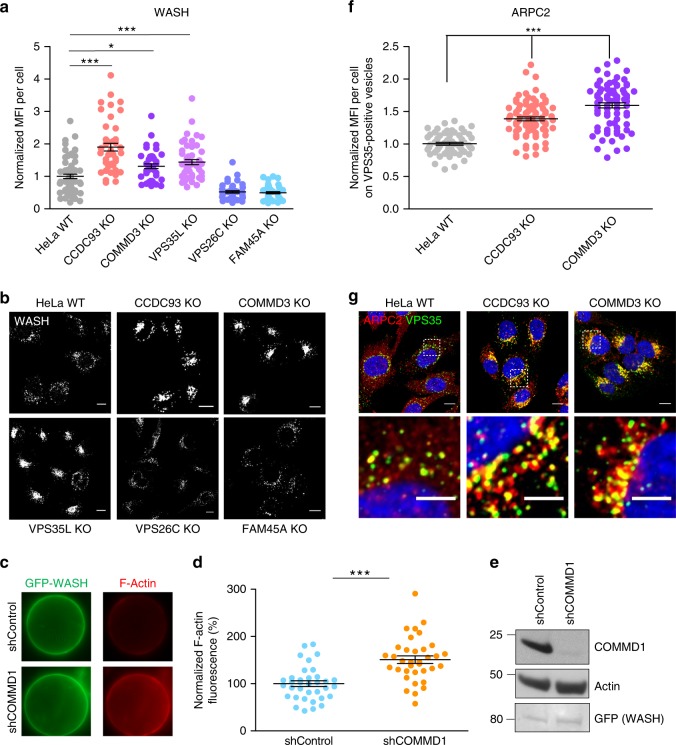
- CCC loss increases WASH recruitment/activity and endosomal F-actin: WASH, F-actin, cortactin, and ARPC2 accumulate on endosomal compartments; WASH knockdown eliminates excess endosomal F-actin, and Commd1 depletion increases WASH actin-nucleating activity.
- Mechanistically, CCDC22 binds MTMR2; COMMD1 deficiency elevates phosphorylated MTMR2, MTMR2 knockdown phenocopies CCC loss, and endosomally localized MTMR2 S58A rescues F-actin accumulation in COMMD3 KO cells. VPS34 inhibition or siRNA reduces PI(3)P, WASH, F-actin, and restores integrin recycling defects.
Methods
- CRISPR/Cas9 knockout HeLa lines for CCDC93, VPS26C, COMMD3, VPS35L, and FAM45A, with lentiviral rescue; HEK293T cells, mouse embryonic fibroblasts, and patient CCDC22 p.T17A fibroblasts; siRNA/shRNA for VPS34, MTMR2, WASH, and COMMD1.
- Proteomics by HA-CCDC93/HA-VPS26C immunoprecipitation and LC-MS/MS; blue native PAGE; co-immunoprecipitation/immunoblotting; confocal immunofluorescence; pyrene-actin assembly assays; HPLC for phosphoinositides; VPS34 in vitro kinase ELISA; integrin endocytosis/recycling assays.
- Statistics: mean ± SEM; one-way ANOVA with Dunnett’s test or unpaired two-tailed t test; P < 0.05 considered significant.
Limitations
- Stated: the precise mechanisms by which endosomal PI(3)P controls WASH recruitment/activation remain to be fully elucidated; how CCC controls MTMR2 phosphorylation and how PI(3)P impacts WASH need future study; the unique contributions of each COMMD protein remain poorly understood.
- Evident: mechanistic conclusions rely largely on cultured HeLa, HEK293T, mouse embryonic fibroblast, and patient fibroblast systems, with in vivo disease relevance inferred from prior models; the proteomic interactome was n = 1 per group; no direct MTMR2 phosphatase activity assay is shown, only phosphorylation, recruitment, and genetic rescue data.
Model-written summary. Check it against the paper before relying on it.
Integrity signals
Registry
Cites
Statistics
Figures
Verification
Claims the paper makes
67 Own result · 35 Own interpretation · 17 Partly supported · 14 Own method · 5 No basis given · 4 No full text of the sources · 3 Supported · 2 Couldn’t confirm · accuracy not yet measured
The cited sources support only part of this claim — read each source’s verdict below.
In the paper
“CCC deficiency in human and mouse cells causes defective recycling of SNX17-retriever cargoes such as β1 integrin, LDLR, and LRP120,31,32”
§ Endosomal PI(3)P regulation by the COMMD/CCDC22/CCDC93 (CCC) complex controls membrane protein recycling > Introduction
What the sources say
- Partly supportedcites [20] McNally, K. E. et al. Retriever is a multiprotein complex for retromer-independent endosomal cargo recycling. Nat. Cell Biol. 30, 3481 (2017). sourceExperimental — accuracy not yet measured
The Results section on CCC depletion (page not provided) reports that suppressing CCC components reduced recycling of β1 integrin. The proteomic-identification Results section describes LDLR recycling as CCC-dependent, citing earlier work; another Results section finds that LRP1 cell-surface levels depend on SNX17 and retriever, but does not establish the effect of CCC deficiency on LRP1. The passages found do not report the claimed defect in mouse cells. (LLM, conf=0.88)
- Partly supportedcites [31] Bartuzi, P. et al. CCC- and WASH-mediated endosomal sorting of LDLR is required for normal clearance of circulating LDL. Nat. Commun. 7, 10961 (2016). sourceExperimental — accuracy not yet measured
The Results section, “COMMD1 and WASH facilitate LDLR trafficking” (page unavailable), reports mislocalized LDLR and markedly reduced surface LDLR in COMMD1-deficient mouse cells. The Discussion describes SNX17 involvement in LDLR trafficking as a hypothesis, not an established CCC–SNX17-retriever pathway. Our copy does not show defective recycling of β1 integrin or LRP1 caused by CCC deficiency, or demonstrate the claimed cargo defects in human cells. (LLM, conf=0.87)
- Partly supportedcites [32] Fedoseienko, A. et al. The COMMD family regulates plasma LDL levels and attenuates satherosclerosis through stabilizing the CCC complex in endosomal LDLR trafficking. Circ. Res. 122, 1648–1660 (2018). sourceExperimental — accuracy not yet measured
The Discussion (page unavailable) reports that CCC inactivation affects LDLR and LRP1 function and reduces their surface levels in mouse liver, likely through impaired endosomal trafficking. It describes their recycling through the SNX17–CCC–WASH pathway as a speculation, not an established retriever-cargo result. The passages do not establish defective β1-integrin recycling or the claimed recycling defect in human cells. (LLM, conf=0.85)
plaindirect- Asserted: passes — The authors put it forward as true.
- Checkable: passes — It can be checked against evidence.
- Load-bearing: passes — The paper’s conclusions depend on it.
- Based: passes — The paper gives a reason why it holds.
- Partly supported
The cited sources support only part of this claim — read each source’s verdict below.
In the paper
“interaction experiments by unbiased screens in mammalian cells46, as well as protein–protein interaction studies in Drosophila47–49, produced interactome data that in aggregate includes all the proteins identified experimentally in our mass spectrometry data, including the identification of FAM45A as a CCC and retriever binding protein”
§ Endosomal PI(3)P regulation by the COMMD/CCDC22/CCDC93 (CCC) complex controls membrane protein recycling > Results > Defining the CCC and retriever interactomes
What the sources say
- Partly supportedcites [46] Huttlin, E. L. et al. Architecture of the human interactome defines protein communities and disease networks. Nature 545, 505–509 (2017). sourceExperimental — accuracy not yet measured
Split into 2 atoms — 1 confirmed, 1 partially supported, 0 disputed, 0 misattributed, 0 unverifiable. Expand the claim to see per-atom verdicts.
- Not checked — no full text of the sourcecites [47] Giot, L. et al. A protein interaction map of Drosophila melanogaster. Science 302, 1727–1736 (2003). source
- Supportedcites [48] Guruharsha, K. G. et al. A protein complex network of Drosophila melanogaster. Cell 147, 690–703 (2011). source
Split into 2 atoms — 2 confirmed, 0 partially supported, 0 disputed, 0 misattributed, 0 unverifiable. Expand the claim to see per-atom verdicts.
- Supportedcites [49] Formstecher, E. et al. Protein interaction mapping: a Drosophila case study. Genome Res. 15, 376–384 (2005). source
Split into 2 atoms — 2 confirmed, 0 partially supported, 0 disputed, 0 misattributed, 0 unverifiable. Expand the claim to see per-atom verdicts.
plaincorrelational- Asserted: passes — The authors put it forward as true.
- Checkable: passes — It can be checked against evidence.
- Load-bearing: unclear — It is unclear whether the paper’s conclusions depend on it.
- Based: passes — The paper gives a reason why it holds.
- Partly supported
The cited sources support only part of this claim — read each source’s verdict below.
In the paper
“CCC recruitment to endosomal membranes is dependent on the pentameric Wiskott-Aldrich syndrome protein and SCAR homologue (WASH) complex27”
§ Endosomal PI(3)P regulation by the COMMD/CCDC22/CCDC93 (CCC) complex controls membrane protein recycling > Introduction
What the sources say
- Partly supportedcites [27] Phillips-Krawczak, C. A. et al. COMMD1 is linked to the WASH complex and regulates endosomal trafficking of the copper transporter ATP7A. Mol. Biol. Cell 26, 91–103 (2015). sourceExperimental — accuracy not yet measured
The Results section, “FAM21 is required for endosomal recruitment of the CCC complex” (page unavailable), concludes that the WASH-complex subunit FAM21 is required for CCC recruitment to endosomes. But it also reports that loss of Wash did not abolish COMMD1 endosomal localization, so dependence on the WASH complex as a whole is broader than the demonstrated finding. (LLM, conf=0.86)
plaindirect- Asserted: passes — The authors put it forward as true.
- Checkable: passes — It can be checked against evidence.
- Load-bearing: passes — The paper’s conclusions depend on it.
- Based: passes — The paper gives a reason why it holds.
- Partly supported
The cited sources support only part of this claim — read each source’s verdict below.
In the paper
“VPS34, the main lipid kinase involved in the generation of endosomal PI(3)P2–4”
§ Endosomal PI(3)P regulation by the COMMD/CCDC22/CCDC93 (CCC) complex controls membrane protein recycling > Results > VPS34 blockade reverts endosomal phenotypes of CCC depletion
What the sources say
- Partly supportedcites [2] Volinia, S. et al. A human phosphatidylinositol 3-kinase complex related to the yeast Vps34p-Vps15p protein sorting system. EMBO J. 14, 3339–3348 (1995). sourceExperimental — accuracy not yet measured
The Introduction identifies yeast Vps34p as a PtdIns 3-kinase, and the paper reports that the human homologue produces PtdIns3P. The discussion proposes a role in intracellular protein trafficking, but does not establish that VPS34 is the main source of endosomal PI(3)P. Page numbers are unavailable in our copy. (LLM, conf=0.87)
- Not checked — no full text of the sourcecites [3] Christoforidis, S. et al. Phosphatidylinositol-3-OH kinases are Rab5 effectors. Nat. Cell Biol. 1, 249–252 (1999). source
- Supportedcites [4] Murray, J. T., Panaretou, C., Stenmark, H., Miaczynska, M. & Backer, J. M. Role of Rab5 in the recruitment of hVps34/p150 to the early endosome. Traffic 3, 416–427 (2002). source
The Abstract identifies hVps34 as the apparent major lipid kinase in early endosomes and states that its lipid product is PI[3]P. This supports the citing sentence’s description of VPS34’s role in generating endosomal PI(3)P. (LLM, conf=0.92)
plaindirect- Asserted: passes — The authors put it forward as true.
- Checkable: passes — It can be checked against evidence.
- Load-bearing: passes — The paper’s conclusions depend on it.
- Based: passes — The paper gives a reason why it holds.
- Partly supported
The cited sources that could be checked couldn’t confirm or dispute this claim.
In the paper
“two independent high-throughput proteomics screens identified that MTMR2 may interact with CCDC2246,57”
§ Endosomal PI(3)P regulation by the COMMD/CCDC22/CCDC93 (CCC) complex controls membrane protein recycling > Results > The PI(3)P phosphatase MTMR2 is regulated by the CCC complex
What the sources say
- Could not verifycites [46] Huttlin, E. L. et al. Architecture of the human interactome defines protein communities and disease networks. Nature 545, 505–509 (2017). sourceExperimental — accuracy not yet measured
Our copy describes the BioPlex high-throughput protein-interaction screen (Affinity-Purification Mass Spectrometry methods; page unavailable), but the retrieved passages do not identify an MTMR2–CCDC22 interaction. Searches for “MTMR2 CCDC22 interaction,” “MTMR2,” and “CCDC22” found no passage addressing that protein pair, so our copy cannot verify this source's contribution to the claim about two screens. (LLM, conf=0.72)
- Could not verifycites [57] St-Denis, N. et al. Phenotypic and interaction profiling of the human phosphatases identifies diverse mitotic regulators. Cell Rep. 17, 2488–2501 (2016). sourceExperimental — accuracy not yet measured
The supplied passage has no section or page label and contains only URLs, not findings about protein interactions. Searches of our copy for “MTMR2 CCDC22,” each protein name separately, and interaction proteomics found no passage stating that MTMR2 may interact with CCDC22. (LLM, conf=0.75)
hedgedcorrelational- Asserted: passes — The authors put it forward as true.
- Checkable: passes — It can be checked against evidence.
- Load-bearing: passes — The paper’s conclusions depend on it.
- Based: passes — The paper gives a reason why it holds.
- Could not verify
Every source the paper cites for this claim was checked and supports it.
In the paper
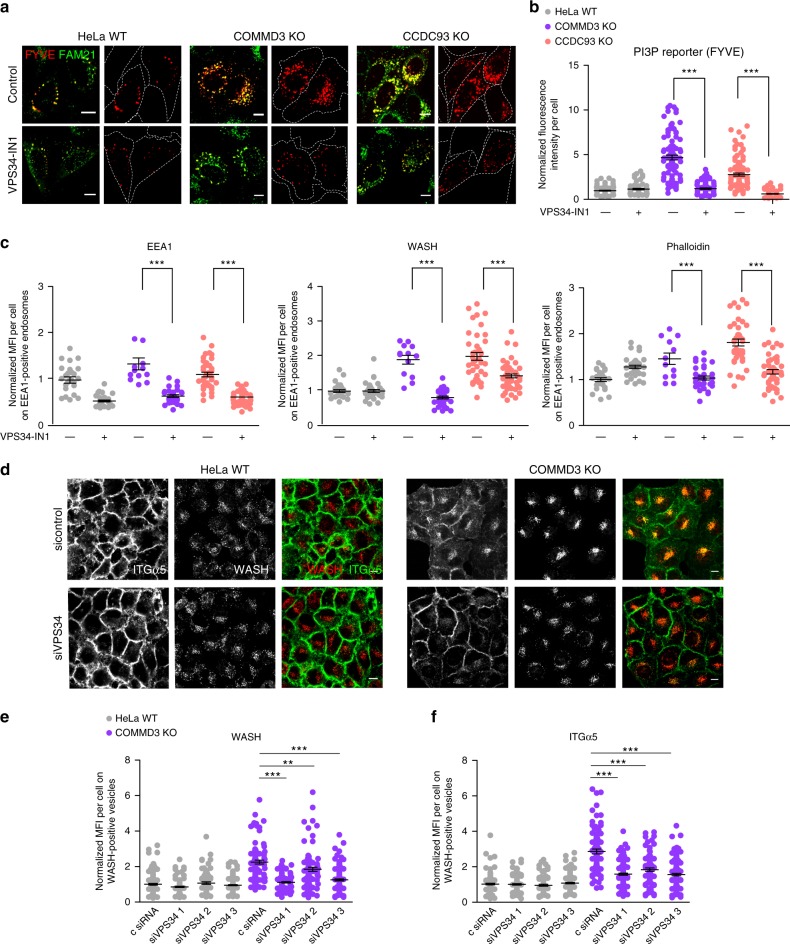
“chemical inhibition of VPS34 using a highly specific VPS34 inhibitor (VPS34-IN1)55 reduced the PI(3)P reporter signal in CCC-deficient cells (Fig. 6a, b).”
§ Endosomal PI(3)P regulation by the COMMD/CCDC22/CCDC93 (CCC) complex controls membrane protein recycling > Results > VPS34 blockade reverts endosomal phenotypes of CCC depletion
What the sources say
- Supportedcites [55] Bago, R. et al. Characterization of VPS34-IN1, a selective inhibitor of Vps34, reveals that the phosphatidylinositol 3-phosphate-binding SGK3 protein kinase is a downstream target of class III phosphoinositide 3-kinase. Biochem. J. 463, 413–427 (2014). source
The Results section identifies VPS34-IN1 as a potent, selective VPS34 inhibitor and reports that it reduces localization of a PI(3)P reporter at endosomes. Citation 55 is attached to the inhibitor identification; the CCC-deficient-cell result is attributed to the citing paper’s Figure 6, not to this source. (LLM, conf=0.93)
plaindirect- Asserted: passes — The authors put it forward as true.
- Checkable: passes — It can be checked against evidence.
- Load-bearing: passes — The paper’s conclusions depend on it.
- Based: passes — The paper gives a reason why it holds.
- Supported
The cited sources support only part of this claim — read each source’s verdict below.
In the paper
“the CCC protein complex, which consists of CCDC22, CCDC93, and any of the 10 COMMD proteins, is required for retromer- and retriever-dependent protein trafficking27–32”
§ Endosomal PI(3)P regulation by the COMMD/CCDC22/CCDC93 (CCC) complex controls membrane protein recycling > Introduction
What the sources say
- Partly supportedcites [27] Phillips-Krawczak, C. A. et al. COMMD1 is linked to the WASH complex and regulates endosomal trafficking of the copper transporter ATP7A. Mol. Biol. Cell 26, 91–103 (2015). sourceExperimental — accuracy not yet measured
The Results section (‘The CCC complex regulates ATP7A trafficking’; page unavailable) shows that loss of CCC components disrupts trafficking of retromer cargo, including ATP7A and TGN46. The paper also identifies CCDC22, CCDC93, and COMMD proteins as CCC-associated components. Our copy does not address retriever-dependent trafficking, so that part of the claim is unsupported by this source. (LLM, conf=0.89)
- Partly supportedcites [28] Burstein, E. COMMD proteins, a novel family of structural and functional homologs of MURR1. J. Biol. Chem. 280, 22222–22232 (2005). sourceExperimental — accuracy not yet measured
The section on COMMD1 interactions reports ten COMMD proteins and shows that COMMD1 can associate with the other family members (page not available). It does not establish that they form a CCC complex with CCDC22 and CCDC93, or that CCC is required for retromer- or retriever-dependent trafficking. Thus it supports only the COMMD-family portion of the cited sentence, not the trafficking claim. (LLM, conf=0.82)
- Not checked — no full text of the sourcecites [29] van de Sluis, B., Rothuizen, J., Pearson, P. L., van Oost, B. A. & Wijmenga, C. Identification of a new copper metabolism gene by positional cloning in a purebred dog population. Hum. Mol. Genet. 11, 165–173 (2002). source
- Could not verifycites [30] Starokadomskyy, P. et al. CCDC22 deficiency in humans blunts activation of proinflammatory NF-κB signaling. J. Clin. Invest. 123, 2244–2256 (2013). sourceExperimental — accuracy not yet measured
The section on CCDC22 and COMMD localization reports that CCDC22 interacts with all 10 COMMD proteins and regulates their cellular distribution. Neither that passage nor the additional passages retrieved for retromer, retriever, and trafficking addresses whether the CCC complex is required for retromer- or retriever-dependent protein trafficking. (LLM, conf=0.75)
- Partly supportedcites [31] Bartuzi, P. et al. CCC- and WASH-mediated endosomal sorting of LDLR is required for normal clearance of circulating LDL. Nat. Commun. 7, 10961 (2016). sourceExperimental — accuracy not yet measured
The introductory passage (page unavailable) says CCC interacts and colocalizes with retromer, and the Results section reports CCC-mediated endosomal trafficking. The copy does not establish that CCC is required for retromer-dependent trafficking, and it does not mention retriever-dependent trafficking. It also lists C16orf62 as a CCC component, which the citing sentence omits. (LLM, conf=0.85)
- Partly supportedcites [32] Fedoseienko, A. et al. The COMMD family regulates plasma LDL levels and attenuates satherosclerosis through stabilizing the CCC complex in endosomal LDLR trafficking. Circ. Res. 122, 1648–1660 (2018). sourceExperimental — accuracy not yet measured
The Abstract describes CCC as containing COMMD proteins, CCDC22, and CCDC93, and says its recruitment to endosomes depends on the retromer subunit VPS35. The Discussion says retriever recruitment relies on CCC and WASH and reports that inactivating CCC affects LDLR and LRP1 trafficking. These passages support a role in both pathways, but do not establish that CCC is required for retromer- and retriever-dependent protein trafficking generally; the paper also treats the precise organization of the retriever–CCC pathway as unresolved. Page numbers are unavailable in our copy. (LLM, conf=0.84)
plaindirect- Asserted: passes — The authors put it forward as true.
- Checkable: passes — It can be checked against evidence.
- Load-bearing: passes — The paper’s conclusions depend on it.
- Based: passes — The paper gives a reason why it holds.
- Partly supported
Every source the paper cites for this claim was checked and supports it.
In the paper
“CCC subunits co-evolved with the WASH complex20,36”
§ Endosomal PI(3)P regulation by the COMMD/CCDC22/CCDC93 (CCC) complex controls membrane protein recycling > Discussion
What the sources say
- Supportedcites [20] McNally, K. E. et al. Retriever is a multiprotein complex for retromer-independent endosomal cargo recycling. Nat. Cell Biol. 30, 3481 (2017). source
The Results section, “Evolutionary analysis suggests that retriever, the CCC and WASH complexes have co-evolved,” reports that evolutionary analysis strongly inferred co-evolution of the CCC and WASH complexes with retriever. The Discussion likewise describes the complexes as having co-evolved. The paper presents this as an inference, consistent with the citing sentence. (LLM, conf=0.91)
- Supportedcites [36] Li, Y., Calvo, S. E., Gutman, R., Liu, J. S. & Mootha, V. K. Expansion of biological pathways based on evolutionary inference. Cell 158, 213–225 (2014). source
In Results, under “Exploring the evolutionary modularity of 1025 canonical pathways and complexes” (page unavailable), the paper places CCDC93 and CCDC22 in an evolutionary expansion of a WASH-complex gene module. That supports the claim of shared evolutionary history for these two WASH-associated proteins. (LLM, conf=0.86)
plaincorrelational- Asserted: passes — The authors put it forward as true.
- Checkable: passes — It can be checked against evidence.
- Load-bearing: unclear — It is unclear whether the paper’s conclusions depend on it.
- Based: passes — The paper gives a reason why it holds.
- Supported
A result the paper reports from its own data — it cites no other source for it, so there is none to check. The quote shows it is in the paper.
In the paper
“CCC complex depletion leads to elevated PI(3)P levels”
§ Endosomal PI(3)P regulation by the COMMD/CCDC22/CCDC93 (CCC) complex controls membrane protein recycling > Abstract
plaindirect- Asserted: passes — The authors put it forward as true.
- Checkable: passes — It can be checked against evidence.
- Load-bearing: passes — The paper’s conclusions depend on it.
- Based: passes — The paper gives a reason why it holds.
The paper states this without a source or data behind it here, so there is nothing to check it against. The quote shows it is in the paper.
In the paper
“excess endosomal F-actin”
§ Endosomal PI(3)P regulation by the COMMD/CCDC22/CCDC93 (CCC) complex controls membrane protein recycling > Abstract
plaindirect- Asserted: passes — The authors put it forward as true.
- Checkable: passes — It can be checked against evidence.
- Load-bearing: passes — The paper’s conclusions depend on it.
- Based: passes — The paper gives a reason why it holds.
- Probably not a substantial claim. 29
- It may state two separate claims as one. 47
The cited sources support only part of this claim — read each source’s verdict below.
In the paper
“the CCC complex shows close co-evolution with the WASH complex20,36”
§ Endosomal PI(3)P regulation by the COMMD/CCDC22/CCDC93 (CCC) complex controls membrane protein recycling > Introduction
What the sources say
- Supportedcites [20] McNally, K. E. et al. Retriever is a multiprotein complex for retromer-independent endosomal cargo recycling. Nat. Cell Biol. 30, 3481 (2017). source
The Results section, under “Evolutionary analysis suggests that retriever, the CCC and WASH complexes have co-evolved,” reports that evolutionary analysis strongly inferred co-evolution among these complexes. The Discussion likewise describes the CCC–WASH relationship as consistent with their having co-evolved. (LLM, conf=0.91)
- Partly supportedcites [36] Li, Y., Calvo, S. E., Gutman, R., Liu, J. S. & Mootha, V. K. Expansion of biological pathways based on evolutionary inference. Cell 158, 213–225 (2014). sourceExperimental — accuracy not yet measured
In Results, under “Exploring the evolutionary modularity of 1025 canonical pathways and complexes” (page not provided), two genes, CCDC93 and CCDC22, score highly in the expansion of a WASH evolutionary module. That supports shared evolutionary history for those genes and WASH components, but the passage does not identify them as the CCC complex or establish close co-evolution of the complexes as wholes. (LLM, conf=0.84)
plaincorrelational- Asserted: passes — The authors put it forward as true.
- Checkable: passes — It can be checked against evidence.
- Load-bearing: fails — The paper’s conclusions may not depend on it.
- Based: passes — The paper gives a reason why it holds.
Probably not a substantial claim. The paper’s conclusions may not depend on it.
- Supported
The cited sources support only part of this claim — read each source’s verdict below.
In the paper
“the CCC protein complex, which consists of CCDC22, CCDC93, and any of the 10 COMMD proteins”
§ Endosomal PI(3)P regulation by the COMMD/CCDC22/CCDC93 (CCC) complex controls membrane protein recycling > Introduction
What the sources say
- Partly supportedcites [27] Phillips-Krawczak, C. A. et al. COMMD1 is linked to the WASH complex and regulates endosomal trafficking of the copper transporter ATP7A. Mol. Biol. Cell 26, 91–103 (2015). sourceExperimental — accuracy not yet measured
The Results ('Identification of the CCC complex') report that all 10 COMMD proteins interact with CCDC93, and the Discussion identifies COMMD proteins, CCDC22, and CCDC93 as core components. But the Discussion also includes C16orf62 in the core composition, so the claim's apparently complete list omits a component. Page numbers are not provided in our copy's passages. (LLM, conf=0.88)
- Partly supportedcites [28] Burstein, E. COMMD proteins, a novel family of structural and functional homologs of MURR1. J. Biol. Chem. 280, 22222–22232 (2005). sourceExperimental — accuracy not yet measured
The “COMMD1 Can Associate with Other COMMD Proteins” section identifies 10 COMMD proteins and reports that COMMD1 interacts with the others (page unavailable). It does not identify a CCC complex or establish that CCDC22 and CCDC93 form a complex with any of those proteins; searches for those names and the CCC complex found no such passage. (LLM, conf=0.88)
- Not checked — no full text of the sourcecites [29] van de Sluis, B., Rothuizen, J., Pearson, P. L., van Oost, B. A. & Wijmenga, C. Identification of a new copper metabolism gene by positional cloning in a purebred dog population. Hum. Mol. Genet. 11, 165–173 (2002). source
- Partly supportedcites [30] Starokadomskyy, P. et al. CCDC22 deficiency in humans blunts activation of proinflammatory NF-κB signaling. J. Clin. Invest. 123, 2244–2256 (2013). sourceExperimental — accuracy not yet measured
In “COMMD proteins associate with CCDC22, a broadly expressed gene,” the paper reports that all 10 COMMD proteins interact with CCDC22. The Discussion proposes distinct CCDC22–COMMD complexes rather than one containing all 10 at once. Our copy does not establish CCDC93 as a component or describe the three-part CCC complex claimed here (searched: CCDC93, CCC complex). (LLM, conf=0.88)
- Partly supportedcites [31] Bartuzi, P. et al. CCC- and WASH-mediated endosomal sorting of LDLR is required for normal clearance of circulating LDL. Nat. Commun. 7, 10961 (2016). sourceExperimental — accuracy not yet measured
The paper states that all 10 COMMD family members can engage in the CCC complex (Discussion), supporting the claim's 'any of the 10' phrasing. Its description of the complex's composition also includes C16orf62 alongside CCDC22, CCDC93, and COMMD proteins (opening section); the citing sentence omits that component. Page numbers are not available in the supplied copy. (LLM, conf=0.91)
- Partly supportedcites [32] Fedoseienko, A. et al. The COMMD family regulates plasma LDL levels and attenuates satherosclerosis through stabilizing the CCC complex in endosomal LDLR trafficking. Circ. Res. 122, 1648–1660 (2018). sourceExperimental — accuracy not yet measured
The section on COMMD protein stability identifies CCDC22 and CCDC93 as CCC core components and describes their association with COMMD proteins. But it repeatedly identifies C16orf62 as a third CCC core component, which the claimed description of what the complex consists of omits. Our copy also describes all 10 COMMD proteins as assembled into CCC complexes, rather than specifying that a complex contains any one of them. Page numbers are not provided for these passages. (LLM, conf=0.90)
plain- Asserted: passes — The authors put it forward as true.
- Checkable: passes — It can be checked against evidence.
- Load-bearing: passes — The paper’s conclusions depend on it.
- Based: passes — The paper gives a reason why it holds.
Probably not a substantial claim.
- Partly supported
The cited sources support only part of this claim — read each source’s verdict below.
In the paper
“WASH serves as an actin nucleation-promoting factor for the ARP2/3 complex, which drives the generation of branched F-actin filaments on endosomal membranes37–40”
§ Endosomal PI(3)P regulation by the COMMD/CCDC22/CCDC93 (CCC) complex controls membrane protein recycling > Introduction
What the sources say
- Supportedcites [37] Derivery, E. et al. The Arp2/3 activator WASH controls the fission of endosomes through a large multiprotein complex. Dev. Cell 17, 712–723 (2009). source
The Results state that WASH is an active nucleation-promoting factor on endosomes, where it recruits and activates Arp2/3 to induce actin polymerization. The Introduction identifies the resulting endosomal actin network as branched; page numbers are not provided in our copy. (LLM, conf=0.94)
- Supportedcites [38] Gomez, T. S. & Billadeau, D. D. A FAM21-containing WASH complex regulates retromer-dependent sorting. Dev. Cell 17, 699–711 (2009). source
The Introduction describes Arp2/3 as nucleating branched actin networks and explains that nucleation-promoting factors stimulate its activity. The Discussion identifies WASH as linking to Arp2/3-mediated F-actin polymerization and places the WASH–FAM21 complex on endosomes; the Results also report WASH, Arp2/3, and F-actin together on early endosomes. No page numbers are provided in our copy. (LLM, conf=0.91)
- Partly supportedcites [39] Gomez, T. S., Gorman, J. A., de Narvajas, A. A.-M., Koenig, A. O. & Billadeau, D. D. Trafficking defects in WASH-knockout fibroblasts originate from collapsed endosomal and lysosomal networks. Mol. Biol. Cell 23, 3215–3228 (2012). sourceExperimental — accuracy not yet measured
The Introduction identifies WASH as a member of the WASP family of nucleation-promoting factors, which activate Arp2/3 to stimulate F-actin polymerization. The Results show that WASH loss eliminates endosomal F-actin and Arp2/3-rich puncta. Our copy does not specify that the resulting endosomal filaments are branched, so that detail is not supported. (LLM, conf=0.82)
- Supportedcites [40] Jia, D. et al. WASH and WAVE actin regulators of the Wiskott-Aldrich syndrome protein (WASP) family are controlled by analogous structurally related complexes. Proc. Natl Acad. Sci. USA 107, 10442–10447 (2010). source
The Results and Discussion report that WASH activates Arp2/3-mediated actin assembly. The Abstract places WASH at endosomal subdomains associated with F-actin and describes its role in Arp2/3-dependent vesicle scission; the Conclusion also links Arp2/3-mediated assembly to filament branch density. Together, these support the cited mechanistic paraphrase. (LLM, conf=0.87)
plaindirect- Asserted: passes — The authors put it forward as true.
- Checkable: passes — It can be checked against evidence.
- Load-bearing: passes — The paper’s conclusions depend on it.
- Based: passes — The paper gives a reason why it holds.
Probably not a substantial claim.
- Supported
The cited sources support only part of this claim — read each source’s verdict below.
In the paper
“Regulation of branched F-actin formation by WASH is needed for proper morphology of the endolysosomal system and endosomal trafficking of a broad range of cargoes37,39,41–44”
§ Endosomal PI(3)P regulation by the COMMD/CCDC22/CCDC93 (CCC) complex controls membrane protein recycling > Introduction
What the sources say
- Partly supportedcites [37] Derivery, E. et al. The Arp2/3 activator WASH controls the fission of endosomes through a large multiprotein complex. Dev. Cell 17, 712–723 (2009). sourceExperimental — accuracy not yet measured
The Results show that blocking WASH-mediated Arp2/3 activation causes endosomal tubulation, and that WASH depletion impairs transferrin recycling. They do not establish defective trafficking of a broad range of cargoes or a requirement for normal morphology across the entire endolysosomal system; the LDL experiments track WASH localization rather than a trafficking defect. (LLM, conf=0.88)
- Partly supportedcites [39] Gomez, T. S., Gorman, J. A., de Narvajas, A. A.-M., Koenig, A. O. & Billadeau, D. D. Trafficking defects in WASH-knockout fibroblasts originate from collapsed endosomal and lysosomal networks. Mol. Biol. Cell 23, 3215–3228 (2012). sourceExperimental — accuracy not yet measured
The Results show that loss of WASH-mediated F-actin causes endosomal collapse, and the Discussion reports altered lysosomal morphology. The paper limits trafficking defects to a subset of receptors: EGFR is affected, but transferrin-receptor recycling is unaffected. It therefore does not establish a requirement for trafficking a broad range of cargoes. The indexed copy provides section labels but no page numbers. (LLM, conf=0.88)
- Partly supportedcites [41] Duleh, S. N. & Welch, M. D. WASH and the Arp2/3 complex regulate endosome shape and trafficking. Cytoskeleton (Hoboken) 67, 193–206 (2010). sourceExperimental — accuracy not yet measured
The Results show that disrupting WASH, Arp2/3, or actin alters endosome shape, and that WASH depletion delays EGF transport to late endosomes (page not available in our copy). The Discussion also says WASH depletion did not affect transferrin uptake or recycling. Thus the paper supports a role in endosome morphology and trafficking of EGF, but not the claim that WASH is needed for trafficking a broad range of cargoes throughout the endolysosomal system. (LLM, conf=0.88)
- Partly supportedcites [42] Carnell, M. et al. Actin polymerization driven by WASH causes V-ATPase retrieval and vesicle neutralization before exocytosis. J. Cell Biol. 193, 831–839 (2011). sourceExperimental — accuracy not yet measured
The Results and discussion show that WASH-driven actin polymerization is needed for V-ATPase retrieval and exocytosis, and that WASH-null cells develop enlarged vesicles. The Introduction also describes endosomal tubulation and two trafficking pathways in mammalian cells. These passages support a role in endolysosomal morphology and trafficking, but do not establish trafficking of a broad range of cargoes. (LLM, conf=0.86)
- Supportedcites [43] Piotrowski, J. T., Gomez, T. S., Schoon, R. A., Mangalam, A. K. & Billadeau, D. D. WASH knockout T cells demonstrate defective receptor trafficking, proliferation, and effector function. Mol. Cell Biol 33, 958–973 (2013). source
The Introduction describes WASH-mediated, Arp2/3-dependent F-actin nucleation in vesicle trafficking. The Results report collapsed endosomal and lysosomal compartments in WASH-knockout T cells, while the Discussion identifies defective trafficking of TCR, CD28, LFA-1, and GLUT1. Together, these passages support the broad claim, with the paper’s direct experimental findings centered on T cells. (LLM, conf=0.86)
- Supportedcites [44] Ryder, P. V. et al. The WASH complex, an endosomal Arp2/3 activator, interacts with the Hermansky-Pudlak syndrome complex BLOC-1 and its cargo phosphatidylinositol-4-kinase type IIα. Mol. Biol. Cell 24, 2269–2284 (2013). source
The Introduction reports that WASH depletion disrupts recycling, endosome-to-Golgi, and endosome-to-lysosome trafficking. The Results report elongated early-endosomal tubules after WASH depletion, and the Discussion reports missorting of the endolysosomal cargoes ATP7A and VAMP7. Together with the Discussion’s description of WASH-mediated branched actin polymerization, these passages support the broad statement. (LLM, conf=0.87)
plaindirect- Asserted: passes — The authors put it forward as true.
- Checkable: passes — It can be checked against evidence.
- Load-bearing: passes — The paper’s conclusions depend on it.
- Based: passes — The paper gives a reason why it holds.
Probably not a substantial claim.
- Partly supported
The cited sources support only part of this claim — read each source’s verdict below.
In the paper
“these studies suggest that higher order COMMD hexamers may be possible through additional interactions via their shared helical N-terminal domains.”
§ Endosomal PI(3)P regulation by the COMMD/CCDC22/CCDC93 (CCC) complex controls membrane protein recycling > Discussion
What the sources say
- Partly supportedcites [68] Healy, M. D. et al. Structural insights into the architecture and membrane interactions of the conserved COMMD proteins. Elife 7, pii: e35898 (2018). sourceExperimental — accuracy not yet measured
The Discussion speculates that COMMD N-terminal domains may contribute to higher-order assemblies and notes that related proteins form hexamers through N-terminal interactions. It does not specifically propose a hexameric stoichiometry for COMMD proteins; it says the stoichiometries of their larger complexes remain undetermined. No page number is available in our copy. (LLM, conf=0.85)
hedgedconditional- Asserted: passes — The authors put it forward as true.
- Checkable: passes — It can be checked against evidence.
- Load-bearing: fails — The paper’s conclusions may not depend on it.
- Based: passes — The paper gives a reason why it holds.
Probably not a substantial claim. The paper’s conclusions may not depend on it.
- Partly supported
The cited sources that could be checked couldn’t confirm or dispute this claim.
In the paper
“FAM45A, a DENN-domain containing protein of unknown function, binds to CCC and retriever, in agreement with high-throughput protein–protein interaction studies46,60.”
§ Endosomal PI(3)P regulation by the COMMD/CCDC22/CCDC93 (CCC) complex controls membrane protein recycling > Discussion
What the sources say
- Could not verifycites [46] Huttlin, E. L. et al. Architecture of the human interactome defines protein communities and disease networks. Nature 545, 505–509 (2017). sourceExperimental — accuracy not yet measured
The passages on poorly characterized proteins and WASH-complex interactions (Abstract; page not provided) do not identify FAM45A or report its binding to CCC or retriever. Searches for “FAM45A” and “retriever CCC complex” found no passage in our copy that addresses those interactions. (LLM, conf=0.72)
- Not checked — no full text of the sourcecites [60] Hein, M. Y. et al. A human interactome in three quantitative dimensions organized by stoichiometries and abundances. Cell 163, 712–723 (2015). source
plaincorrelational- Asserted: passes — The authors put it forward as true.
- Checkable: passes — It can be checked against evidence.
- Load-bearing: unclear — It is unclear whether the paper’s conclusions depend on it.
- Based: passes — The paper gives a reason why it holds.
It may state two separate claims as one.
- Could not verify
The cited sources support only part of this claim — read each source’s verdict below.
In the paper
“Interacting partners in Drosophila melanogaster were identified in NCBI Gene, which collates data from three prior interactome studies47–49.”
§ Endosomal PI(3)P regulation by the COMMD/CCDC22/CCDC93 (CCC) complex controls membrane protein recycling > Methods > Protein interactome database analysis
What the sources say
- Not checked — no full text of the sourcecites [47] Giot, L. et al. A protein interaction map of Drosophila melanogaster. Science 302, 1727–1736 (2003). source
- Partly supportedcites [48] Guruharsha, K. G. et al. A protein complex network of Drosophila melanogaster. Cell 147, 690–703 (2011). sourceExperimental — accuracy not yet measured
The Introduction and Results (‘A Drosophila Protein Interaction Map’; page not provided) establish that this paper is a Drosophila interaction-mapping study, so it fits the citation’s identification of a prior interactome study. Our copy does not say that NCBI Gene collates its data or data from exactly three studies; a separate Results passage describes DroID as consolidating seven sources. (LLM, conf=0.82)
- Partly supportedcites [49] Formstecher, E. et al. Protein interaction mapping: a Drosophila case study. Genome Res. 15, 376–384 (2005). sourceExperimental — accuracy not yet measured
The Discussion identifies this paper as a Drosophila interactome study reporting 2,300 interactions, and the comparison section discusses three large-scale fly screens. But the paper does not say that NCBI Gene collates data from those studies; its Discussion instead names FlyBase and other repositories for its deposited interactions. (LLM, conf=0.85)
plain- Asserted: passes — The authors put it forward as true.
- Checkable: passes — It can be checked against evidence.
- Load-bearing: fails — The paper’s conclusions may not depend on it.
- Based: passes — The paper gives a reason why it holds.
Probably not a substantial claim. The paper’s conclusions may not depend on it.
The cited sources support only part of this claim — read each source’s verdict below.
In the paper
“The CCC complex is a molecular assembly that has been recognized for its role in regulating endosomal recycling of various cargos20,27,30–32,34”
§ Endosomal PI(3)P regulation by the COMMD/CCDC22/CCDC93 (CCC) complex controls membrane protein recycling > Discussion
What the sources say
- Supportedcites [20] McNally, K. E. et al. Retriever is a multiprotein complex for retromer-independent endosomal cargo recycling. Nat. Cell Biol. 30, 3481 (2017). source
In Results, under “Proteomic identification of retromer-independent endosomal sorting machinery” (page not supplied), the paper identifies the CCC complex and says it is required for endosomal recycling of several cargos, including copper transporters, Notch family members and LDLR. (LLM, conf=0.93)
- Supportedcites [27] Phillips-Krawczak, C. A. et al. COMMD1 is linked to the WASH complex and regulates endosomal trafficking of the copper transporter ATP7A. Mol. Biol. Cell 26, 91–103 (2015). source
In Results (‘The CCC complex regulates ATP7A trafficking’), the paper reports that CCC components regulate ATP7A recycling and that loss of the complex disrupts trafficking of TGN46. These two cargos support the attributed role in endosomal recycling and trafficking. (LLM, conf=0.92)
- Could not verifycites [30] Starokadomskyy, P. et al. CCDC22 deficiency in humans blunts activation of proinflammatory NF-κB signaling. J. Clin. Invest. 123, 2244–2256 (2013). sourceExperimental — accuracy not yet measured
The section ‘COMMD proteins associate with CCDC22, a broadly expressed gene’ establishes that CCDC22 and COMMD proteins interact, and ‘CCDC22 regulates the cellular localization of COMMD proteins’ reports changes in their cellular distribution. Neither section addresses endosomal recycling of cargos; searches for ‘endosomal,’ ‘recycling,’ and cargo trafficking found no passage establishing the attributed role. Page numbers were not available in our copy. (LLM, conf=0.75)
- Supportedcites [31] Bartuzi, P. et al. CCC- and WASH-mediated endosomal sorting of LDLR is required for normal clearance of circulating LDL. Nat. Commun. 7, 10961 (2016). source
The Results section describes CCC-mediated trafficking of ATP7A and shows that the CCC complex helps regulate LDLR endosomal trafficking. The Discussion also identifies Notch as another cargo of this system, supporting the statement that CCC regulates sorting of various cargos. (LLM, conf=0.91)
- Supportedcites [32] Fedoseienko, A. et al. The COMMD family regulates plasma LDL levels and attenuates satherosclerosis through stabilizing the CCC complex in endosomal LDLR trafficking. Circ. Res. 122, 1648–1660 (2018). source
The Abstract describes the CCC complex in endosomal trafficking and identifies LDLR and the copper transporters ATP7A and ATP7B as cargo associated with COMMD1. The Discussion reports that inactivating the CCC complex affects both LDLR and LRP1 trafficking, supporting the broader statement about recycling of various cargos. Page numbers are not available in our copy. (LLM, conf=0.91)
- Supportedcites [34] Li, H. et al. Endosomal sorting of Notch receptors through COMMD9-dependent pathways modulates Notch signaling. J. Cell Biol. 211, 605–617 (2015). source
The Discussion (page unavailable in our copy) says the CCC complex was previously shown to regulate retromer/WASH-dependent endosomal trafficking and reports its role in Notch trafficking. The Introduction also links the complex to COMMD1-dependent endosomal sorting of the copper transporter ATP7A. Together, these passages support the broad statement that the CCC complex regulates endosomal recycling of different cargos. (LLM, conf=0.87)
plaincorrelational- Asserted: passes — The authors put it forward as true.
- Checkable: passes — It can be checked against evidence.
- Load-bearing: fails — The paper’s conclusions may not depend on it.
- Based: passes — The paper gives a reason why it holds.
Probably not a substantial claim. The paper’s conclusions may not depend on it.
- Supported
The cited sources support only part of this claim — read each source’s verdict below.
In the paper
“the spectrum of defects seen with CCC deficiency are far more profound, including neurologic disability and cardiovascular congenital anomalies67”
§ Endosomal PI(3)P regulation by the COMMD/CCDC22/CCDC93 (CCC) complex controls membrane protein recycling > Discussion
What the sources say
- Partly supportedcites [67] Voineagu, I. et al. CCDC22: a novel candidate gene for syndromic X-linked intellectual disability. Mol. Psychiatry 17, 4–7 (2012). sourceExperimental — accuracy not yet measured
The phenotype passage (page unavailable) reports intellectual disability and congenital cardiac abnormalities in affected members of the IGOLD #586 family. The paper links this family to a CCDC22 variant and reduced CCDC22 expression, but does not establish CCC-complex deficiency or compare the severity of its defects with another condition. (LLM, conf=0.86)
plaincorrelational- Asserted: passes — The authors put it forward as true.
- Checkable: passes — It can be checked against evidence.
- Load-bearing: unclear — It is unclear whether the paper’s conclusions depend on it.
- Based: passes — The paper gives a reason why it holds.
It may state two separate claims as one.
- Partly supported
Every source the paper cites for this claim was checked and supports it.
In the paper
“inhibition of PIKfyve kinase activity, which prevents PI(3)P conversion to PI(3,5) P2 can also result in increased F-actin on endosomes53.”
§ Endosomal PI(3)P regulation by the COMMD/CCDC22/CCDC93 (CCC) complex controls membrane protein recycling > Discussion
What the sources say
- Supportedcites [53] Hong, N. H., Qi, A. & Weaver, A. M. PI(3,5)P2 controls endosomal branched actin dynamics by regulating cortactin-actin interactions. J. Cell Biol. 210, 753–769 (2015). source
The Results section reports that PIKfyve inhibitors YM201636 and apilimod, as well as PIKfyve knockdown, caused actin enrichment on Rab7+ endosomes; quantitative imaging found increased endosomal actin intensity after YM201636 treatment. The same section identifies PIKfyve as the kinase that converts PI(3)P to PI(3,5)P2. No page numbers are provided in our copy. (LLM, conf=0.94)
plainconditional- Asserted: passes — The authors put it forward as true.
- Checkable: passes — It can be checked against evidence.
- Load-bearing: fails — The paper’s conclusions may not depend on it.
- Based: passes — The paper gives a reason why it holds.
Probably not a substantial claim. The paper’s conclusions may not depend on it.
- Supported
The cited sources support only part of this claim — read each source’s verdict below.
In the paper
“Both retromer and retriever are trimeric assemblies that share one common subunit (VPS29), and can utilize specific SNX proteins to identify cargo in the endosomal compartment14,15,20.”
§ Endosomal PI(3)P regulation by the COMMD/CCDC22/CCDC93 (CCC) complex controls membrane protein recycling > Discussion
What the sources say
- Not checked — no full text of the sourcecites [14] Burd, C. & Cullen, P. J. Retromer: a master conductor of endosome sorting. Cold Spring Harb. Perspect. Biol. 6, a016774–a016774 (2014). source
- Partly supportedcites [15] Gallon, M. et al. A unique PDZ domain and arrestin-like fold interaction reveals mechanistic details of endocytic recycling by SNX27-retromer. Proc. Natl Acad. Sci. USA 111, E3604–E3613 (2014). sourceExperimental — accuracy not yet measured
The Abstract identifies retromer as a VPS26–VPS29–VPS35 heterotrimer and describes SNX27 as an endosomal cargo adaptor for retromer. The paper does not address retriever, so it cannot establish that retriever is trimeric, shares VPS29, or uses SNX proteins to identify cargo. (LLM, conf=0.88)
- Supportedcites [20] McNally, K. E. et al. Retriever is a multiprotein complex for retromer-independent endosomal cargo recycling. Nat. Cell Biol. 30, 3481 (2017). source
The Discussion states that retromer and retriever are heterotrimers containing VPS29. It also identifies SNX27 and SNX17, respectively, as cargo-specific sorting-nexin adaptors that provide sequence-selective cargo entry into their recycling pathways. (LLM, conf=0.95)
plaincorrelational- Asserted: passes — The authors put it forward as true.
- Checkable: passes — It can be checked against evidence.
- Load-bearing: fails — The paper’s conclusions may not depend on it.
- Based: passes — The paper gives a reason why it holds.
Probably not a substantial claim. The paper’s conclusions may not depend on it. It may state two separate claims as one.
The cited sources support only part of this claim — read each source’s verdict below.
In the paper
“WASH is recruited to endosomes where it is necessary for branched F-actin deposition, a process that is essential to maintain the structure of the endolysosomal network, to promote effective fission of membrane tubules and trafficking of cargo proteins37,39,41,43,44.”
§ Endosomal PI(3)P regulation by the COMMD/CCDC22/CCDC93 (CCC) complex controls membrane protein recycling > Discussion
What the sources say
- Supportedcites [37] Derivery, E. et al. The Arp2/3 activator WASH controls the fission of endosomes through a large multiprotein complex. Dev. Cell 17, 712–723 (2009). source
The Results (pages not provided) locate WASH on endosomes and show that it recruits Arp2/3 to induce actin polymerization. WASH depletion caused tubulation across several endosomal compartments and impaired transferrin recycling, supporting the claims about network structure, membrane fission, and cargo trafficking. (LLM, conf=0.89)
- Partly supportedcites [39] Gomez, T. S., Gorman, J. A., de Narvajas, A. A.-M., Koenig, A. O. & Billadeau, D. D. Trafficking defects in WASH-knockout fibroblasts originate from collapsed endosomal and lysosomal networks. Mol. Biol. Cell 23, 3215–3228 (2012). sourceExperimental — accuracy not yet measured
The Introduction and Results support WASH recruitment to endosomes and its role in endosomal F-actin, endolysosomal network integrity, and cargo trafficking. The Discussion, however, says the knockout results do not establish a role in tubule scission; it treats that role as possible rather than showing that WASH-dependent actin is essential for fission. Page numbers are unavailable in our copy. (LLM, conf=0.89)
- Partly supportedcites [41] Duleh, S. N. & Welch, M. D. WASH and the Arp2/3 complex regulate endosome shape and trafficking. Cytoskeleton (Hoboken) 67, 193–206 (2010). sourceExperimental — accuracy not yet measured
The Introduction and Results report WASH on endosomes, a role for WASH and actin in maintaining endosome shape, and reduced EGF transport to late endosomes after WASH depletion. The Discussion says that actin assembly might sever endosomal tubules, but explicitly presents fission as speculation, not an established essential process. The paper also studies particular endosomal compartments and EGF trafficking rather than establishing a requirement across the entire endolysosomal network and cargo proteins generally. (LLM, conf=0.88)
- Partly supportedcites [43] Piotrowski, J. T., Gomez, T. S., Schoon, R. A., Mangalam, A. K. & Billadeau, D. D. WASH knockout T cells demonstrate defective receptor trafficking, proliferation, and effector function. Mol. Cell Biol 33, 958–973 (2013). sourceExperimental — accuracy not yet measured
The Introduction says WASH localizes to endomembranes and participates in trafficking through localized Arp2/3-dependent F-actin nucleation. The Results show collapsed endosomal and lysosomal compartments and defective cargo trafficking in WASH-deficient T cells. Our copy does not establish that this actin process promotes fission of membrane tubules; the References list an earlier study on endosome fission, but that title alone does not support the more specific claim. (LLM, conf=0.85)
- Partly supportedcites [44] Ryder, P. V. et al. The WASH complex, an endosomal Arp2/3 activator, interacts with the Hermansky-Pudlak syndrome complex BLOC-1 and its cargo phosphatidylinositol-4-kinase type IIα. Mol. Biol. Cell 24, 2269–2284 (2013). sourceExperimental — accuracy not yet measured
The Results and Discussion (page unavailable) place WASH and actin on early endosomes and report elongated endosomal tubules and cargo missorting after WASH depletion. The paper supports a role in endosomal morphology and cargo trafficking, but describes WASH-driven membrane scission as a hypothesis awaiting testing; it does not establish that this process is essential to maintain the structure of the endolysosomal network. (LLM, conf=0.87)
plaindirect- Asserted: passes — The authors put it forward as true.
- Checkable: passes — It can be checked against evidence.
- Load-bearing: passes — The paper’s conclusions depend on it.
- Based: passes — The paper gives a reason why it holds.
Probably not a substantial claim. It may state two separate claims as one.
- Supported
The cited sources support only part of this claim — read each source’s verdict below.
In the paper
“several WASP family members including WASP/N-WASP, WAVE proteins, and WHAMM, all contain PIP-interacting motifs that impact their localization and activation state62–66.”
§ Endosomal PI(3)P regulation by the COMMD/CCDC22/CCDC93 (CCC) complex controls membrane protein recycling > Discussion
What the sources say
- Partly supportedcites [62] Rohatgi, R., Nollau, P., Ho, H. Y., Kirschner, M. W. & Mayer, B. J. Nck and phosphatidylinositol 4,5-bisphosphate synergistically activate actin polymerization through the N-WASP-Arp2/3 pathway. J. Biol. Chem. 276, 26448–26452 (2001). sourceExperimental — accuracy not yet measured
The Results and Discussion (page unavailable) show that PIP2 cooperates with Nck to activate N-WASP and report that PIP2 is an activation input for WASP. They do not identify PIP-interacting motifs or show that such motifs determine localization; the discussion instead describes Nck bringing N-WASP near membrane PIP2. This source does not address WAVE proteins or WHAMM. (LLM, conf=0.84)
- Partly supportedcites [63] Higgs, H. N. & Pollard, T. D. Activation by Cdc42 and PIP(2) of Wiskott-Aldrich syndrome protein (WASp) stimulates actin nucleation by Arp2/3 complex. J. Cell Biol. 150, 1311–1320 (2000). sourceExperimental — accuracy not yet measured
The Introduction reports that PIP2 stimulates WASp activation, and the Discussion proposes a role for PIP2-dependent membrane binding. But the Discussion explicitly says the PIP2-binding site on WASp is unknown, so this paper does not establish a PIP-interacting motif that controls localization. It also does not establish the claim for WAVE proteins or WHAMM. (LLM, conf=0.86)
- Not checked — no full text of the sourcecites [64] Oikawa, T. et al. PtdIns(3,4,5)P3 binding is necessary for WAVE2-induced formation of lamellipodia. Nat. Cell Biol. 6, 420–426 (2004). source
- Partly supportedcites [65] Senju, Y. et al. Mechanistic principles underlying regulation of the actin cytoskeleton by phosphoinositides. Proc. Natl. Acad. Sci. USA 114, E8977–E8986 (2017). sourceExperimental — accuracy not yet measured
The Membranes section reports that N-WASP’s polybasic motif binds PI(4,5)P2-containing membranes, and the Discussion suggests that high PI(4,5)P2 density may restrict its activation to particular cell regions. The passages do not establish the claimed PIP-interacting motifs or effects on localization and activation for WAVE proteins or WHAMM; the evidence for WASP itself is limited to a cited reference. (LLM, conf=0.85)
- Partly supportedcites [66] Mathiowetz, A. J. et al. An Amish founder mutation disrupts a PI(3)P-WHAMM-Arp2/3 complex-driven autophagosomal remodeling pathway. Mol. Biol. Cell 28, 2492–2507 (2017). sourceExperimental — accuracy not yet measured
The Results section (‘WHAMM is recruited to nascent autophagosomes by binding to PI(3)P’; page unavailable) identifies a phospholipid-binding motif in WHAMM and shows that mutations disrupting PI(3)P binding prevent its localization to autophagosomes. The paper does not show that this interaction changes WHAMM’s activation state, and it does not establish the motif claim for WASP/N-WASP or WAVE proteins. (LLM, conf=0.86)
plaindirect- Asserted: passes — The authors put it forward as true.
- Checkable: passes — It can be checked against evidence.
- Load-bearing: fails — The paper’s conclusions may not depend on it.
- Based: passes — The paper gives a reason why it holds.
Probably not a substantial claim. The paper’s conclusions may not depend on it.
- Partly supported
The cited sources support only part of this claim — read each source’s verdict below.
In the paper
“FAM21 has two basic regions within its extended C-terminal tail that have been shown to interact with PI(3)P and other PIs40”
§ Endosomal PI(3)P regulation by the COMMD/CCDC22/CCDC93 (CCC) complex controls membrane protein recycling > Discussion
What the sources say
- Partly supportedcites [40] Jia, D. et al. WASH and WAVE actin regulators of the Wiskott-Aldrich syndrome protein (WASP) family are controlled by analogous structurally related complexes. Proc. Natl Acad. Sci. USA 107, 10442–10447 (2010). sourceExperimental — accuracy not yet measured
The Results and Discussion report that a FAM21 C-terminal fragment (residues 937–1341) binds PtdIns3P and several other phosphoinositides. Our copy does not identify two basic regions within that tail or show that each region binds these lipids. Page numbers were not available in the indexed passages. (LLM, conf=0.88)
boostedcorrelational- Asserted: passes — The authors put it forward as true.
- Checkable: passes — It can be checked against evidence.
- Load-bearing: fails — The paper’s conclusions may not depend on it.
- Based: passes — The paper gives a reason why it holds.
Probably not a substantial claim. The paper’s conclusions may not depend on it.
- Partly supported
A result the paper reports from its own data — it cites no other source for it, so there is none to check. The quote shows it is in the paper.
In the paper
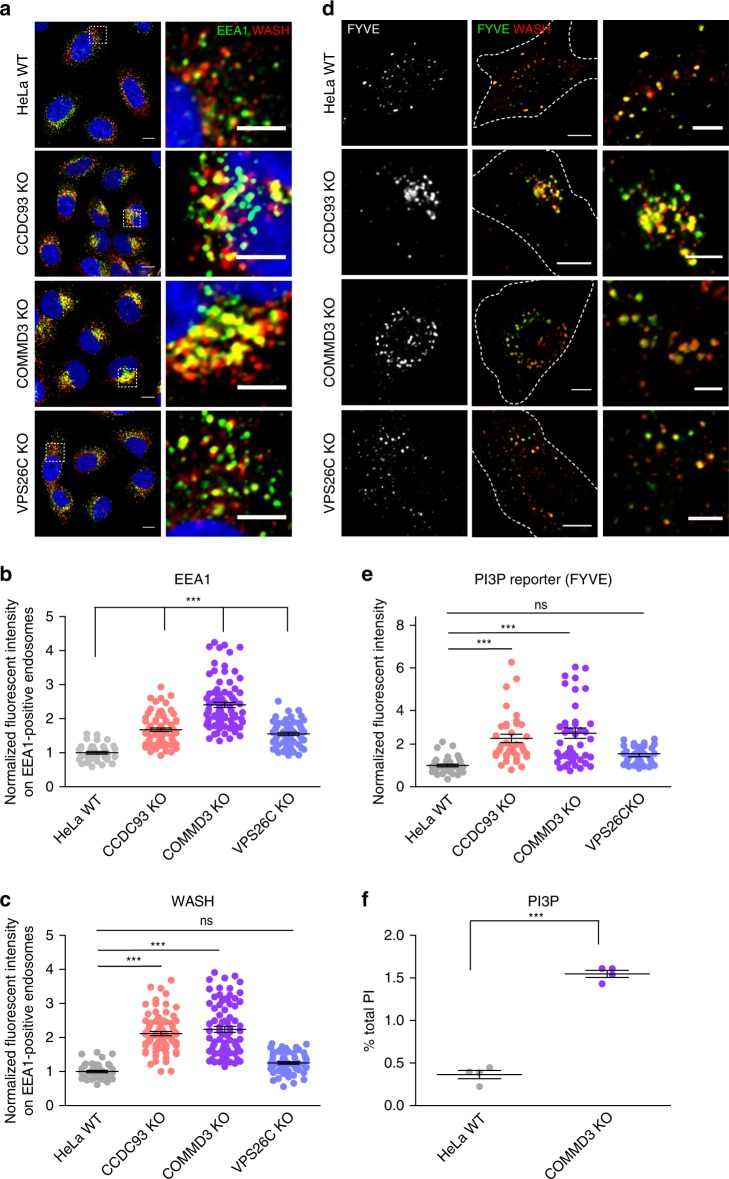
“The PI(3)P reporter signal revealed a ~2.5-fold increase in PI(3)P levels in endosomes from COMMD3 and CCDC93 KO cells, which was not seen in VPS26C KO cells”
§ Endosomal PI(3)P regulation by the COMMD/CCDC22/CCDC93 (CCC) complex controls membrane protein recycling > Results > CCC deficiency results in endosomal accumulation of PI(3)P
plaindirect- Asserted: passes — The authors put it forward as true.
- Checkable: passes — It can be checked against evidence.
- Load-bearing: passes — The paper’s conclusions depend on it.
- Based: passes — The paper gives a reason why it holds.
It may state two separate claims as one.
A result the paper reports from its own data — it cites no other source for it, so there is none to check. The quote shows it is in the paper.
In the paper
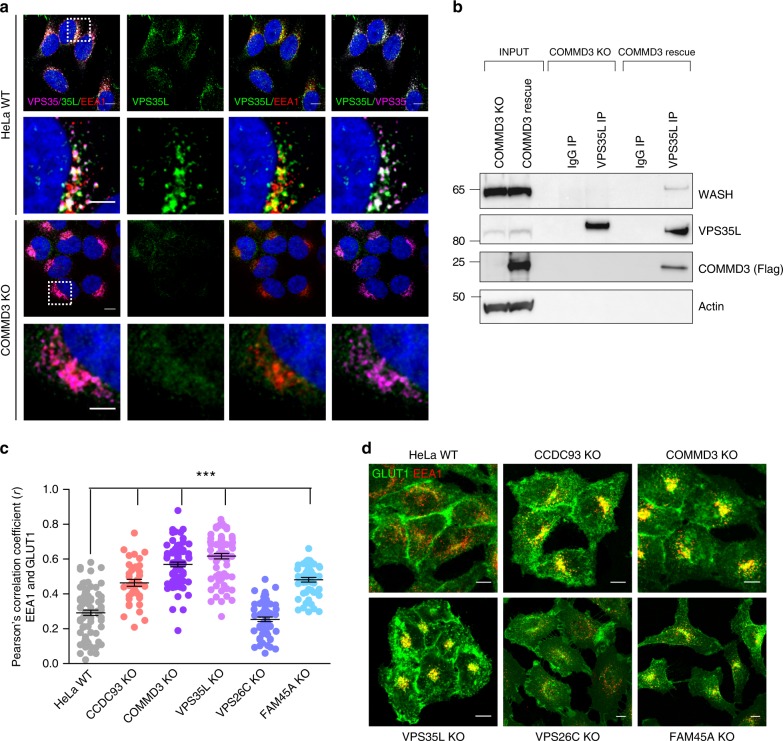
“ITGβ1 protein levels were reduced in every instance when endosomal trapping was observed, and these reduced levels were restored upon treatment with the lysosome protease inhibitor Bafilomycin A”
§ Endosomal PI(3)P regulation by the COMMD/CCDC22/CCDC93 (CCC) complex controls membrane protein recycling > Results > CCC loss leads to retriever-independent recycling defects
plaincorrelational- Asserted: passes — The authors put it forward as true.
- Checkable: passes — It can be checked against evidence.
- Load-bearing: passes — The paper’s conclusions depend on it.
- Based: passes — The paper gives a reason why it holds.
It may state two separate claims as one.
A result the paper reports from its own data — it cites no other source for it, so there is none to check. The quote shows it is in the paper.
In the paper
“CCC components (COMMD1 and CCDC22) migrated close to 700 kDa, whereas VPS35L migrated in two complexes, one of similar mass ~700 kDa and one of ~250 kDa”
§ Endosomal PI(3)P regulation by the COMMD/CCDC22/CCDC93 (CCC) complex controls membrane protein recycling > Results > CCC and retriever are closely linked but distinct complexes
plain- Asserted: passes — The authors put it forward as true.
- Checkable: passes — It can be checked against evidence.
- Load-bearing: passes — The paper’s conclusions depend on it.
- Based: passes — The paper gives a reason why it holds.
It may state two separate claims as one.
A result the paper reports from its own data — it cites no other source for it, so there is none to check. The quote shows it is in the paper.
In the paper
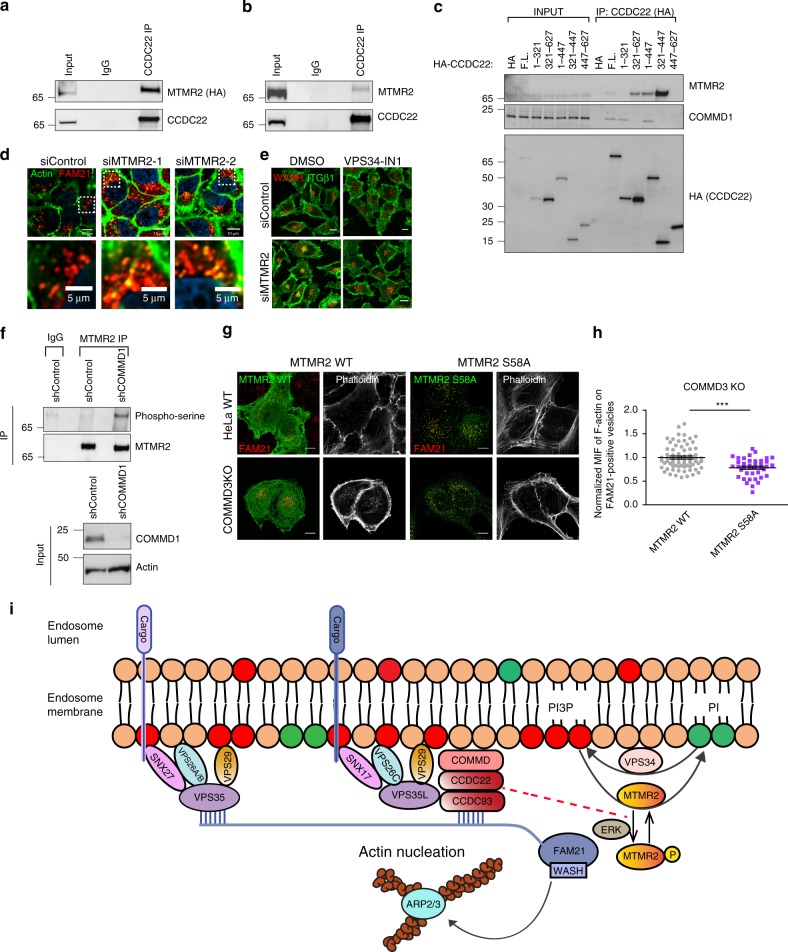
“full-length MTMR2 is required for its interaction with CCDC22 and no single domain was able to recapitulate binding (Supplementary Fig. 8a).”
§ Endosomal PI(3)P regulation by the COMMD/CCDC22/CCDC93 (CCC) complex controls membrane protein recycling > Results > The PI(3)P phosphatase MTMR2 is regulated by the CCC complex
plaindirect- Asserted: passes — The authors put it forward as true.
- Checkable: passes — It can be checked against evidence.
- Load-bearing: unclear — It is unclear whether the paper’s conclusions depend on it.
- Based: passes — The paper gives a reason why it holds.
It may state two separate claims as one.
A result the paper reports from its own data — it cites no other source for it, so there is none to check. The quote shows it is in the paper.
In the paper
“The staining revealed accumulation of F-actin on WASH-positive endosomal foci in CCDC93, COMMD3, and VPS35L KO cells, but not in VPS26C and FAM45A KO cells”
§ Endosomal PI(3)P regulation by the COMMD/CCDC22/CCDC93 (CCC) complex controls membrane protein recycling > Results > CCC depletion results in F-actin accumulation on endosomes
plaincorrelational- Asserted: passes — The authors put it forward as true.
- Checkable: passes — It can be checked against evidence.
- Load-bearing: passes — The paper’s conclusions depend on it.
- Based: passes — The paper gives a reason why it holds.
It may state two separate claims as one.
A result the paper reports from its own data — it cites no other source for it, so there is none to check. The quote shows it is in the paper.
In the paper
“endosomal-associated WASH levels were increased in CCDC93, COMMD3, and VPS35L KO, but not in VPS26C KO and FAM45A KO cells”
§ Endosomal PI(3)P regulation by the COMMD/CCDC22/CCDC93 (CCC) complex controls membrane protein recycling > Results > CCC depletion results in increased WASH complex activation
plaindirect- Asserted: passes — The authors put it forward as true.
- Checkable: passes — It can be checked against evidence.
- Load-bearing: passes — The paper’s conclusions depend on it.
- Based: passes — The paper gives a reason why it holds.
It may state two separate claims as one.
A result the paper reports from its own data — it cites no other source for it, so there is none to check. The quote shows it is in the paper.
In the paper
“VPS26C and FAM45A had minimal impact on CCC or retriever subunit expression, indicating that neither protein is required for the stability of these assemblies”
§ Endosomal PI(3)P regulation by the COMMD/CCDC22/CCDC93 (CCC) complex controls membrane protein recycling > Results > CCC and retriever are closely linked but distinct complexes
hedged- Asserted: passes — The authors put it forward as true.
- Checkable: passes — It can be checked against evidence.
- Load-bearing: passes — The paper’s conclusions depend on it.
- Based: passes — The paper gives a reason why it holds.
It may state two separate claims as one.
A result the paper reports from its own data — it cites no other source for it, so there is none to check. The quote shows it is in the paper.
In the paper
“MTMR2 silencing also led to defective endosomal recycling of ITGβ1, and associated WASH accumulation on endosomes, both of which were reversed by inhibition of PI(3)P synthesis (Fig. 7e, Supplementary Fig. 8f).”
§ Endosomal PI(3)P regulation by the COMMD/CCDC22/CCDC93 (CCC) complex controls membrane protein recycling > Results > The PI(3)P phosphatase MTMR2 is regulated by the CCC complex
plaindirect- Asserted: passes — The authors put it forward as true.
- Checkable: passes — It can be checked against evidence.
- Load-bearing: passes — The paper’s conclusions depend on it.
- Based: passes — The paper gives a reason why it holds.
It may state two separate claims as one.
A result the paper reports from its own data — it cites no other source for it, so there is none to check. The quote shows it is in the paper.
In the paper
“endosomal EEA1 levels were significantly elevated in CCDC93 and COMMD3 KO cells, and only slightly elevated in VPS26C KO cells”
§ Endosomal PI(3)P regulation by the COMMD/CCDC22/CCDC93 (CCC) complex controls membrane protein recycling > Results > CCC deficiency results in endosomal accumulation of PI(3)P
plaincorrelational- Asserted: passes — The authors put it forward as true.
- Checkable: passes — It can be checked against evidence.
- Load-bearing: passes — The paper’s conclusions depend on it.
- Based: passes — The paper gives a reason why it holds.
It may state two separate claims as one.
- Rests on an assumption: PI(3)P plays a central role in endosomal recruitment of effector proteins such as EEA1.
A result the paper reports from its own data — it cites no other source for it, so there is none to check. The quote shows it is in the paper.
In the paper
“neither VPS26C or COMMD3 loss affected WASH or retromer mobility, indicating that these are separate assemblies from CCC or retriever”
§ Endosomal PI(3)P regulation by the COMMD/CCDC22/CCDC93 (CCC) complex controls membrane protein recycling > Results > CCC and retriever are closely linked but distinct complexes
hedged- Asserted: passes — The authors put it forward as true.
- Checkable: passes — It can be checked against evidence.
- Load-bearing: passes — The paper’s conclusions depend on it.
- Based: passes — The paper gives a reason why it holds.
It may state two separate claims as one.
A result the paper reports from its own data — it cites no other source for it, so there is none to check. The quote shows it is in the paper.
In the paper
“depletion of WASH (shWASH) led to near complete loss of F-actin on endosomes of these cells, whereas the CCDC93-deficient cell line infected with a control shRNA lentivirus continued to show enhanced F-actin accumulation on endosomes”
§ Endosomal PI(3)P regulation by the COMMD/CCDC22/CCDC93 (CCC) complex controls membrane protein recycling > Results > CCC depletion results in F-actin accumulation on endosomes
plaindirect- Asserted: passes — The authors put it forward as true.
- Checkable: passes — It can be checked against evidence.
- Load-bearing: passes — The paper’s conclusions depend on it.
- Based: passes — The paper gives a reason why it holds.
It may state two separate claims as one.
A result the paper reports from its own data — it cites no other source for it, so there is none to check. The quote shows it is in the paper.
In the paper
“the WT protein was largely cytosolic and its presence in endosomes was hard to detect by imaging in WT cells (Fig. 7g, top row)”
§ Endosomal PI(3)P regulation by the COMMD/CCDC22/CCDC93 (CCC) complex controls membrane protein recycling > Results > The PI(3)P phosphatase MTMR2 is regulated by the CCC complex
plain- Asserted: passes — The authors put it forward as true.
- Checkable: passes — It can be checked against evidence.
- Load-bearing: passes — The paper’s conclusions depend on it.
- Based: passes — The paper gives a reason why it holds.
It may state two separate claims as one.
A result the paper reports from its own data — it cites no other source for it, so there is none to check. The quote shows it is in the paper.
In the paper
“Closer observation of actin endosomal structures in CCC-deficient cells revealed the presence of WASH, FAM21, and VPS35 at the tips of cortactin tails, and ITGα5 with FAM21 at the tips of F-actin tails”
§ Endosomal PI(3)P regulation by the COMMD/CCDC22/CCDC93 (CCC) complex controls membrane protein recycling > Results > CCC depletion results in F-actin accumulation on endosomes
plaincorrelational- Asserted: passes — The authors put it forward as true.
- Checkable: passes — It can be checked against evidence.
- Load-bearing: unclear — It is unclear whether the paper’s conclusions depend on it.
- Based: passes — The paper gives a reason why it holds.
It may state two separate claims as one.
A result the paper reports from its own data — it cites no other source for it, so there is none to check. The quote shows it is in the paper.
In the paper
“COMMD3 deficiency had a lesser impact on retriever complex stability by BN gel electrophoresis, this corresponded to a smaller effect on VPS35L and VPS26C protein expression”
§ Endosomal PI(3)P regulation by the COMMD/CCDC22/CCDC93 (CCC) complex controls membrane protein recycling > Results > CCC and retriever are closely linked but distinct complexes
plaindirect- Asserted: passes — The authors put it forward as true.
- Checkable: passes — It can be checked against evidence.
- Load-bearing: passes — The paper’s conclusions depend on it.
- Based: passes — The paper gives a reason why it holds.
It may state two separate claims as one.
A result the paper reports from its own data — it cites no other source for it, so there is none to check. The quote shows it is in the paper.
In the paper
“COMMD3 loss led to the collapse of the 700 kDa complex, best noted by the change in COMMD1 mobility and the disappearance of a 700 kDa band of VPS35L, without the loss of the 250 kDa retriever complex”
§ Endosomal PI(3)P regulation by the COMMD/CCDC22/CCDC93 (CCC) complex controls membrane protein recycling > Results > CCC and retriever are closely linked but distinct complexes
plaindirect- Asserted: passes — The authors put it forward as true.
- Checkable: passes — It can be checked against evidence.
- Load-bearing: passes — The paper’s conclusions depend on it.
- Based: passes — The paper gives a reason why it holds.
It may state two separate claims as one.
A result the paper reports from its own data — it cites no other source for it, so there is none to check. The quote shows it is in the paper.
In the paper
“VPS34 silencing in COMMD3-deficient led to partial restoration of endosomal morphology and increased the cellular area of WASH-positive vesicles (Supplementary Fig. 6e).”
§ Endosomal PI(3)P regulation by the COMMD/CCDC22/CCDC93 (CCC) complex controls membrane protein recycling > Results > VPS34 blockade reverts endosomal phenotypes of CCC depletion
plaindirect- Asserted: passes — The authors put it forward as true.
- Checkable: passes — It can be checked against evidence.
- Load-bearing: passes — The paper’s conclusions depend on it.
- Based: passes — The paper gives a reason why it holds.
It may state two separate claims as one.
A result the paper reports from its own data — it cites no other source for it, so there is none to check. The quote shows it is in the paper.
In the paper
“this region does not bind to COMMD1 and thus does not support CCC complex assembly”
§ Endosomal PI(3)P regulation by the COMMD/CCDC22/CCDC93 (CCC) complex controls membrane protein recycling > Results > The PI(3)P phosphatase MTMR2 is regulated by the CCC complex
plaindirect- Asserted: passes — The authors put it forward as true.
- Checkable: passes — It can be checked against evidence.
- Load-bearing: passes — The paper’s conclusions depend on it.
- Based: passes — The paper gives a reason why it holds.
It may state two separate claims as one.
A result the paper reports from its own data — it cites no other source for it, so there is none to check. The quote shows it is in the paper.
In the paper
“COMMD3 deficiency resulted in a ~3.2-fold increase in total PI(3)P levels; other PIs were also elevated but to a lesser extent”
§ Endosomal PI(3)P regulation by the COMMD/CCDC22/CCDC93 (CCC) complex controls membrane protein recycling > Results > CCC deficiency results in endosomal accumulation of PI(3)P
plaindirect- Asserted: passes — The authors put it forward as true.
- Checkable: passes — It can be checked against evidence.
- Load-bearing: passes — The paper’s conclusions depend on it.
- Based: passes — The paper gives a reason why it holds.
It may state two separate claims as one.
A result the paper reports from its own data — it cites no other source for it, so there is none to check. The quote shows it is in the paper.
In the paper
“VPS35L deletion led to reduced expression of CCC subunits (CCDC22 and COMMD3 in particular) as well as retriever subunits (VPS26C)”
§ Endosomal PI(3)P regulation by the COMMD/CCDC22/CCDC93 (CCC) complex controls membrane protein recycling > Results > CCC and retriever are closely linked but distinct complexes
plaindirect- Asserted: passes — The authors put it forward as true.
- Checkable: passes — It can be checked against evidence.
- Load-bearing: passes — The paper’s conclusions depend on it.
- Based: passes — The paper gives a reason why it holds.
It may state two separate claims as one.
A result the paper reports from its own data — it cites no other source for it, so there is none to check. The quote shows it is in the paper.
In the paper
“siRNA depletion of VPS34 in COMMD3-deficient cells diminished endosomal WASH recruitment and most significantly, this largely eliminated the endosomal trapping of internalized ITGα5 (Fig. 6d–f).”
§ Endosomal PI(3)P regulation by the COMMD/CCDC22/CCDC93 (CCC) complex controls membrane protein recycling > Results > VPS34 blockade reverts endosomal phenotypes of CCC depletion
plaindirect- Asserted: passes — The authors put it forward as true.
- Checkable: passes — It can be checked against evidence.
- Load-bearing: passes — The paper’s conclusions depend on it.
- Based: passes — The paper gives a reason why it holds.
It may state two separate claims as one.
A result the paper reports from its own data — it cites no other source for it, so there is none to check. The quote shows it is in the paper.
In the paper
“the retriever complex is of slightly lower mass in VPS26C-deficient cells compared with rescue cells, indicating that this is the main complex containing VPS26C”
§ Endosomal PI(3)P regulation by the COMMD/CCDC22/CCDC93 (CCC) complex controls membrane protein recycling > Results > CCC and retriever are closely linked but distinct complexes
hedgeddirect- Asserted: passes — The authors put it forward as true.
- Checkable: passes — It can be checked against evidence.
- Load-bearing: passes — The paper’s conclusions depend on it.
- Based: passes — The paper gives a reason why it holds.
It may state two separate claims as one.
A result the paper reports from its own data — it cites no other source for it, so there is none to check. The quote shows it is in the paper.
In the paper
“ARPC2 foci were substantially larger in COMMD3-deficient cells, where they still contained internalized ITGα5”
§ Endosomal PI(3)P regulation by the COMMD/CCDC22/CCDC93 (CCC) complex controls membrane protein recycling > Results > CCC depletion results in increased WASH complex activation
plaincorrelational- Asserted: passes — The authors put it forward as true.
- Checkable: passes — It can be checked against evidence.
- Load-bearing: passes — The paper’s conclusions depend on it.
- Based: passes — The paper gives a reason why it holds.
It may state two separate claims as one.
A result the paper reports from its own data — it cites no other source for it, so there is none to check. The quote shows it is in the paper.
In the paper
“endogenous immunoprecipitation of the CCC complex (by CCDC93 or CCDC22 antibodies) led to limited or undetectable VPS26C and VPS29 co-precipitation, whereas retriever precipitation (by VPS35L antibodies) led to reliable precipitation of other retriever components”
§ Endosomal PI(3)P regulation by the COMMD/CCDC22/CCDC93 (CCC) complex controls membrane protein recycling > Results > CCC and retriever are closely linked but distinct complexes
plaindirect- Asserted: passes — The authors put it forward as true.
- Checkable: passes — It can be checked against evidence.
- Load-bearing: passes — The paper’s conclusions depend on it.
- Based: passes — The paper gives a reason why it holds.
It may state two separate claims as one.
A result the paper reports from its own data — it cites no other source for it, so there is none to check. The quote shows it is in the paper.
In the paper
“VPS34 inhibition significantly reduced endosomal EEA1 and WASH complex recruitment, and prevented excessive endosomal F-actin accumulation in CCDC93 and COMMD3 KO cells (Fig. 6c and Supplementary Fig. 6a–c).”
§ Endosomal PI(3)P regulation by the COMMD/CCDC22/CCDC93 (CCC) complex controls membrane protein recycling > Results > VPS34 blockade reverts endosomal phenotypes of CCC depletion
plaindirect- Asserted: passes — The authors put it forward as true.
- Checkable: passes — It can be checked against evidence.
- Load-bearing: passes — The paper’s conclusions depend on it.
- Based: passes — The paper gives a reason why it holds.
It may state two separate claims as one.
A result the paper reports from its own data — it cites no other source for it, so there is none to check. The quote shows it is in the paper.
In the paper
“WASH-positive vesicles in CCDC93−, COMMD3−, and VPS35L-deficient cells appeared substantially enlarged and accumulated in a tighter perinuclear area (Fig. 4b), thus resulting in a smaller area of the cytosol being occupied by WASH-positive vesicles”
§ Endosomal PI(3)P regulation by the COMMD/CCDC22/CCDC93 (CCC) complex controls membrane protein recycling > Results > CCC depletion results in increased WASH complex activation
hedgeddirect- Asserted: passes — The authors put it forward as true.
- Checkable: passes — It can be checked against evidence.
- Load-bearing: passes — The paper’s conclusions depend on it.
- Based: passes — The paper gives a reason why it holds.
It may state two separate claims as one.
A result the paper reports from its own data — it cites no other source for it, so there is none to check. The quote shows it is in the paper.
In the paper
“The increased endosomal recruitment of the WASH complex in CCC-deficient cells is directly correlated to an increased activity state for this complex, and to F-actin accumulation.”
§ Endosomal PI(3)P regulation by the COMMD/CCDC22/CCDC93 (CCC) complex controls membrane protein recycling > Discussion
plaincorrelational- Asserted: passes — The authors put it forward as true.
- Checkable: passes — It can be checked against evidence.
- Load-bearing: passes — The paper’s conclusions depend on it.
- Based: passes — The paper gives a reason why it holds.
It may state two separate claims as one.
A result the paper reports from its own data — it cites no other source for it, so there is none to check. The quote shows it is in the paper.
In the paper
“altered endosomal morphology, F-actin, and WASH accumulation, as well as PI(3)P accumulation, are unique to CCC complex deletion and not seen in VPS26C- or FAM45A-deleted cell lines.”
§ Endosomal PI(3)P regulation by the COMMD/CCDC22/CCDC93 (CCC) complex controls membrane protein recycling > Discussion
plain- Asserted: passes — The authors put it forward as true.
- Checkable: passes — It can be checked against evidence.
- Load-bearing: passes — The paper’s conclusions depend on it.
- Based: passes — The paper gives a reason why it holds.
It may state two separate claims as one.
The paper states this without a source or data behind it here, so there is nothing to check it against. The quote shows it is in the paper.
In the paper
“in cell lysates both retriever and retromer have similar mobility, which in both cases is larger than the predicted trimeric assembly of their principal subunits, predicted at ~150–170 kDa.”
§ Endosomal PI(3)P regulation by the COMMD/CCDC22/CCDC93 (CCC) complex controls membrane protein recycling > Discussion
plaincorrelational- Asserted: passes — The authors put it forward as true.
- Checkable: passes — It can be checked against evidence.
- Load-bearing: fails — The paper’s conclusions may not depend on it.
- Based: passes — The paper gives a reason why it holds.
Probably not a substantial claim. The paper’s conclusions may not depend on it. It may state two separate claims as one.
A result the paper reports from its own data — it cites no other source for it, so there is none to check. The quote shows it is in the paper.
In the paper
“data presented here indicate that the CCC complex and retriever are two separable assemblies of different sizes (~700 kDa and 250 kDa, respectively), which share VPS35L as a common subunit.”
§ Endosomal PI(3)P regulation by the COMMD/CCDC22/CCDC93 (CCC) complex controls membrane protein recycling > Discussion
hedgedcorrelational- Asserted: passes — The authors put it forward as true.
- Checkable: passes — It can be checked against evidence.
- Load-bearing: unclear — It is unclear whether the paper’s conclusions depend on it.
- Based: passes — The paper gives a reason why it holds.
It may state two separate claims as one.
In the paper
“PI(3)P accumulation on endosomes facilitates the spatial and temporal recruitment of numerous proteins that contain PI(3)P-binding domains such as sorting nexins (SNX)5”
§ Endosomal PI(3)P regulation by the COMMD/CCDC22/CCDC93 (CCC) complex controls membrane protein recycling > Introduction
What the sources say
- Not checked — no full text of the sourcecites [5] Teasdale, R. D. & Collins, B. M. Insights into the PX (phox-homology) domain and SNX (sorting nexin) protein families: structures, functions and roles in disease. Biochem. J. 441, 39–59 (2012). source
plaindirect- Asserted: passes — The authors put it forward as true.
- Checkable: passes — It can be checked against evidence.
- Load-bearing: passes — The paper’s conclusions depend on it.
- Based: passes — The paper gives a reason why it holds.
Probably not a substantial claim.
A conclusion the paper draws from its own results — it cites no other source for it, so there is none to check. The quote shows it is in the paper.
In the paper
“yet the integrity of CCC, but not retriever, is required to maintain normal endosomal levels of phosphatidylinositol-3-phosphate (PI(3)P)”
§ Endosomal PI(3)P regulation by the COMMD/CCDC22/CCDC93 (CCC) complex controls membrane protein recycling > Abstract
plaindirect- Asserted: passes — The authors put it forward as true.
- Checkable: passes — It can be checked against evidence.
- Load-bearing: passes — The paper’s conclusions depend on it.
- Based: passes — The paper gives a reason why it holds.
It may state two separate claims as one.
In the paper
“myotubularins56, which also regulate PI(3)P levels”
§ Endosomal PI(3)P regulation by the COMMD/CCDC22/CCDC93 (CCC) complex controls membrane protein recycling > Results > The PI(3)P phosphatase MTMR2 is regulated by the CCC complex
What the sources say
- Not checked — no full text of the sourcecites [56] Raess, M. A., Friant, S., Cowling, B. S. & Laporte, J. WANTED—Dead or alive: myotubularins, a large disease-associated protein family. Adv. Biol. Regul. 63, 49–58 (2017). source
plaindirect- Asserted: passes — The authors put it forward as true.
- Checkable: passes — It can be checked against evidence.
- Load-bearing: fails — The paper’s conclusions may not depend on it.
- Based: passes — The paper gives a reason why it holds.
Probably not a substantial claim. The paper’s conclusions may not depend on it.
A conclusion the paper draws from its own results — it cites no other source for it, so there is none to check. The quote shows it is in the paper.
In the paper
“the CCC complex provides a link between the retriever and WASH complexes, and this link is required for endosomal recruitment of retriever”
§ Endosomal PI(3)P regulation by the COMMD/CCDC22/CCDC93 (CCC) complex controls membrane protein recycling > Results > CCC links retriever to WASH-containing endosomal domains
plaindirect- Asserted: passes — The authors put it forward as true.
- Checkable: passes — It can be checked against evidence.
- Load-bearing: passes — The paper’s conclusions depend on it.
- Based: passes — The paper gives a reason why it holds.
It may state two separate claims as one.
A conclusion the paper draws from its own results — it cites no other source for it, so there is none to check. The quote shows it is in the paper.
In the paper
“these data suggested that CCC and retriever are closely linked but distinct assemblies”
§ Endosomal PI(3)P regulation by the COMMD/CCDC22/CCDC93 (CCC) complex controls membrane protein recycling > Results > CCC and retriever are closely linked but distinct complexes
hedgedcorrelational- Asserted: passes — The authors put it forward as true.
- Checkable: passes — It can be checked against evidence.
- Load-bearing: passes — The paper’s conclusions depend on it.
- Based: passes — The paper gives a reason why it holds.
It may state two separate claims as one.
A conclusion the paper draws from its own results — it cites no other source for it, so there is none to check. The quote shows it is in the paper.
In the paper
“CCC deficiency, but not retriever deficiency, alters specific PI lipids and has the largest impact on endosomal PI(3)P levels”
§ Endosomal PI(3)P regulation by the COMMD/CCDC22/CCDC93 (CCC) complex controls membrane protein recycling > Results > CCC deficiency results in endosomal accumulation of PI(3)P
plaindirect- Asserted: passes — The authors put it forward as true.
- Checkable: passes — It can be checked against evidence.
- Load-bearing: passes — The paper’s conclusions depend on it.
- Based: passes — The paper gives a reason why it holds.
It may state two separate claims as one.
A conclusion the paper draws from its own results — it cites no other source for it, so there is none to check. The quote shows it is in the paper.
In the paper
“we surmised that the 700 kDa complex likely represents the CCC complex and that VPS35L is a shared subunit present in both CCC and retriever”
§ Endosomal PI(3)P regulation by the COMMD/CCDC22/CCDC93 (CCC) complex controls membrane protein recycling > Results > CCC and retriever are closely linked but distinct complexes
hedgedcorrelational- Asserted: passes — The authors put it forward as true.
- Checkable: passes — It can be checked against evidence.
- Load-bearing: passes — The paper’s conclusions depend on it.
- Based: passes — The paper gives a reason why it holds.
It may state two separate claims as one.
What the paper did — it cites no source for this, so there is none to check. The quote shows it is in the paper.
In the paper
“Results for individual cells are plotted, along with the mean and s.e.m. for each group (n = 62 cells for WT, 45 for CCDC93 KO, 48 for COMMD3 KO, 50 for VPS35L KO, 43 for VPS26C KO, 48 for FAM45A KO); ***P < 0.0001 (one-way ANOVA and Dunnett’s test to control).”
§ Endosomal PI(3)P regulation by the COMMD/CCDC22/CCDC93 (CCC) complex controls membrane protein recycling > Results > CCC depletion results in F-actin accumulation on endosomes
plainn = 62- Asserted: passes — The authors put it forward as true.
- Checkable: passes — It can be checked against evidence.
- Load-bearing: fails — The paper’s conclusions may not depend on it.
- Based: passes — The paper gives a reason why it holds.
Probably not a substantial claim. The paper’s conclusions may not depend on it. It may state two separate claims as one.
A conclusion the paper draws from its own results — it cites no other source for it, so there is none to check. The quote shows it is in the paper.
In the paper
“PIKfyve activity seemed intact as conversion of PI3P into PI(3,5)P2 in CCC-deficient cells was not impaired judging by the noted increase in PI(3,5)P2 (Supplementary Fig. 5b).”
§ Endosomal PI(3)P regulation by the COMMD/CCDC22/CCDC93 (CCC) complex controls membrane protein recycling > Results > The PI(3)P phosphatase MTMR2 is regulated by the CCC complex
hedged- Asserted: passes — The authors put it forward as true.
- Checkable: passes — It can be checked against evidence.
- Load-bearing: passes — The paper’s conclusions depend on it.
- Based: passes — The paper gives a reason why it holds.
It may state two separate claims as one.
A conclusion the paper draws from its own results — it cites no other source for it, so there is none to check. The quote shows it is in the paper.
In the paper
“our data indicated that MTMR2 not only interacts with the CCC complex but its deficiency phenocopies the endosomal-recycling defect seen in CCC-deficient cells.”
§ Endosomal PI(3)P regulation by the COMMD/CCDC22/CCDC93 (CCC) complex controls membrane protein recycling > Results > The PI(3)P phosphatase MTMR2 is regulated by the CCC complex
hedgeddirect- Asserted: passes — The authors put it forward as true.
- Checkable: passes — It can be checked against evidence.
- Load-bearing: passes — The paper’s conclusions depend on it.
- Based: passes — The paper gives a reason why it holds.
It may state two separate claims as one.
A conclusion the paper draws from its own results — it cites no other source for it, so there is none to check. The quote shows it is in the paper.
In the paper
“the CCC complex functions as a negative regulator of WASH-dependent F-actin deposition, and suggests that this negative regulation is required for optimal cargo sorting from endosomes”
§ Endosomal PI(3)P regulation by the COMMD/CCDC22/CCDC93 (CCC) complex controls membrane protein recycling > Results > CCC depletion results in increased WASH complex activation
hedgeddirect- Asserted: passes — The authors put it forward as true.
- Checkable: passes — It can be checked against evidence.
- Load-bearing: passes — The paper’s conclusions depend on it.
- Based: passes — The paper gives a reason why it holds.
It may state two separate claims as one.
A conclusion the paper draws from its own results — it cites no other source for it, so there is none to check. The quote shows it is in the paper.
In the paper
“these results are consistent with CCC and retriever being distinct entities that share VPS35L as common subunit”
§ Endosomal PI(3)P regulation by the COMMD/CCDC22/CCDC93 (CCC) complex controls membrane protein recycling > Results > CCC and retriever are closely linked but distinct complexes
hedgedcorrelational- Asserted: passes — The authors put it forward as true.
- Checkable: passes — It can be checked against evidence.
- Load-bearing: passes — The paper’s conclusions depend on it.
- Based: passes — The paper gives a reason why it holds.
It may state two separate claims as one.
What the paper did — it cites no source for this, so there is none to check. The quote shows it is in the paper.
In the paper
“To ensure that these results were not due to unintended off-target effects of the VPS34 inhibitor, we used three independent VPS34 siRNAs (Supplementary Fig. 6d).”
§ Endosomal PI(3)P regulation by the COMMD/CCDC22/CCDC93 (CCC) complex controls membrane protein recycling > Results > VPS34 blockade reverts endosomal phenotypes of CCC depletion
plain- Asserted: passes — The authors put it forward as true.
- Checkable: passes — It can be checked against evidence.
- Load-bearing: passes — The paper’s conclusions depend on it.
- Based: passes — The paper gives a reason why it holds.
Probably not a substantial claim.
What the paper did — it cites no source for this, so there is none to check. The quote shows it is in the paper.
In the paper
“quantification after normalization by the loading control (Actin), is also presented as % compared with the parental control (representative of at least three separate iterations)”
§ Endosomal PI(3)P regulation by the COMMD/CCDC22/CCDC93 (CCC) complex controls membrane protein recycling > Results > Defining the CCC and retriever interactomes
plain- Asserted: passes — The authors put it forward as true.
- Checkable: passes — It can be checked against evidence.
- Load-bearing: fails — The paper’s conclusions may not depend on it.
- Based: passes — The paper gives a reason why it holds.
Probably not a substantial claim. The paper’s conclusions may not depend on it.
What the paper did — it cites no source for this, so there is none to check. The quote shows it is in the paper.
In the paper
“Representative images of three independent experiments are shown.”
§ Endosomal PI(3)P regulation by the COMMD/CCDC22/CCDC93 (CCC) complex controls membrane protein recycling > Results > CCC depletion results in F-actin accumulation on endosomes
plain- Asserted: passes — The authors put it forward as true.
- Checkable: passes — It can be checked against evidence.
- Load-bearing: fails — The paper’s conclusions may not depend on it.
- Based: passes — The paper gives a reason why it holds.
Probably not a substantial claim. The paper’s conclusions may not depend on it.
What the paper did — it cites no source for this, so there is none to check. The quote shows it is in the paper.
In the paper
“after review and approval of the study protocols by the human research ethics committee of the Women’s and Children’s Health Network (Adelaide, South Australia, Australia)”
§ Endosomal PI(3)P regulation by the COMMD/CCDC22/CCDC93 (CCC) complex controls membrane protein recycling > Methods > Study approval
plain- Asserted: passes — The authors put it forward as true.
- Checkable: passes — It can be checked against evidence.
- Load-bearing: fails — The paper’s conclusions may not depend on it.
- Based: passes — The paper gives a reason why it holds.
Probably not a substantial claim. The paper’s conclusions may not depend on it.
What the paper did — it cites no source for this, so there is none to check. The quote shows it is in the paper.
In the paper
“All patient-related studies were performed with the written consent of the participants or their legal guardians”
§ Endosomal PI(3)P regulation by the COMMD/CCDC22/CCDC93 (CCC) complex controls membrane protein recycling > Methods > Study approval
plain- Asserted: passes — The authors put it forward as true.
- Checkable: passes — It can be checked against evidence.
- Load-bearing: fails — The paper’s conclusions may not depend on it.
- Based: passes — The paper gives a reason why it holds.
Probably not a substantial claim. The paper’s conclusions may not depend on it.
What the paper did — it cites no source for this, so there is none to check. The quote shows it is in the paper.
In the paper
“Murine studies were approved by the UT Southwestern Institutional Animal Care and Use Committee under study number APN 102011”
§ Endosomal PI(3)P regulation by the COMMD/CCDC22/CCDC93 (CCC) complex controls membrane protein recycling > Methods > Study approval
plain- Asserted: passes — The authors put it forward as true.
- Checkable: passes — It can be checked against evidence.
- Load-bearing: fails — The paper’s conclusions may not depend on it.
- Based: passes — The paper gives a reason why it holds.
Probably not a substantial claim. The paper’s conclusions may not depend on it.
A conclusion the paper draws from its own results — it cites no other source for it, so there is none to check. The quote shows it is in the paper.
In the paper
“the aggregate of the data included here indicate that the main defect is in PI(3)P conversion to PI owing to MTMR2 functional defects, specifically its phosphorylation status that controls recruitment to endosomes.”
§ Endosomal PI(3)P regulation by the COMMD/CCDC22/CCDC93 (CCC) complex controls membrane protein recycling > Discussion
hedgeddirect- Asserted: passes — The authors put it forward as true.
- Checkable: passes — It can be checked against evidence.
- Load-bearing: passes — The paper’s conclusions depend on it.
- Based: passes — The paper gives a reason why it holds.
It may state two separate claims as one.
What the paper did — it cites no source for this, so there is none to check. The quote shows it is in the paper.
In the paper
“To control for protein recovery, samples were eluted in 4 × sodium dodecyl sulfate (SDS) sample buffer by boiling for 5 min, and subsequently loaded onto SDS–PAGE gels for immunoblotting, as described above.”
§ Endosomal PI(3)P regulation by the COMMD/CCDC22/CCDC93 (CCC) complex controls membrane protein recycling > Methods > VPS34 in vitro kinase activity assay
plain- Asserted: passes — The authors put it forward as true.
- Checkable: passes — It can be checked against evidence.
- Load-bearing: fails — The paper’s conclusions may not depend on it.
- Based: passes — The paper gives a reason why it holds.
Probably not a substantial claim. The paper’s conclusions may not depend on it. It may state two separate claims as one.
What the paper did — it cites no source for this, so there is none to check. The quote shows it is in the paper.
In the paper
“These protocols authorized the preparation of mouse embryo fibroblast cell lines utilized in the studies presented here.”
§ Endosomal PI(3)P regulation by the COMMD/CCDC22/CCDC93 (CCC) complex controls membrane protein recycling > Methods > Study approval
plaindirect- Asserted: passes — The authors put it forward as true.
- Checkable: passes — It can be checked against evidence.
- Load-bearing: fails — The paper’s conclusions may not depend on it.
- Based: passes — The paper gives a reason why it holds.
Probably not a substantial claim. The paper’s conclusions may not depend on it.
What the paper did — it cites no source for this, so there is none to check. The quote shows it is in the paper.
In the paper
“Both protein and peptide FDR were set to 1%.”
§ Endosomal PI(3)P regulation by the COMMD/CCDC22/CCDC93 (CCC) complex controls membrane protein recycling > Methods > Protein affinity purification and proteomics
plain- Asserted: passes — The authors put it forward as true.
- Checkable: passes — It can be checked against evidence.
- Load-bearing: fails — The paper’s conclusions may not depend on it.
- Based: passes — The paper gives a reason why it holds.
Probably not a substantial claim. The paper’s conclusions may not depend on it.
What the paper did — it cites no source for this, so there is none to check. The quote shows it is in the paper.
In the paper
“An additional requirement of two unique peptide sequences per protein was used for protein identification.”
§ Endosomal PI(3)P regulation by the COMMD/CCDC22/CCDC93 (CCC) complex controls membrane protein recycling > Methods > Protein affinity purification and proteomics
plain- Asserted: passes — The authors put it forward as true.
- Checkable: passes — It can be checked against evidence.
- Load-bearing: fails — The paper’s conclusions may not depend on it.
- Based: passes — The paper gives a reason why it holds.
Probably not a substantial claim. The paper’s conclusions may not depend on it.
A conclusion the paper draws from its own results — it cites no other source for it, so there is none to check. The quote shows it is in the paper.
In the paper
“PI(3)P turnover is necessary for the loss of WASH complex from endosomes and the termination of F-actin nucleation”
§ Endosomal PI(3)P regulation by the COMMD/CCDC22/CCDC93 (CCC) complex controls membrane protein recycling > Discussion
plaindirect- Asserted: passes — The authors put it forward as true.
- Checkable: passes — It can be checked against evidence.
- Load-bearing: passes — The paper’s conclusions depend on it.
- Based: passes — The paper gives a reason why it holds.
It may state two separate claims as one.
What the paper did — it cites no source for this, so there is none to check. The quote shows it is in the paper.
In the paper
“and by the Mayo Clinic Institutional Animal Care and Use Committee under study number A21314”
§ Endosomal PI(3)P regulation by the COMMD/CCDC22/CCDC93 (CCC) complex controls membrane protein recycling > Methods > Study approval
plain- Asserted: passes — The authors put it forward as true.
- Checkable: passes — It can be checked against evidence.
- Load-bearing: fails — The paper’s conclusions may not depend on it.
- Based: passes — The paper gives a reason why it holds.
Probably not a substantial claim. The paper’s conclusions may not depend on it.
What the paper did — it cites no source for this, so there is none to check. The quote shows it is in the paper.
In the paper
“As a cutoff, proteins with a minimum enrichment of 10-fold and whose spectral indexes were within one order of magnitude of the spectral index of the bait were selected as putative interacting proteins.”
§ Endosomal PI(3)P regulation by the COMMD/CCDC22/CCDC93 (CCC) complex controls membrane protein recycling > Methods > Protein affinity purification and proteomics
plain- Asserted: passes — The authors put it forward as true.
- Checkable: passes — It can be checked against evidence.
- Load-bearing: passes — The paper’s conclusions depend on it.
- Based: passes — The paper gives a reason why it holds.
Probably not a substantial claim.
A conclusion the paper draws from its own results — it cites no other source for it, so there is none to check. The quote shows it is in the paper.
In the paper
“VPS35L deletion shares properties with CCC-deficient states consistent with its presence in both retriever and the CCC complexes.”
§ Endosomal PI(3)P regulation by the COMMD/CCDC22/CCDC93 (CCC) complex controls membrane protein recycling > Discussion
plaincorrelational- Asserted: passes — The authors put it forward as true.
- Checkable: passes — It can be checked against evidence.
- Load-bearing: passes — The paper’s conclusions depend on it.
- Based: passes — The paper gives a reason why it holds.
It may state two separate claims as one.
What the paper did — it cites no source for this, so there is none to check. The quote shows it is in the paper.
In the paper
“This protocol authorized the derivation of dermal fibroblasts from patients with CCDC22 mutations.”
§ Endosomal PI(3)P regulation by the COMMD/CCDC22/CCDC93 (CCC) complex controls membrane protein recycling > Methods > Study approval
plaindirect- Asserted: passes — The authors put it forward as true.
- Checkable: passes — It can be checked against evidence.
- Load-bearing: fails — The paper’s conclusions may not depend on it.
- Based: passes — The paper gives a reason why it holds.
Probably not a substantial claim. The paper’s conclusions may not depend on it.
The paper relies on this without support.
PI(3)P plays a central role in endosomal recruitment of effector proteins such as EEA1.
“As PI(3)P plays a central role in endosomal recruitment of effector proteins, such as early endosomal antigen 1 (EEA1), we assessed the levels of endosomally localized EEA1”
The paper relies on this without support.
The phosphoserine antibody used recognizes phosphorylated MTMR2 at serine 58.
“This residue is preceded by phenylalanine and upon phosphorylation may be recognized by a phosphoserine antibody raised against this motif (phosphoserine preceded by tyrosine, phenylalanine, or tryptophan).”
The paper relies on this without support.
The dsRed-EEA1-FYVE reporter specifically reports endosomal PI(3)P levels.
“cells transfected with a dsRed-EEA1-FYVE domain PI(3)P reporter plasmid”
Claims other papers make about this one
Each is checked against this paper’s own text: does it say what the citing paper says it does?
The source backs part of the claim, not all of it — or backs it for a different population, condition or comparison.
In the citing paper
“We transfected rat hippocampal neurons with dsRed-EEA1-FYVE, a bioprobe that potently and specifically binds PI(3)P (Singla et al., 2019).”
From Recruitment of the SNX17-Retriever recycling pathway regulates synaptic function and plasticity (2023) · cites this paper as Singla et al., 2019
Experimental — accuracy not yet measuredThe source backs part of the claim, not all of it — or backs it for a different population, condition or comparison.
In the citing paper
“VPS35 is a marker of the Retromer complex, and both Retromer and Retriever pathways emerge from the same microdomains of VPS35-containing endosomes (McNally et al., 2017; Singla et al., 2019).”
From Recruitment of the SNX17-Retriever recycling pathway regulates synaptic function and plasticity (2023) · cites this paper as Singla et al., 2019
Experimental — accuracy not yet measuredThe source backs part of the claim, not all of it — or backs it for a different population, condition or comparison.
In the citing paper
“The 16th subunit is DENND10 (differentially expressed in normal and neoplastic cells-containing protein 10, also called FAM45A)6,16,20,21,22”
From Structure of the endosomal Commander complex linked to Ritscher-Schinzel syndrome (2023) · cites this paper as [21]
Experimental — accuracy not yet measuredThe source backs part of the claim, not all of it — or backs it for a different population, condition or comparison.
In the citing paper
“Commander is composed of sixteen subunits, arranged in two sub-assemblies, the CCC and Retriever complexes.”
From Structure of the endosomal Commander complex linked to Ritscher-Schinzel syndrome (2023) · cites this paper as [21]
Experimental — accuracy not yet measuredThe source backs part of the claim, not all of it — or backs it for a different population, condition or comparison.
In the citing paper
“its deletion does not affect recycling of α5 integrin.21”
From Structure of the endosomal Commander complex linked to Ritscher-Schinzel syndrome (2023) · cites this paper as [21]
Experimental — accuracy not yet measured
The source backs part of the claim, not all of it — or backs it for a different population, condition or comparison.
In the citing paper
“The structure is also consistent with truncation analyses that found N-terminal regions of CCDC22 and CCDC93 could interact with COMMD proteins but not Retriever.21,65”
From Structure of the endosomal Commander complex linked to Ritscher-Schinzel syndrome (2023) · cites this paper as [21]
Experimental — accuracy not yet measuredThe source backs part of the claim, not all of it — or backs it for a different population, condition or comparison.
In the citing paper
“DENND10 localizes to late endosomes, and its knockdown perturbs aspects of endosomal morphology and function,21,69 although it appears dispensable for assembly of Commander.21”
From Structure of the endosomal Commander complex linked to Ritscher-Schinzel syndrome (2023) · cites this paper as [21]
Experimental — accuracy not yet measuredThe source backs part of the claim, not all of it — or backs it for a different population, condition or comparison.
In the citing paper
“The WASH complex is regulated by the COMMD-CCDC22-CCDC93 or CCC complex [8], a 12-protein assembly that limits the endosomal localization and actin polymerization activity of the WASH complex [14].”
From CCDC22 mutations that impair COMMD binding cause attenuated 3C/Ritscher-Schinzel syndrome (2025) · cites this paper as [14]
Experimental — accuracy not yet measuredThe source backs part of the claim, not all of it — or backs it for a different population, condition or comparison.
In the citing paper
“its depletion has been shown to impair the sorting of Retromer cargoes.32”
From Endosomal protein DENND10 promotes developmental competence of neurite extension (2025) · cites this paper as [32]
Experimental — accuracy not yet measuredThe cited source says what the claim attributes to it.
In the citing paper
“although it is not required for Commander stability, and its deletion does not affect recycling of α5 integrin.21”
From Structure of the endosomal Commander complex linked to Ritscher-Schinzel syndrome (2023) · cites this paper as [21]
The cited source says what the claim attributes to it.
In the citing paper
“Interestingly, it was reported that DENND10/FAM45A knockout in HeLa cells did not affect the trafficking of integrin β1, a typical Retriever cargo, but instead perturbed cargo recycling of the related Retromer complex.32”
From Endosomal protein DENND10 promotes developmental competence of neurite extension (2025) · cites this paper as [32]
Citations
Cites
Phosphoinositides in cell regulation and membrane dynamics
Di Paolo, G., & De Camilli, P. (2006) · Nature · doi:10.1038/nature05185 · Cited by 2,790
Huotari, J., & Helenius, A. (2011) · The EMBO Journal · doi:10.1038/emboj.2011.286 · Cited by 2,448
A Protein Interaction Map of Drosophila melanogaster
Giot, L., Bader, J. S., Brouwer, C., Chaudhuri, A., Kuang, B., Li, Y., Hao, Y. L., Ooi, C. E., Godwin, B., Vitols, E., et al. (2003) · Science · doi:10.1126/science.1090289 · Cited by 1,863
Architecture of the human interactome defines protein communities and disease networks
Huttlin, E. L., Bruckner, R. J., Paulo, J. A., Cannon, J. R., Ting, L., Baltier, K., Colby, G., Gebreab, F., Gygi, M. P., Parzen, H., et al. (2017) · Nature · doi:10.1038/nature22366 · Cited by 1,437
A Human Interactome in Three Quantitative Dimensions Organized by Stoichiometries and Abundances
Hein, M. Y., Hubner, N. C., Poser, I., Cox, J., Nagaraj, N., Toyoda, Y., Gak, I. A., Weisswange, I., Mansfeld, J., Buchholz, F., et al. (2015) · Cell · doi:10.1016/j.cell.2015.09.053 · Cited by 1,270
A Protein Complex Network of Drosophila melanogaster
Guruharsha, K. G., Rual, J.-F., Zhai, B., Mintseris, J., Vaidya, P., Vaidya, N., Beekman, C., Wong, C., Rhee, D. Y., Cenaj, O., et al. (2011) · Cell · doi:10.1016/j.cell.2011.08.047 · Cited by 616
The Arp2/3 Activator WASH Controls the Fission of Endosomes through a Large Multiprotein Complex
Derivery, E., Sousa, C., Gautier, J. J., Lombard, B., Loew, D., & Gautreau, A. (2009) · Developmental Cell · doi:10.1016/j.devcel.2009.09.010 · Cited by 602
Phosphatidylinositol-3-OH kinases are Rab5 effectors
Christoforidis, S., Miaczynska, M., Ashman, K., Wilm, M., Zhao, L., Yip, S.-C., Waterfield, M. D., Backer, J. M., & Zerial, M. (1999) · Nature Cell Biology · doi:10.1038/12075 · Cited by 559
Protein interaction mapping: A Drosophila case study
Formstecher, E., Aresta, S., Collura, V., Hamburger, A., Meil, A., Trehin, A., Reverdy, C., Betin, V., Maire, S., Brun, C., et al. (2005) · Genome Research · doi:10.1101/gr.2659105 · Cited by 542
Steinberg, F., Gallon, M., Winfield, M., Thomas, E. C., Bell, A. J., Heesom, K. J., Tavaré, J. M., & Cullen, P. J. (2013) · Nature Cell Biology · doi:10.1038/ncb2721 · Cited by 524
Cited by
Sorted by citations
Items 101–113 of 113
Phosphoinositide regulation by the CCC complex promotes phagosome maturation and host defensePreprint
Buck, H., Liu, Q., Singla, A., Kramer, D. A., Pereyria, R., Lee, W.-R., Burford, W. B., Yin, J., Davis, A., Tan, S., et al. (2025) · bioRxiv (Cold Spring Harbor Laboratory) · doi:10.64898/2025.12.15.694371
Self-citationUnraveling the Role of TMEM184B in Neuronal Endolysosomal Acidification
Wright, E., & Wright, E. (2025) · UA Campus Repository (The University of Arizona)
The role of myotubularin-related lipid phosphatases in cancer pathogenesis
Doubravská, L., & Macůrková, M. (2026) · Experimental and Molecular Pathology · doi:10.1016/j.yexmp.2026.105022
Liver Steatosis in Induced Hepatocytes From Carriers of Spinal Muscular Atrophy
Sun, L., Leow, D. M.-K., Wang, L. C., Eio, M. Y., Koh, H. W. L., Khong, Z. J., Narayanan, G., Teo, A. K. S., Giadone, R. M., Sobota, R. M., et al. (2026) · Muscle & Nerve · doi:10.1002/mus.70111
A Remarkable Case of Conserved Domain Swapping in the COMMD Family of ProteinsPreprint
Hall, R. J., Liu, M., Hospenthal, M. K., Celligoi, D. J., Ghai, R., Chen, K., Sacharz, J., Stroud, D. A., Lott, J. S., Healy, M. D., et al. (2026) · SSRN Electronic Journal · doi:10.64898/2026.02.02.703414
Receptor traffic in breast cancer
Jäntti, N. Z. (2026) · UTUPub (University of Turku)
Xu, S., Buridant, A., Hirsch, T., Duhamel, C., Ledoux, B., Shafaq‐Zadah, M., Dransart, E., Thines, L., Johannes, L., van der Bruggen, P., et al. (2026) · eLife · doi:10.7554/elife.105821.2
PPP2R1A regulates migration persistence through the WAVE Shell Complex
Wang, Y. (2022) · theses.fr (ABES) · doi:10.70675/fbda9a09zb36az49eez94bez2298948f5def
Simonneau, B. (2023) · theses.fr (ABES) · doi:10.70675/8438da55z2d64z4494zb09dz0edd1e9ed836
Interaction entre autophagie et exosomes au niveau synaptique dans la maladie de Parkinson
Sanchez-Mirasierra, I. (2023) · theses.fr (ABES) · doi:10.70675/7104d6d5z945ez494eza917zda9e6be1eea6
Ruso-López, M., Pérez-Díaz, A. J., & Prieto-Ruiz, F. (2026) · Precision Oncology · doi:10.3390/precisoncol1030010
Determination and characterization of new interactors for the small GTPase RAB25
Larcher, R. (2022) · Knowledge UdeS (Institutional Deposit of the University of Sherbrooke)
Metadata
- Authors
- Singla, A., Fedoseienko, A., Giridharan, S. S. P., Overlee, B. L., Lopez, A., Jia, D., Song, J., Huff-Hardy, K., Weisman, L., Burstein, E., & Billadeau, D. D.
- Affiliations
- The University of Texas Southwestern Medical Center (US)
- Mayo Clinic (US)
- University of Michigan (US)
- Sichuan University (CN)
- Corresponding author
- Burstein, Ezra
- Billadeau, Daniel D.
- ORCID
- Venue
- Nature Communications
- Published
- 2019-09-19
- Volume
- 10
- Issue
- 1
- Pages
- 4271-4271
- ISSN
- 2041-1723 (ISSN-L)
- PMC
- PMC6753146
- OpenAlex
- W2974473258
- Semantic Scholar
- 8f23c20a8c8de5f8b7a130b5cc6f7ed138ca3e2f
- Cited by
- 113
- References
- 70
- Citations by year
- 2026: 11 · 2025: 22 · 2024: 15 · 2023: 18 · 2022: 20 · 2021: 14 · 2020: 12 · 2019: 1
- FWCI
- 4.27
- Type
- journal article
- Language
- en
- Open access
- gold
- doi.org
- Locations
- Nature Communications (publishedVersion, cc-by)
- PubMed Central (publishedVersion, cc-by)
- PubMed (publishedVersion)
- RePEc: Research Papers in Economics (submittedVersion)
- DOAJ (DOAJ: Directory of Open Access Journals) (submittedVersion, cc-by-sa)
- DOAJ (DOAJ: Directory of Open Access Journals) (submittedVersion)
- Funders
- U.S. Department of Health & Human Services | National Institutes of Health (R01DK073639, RO1DK107733, R01NS064015, R01NS099340, K01DK106346)
- Topics
- Life Sciences › Biochemistry, Genetics and Molecular Biology › Cell Biology › Cellular transport and secretion
- Life Sciences › Biochemistry, Genetics and Molecular Biology › Cell Biology › Autophagy in Disease and Therapy
- Life Sciences › Biochemistry, Genetics and Molecular Biology › Physiology › Calcium signaling and nucleotide metabolism
- Keywords
- protein recycling, endolysosomal system, WASH complex, MTMR2, cargo recognition, membrane protein recycling
- MeSH terms
- Actins, Animals, HeLa Cells, Humans, Lysosomes, Membrane Proteins, Microfilament Proteins, Phosphorylation, Proteins, Endosomes, Phosphatidylinositol Phosphates, Vesicular Transport Proteins, RNA Interference, RNA, Small Interfering, Cell Line, Tumor, Adaptor Proteins, Signal Transducing, Mice, Protein Tyrosine Phosphatases, Non-Receptor, HEK293 Cells
About these checks
Registry, retraction, Cites and statistics results are computed, not judged, with one exception: a printed reference that no index lists is read once by a model before it counts as a citation error. Claims are extracted by a model and kept only when their quote appears verbatim in the text; each cited source is then checked, with a model’s help, for whether it says what the claim relies on. Those verdicts can be wrong — read the claim’s quote and the cited source before relying on one.
A language model drew the claims from the paper on 2026-11-08, under version 3 of the claim definition (model deepseek-v4.1-flash, prompt extract-v3).
A second model labelled each claim on 2026-11-08 (model jev-1.13-20260917, definition revision gold-guideline-v0.2).
Cited sources are checked with a language model’s help (gpt-6-sol).
Statistics and arithmetic are recomputed, not judged.
Confidence bands are shown only for fields calibrated on our annotated test set. None is calibrated yet, so no band is shown.
What counts as a claim ›How we measure confidence ›How we check this ›
Are you an author, or do you see a problem with this page? Request a review
