

The DOI matches its Crossref record; 58 of the 59 references it cites were found in a registry or an index; 40 of the 57 sources its claims cite were checked for support.
Deep convolutional neural networks to predict cardiovascular risk from computed tomography
Open accessAbstract
Coronary artery calcium is an accurate predictor of cardiovascular events. While it is visible on all computed tomography (CT) scans of the chest, this information is not routinely quantified as it requires expertise, time, and specialized equipment. Here, we show a robust and time-efficient deep learning system to automatically quantify coronary calcium on routine cardiac-gated and non-gated CT. As we evaluate in 20,084 individuals from distinct asymptomatic (Framingham Heart Study, NLST) and stable and acute chest pain (PROMISE, ROMICAT-II) cohorts, the automated score is a strong predictor of cardiovascular events, independent of risk factors (multivariable-adjusted hazard ratios up to 4.3), shows high correlation with manual quantification, and robust test-retest reliability. Our results demonstrate the clinical value of a deep learning system for the automated prediction of cardiovascular events. Implementation into clinical practice would address the unmet need of automating proven imaging biomarkers to guide management and improve population health.
Overview
AI snapshot
Written from the paper’s full text.
TL;DR
A deep learning system automatically quantified coronary artery calcium from routine cardiac-gated and non-gated CT and predicted cardiovascular events across four large cohorts. The automated score was strongly associated with events, correlated highly with manual scoring, and showed robust test–retest reliability.
Key findings
- In 20,084 test individuals from FHS-CT2, NLST, PROMISE, and ROMICAT-II, the automated calcium score was a predictor of cardiovascular events independent of risk factors, with multivariable-adjusted hazard ratios up to 4.3 in NLST and odds ratios up to 57.11 in ROMICAT-II.
- NLST (n = 14,959; ASCVD death n = 288; median follow-up 6.7 years): adjusted for age, sex, diabetes, hypertension, past heart disease, and stroke, HRs versus very low risk were 1.57 (95% CI 0.96–2.57, P = 0.069) for low, 2.79 (1.70–4.57, P < 0.001) for moderate, and 3.87 (2.45–6.11, P < 0.001) for high.
- PROMISE (n = 4,021; all-cause mortality, MI, or unstable angina n = 130; median 25 months): adjusted for Framingham Risk Score, HRs were 1.90 (1.15–3.15, P = 0.012), 2.57 (1.47–4.50, P = 0.001), and 2.95 (1.71–5.08, P < 0.001) for low, moderate, and high versus very low.
- ROMICAT-II (n = 441; ACS n = 38): adjusted for TIMI risk score, ORs were 7.70 (2.44–24.30, P = 0.001), 16.20 (4.44–59.13, P < 0.001), and 57.11 (16.55–197.12, P < 0.001) for low, moderate, and high versus very low. Automated scores correlated with manual scores in 5,521 patients (Spearman 0.92, P < 0.0001), combined predicted AUC was 0.74 versus manual 0.75 (P = 0.544), and test–retest ICC was 0.993 versus manual 0.997 in 252 pairs.
Methods
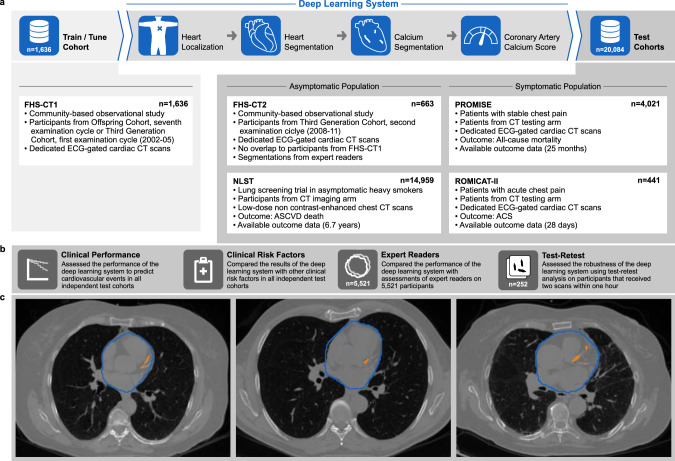
- Retrospective secondary analysis of a longitudinal primary prevention cohort (FHS-CT1 and FHS-CT2) and three randomized trials (NLST, PROMISE, ROMICAT-II). The system was trained and tuned on 1,636 FHS-CT1 CT scans and tested on 20,084 scans: FHS-CT2 n = 663, NLST n = 14,959, PROMISE n = 4,021, ROMICAT-II n = 441.
- The deep learning system used four consecutive U-Net-based steps: heart localization, heart segmentation, coronary calcium segmentation, and Agatston calcium score calculation. Scores were stratified as very low (0), low (1–100), moderate (101–300), and high (>300).
- Analyses included Cox proportional hazards and log-rank tests for NLST and PROMISE, odds ratios for ROMICAT-II, Spearman correlation, ICC, Cohen’s kappa, concordance, and random-effects meta-analysis of AUCs. Manual calcium scores were available for 5,521 subjects.
Limitations
- The paper states that most participants were non-Hispanic white: FHS 100%, NLST 91%, PROMISE 77%, and ROMICAT-II 66%; generalizability to other demographics requires future study.
- The paper states that the system evaluated CAC on non-contrast cardiac and chest CT and therefore could not detect noncalcified plaque, which can be present even with a calcium score of zero.
- Evident from the text: manual reference scores were available for only 5,521 of 20,084 test subjects, and NLST manual validation used a randomly selected subset of 396; FHS-CT2 testing included all CTs, including those initially considered non-diagnostic, while training used only diagnostic-quality CTs.
Model-written summary. Check it against the paper before relying on it.
Integrity signals
Registry
Cites
Statistics
Figures
Verification
Claims the paper makes
21 Own result · 20 Own method · 12 Partly supported · 10 Own interpretation · 7 No full text of the sources · 4 No basis given · 3 Couldn’t confirm · 2 Supported · 2 Supported so far · 1 Sources not found · accuracy not yet measured
The cited sources that could be checked couldn’t confirm or dispute this claim.
In the paper
“Despite these recommendations, a dedicated coronary calcium scoring CT is not yet covered by Medicare and most US insurance companies, and for this reason, there is a great deal of interest in deriving the calcium score from routine chest CTs, which are far more common8,28,29.”
§ Deep convolutional neural networks to predict cardiovascular risk from computed tomography > Discussion
What the sources say
- Not checked — no full text of the sourcecites [8] Hecht, H. S. et al. 2016 SCCT/STR guidelines for coronary artery calcium scoring of noncontrast noncardiac chest CT scans: a report of the Society of Cardiovascular Computed Tomography and Society of Thoracic Radiology. J. Thorac. Imaging 32, W54–W66 (2017). source
- Not checked — no full text of the sourcecites [28] Hecht, H. S. Coronary artery calcium analysis and reporting on noncontrast chest CT scans: a paradigm shift in prevention. Curr. Cardiovasc. Imaging Reports 9 (2016). source
- Could not verifycites [29] Lu, M. T. et al. Lung cancer screening eligibility in the community: cardiovascular risk factors, coronary artery calcification, and cardiovascular events. Circulation 134, 897–899 (2016). sourceExperimental — accuracy not yet measured
The paper discusses CMS coverage of lung cancer screening CT and the use of those scans to assess coronary calcium (main text; page unavailable). It does not address whether Medicare or most US insurers cover dedicated coronary calcium scoring CT; searches for that coverage claim found no passage. (LLM, conf=0.74)
plain- Asserted: passes — The authors put it forward as true.
- Checkable: passes — It can be checked against evidence.
- Load-bearing: passes — The paper’s conclusions depend on it.
- Based: passes — The paper gives a reason why it holds.
Every source the paper cites for this claim was checked and supports it.
In the paper
“Persons with a calcium score of zero are at very low risk24, with increasing risk in the ordinal calcium score tiers identified by the deep learning system25–27.”
§ Deep convolutional neural networks to predict cardiovascular risk from computed tomography > Discussion
What the sources say
- Supportedcites [24] Blaha, M. J. et al. Role of coronary artery calcium score of zero and other negative risk markers for cardiovascular disease: the multi-ethnic study of atherosclerosis (MESA). Circulation 133, 849–858 (2016). source
The Discussion reports that a coronary artery calcium score of zero (CAC=0) produced the greatest reduction in estimated post-test cardiovascular risk and notes the excellent prognosis of asymptomatic individuals with that result. This supports the cited claim that people with a calcium score of zero are at very low risk; the separate claim about increasing risk across score tiers is attached to other citations. (LLM, conf=0.92)
plaincorrelational- Asserted: passes — The authors put it forward as true.
- Checkable: passes — It can be checked against evidence.
- Load-bearing: unclear — It is unclear whether the paper’s conclusions depend on it.
- Based: passes — The paper gives a reason why it holds.
- Supported
The cited sources support only part of this claim — read each source’s verdict below.
In the paper
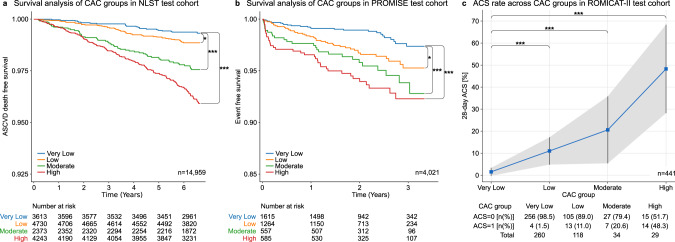
“In 4021 patients acquired at 193 North American sites, there was a graded association between extent of deep learning calcium score and cardiac events, defined as the composite of death, myocardial infarction, or hospitalization for unstable angina over median 25 months (P < 0.001)(Fig. 2b)19.”
§ Deep convolutional neural networks to predict cardiovascular risk from computed tomography > Results > Risk predictions in stable and acute chest pain patients
What the sources say
- Partly supportedcites [19] Douglas, P. S. et al. PROspective multicenter imaging study for evaluation of chest pain: rationale and design of the PROMISE trial. Am. Heart J. 167, 796–803.e1 (2014). sourceExperimental — accuracy not yet measured
The Abstract Results reports enrollment at 193 US and Canadian sites, and the Abstract Methods identifies death, myocardial infarction, and hospitalization for unstable angina as components of the planned endpoint. But this rationale-and-design paper does not report an analysis of 4,021 patients, deep-learning calcium scores, a graded association with events, median 25-month follow-up, or P < 0.001. Its planned primary endpoint also includes major procedural complications, which the cited sentence omits. (LLM, conf=0.87)
plaincorrelationaln = 4,021 ·- Asserted: passes — The authors put it forward as true.
- Checkable: passes — It can be checked against evidence.
- Load-bearing: passes — The paper’s conclusions depend on it.
- Based: passes — The paper gives a reason why it holds.
- Partly supported
The cited sources support only part of this claim — read each source’s verdict below.
In the paper
“Coronary artery calcium is an accurate predictor of cardiovascular events.”
- Also stated in: § Introduction · boosted
“One of the strongest known predictors for adverse cardiovascular events is coronary artery calcification, which can be quantified on computed tomography (CT)5,6.”
§ Deep convolutional neural networks to predict cardiovascular risk from computed tomography > Abstract
What the sources say
- Partly supportedcites [5] Agatston, A. S. et al. Quantification of coronary artery calcium using ultrafast computed tomography. J. Am. Coll. Cardiol. 15, 827–832 (1990). sourceExperimental — accuracy not yet measured
The Abstract reports that coronary calcium scores distinguished subjects with and without clinical coronary artery disease and gives predictive values for that diagnosis. It does not report whether calcium predicts subsequent cardiovascular events, which is the outcome claimed. (LLM, conf=0.87)
- Could not verifycites [6] Thanassoulis, G. et al. A genetic risk score is associated with incident cardiovascular disease and coronary artery calcium: the Framingham Heart Study. Circ. Cardiovasc. Genet. 5, 113–121 (2012). sourceExperimental — accuracy not yet measured
The Methods sections on coronary artery calcium measurements and statistical analysis describe measuring CAC and analysing it as an outcome. They do not assess how accurately CAC predicts subsequent cardiovascular events. Searches for CAC’s predictive value for future events found no passage in our copy establishing that claim. (LLM, conf=0.76)
boostedcorrelational- Asserted: passes — The authors put it forward as true.
- Checkable: passes — It can be checked against evidence.
- Load-bearing: passes — The paper’s conclusions depend on it.
- Based: passes — The paper gives a reason why it holds.
- Also stated in: § Introduction · boosted
The sources with a verdict support this claim; the rest weren’t checked yet, have no full text we could read, or their verdicts aren’t rated yet.
In the paper
“Persons with a calcium score of zero are at very low risk24, with increasing risk in the ordinal calcium score tiers identified by the deep learning system25–27.”
§ Deep convolutional neural networks to predict cardiovascular risk from computed tomography > Discussion
What the sources say
- Supportedcites [25] Hoffmann, U. et al. Cardiovascular event prediction and risk reclassification by coronary, aortic, and valvular calcification in the Framingham Heart Study. J. Am. Heart Assoc. 5, e003144 (2016). source
In Results, Table 2 reports increasing risk of major coronary heart disease and cardiovascular events across coronary calcium score categories of 0, 1–100, 101–300, and >300. The deep learning system identifies the tiers in the citing study; this source supports the attributed risk pattern, not the system itself. (LLM, conf=0.89)
- Not checked — no full text of the sourcecites [26] Budoff, M. J. et al. Ten-year association of coronary artery calcium with atherosclerotic cardiovascular disease (ASCVD) events: the multi-ethnic study of atherosclerosis (MESA). Eur. Heart J. 39, 2401–2408 (2018). source
- Supportedcites [27] Mitchell, J. D., Paisley, R., Moon, P., Novak, E. & Villines, T. C. Coronary artery calcium and long-term risk of death, myocardial iInfarction, and stroke: the Walter Reed Cohort Study. JACC Cardiovasc. Imaging 11, 1799–1806 (2018). source
The Results report that CAC score severity predicted adverse outcomes, and the Discussion shows increasing stroke risk across CAC tiers of 1–100, 101–400, and >400. The paper supports the risk gradient across score tiers; the deep-learning system is the citing authors’ description of how those tiers were identified, not a finding attributed to this source. (LLM, conf=0.92)
plaincorrelational- Asserted: passes — The authors put it forward as true.
- Checkable: passes — It can be checked against evidence.
- Load-bearing: passes — The paper’s conclusions depend on it.
- Based: passes — The paper gives a reason why it holds.
- Supported
The cited sources support only part of this claim — read each source’s verdict below.
In the paper
“A combined solution capable of analyzing cardiac and non-gated chest CT as presented in our investigation has only been proposed by de Vos et al.36 and van Velzen et al.41.”
§ Deep convolutional neural networks to predict cardiovascular risk from computed tomography > Discussion
What the sources say
- Supportedcites [36] de Vos, B. D. et al. Direct automatic coronary calcium scoring in cardiac and chest CT. IEEE Trans. Med. Imaging https://doi.org/10.1109/TMI.2019.2899534 (2019). source
The Conclusion (p. 11) identifies this paper’s method as an automatic calcium-scoring solution for both cardiac and chest CT. The Results table (p. 9) also reports evaluation using a combined cardiac-and-chest-CT training set, supporting the citation’s identification of de Vos et al. as an example of a combined solution. (LLM, conf=0.90)
- Partly supportedcites [41] van Velzen, S. G. M. et al. Deep learning for automatic calcium scoring in CT: validation using multiple cardiac CT and chest CT protocols. Radiology 295, 66–79 (2020). sourceExperimental — accuracy not yet measured
The title in our indexed copy identifies van Velzen et al. (Radiology, 2020, pp. 66–79) as a study of automatic calcium scoring across cardiac CT and chest CT protocols. The available passages do not specify that the chest CT was non-gated or establish the sentence’s “only” claim; searches for non-gated CT and a combined method found no further substantive passage. (LLM, conf=0.75)
plain- Asserted: passes — The authors put it forward as true.
- Checkable: passes — It can be checked against evidence.
- Load-bearing: passes — The paper’s conclusions depend on it.
- Based: passes — The paper gives a reason why it holds.
- Supported
The sources with a verdict support this claim; the rest weren’t checked yet, have no full text we could read, or their verdicts aren’t rated yet.
In the paper
“despite the fact that calcium scores on non-gated CT have reasonably good agreement with dedicated calcium scoring CT30,31.”
§ Deep convolutional neural networks to predict cardiovascular risk from computed tomography > Discussion
What the sources say
- Not checked — no full text of the sourcecites [30] Huang, Y.-L. et al. Reliable categorisation of visual scoring of coronary artery calcification on low-dose CT for lung cancer screening: validation with the standard Agatston score. Eur. Radiol. 23, 1226–1233 (2013). source
- Supportedcites [31] Budoff, M. J. et al. Coronary artery and thoracic calcium on noncontrast thoracic CT scans: comparison of ungated and gated examinations in patients from the COPD Gene cohort. J. Cardiovasc. Comput. Tomogr. 5, 113–118 (2011). source
The Results (CAC Variability; page not provided) report excellent correlation between ungated and gated coronary calcium scores and 95% agreement across score categories. The Discussion also calls agreement excellent, while noting that ungated scans tended to overestimate scores. (LLM, conf=0.94)
plaincorrelational- Asserted: passes — The authors put it forward as true.
- Checkable: passes — It can be checked against evidence.
- Load-bearing: passes — The paper’s conclusions depend on it.
- Based: passes — The paper gives a reason why it holds.
Every source the paper cites for this claim was checked and supports it.
In the paper
“In 441 patients who had ECG-gated cardiac CT at nine sites, there was a similar association between the deep learning calcium score and acute coronary syndrome at 28 days (Fig. 2c)20.”
§ Deep convolutional neural networks to predict cardiovascular risk from computed tomography > Results > Risk predictions in stable and acute chest pain patients
What the sources say
- Supportedcites [20] Hoffmann, U. et al. Design of the rule out myocardial ischemia/infarction using computer assisted tomography: a multicenter randomized comparative effectiveness trial of cardiac computed tomography versus alternative triage strategies in patients with acute chest pain in the emergency department. Am. Heart J. 163, 330–338, 338.e1 (2012). source
The citation identifies ROMICAT II as the trial supplying the cardiac CT data. The Study design and methods section describes enrollment at nine sites, and its Diagnostic testing subsection describes ECG-gated CT for coronary calcium; the Abstract specifies 28-day follow-up for missed acute coronary syndrome. The deep-learning association is the citing authors’ own result, directed to their Fig. 2c, rather than a finding attributed to this trial-design paper. Page numbers are not available in our copy. (LLM, conf=0.86)
plaincorrelationaln = 441- Asserted: passes — The authors put it forward as true.
- Checkable: passes — It can be checked against evidence.
- Load-bearing: passes — The paper’s conclusions depend on it.
- Based: passes — The paper gives a reason why it holds.
- Supported
The cited sources support only part of this claim — read each source’s verdict below.
In the paper
“Although other studies have investigated deep learning algorithms for automated coronary calcium quantification34–42, they used smaller cohorts or proprietary technologies.”
§ Deep convolutional neural networks to predict cardiovascular risk from computed tomography > Discussion
What the sources say
- Not checked — no full text of the sourcecites [34] Wolterink, J. M. et al. Automatic coronary artery calcium scoring in cardiac CT angiography using paired convolutional neural networks. Med. Image Anal. 34, 123–136 (2016). source
- Partly supportedcites [35] Lessmann, N. et al. Sex differences in coronary artery and thoracic aorta calcification and their association with cardiovascular mortality in heavy smokers. JACC Cardiovasc. Imaging https://doi.org/10.1016/j.jcmg.2018.10.026 (2019). sourceExperimental — accuracy not yet measured
The Image Analysis section says the study used automatic, in-house software with a deep-learning approach to score coronary calcification. The Statistical Analysis section reports 5,718 analyzed scans, but the paper does not establish that this cohort was smaller than the citing study’s or that the software was proprietary. (LLM, conf=0.84)
- Partly supportedcites [36] de Vos, B. D. et al. Direct automatic coronary calcium scoring in cardiac and chest CT. IEEE Trans. Med. Imaging https://doi.org/10.1109/TMI.2019.2899534 (2019). sourceExperimental — accuracy not yet measured
The Introduction (pp. 1–2) describes this paper’s use of deep learning for automatic coronary calcium scoring. The Data section (pp. 2–3) reports its cohort sizes, but our copy does not establish that they were smaller than the citing study’s cohort or that the method used proprietary technology. (LLM, conf=0.82)
- Partly supportedcites [37] Lessmann, N. et al. Automatic calcium scoring in low-dose chest CT using deep neural networks with dilated convolutions. IEEE Trans. Med. Imaging 37, 615–625 (2018). sourceExperimental — accuracy not yet measured
The abstract (p. 1) confirms that this paper studied automated coronary calcium scoring with convolutional neural networks, and the Dataset section (p. 2) reports 1,744 selected scans. Our copy does not establish that this cohort was smaller than the citing study’s or that the technology was proprietary; the Introduction (p. 2) instead describes this dataset as large relative to most earlier methods. (LLM, conf=0.78)
- Partly supportedcites [38] Huo, Y. et al. Coronary calcium detection using 3D attention identical dual deep network based on weakly supervised learning. Med. Imaging 2019: Image Processing https://doi.org/10.1117/12.2512541 (2019). sourceExperimental — accuracy not yet measured
The Abstract identifies this as a deep-learning study of coronary artery calcium detection using 5,075 CT scans. The Methods (Experiments) say its task was detecting the presence of calcium, not predicting a quantitative Agatston score. Our copy does not establish that its cohort was smaller than the citing study’s or that it used proprietary technology. (LLM, conf=0.87)
- Supportedcites [39] Santini, G. et al. An automatic deep learning approach for coronary artery calcium segmentation. EMBEC & NBC 2017 374–377 https://doi.org/10.1007/978-981-10-5122-7_94 (2018). source
The abstract (p. 1) describes a deep-learning system for automatic coronary calcium quantification. The Data description (p. 1) reports 152 exams, including 45 for training and 56 for testing, and the Discussion (p. 3) explicitly calls the training sample small. This supports the smaller-cohort alternative; the paper need not also use proprietary technology because the claim says “or.” (LLM, conf=0.88)
- Not checked — no full text of the sourcecites [40] Shadmi, R., Mazo, V., Bregman-Amitai, O. & Elnekave, E. Fully-convolutional deep-learning based system for coronary calcium score prediction from non-contrast chest CT. In 2018 IEEE 15th International Symposium on Biomedical Imaging (ISBI 2018) (Washington, DC, 2018). source
- Partly supportedcites [41] van Velzen, S. G. M. et al. Deep learning for automatic calcium scoring in CT: validation using multiple cardiac CT and chest CT protocols. Radiology 295, 66–79 (2020). sourceExperimental — accuracy not yet measured
The paper’s title and Abstract identify it as a study of deep-learning-based automatic calcium scoring in CT, supporting its inclusion among studies investigating automated coronary calcium quantification. The available passages do not establish that it used a smaller cohort or proprietary technology; searches for those comparisons found no matching passage. (LLM, conf=0.82)
- Supportedcites [42] Martin, S. S. et al. Evaluation of a deep learning–based automated CT coronary artery calcium scoring algorithm. JACC: Cardiovasc. Imaging 13, 524–526 (2020). source
The study describes evaluating a deep-learning algorithm for automated coronary artery calcium scoring in 511 patients. In its methods (page unavailable in our copy), it identifies the software as a Siemens Healthineers research prototype, supporting the citing sentence’s ‘proprietary technologies’ alternative; it need not also have used a smaller cohort. (LLM, conf=0.86)
plain- Asserted: passes — The authors put it forward as true.
- Checkable: passes — It can be checked against evidence.
- Load-bearing: passes — The paper’s conclusions depend on it.
- Based: passes — The paper gives a reason why it holds.
A result the paper reports from its own data — it cites no other source for it, so there is none to check. The quote shows it is in the paper.
In the paper
“HRs increase as the risk category increases.”
§ Deep convolutional neural networks to predict cardiovascular risk from computed tomography > Results > Risk predictions in stable and acute chest pain patients
plaindirectn = 441- Asserted: passes — The authors put it forward as true.
- Checkable: passes — It can be checked against evidence.
- Load-bearing: passes — The paper’s conclusions depend on it.
- Based: passes — The paper gives a reason why it holds.
- It may state two separate claims as one. 15
- Probably not a substantial claim. 30
The cited sources support only part of this claim — read each source’s verdict below.
In the paper
“Risk prediction was robust across multiple clinical scenarios, including a primary prevention asymptomatic setting with non-gated chest CT (NLST)18, as well as dedicated ECG-gated cardiac CT in stable (PROMISE)19 and acute (ROMICAT-II)20 chest pain setting.”
§ Deep convolutional neural networks to predict cardiovascular risk from computed tomography > Discussion
What the sources say
- Supportedcites [18] National Lung Screening Trial Research Team et al. Reduced lung-cancer mortality with low-dose computed tomographic screening. N. Engl. J. Med. 365, 395–409 (2011). source
Citation 18 identifies NLST as the screening-trial setting, rather than attributing the citing authors’ risk-prediction result to NLST. The Methods (Participants and Screening; page not provided) describe high-risk participants screened with low-dose chest CT. The paper does not explicitly call the scans non-gated, but its description is consistent with the cited identification. (LLM, conf=0.84)
- Supportedcites [19] Douglas, P. S. et al. PROspective multicenter imaging study for evaluation of chest pain: rationale and design of the PROMISE trial. Am. Heart J. 167, 796–803.e1 (2014). source
The PROMISE citation identifies the stable-chest-pain CT setting, rather than attributing the citing authors’ risk-prediction result to PROMISE. The Discussion (Summary and Significance; page not available) describes patients with stable symptoms, and the Methods (Diagnostic Testing Intervention; page not available) specifies coronary CT angiography as the anatomic test. (LLM, conf=0.88)
- Partly supportedcites [20] Hoffmann, U. et al. Design of the rule out myocardial ischemia/infarction using computer assisted tomography: a multicenter randomized comparative effectiveness trial of cardiac computed tomography versus alternative triage strategies in patients with acute chest pain in the emergency department. Am. Heart J. 163, 330–338, 338.e1 (2012). sourceExperimental — accuracy not yet measured
The Patient population and Diagnostic testing sections identify ROMICAT II as an acute chest-pain trial using ECG-gated cardiac CT. But the Conclusion says the trial’s results were still expected; this design paper does not establish that risk prediction was robust in that setting. The NLST and PROMISE settings are attached to other citations, not this one. (LLM, conf=0.86)
plaincorrelationaln = 19,421 ·- Asserted: passes — The authors put it forward as true.
- Checkable: passes — It can be checked against evidence.
- Load-bearing: passes — The paper’s conclusions depend on it.
- Based: passes — The paper gives a reason why it holds.
It may state two separate claims as one.
- Supported
The cited sources support only part of this claim — read each source’s verdict below.
In the paper
“Additionally, showing patients their coronary calcium provides a “teachable moment” to empower them to make informed, individualized decisions, and to improve long-term compliance for preventative therapy and lifestyle changes including smoking cessation11,12.”
§ Deep convolutional neural networks to predict cardiovascular risk from computed tomography > Introduction
What the sources say
- Partly supportedcites [11] Ravenel, J. G. & Nance, J. W. Coronary artery calcification in lung cancer screening. Transl. Lung Cancer Res. 7, 361–367 (2018). sourceExperimental — accuracy not yet measured
The Introduction describes coronary-risk counselling as a teachable moment that can lead to lifestyle changes or improved pharmacological management. The Conclusions and recommendations also call for discussing CT findings with patients. Neither passage establishes that showing patients their calcium improves long-term adherence to preventive therapy or smoking cessation. (LLM, conf=0.87)
- Partly supportedcites [12] Gupta, A. et al. The identification of calcified coronary plaque is associated with initiation and continuation of pharmacological and lifestyle preventive therapies: a systematic review and meta-analysis. JACC Cardiovasc. Imaging 10, 833–842 (2017). sourceExperimental — accuracy not yet measured
The Results (Characteristics of Included Studies; page not provided) say some studies showed patients their CAC images while explaining their heart-disease risk. The Results (Lifestyle Interventions and Continuation of Preventive Pharmacological Therapy; pages not provided) report greater exercise and dietary change and greater continuation of lipid-lowering medication with nonzero CAC, but no significant effect on smoking cessation. The paper does not establish that showing images itself improved long-term compliance or empowered individualized decisions. (LLM, conf=0.88)
plaindirect- Asserted: passes — The authors put it forward as true.
- Checkable: passes — It can be checked against evidence.
- Load-bearing: fails — The paper’s conclusions may not depend on it.
- Based: passes — The paper gives a reason why it holds.
Probably not a substantial claim. The paper’s conclusions may not depend on it. It may state two separate claims as one.
- Partly supported
The cited sources support only part of this claim — read each source’s verdict below.
In the paper
“The CT coronary calcium score is a measure of the burden of coronary atherosclerosis and is one of the most widely accepted measures of cardiovascular risk5,6.”
§ Deep convolutional neural networks to predict cardiovascular risk from computed tomography > Introduction
What the sources say
- Partly supportedcites [5] Agatston, A. S. et al. Quantification of coronary artery calcium using ultrafast computed tomography. J. Am. Coll. Cardiol. 15, 827–832 (1990). sourceExperimental — accuracy not yet measured
The Abstract describes a CT calcium score that quantifies coronary calcification and reports higher scores in subjects with clinical coronary artery disease, supporting its relevance to coronary disease. It does not establish that the score measures the full burden of coronary atherosclerosis or that it is one of the most widely accepted measures of cardiovascular risk. (LLM, conf=0.85)
- Partly supportedcites [6] Thanassoulis, G. et al. A genetic risk score is associated with incident cardiovascular disease and coronary artery calcium: the Framingham Heart Study. Circ. Cardiovasc. Genet. 5, 113–121 (2012). sourceExperimental — accuracy not yet measured
The Introduction (page unavailable) calls coronary artery calcium a measure of subclinical atherosclerosis, and Methods describes quantifying it by CT. The paper does not establish the further claim that the calcium score is one of the most widely accepted measures of cardiovascular risk. (LLM, conf=0.84)
plaincorrelational- Asserted: passes — The authors put it forward as true.
- Checkable: passes — It can be checked against evidence.
- Load-bearing: passes — The paper’s conclusions depend on it.
- Based: passes — The paper gives a reason why it holds.
Probably not a substantial claim. It may state two separate claims as one.
- Partly supported
The cited sources support only part of this claim — read each source’s verdict below.
In the paper
“Especially in medical imaging there is a large potential as deep learning can successfully be used for identifying and segmenting objects within the 3-dimensional (3D) image space13–16.”
§ Deep convolutional neural networks to predict cardiovascular risk from computed tomography > Introduction
What the sources say
- Supportedcites [13] Hosny, A., Parmar, C., Quackenbush, J., Schwartz, L. H. & Aerts, H. J. W. L. Artificial intelligence in radiology. Nat. Rev. Cancer 18, 500–510 (2018). source
The ‘AI in medical imaging’ section reports that deep learning can identify diseased tissues and has performed on par with radiologists in detection and segmentation tasks. The ‘Characterization’ section describes successful deep-learning segmentation across MRI and CT imaging, while ‘AI challenges in medical imaging’ describes recognizing body parts in CT and MRI volumes. Together, these support the paraphrase about identifying and segmenting structures in 3D medical imaging. (LLM, conf=0.87)
- Supportedcites [14] De Fauw, J. et al. Clinically applicable deep learning for diagnosis and referral in retinal disease. Nat. Med. 24, 1342–1350 (2018). source
The Clinical Application & AI architecture section (p. 2) describes a 3D deep-learning network that segments retinal OCT scans into 15 classes, including anatomy and pathology. The Discussion (p. 8) says the study applied 3D models to segment diagnostically relevant tissue types. This supports the cited claim in the medical-imaging context. (LLM, conf=0.92)
- Partly supportedcites [15] Hosny, A. et al. Deep learning for lung cancer prognostication: a retrospective multi-cohort radiomics study. PLoS Med. 15, e1002711 (2018). sourceExperimental — accuracy not yet measured
The Introduction (page unavailable) says CNNs have shown potential in detection and segmentation, but notes that most work addressed 2D problems and only a few studies used entire 3D tumor volumes. This study’s Methods and Results (pages unavailable) describe manually contoured tumors and a 3D network trained to predict survival, not to identify or segment objects in 3D. The source therefore supports the general imaging applications, but not the specific 3D identification-and-segmentation claim. (LLM, conf=0.88)
- Supportedcites [16] Litjens, G. et al. A survey on deep learning in medical image analysis. Med. Image Anal. 42, 60–88 (2017). source
Section 3.2.1 (p. 10) describes deep-learning methods that identify landmarks and localize anatomical regions in 3D medical images. Section 3.3.1 (p. 12) reports 3D neural networks used to segment vertebrae and multiple torso structures, supporting the segmentation part of the claim. (LLM, conf=0.92)
plaindirect- Asserted: passes — The authors put it forward as true.
- Checkable: passes — It can be checked against evidence.
- Load-bearing: passes — The paper’s conclusions depend on it.
- Based: passes — The paper gives a reason why it holds.
Probably not a substantial claim.
- Supported
The cited sources support only part of this claim — read each source’s verdict below.
In the paper
“As our deep learning system does not require human input, this makes it an ‘end-to-end’ solution for accurate and time-efficient cardiovascular risk assessment in clinical settings32,33.”
§ Deep convolutional neural networks to predict cardiovascular risk from computed tomography > Discussion
What the sources say
- Partly supportedcites [32] Takx, R. A. P. et al. Quantification of coronary artery calcium in nongated CT to predict cardiovascular events in male lung cancer screening participants: results of the NELSON study. J. Cardiovasc. Comput. Tomogr. 9, 50–57 (2015). sourceExperimental — accuracy not yet measured
The Conclusions report that CT-derived calcium scores accurately predicted cardiovascular events in male smokers without a CVD history, supporting the risk-assessment rationale. The paper does not establish time efficiency or clinical performance for the citing authors’ deep learning system. Its own automated measurements were visually checked and manually corrected when needed (Imaging predictors, §2.3). (LLM, conf=0.84)
- Partly supportedcites [33] Chiles, C. et al. Association of coronary artery calcification and mortality in the national lung screening trial: a comparison of three scoring methods. Radiology 276, 82 (2015). sourceExperimental — accuracy not yet measured
The Discussion (page not provided) reports that visual CAC assessment stratified cardiac risk and was faster and simpler than the other methods studied. But the method required radiologists; this paper does not establish that a deep learning system needs no human input or provides an end-to-end clinical solution. (LLM, conf=0.84)
plaindirect- Asserted: passes — The authors put it forward as true.
- Checkable: passes — It can be checked against evidence.
- Load-bearing: passes — The paper’s conclusions depend on it.
- Based: passes — The paper gives a reason why it holds.
It may state two separate claims as one.
- Rests on an assumption: Deep learning can automate complex assessments that previously could only be done by radiologists, at a scale with higher speed and lower cost.
- Partly supported
The cited sources support only part of this claim — read each source’s verdict below.
In the paper
“Despite these recommendations, a dedicated coronary calcium scoring CT is not yet covered by Medicare and most US insurance companies, and for this reason, there is a great deal of interest in deriving the calcium score from routine chest CTs, which are far more common8,28,29.”
§ Deep convolutional neural networks to predict cardiovascular risk from computed tomography > Discussion
What the sources say
- Not checked — no full text of the sourcecites [8] Hecht, H. S. et al. 2016 SCCT/STR guidelines for coronary artery calcium scoring of noncontrast noncardiac chest CT scans: a report of the Society of Cardiovascular Computed Tomography and Society of Thoracic Radiology. J. Thorac. Imaging 32, W54–W66 (2017). source
- Not checked — no full text of the sourcecites [28] Hecht, H. S. Coronary artery calcium analysis and reporting on noncontrast chest CT scans: a paradigm shift in prevention. Curr. Cardiovasc. Imaging Reports 9 (2016). source
- Partly supportedcites [29] Lu, M. T. et al. Lung cancer screening eligibility in the community: cardiovascular risk factors, coronary artery calcification, and cardiovascular events. Circulation 134, 897–899 (2016). sourceExperimental — accuracy not yet measured
In the main text (page unavailable), the paper supports assessing and reporting coronary artery calcium on lung cancer screening CT. It does not say that routine chest CTs are far more common, or that their frequency is the reason for interest in deriving calcium scores from them. (LLM, conf=0.84)
boosted- Asserted: passes — The authors put it forward as true.
- Checkable: passes — It can be checked against evidence.
- Load-bearing: passes — The paper’s conclusions depend on it.
- Based: passes — The paper gives a reason why it holds.
Probably not a substantial claim.
The cited sources that could be checked couldn’t confirm or dispute this claim.
In the paper
“In symptomatic patients, the presence of coronary calcium is associated with future cardiovascular events in the stable chest pain setting9”
§ Deep convolutional neural networks to predict cardiovascular risk from computed tomography > Introduction
What the sources say
- Could not verifycites [9] Patel, M. R. et al. Correction to: ACC/AATS/AHA/ASE/ASNC/SCAI/SCCT/STS 2017 appropriate use criteria for coronary revascularization in patients with stable ischemic heart disease. J. Nucl. Cardiol. 25, 2191–2192 (2018). sourceExperimental — accuracy not yet measured
The correction (pp. 2191–2192) addresses iFR, FFR, and coronary pressure measurements, not coronary calcium. Searches for calcium and future cardiovascular events in symptomatic patients with stable chest pain found no passage addressing the claimed association. (LLM, conf=0.76)
plaincorrelational- Asserted: passes — The authors put it forward as true.
- Checkable: passes — It can be checked against evidence.
- Load-bearing: fails — The paper’s conclusions may not depend on it.
- Based: passes — The paper gives a reason why it holds.
Probably not a substantial claim. The paper’s conclusions may not depend on it.
- Could not verify
The cited sources support only part of this claim — read each source’s verdict below.
In the paper
“The majority of FHS (100%)44, NLST (91%)18, PROMISE (77%)45, and ROMICAT-II (66%)46 participants were non-Hispanic whites.”
§ Deep convolutional neural networks to predict cardiovascular risk from computed tomography > Discussion
What the sources say
- Partly supportedcites [44] Tsao, C. W. & Vasan, R. S. Cohort profile: the Framingham Heart Study (FHS): overview of milestones in cardiovascular epidemiology. Int. J. Epidemiol. 44, 1800–1813 (2015). sourceExperimental — accuracy not yet measured
In “Description of the FHS” (Table 1; page not provided), the paper lists 100% European ancestry for the Original and Offspring cohorts, not for FHS participants as a whole. The same section describes the racially and ethnically diverse OMNI cohorts, while “Strengths and weaknesses” characterizes FHS participants as predominantly White, with an exception for OMNI. The paper therefore supports a White majority but not the claim that 100% of all FHS participants were non-Hispanic White. (LLM, conf=0.90)
- Could not verifycites [18] National Lung Screening Trial Research Team et al. Reduced lung-cancer mortality with low-dose computed tomographic screening. N. Engl. J. Med. 365, 395–409 (2011). sourceExperimental — accuracy not yet measured
The Results section, “Characteristics of the Participants” (page unavailable), refers to demographic characteristics in Table 1, but the passages in our copy do not give the proportion of NLST participants who were non-Hispanic white. Searches for race, ethnicity, and 91% did not locate that figure. The other trials have separate citations and are not attributed to this source. (LLM, conf=0.70)
- Supportedcites [45] Douglas, P. S. et al. Outcomes of anatomical versus functional testing for coronary artery disease. N. Engl. J. Med. 372, 1291–1300 (2015). source
The citation to this paper is attached to the PROMISE figure, not the figures for the other studies. In Results > Characteristics at Baseline (page not provided), 22.6% of PROMISE participants with race or ethnicity data belonged to a racial or ethnic minority group; the complement is 77.4%, consistent with the cited 77% non-Hispanic white figure. (LLM, conf=0.88)
plain- Asserted: passes — The authors put it forward as true.
- Checkable: passes — It can be checked against evidence.
- Load-bearing: unclear — It is unclear whether the paper’s conclusions depend on it.
- Based: passes — The paper gives a reason why it holds.
It may state two separate claims as one.
- Partly supported
The cited sources support only part of this claim — read each source’s verdict below.
In the paper
“The CAC score was measured manually by expert readers using the method by Agatston and Janowitz5,6 on dedicated workstations, as reported in the parent FHS17, PROMISE19, and ROMICAT-II20 studies.”
§ Deep convolutional neural networks to predict cardiovascular risk from computed tomography > Methods > Manual calcium score assessment
What the sources say
- Supportedcites [5] Agatston, A. S. et al. Quantification of coronary artery calcium using ultrafast computed tomography. J. Am. Coll. Cardiol. 15, 827–832 (1990). source
The citation to Agatston and Janowitz identifies the CAC scoring method, not the readers, workstations, or procedures in the parent studies. The Abstract describes calculating total calcium scores from the number, area, and peak CT density of calcific lesions, supporting that identification. (LLM, conf=0.92)
- Supportedcites [6] Thanassoulis, G. et al. A genetic risk score is associated with incident cardiovascular disease and coronary artery calcium: the Framingham Heart Study. Circ. Cardiovasc. Genet. 5, 113–121 (2012). source
The Methods section, under Coronary Artery Calcium Measurements, says that an experienced reader evaluated each FHS scan on a dedicated off-line workstation and that an Agatston score was calculated. This source is cited for the FHS study, not for the PROMISE or ROMICAT-II methods. (LLM, conf=0.92)
- Could not verifycites [17] D’Agostino, R. B. et al. General cardiovascular risk profile for use in primary care: the Framingham Heart Study. Circulation 117, 743–753 (2008). sourceExperimental — accuracy not yet measured
The Measurement of CVD Risk Factors section describes blood pressure, cholesterol, smoking, and diabetes measurements, but not CAC scoring. Searches for Agatston and Janowitz, expert readers, dedicated workstations, PROMISE, and ROMICAT-II found no passage addressing the claimed measurement method. Page numbers were not available for these passages. (LLM, conf=0.76)
plain- Asserted: passes — The authors put it forward as true.
- Checkable: passes — It can be checked against evidence.
- Load-bearing: passes — The paper’s conclusions depend on it.
- Based: passes — The paper gives a reason why it holds.
Probably not a substantial claim.
- Supported
The cited sources that could be checked couldn’t confirm or dispute this claim.
In the paper
“In NLST18, the coronary calcium score was measured manually in 396 randomly selected participants using 3D Slicer (V4).”
§ Deep convolutional neural networks to predict cardiovascular risk from computed tomography > Methods > Manual calcium score assessment
What the sources say
- Could not verifycites [18] National Lung Screening Trial Research Team et al. Reduced lung-cancer mortality with low-dose computed tomographic screening. N. Engl. J. Med. 365, 395–409 (2011). sourceExperimental — accuracy not yet measured
The Methods > Screening passages describe NLST lung-cancer screening and CT image interpretation, but do not address coronary calcium scoring. Searches for “396,” “coronary calcium score,” and “3D Slicer (V4)” found no passage documenting the claimed participant selection, manual measurement, or software. (LLM, conf=0.76)
plainn = 396- Asserted: passes — The authors put it forward as true.
- Checkable: passes — It can be checked against evidence.
- Load-bearing: fails — The paper’s conclusions may not depend on it.
- Based: passes — The paper gives a reason why it holds.
Probably not a substantial claim. The paper’s conclusions may not depend on it.
- Could not verify
The paper states this without a source or data behind it here, so there is nothing to check it against. The quote shows it is in the paper.
In the paper
“We also share our deep learning system, including the trained models, with the community, without restrictions.”
§ Deep convolutional neural networks to predict cardiovascular risk from computed tomography > Discussion
plain- Asserted: passes — The authors put it forward as true.
- Checkable: passes — It can be checked against evidence.
- Load-bearing: fails — The paper’s conclusions may not depend on it.
- Based: passes — The paper gives a reason why it holds.
Probably not a substantial claim. The paper’s conclusions may not depend on it.
A result the paper reports from its own data — it cites no other source for it, so there is none to check. The quote shows it is in the paper.
In the paper
“The system calculates the calcium score in under 2 s, without human input.”
§ Deep convolutional neural networks to predict cardiovascular risk from computed tomography > Discussion
plain- Asserted: passes — The authors put it forward as true.
- Checkable: passes — It can be checked against evidence.
- Load-bearing: passes — The paper’s conclusions depend on it.
- Based: passes — The paper gives a reason why it holds.
It may state two separate claims as one.
A result the paper reports from its own data — it cites no other source for it, so there is none to check. The quote shows it is in the paper.
In the paper
“The system could analyze each image on an average of 1.938 s per scan on a graphics processing unit (GPU) system.”
§ Deep convolutional neural networks to predict cardiovascular risk from computed tomography > Results > Development of the deep learning system
hedged- Asserted: passes — The authors put it forward as true.
- Checkable: passes — It can be checked against evidence.
- Load-bearing: fails — The paper’s conclusions may not depend on it.
- Based: passes — The paper gives a reason why it holds.
Probably not a substantial claim. The paper’s conclusions may not depend on it.
A result the paper reports from its own data — it cites no other source for it, so there is none to check. The quote shows it is in the paper.
In the paper
“Extensive testing of several cube sizes showed the chosen size worked best as larger cubes increased the training time while the accuracy stayed the same.”
§ Deep convolutional neural networks to predict cardiovascular risk from computed tomography > Methods > Deep learning-based coronary calcium segmentation
plaindirect- Asserted: passes — The authors put it forward as true.
- Checkable: passes — It can be checked against evidence.
- Load-bearing: fails — The paper’s conclusions may not depend on it.
- Based: passes — The paper gives a reason why it holds.
Probably not a substantial claim. The paper’s conclusions may not depend on it. It may state two separate claims as one.
A result the paper reports from its own data — it cites no other source for it, so there is none to check. The quote shows it is in the paper.
In the paper
“In a few instances, inaccurate heart segmentation led to coronary calcium being outside the ROI of the calcium segmentation network and hence being missed.”
§ Deep convolutional neural networks to predict cardiovascular risk from computed tomography > Methods > Technical evaluation
plaindirect- Asserted: passes — The authors put it forward as true.
- Checkable: passes — It can be checked against evidence.
- Load-bearing: fails — The paper’s conclusions may not depend on it.
- Based: passes — The paper gives a reason why it holds.
Probably not a substantial claim. The paper’s conclusions may not depend on it.
A result the paper reports from its own data — it cites no other source for it, so there is none to check. The quote shows it is in the paper.
In the paper
“On average, the deep learning system assessed the CAC score in under two seconds per scan.”
§ Deep convolutional neural networks to predict cardiovascular risk from computed tomography > Methods > Technical evaluation
plain- Asserted: passes — The authors put it forward as true.
- Checkable: passes — It can be checked against evidence.
- Load-bearing: fails — The paper’s conclusions may not depend on it.
- Based: passes — The paper gives a reason why it holds.
Probably not a substantial claim. The paper’s conclusions may not depend on it.
A conclusion the paper draws from its own results — it cites no other source for it, so there is none to check. The quote shows it is in the paper.
In the paper
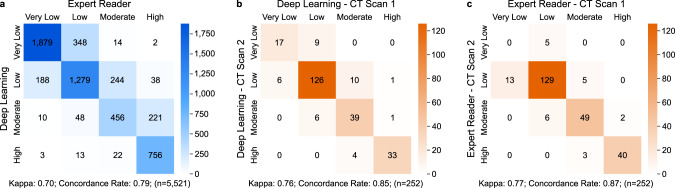
“The deep learning calcium score in 5521 participants had high correlation with human expert readers and demonstrated robust test–retest reliability.”
§ Deep convolutional neural networks to predict cardiovascular risk from computed tomography > Discussion
boostedcorrelationaln = 5,521- Asserted: passes — The authors put it forward as true.
- Checkable: passes — It can be checked against evidence.
- Load-bearing: passes — The paper’s conclusions depend on it.
- Based: passes — The paper gives a reason why it holds.
It may state two separate claims as one.
What the paper did — it cites no source for this, so there is none to check. The quote shows it is in the paper.
In the paper
“The performance of the deep learning system was tested by reviewing CT scans with discordances between the manual and deep learning coronary calcium categories (Supplementary Fig. 7).”
§ Deep convolutional neural networks to predict cardiovascular risk from computed tomography > Methods > Technical evaluation
plain- Asserted: passes — The authors put it forward as true.
- Checkable: passes — It can be checked against evidence.
- Load-bearing: fails — The paper’s conclusions may not depend on it.
- Based: passes — The paper gives a reason why it holds.
Probably not a substantial claim. The paper’s conclusions may not depend on it.
What the paper did — it cites no source for this, so there is none to check. The quote shows it is in the paper.
In the paper
“This study was a retrospective secondary analysis of a longitudinal primary prevention cohort (FHS-CT1 and FHS-CT2) and three randomized clinical trials (NLST, PROMISE, ROMICAT–II).”
§ Deep convolutional neural networks to predict cardiovascular risk from computed tomography > Methods > Study population
plain- Asserted: passes — The authors put it forward as true.
- Checkable: passes — It can be checked against evidence.
- Load-bearing: passes — The paper’s conclusions depend on it.
- Based: passes — The paper gives a reason why it holds.
It may state two separate claims as one.
A conclusion the paper draws from its own results — it cites no other source for it, so there is none to check. The quote shows it is in the paper.
In the paper
“Automated quantification of coronary calcium has the potential to improve clinical routine and population health.”
§ Deep convolutional neural networks to predict cardiovascular risk from computed tomography > Discussion
hedgedconditional- Asserted: passes — The authors put it forward as true.
- Checkable: fails — It may be too vague to check against evidence.
- Load-bearing: passes — The paper’s conclusions depend on it.
- Based: passes — The paper gives a reason why it holds.
Probably not a substantial claim. It may be too vague to check against evidence.
What the paper did — it cites no source for this, so there is none to check. The quote shows it is in the paper.
In the paper
“Coronary calcium, if present, was manually segmented by experienced readers in all subjects.”
§ Deep convolutional neural networks to predict cardiovascular risk from computed tomography > Methods > Deep learning-based coronary calcium segmentation
plain- Asserted: passes — The authors put it forward as true.
- Checkable: passes — It can be checked against evidence.
- Load-bearing: passes — The paper’s conclusions depend on it.
- Based: passes — The paper gives a reason why it holds.
Probably not a substantial claim.
A conclusion the paper draws from its own results — it cites no other source for it, so there is none to check. The quote shows it is in the paper.
In the paper
“Furthermore, we demonstrate strong robustness of the system by a high correlation with manual scoring in 5521 subjects and high test–retest reliability in data from 252 individuals.”
§ Deep convolutional neural networks to predict cardiovascular risk from computed tomography > Discussion
boostedcorrelationaln = 5,521- Asserted: passes — The authors put it forward as true.
- Checkable: passes — It can be checked against evidence.
- Load-bearing: passes — The paper’s conclusions depend on it.
- Based: passes — The paper gives a reason why it holds.
It may state two separate claims as one.
What the paper did — it cites no source for this, so there is none to check. The quote shows it is in the paper.
In the paper
“While the FHS-CT1 training cohort included only diagnostic-quality CTs, the FHS-CT2 testing cohort included all CTs including those initially considered non-diagnostic (Supplementary Fig. 1b).”
§ Deep convolutional neural networks to predict cardiovascular risk from computed tomography > Methods > Study population
plainn = 663- Asserted: passes — The authors put it forward as true.
- Checkable: passes — It can be checked against evidence.
- Load-bearing: passes — The paper’s conclusions depend on it.
- Based: passes — The paper gives a reason why it holds.
It may state two separate claims as one.
What the paper did — it cites no source for this, so there is none to check. The quote shows it is in the paper.
In the paper
“Although several hundred more CT scans from subjects with no coronary calcium were available, we chose to exclude them to keep the imbalance between subjects with and without coronary calcium small.”
§ Deep convolutional neural networks to predict cardiovascular risk from computed tomography > Methods > Deep learning-based coronary calcium segmentation
plaindirect- Asserted: passes — The authors put it forward as true.
- Checkable: passes — It can be checked against evidence.
- Load-bearing: passes — The paper’s conclusions depend on it.
- Based: passes — The paper gives a reason why it holds.
Probably not a substantial claim.
What the paper did — it cites no source for this, so there is none to check. The quote shows it is in the paper.
In the paper
“The cohort for training and tuning the three deep learning models consisted of 1636 CT scans: 623 CT scans were from subjects with coronary calcium and 1013 CT scans from subjects with no coronary calcium.”
§ Deep convolutional neural networks to predict cardiovascular risk from computed tomography > Methods > Deep learning-based coronary calcium segmentation
plainn = 1,013- Asserted: passes — The authors put it forward as true.
- Checkable: passes — It can be checked against evidence.
- Load-bearing: passes — The paper’s conclusions depend on it.
- Based: passes — The paper gives a reason why it holds.
Probably not a substantial claim. It may state two separate claims as one.
In the paper
“low likelihood of acute coronary syndrome in patients with acute chest pain10.”
§ Deep convolutional neural networks to predict cardiovascular risk from computed tomography > Introduction
What the sources say
- Not checked — no full text of the sourcecites [10] Raff, G. L. et al. SCCT guidelines on the use of coronary computed tomographic angiography for patients presenting with acute chest pain to the emergency department: a report of the Society of Cardiovascular Computed Tomography Guidelines Committee. J. Cardiovasc. Comput. Tomogr. 8, 254–271 (2014). source
plaincorrelational- Asserted: passes — The authors put it forward as true.
- Checkable: passes — It can be checked against evidence.
- Load-bearing: fails — The paper’s conclusions may not depend on it.
- Based: passes — The paper gives a reason why it holds.
Probably not a substantial claim. The paper’s conclusions may not depend on it.
What the paper did — it cites no source for this, so there is none to check. The quote shows it is in the paper.
In the paper
“Manually calculated calcium scores from expert readers were available for 5521 subjects and manually segmented hearts for 895 subjects.”
§ Deep convolutional neural networks to predict cardiovascular risk from computed tomography > Methods > Deep learning-based coronary calcium segmentation
plainn = 5,521- Asserted: passes — The authors put it forward as true.
- Checkable: passes — It can be checked against evidence.
- Load-bearing: fails — The paper’s conclusions may not depend on it.
- Based: passes — The paper gives a reason why it holds.
Probably not a substantial claim. The paper’s conclusions may not depend on it. It may state two separate claims as one.
In the paper
“Based on the 2018 ACC/AHA guidelines7, in persons at intermediate risk (defined as ≥7.5% to <19.9% 10-year risk of cardiovascular events based on risk factors), a calcium score of 0 indicates very low risk and unlikely benefit from statin therapy”
§ Deep convolutional neural networks to predict cardiovascular risk from computed tomography > Discussion
What the sources say
- Not checked — no full text of the sourcecites [7] Grundy, S. M. et al. 2018 AHA/ACC/AACVPR/AAPA/ABC/ACPM/ADA/AGS/APhA/ASPC/NLA/PCNA guideline on the management of blood cholesterol: executive summary. J. Am. Coll. Cardiol. 73, 3168–3209 (2019). source
hedged- Asserted: passes — The authors put it forward as true.
- Checkable: passes — It can be checked against evidence.
- Load-bearing: fails — The paper’s conclusions may not depend on it.
- Based: passes — The paper gives a reason why it holds.
Probably not a substantial claim. The paper’s conclusions may not depend on it.
What the paper did — it cites no source for this, so there is none to check. The quote shows it is in the paper.
In the paper
“To verify the results of our deep learning system in this cohort, a subset of randomly chosen 396 subjects were segmented by expert readers.”
§ Deep convolutional neural networks to predict cardiovascular risk from computed tomography > Methods > Study population
plainn = 396- Asserted: passes — The authors put it forward as true.
- Checkable: passes — It can be checked against evidence.
- Load-bearing: passes — The paper’s conclusions depend on it.
- Based: passes — The paper gives a reason why it holds.
Probably not a substantial claim.
What the paper did — it cites no source for this, so there is none to check. The quote shows it is in the paper.
In the paper
“Overall, we included over 20,000 persons drawn from over 200 sites.”
§ Deep convolutional neural networks to predict cardiovascular risk from computed tomography > Discussion
plainn = 20,000- Asserted: passes — The authors put it forward as true.
- Checkable: passes — It can be checked against evidence.
- Load-bearing: passes — The paper’s conclusions depend on it.
- Based: passes — The paper gives a reason why it holds.
It may state two separate claims as one.
What the paper did — it cites no source for this, so there is none to check. The quote shows it is in the paper.
In the paper
“All subjects were segmented by expert readers.”
- Also stated in: § Study population · plain
“All subjects were segmented by expert readers.”
§ Deep convolutional neural networks to predict cardiovascular risk from computed tomography > Methods > Study population
plain- Asserted: passes — The authors put it forward as true.
- Checkable: passes — It can be checked against evidence.
- Load-bearing: fails — The paper’s conclusions may not depend on it.
- Based: passes — The paper gives a reason why it holds.
Probably not a substantial claim. The paper’s conclusions may not depend on it.
- Also stated in: § Study population · plain
What the paper did — it cites no source for this, so there is none to check. The quote shows it is in the paper.
In the paper
“Furthermore, the heart was manually segmented in a subset of 129 randomly selected subjects of the training cohort.”
§ Deep convolutional neural networks to predict cardiovascular risk from computed tomography > Methods > Deep learning-based coronary calcium segmentation
plainn = 129- Asserted: passes — The authors put it forward as true.
- Checkable: passes — It can be checked against evidence.
- Load-bearing: fails — The paper’s conclusions may not depend on it.
- Based: passes — The paper gives a reason why it holds.
Probably not a substantial claim. The paper’s conclusions may not depend on it.
In the paper
“while a high calcium score (≥100 or ≥75th centile for age/sex) indicates that a statin should be considered7.”
§ Deep convolutional neural networks to predict cardiovascular risk from computed tomography > Discussion
What the sources say
- Not checked — no full text of the sourcecites [7] Grundy, S. M. et al. 2018 AHA/ACC/AACVPR/AAPA/ABC/ACPM/ADA/AGS/APhA/ASPC/NLA/PCNA guideline on the management of blood cholesterol: executive summary. J. Am. Coll. Cardiol. 73, 3168–3209 (2019). source
hedgedconditional- Asserted: passes — The authors put it forward as true.
- Checkable: passes — It can be checked against evidence.
- Load-bearing: fails — The paper’s conclusions may not depend on it.
- Based: passes — The paper gives a reason why it holds.
Probably not a substantial claim. The paper’s conclusions may not depend on it.
In the paper
“Although the manual calcium score has proven to be an important predictor of cardiovascular events across race and ethnicities, generalizability to other demographics will need to be investigated in future studies47.”
§ Deep convolutional neural networks to predict cardiovascular risk from computed tomography > Discussion
What the sources say
- Not checked — no full text of the sourcecites [47] Detrano, R. et al. Coronary calcium as a predictor of coronary events in four racial or ethnic groups. N. Engl. J. Med. 358, 1336–1345 (2008). source
boostedcorrelational- Asserted: passes — The authors put it forward as true.
- Checkable: passes — It can be checked against evidence.
- Load-bearing: fails — The paper’s conclusions may not depend on it.
- Based: passes — The paper gives a reason why it holds.
Probably not a substantial claim. The paper’s conclusions may not depend on it.
A claim is checked only against the cited paper’s full text, never its abstract, and none is available for its sources.
In the paper
“Coronary calcium scoring has been recommended by the guidelines for risk stratification, specifically in the setting of primary prevention in asymptomatic individuals7,8.”
§ Deep convolutional neural networks to predict cardiovascular risk from computed tomography > Introduction
What the sources say
- Not checked — no full text of the sourcecites [7] Grundy, S. M. et al. 2018 AHA/ACC/AACVPR/AAPA/ABC/ACPM/ADA/AGS/APhA/ASPC/NLA/PCNA guideline on the management of blood cholesterol: executive summary. J. Am. Coll. Cardiol. 73, 3168–3209 (2019). source
- Not checked — no full text of the sourcecites [8] Hecht, H. S. et al. 2016 SCCT/STR guidelines for coronary artery calcium scoring of noncontrast noncardiac chest CT scans: a report of the Society of Cardiovascular Computed Tomography and Society of Thoracic Radiology. J. Thorac. Imaging 32, W54–W66 (2017). source
plain- Asserted: passes — The authors put it forward as true.
- Checkable: passes — It can be checked against evidence.
- Load-bearing: fails — The paper’s conclusions may not depend on it.
- Based: passes — The paper gives a reason why it holds.
Probably not a substantial claim. The paper’s conclusions may not depend on it.
A conclusion the paper draws from its own results — it cites no other source for it, so there is none to check. The quote shows it is in the paper.
In the paper
“The benefit of our 3D heart segmentation step is not to find a rectangular ROI, but to narrow the region for coronary calcium segmentation to the heart itself.”
§ Deep convolutional neural networks to predict cardiovascular risk from computed tomography > Discussion
plaindirect- Asserted: passes — The authors put it forward as true.
- Checkable: passes — It can be checked against evidence.
- Load-bearing: passes — The paper’s conclusions depend on it.
- Based: passes — The paper gives a reason why it holds.
Probably not a substantial claim.
What the paper did — it cites no source for this, so there is none to check. The quote shows it is in the paper.
In the paper
“In FHS-CT1, 252 participants underwent cardiac ECG-gated CT twice within 1 h to assess test–retest reliability.”
§ Deep convolutional neural networks to predict cardiovascular risk from computed tomography > Methods > Test–Retest analysis
plainn = 252- Asserted: passes — The authors put it forward as true.
- Checkable: passes — It can be checked against evidence.
- Load-bearing: passes — The paper’s conclusions depend on it.
- Based: passes — The paper gives a reason why it holds.
Probably not a substantial claim.
What the paper did — it cites no source for this, so there is none to check. The quote shows it is in the paper.
In the paper
“The deep learning system and the human readers quantified calcium on both scans to assess test–retest reliability.”
§ Deep convolutional neural networks to predict cardiovascular risk from computed tomography > Methods > Test–Retest analysis
plainn = 252- Asserted: passes — The authors put it forward as true.
- Checkable: passes — It can be checked against evidence.
- Load-bearing: passes — The paper’s conclusions depend on it.
- Based: passes — The paper gives a reason why it holds.
Probably not a substantial claim.
What the paper did — it cites no source for this, so there is none to check. The quote shows it is in the paper.
In the paper
“one unadjusted model, one model adjusted for age and sex, and a third model in which we additionally adjusted for standard cardiovascular risk factors”
§ Deep convolutional neural networks to predict cardiovascular risk from computed tomography > Methods > Statistical methods
plain- Asserted: passes — The authors put it forward as true.
- Checkable: passes — It can be checked against evidence.
- Load-bearing: passes — The paper’s conclusions depend on it.
- Based: passes — The paper gives a reason why it holds.
Probably not a substantial claim. It may state two separate claims as one.
The paper relies on this without support.
The measurement of coronary calcium score requires radiological expertise, time, and specialized coronary calcium quantification equipment.
“However, the measurement requires radiological expertise, time, and specialized coronary calcium quantification equipment.”
The paper relies on this without support.
This essentially free available information is usually not reported.
“As a result, this essentially free available information is usually not reported.”
The paper relies on this without support.
Deep learning can automate complex assessments that previously could only be done by radiologists, at a scale with higher speed and lower cost.
“A major advantage is that deep learning can automate complex assessments that previously could only be done by radiologists, but now is feasible at a scale with a higher speed and lower cost.”
The paper relies on this without support.
Traditionally, coronary calcium scoring requires special software, manual measurement by trained experts and dedicated ECG-gated cardiac CT.
“Traditionally, coronary calcium scoring requires special software, manual measurement by trained experts and dedicated ECG-gated cardiac CT.”
The paper relies on this without support.
As a consequence, the calcium score is often not reported on routine noncardiac chest CT.
“As a consequence, the calcium score is often not reported on routine noncardiac chest CT”
The authors state this as an assumption.
Before clinical introduction of automated systems for cardiovascular risk prediction, their generalizability across multiple clinical scenarios and institutions needs to be demonstrated.
“This is essential, as before clinical introduction can be considered, the generalizability of these automated systems needs to be demonstrated as they need to be able to predict cardiovascular events of asymptomatic individuals across multiple clinical scenarios and work robustly on data from multiple institutions.”
Self-check
Percentages, sums and reported differences re-computed from the paper’s own numbers.
Each contradiction between two passages listed here was confirmed by an independent check.
Rated minor: it would not touch a result — a value no result rests on, a p-value that stays on the same side of the significance level, or a conflict that is clerical, resolved elsewhere in the paper, or outside its own findings.
In the paper
“across 19,421 individuals with distinct presentations enrolled in four large clinical studies.”
§ Deep convolutional neural networks to predict cardiovascular risk from computed tomography > Discussion
Reported 19421 · recomputed 20084
Rated minor: it would not touch a result — a value no result rests on, a p-value that stays on the same side of the significance level, or a conflict that is clerical, resolved elsewhere in the paper, or outside its own findings.
In the paper
§ Deep convolutional neural networks to predict cardiovascular risk from computed tomography > Results > Risk predictions in stable and acute chest pain patients
“there was a similar association between the deep learning calcium score and acute coronary syndrome at 28 days (Fig. 2c)20.”
§ Deep convolutional neural networks to predict cardiovascular risk from computed tomography > Results > Automated coronary calcium scoring in lung cancer screening
“c Thirty-day acute coronary syndrome (ACS) rate across CAC groups for 441 subjects”
Rated minor: it would not touch a result — a value no result rests on, a p-value that stays on the same side of the significance level, or a conflict that is clerical, resolved elsewhere in the paper, or outside its own findings.
In the paper
§ Deep convolutional neural networks to predict cardiovascular risk from computed tomography > Methods > Statistical methods
“comparing cardiovascular disease risk in the 1st (lowest) versus the 2nd–4th quartiles of CAC.”
§ Deep convolutional neural networks to predict cardiovascular risk from computed tomography > Results > Automated coronary calcium scoring in lung cancer screening
“Coronary calcium risk categories are based on: very low risk (0: no coronary calcifications found), low risk (1–100: small amounts of coronary calcifications), moderate risk (101–300: moderate amounts of coronary calcifications), and high risk (>300: large amounts of coronary calcifications)21.”
Rated minor: it would not touch a result — a value no result rests on, a p-value that stays on the same side of the significance level, or a conflict that is clerical, resolved elsewhere in the paper, or outside its own findings.
In the paper
§ Deep convolutional neural networks to predict cardiovascular risk from computed tomography > Results > Risk predictions in stable and acute chest pain patients
“reflected in HRs significantly greater than 1 for each of low, moderate, high risk versus the reference (very low risk) group (Table 2).”
§ Deep convolutional neural networks to predict cardiovascular risk from computed tomography > Results > Automated coronary calcium scoring in lung cancer screening
“| Risk groups | Events | OR | 95% CI | P value | OR | 95%CI | P value | OR | 95% CI | P value |”
Citations
Cites
U-Net: Convolutional Networks for Biomedical Image Segmentation
Ronneberger, O., Fischer, P., & Brox, T. (2015) · Lecture notes in computer science · doi:10.1007/978-3-319-24574-4_28 · Cited by 99,404
A Coefficient of Agreement for Nominal Scales
Cohen, J. (1960) · Educational and Psychological Measurement · doi:10.1177/001316446002000104 · Cited by 42,398
A survey on deep learning in medical image analysis
Litjens, G., Kooi, T., Bejnordi, B. E., Setio, A. A. A., Ciompi, F., Ghafoorian, M., van der Laak, J. A. W. M., van Ginneken, B., & Sánchez, C. I. (2017) · Medical Image Analysis · doi:10.1016/j.media.2017.07.005 · Cited by 15,332
Reduced Lung-Cancer Mortality with Low-Dose Computed Tomographic Screening
The National Lung Screening Trial Research Team (2011) · New England Journal of Medicine · doi:10.1056/nejmoa1102873 · Cited by 11,064
Quantification of coronary artery calcium using ultrafast computed tomography
Agatston, A. S., Janowitz, W. R., Hildner, F. J., Zusmer, N. R., Viamonte, M., & Detrano, R. (1990) · Journal of the American College of Cardiology · doi:10.1016/0735-1097(90)90282-t · Cited by 7,786
General Cardiovascular Risk Profile for Use in Primary Care: The Framingham Heart Study
D’Agostino, R. B., Vasan, R. S., Pencina, M. J., Wolf, P. A., Cobain, M., Massaro, J. M., & Kannel, W. B. (2008) · Circulation · doi:10.1161/circulationaha.107.699579 · Cited by 7,491
Self-citation(2005) · PubMed · Cited by 7,011
Heart Disease and Stroke Statistics—2016 Update: A Report From the American Heart Association
Mozaffarian, D., Benjamin, E. J., Go, A. S., Arnett, D. K., Blaha, M. J., Cushman, M., Das, S. R., de Ferranti, S., Després, J.-P., Fullerton, H. J., et al. (2016) · Circulation · doi:10.1161/cir.0000000000000350 · Cited by 6,596
Grundy, S. M., Stone, N. J., Bailey, A. L., Beam, C., Birtcher, K. K., Blumenthal, R. S., Braun, L. T., de Ferranti, S., Faiella-Tommasino, J., Forman, D. E., et al. (2019) · Circulation · doi:10.1161/cir.0000000000000625 · Cited by 6,185
Statistics corner: A guide to appropriate use of correlation coefficient in medical research.
(2012) · Europe PMC (PubMed Central) · Cited by 4,239
Cited by
Sorted by citations
Review of deep learning: concepts, CNN architectures, challenges, applications, future directions
Alzubaidi, L., Zhang, J., Humaidi, A. J., Al-Dujaili, A., Duan, Y., Al-Shamma, O., Santamaría, J., Fadhel, M. A., Al-Amidie, M., & Farhan, L. (2021) · Journal of Big Data · doi:10.1186/s40537-021-00444-8 · Cited by 7,906
Ahmad, S., Shakeel, I., Mehfuz, S., & Ahmad, J. (2023) · Computer Science Review · doi:10.1016/j.cosrev.2023.100568 · Cited by 197
Automated coronary calcium scoring using deep learning with multicenter external validation
Eng, D. K.-M., Chute, C., Khandwala, N., Rajpurkar, P., Long, J., Shleifer, S., Khalaf, M. H., Sandhu, A. T., Rodríguez, F., Maron, D. J., et al. (2021) · npj Digital Medicine · doi:10.1038/s41746-021-00460-1 · Cited by 189
Artificial intelligence in cardiovascular diseases: diagnostic and therapeutic perspectives
Sun, X., Yin, Y., Yang, Q., & Huo, T. (2023) · European journal of medical research · doi:10.1186/s40001-023-01065-y · Cited by 180
“Zeleznik et al. [74] suggested a DCNN model trained on a data set from 20,084 individuals from distinct asymptomatic (Framingham Heart Study, NLST) and stable and acute chest pain (PROMISE, ROMICAT-II) cohorts.”
MethodFrom coarse wall measurements to turbulent velocity fields through deep learning
Güemes, A., Discetti, S., Ianiro, A., Sırmaçek, B., Azizpour, H., & Vinuesa, R. (2021) · Physics of Fluids · doi:10.1063/5.0058346 · Cited by 138
Yim, D., Khuntia, J., Parameswaran, V., & Meyers, A. D. (2024) · JMIR Medical Informatics · doi:10.2196/52073 · Cited by 140
“[49,59,60,62,63,65,68,71,79,89,100,107,108,111,115,123,125,130-145], machine learning (9/161, 5.6”
InfluentialSensing coherent structures from the wall
Güemes, A. (2021) · e-Archivo (Carlos III University of Madrid) · Cited by 116
Chao, H., Shan, H., Homayounieh, F., Singh, R., Khera, R. D., Guo, H., Su, T., Wang, G., Kalra, M. K., & Yan, P. (2021) · Nature Communications · doi:10.1038/s41467-021-23235-4 · Cited by 116
Sanchez‐Martinez, S., Cámara, Ó., Piella, G., Čikeš, M., González‐Ballester, M. Á., Miron, M., Vellido, A., Gómez, E., Fraser, A. G., & Bijnens, B. H. (2022) · Frontiers in Cardiovascular Medicine · doi:10.3389/fcvm.2021.765693 · Cited by 112
“Lastly, a DL implementation fed with CT scans from asymptomatic as well as stable and acute chest pain cohorts demonstrated the added clinical value of automated systems to predict cardiovascular events (30).”
MethodSlart, R. H. J. A., Williams, M. A., Juárez‐Orozco, L. E., Rischpler, C., Dweck, M. R., Glaudemans, A. W. J. M., Gimelli, A., Georgoulias, P., Gheysens, O. S., Gaemperli, O., et al. (2021) · European Journal of Nuclear Medicine and Molecular Imaging · doi:10.1007/s00259-021-05341-z · Cited by 88
“More recently, a study using 20,084 gated and non-gated cardiac CT scans developed a deep learning model to identify coronary calcification with excellent correlation with manual readers (r 0.92, p 0.001) and test-retest stability (intra-class correlation 0.993, p 0.001) [52].”
BackgroundInfluentialPieszko, K., Shanbhag, A. D., Killekar, A., Miller, R. J. H., Lemley, M. H., Otaki, Y., Singh, A., Kwieciński, J., Gransar, H., Kriekinge, S. D. V., et al. (2022) · JACC. Cardiovascular imaging · doi:10.1016/j.jcmg.2022.06.006 · Cited by 82
Chao, H., Shan, H., Homayounieh, F., Singh, R., Khera, R. D., Guo, H., Su, T., Wang, G., Kalra, M. K., & Yan, P. (2021) · RePEc: Research Papers in Economics · Cited by 81
A comprehensive review of deep learning-based models for heart disease prediction
Zhou, C., Dai, P.-F., Hou, A., Zhang, Z.-X., Liu, L., Li, A., & Wang, F.-S. (2024) · Artificial Intelligence Review · doi:10.1007/s10462-024-10899-9 · Cited by 76
“To further improve HDP, probabilistic method evaluation can be conducted (Zeleznik and Eslami 2021).”
AI Body Composition in Lung Cancer Screening: Added Value Beyond Lung Cancer Detection
Xu, K., Khan, M. S., Li, T., Gao, R., Terry, J. G., Huo, Y., Lasko, T. A., Carr, J. J., Maldonado, F., Landman, B. A., et al. (2023) · Radiology · doi:10.1148/radiol.222937 · Cited by 71
Hanneman, K., Playford, D., Dey, D., van Assen, M., Mastrodicasa, D., Cook, T. S., Gichoya, J. W., Williamson, E. E., Rubin, G. D., & on behalf of the American Heart Association Council on Cardiovascular Radiology and Intervention; and Council on Lifelong Congenital Heart Disease and Heart Health in the Young (2024) · Circulation · doi:10.1161/cir.0000000000001202 · Cited by 72
Miller, R. J. H., Pieszko, K., Shanbhag, A. D., Fehér, A., Lemley, M. H., Killekar, A., Kavanagh, P., Kriekinge, S. D. V., Liang, J. X., Huang, C., et al. (2022) · Journal of Nuclear Medicine · doi:10.2967/jnumed.122.264423 · Cited by 66
“We demonstrated that increasing DL CAC category was associated with an increased risk of MACE, similar to recent fi ndings from Zeleznik et al. in both symptomatic and asymptomatic populations ( 27 ).”
MethodResultMachine learning in sudden cardiac death risk prediction: a systematic review
Barker, J., Li, X., Khavandi, S., Koeckerling, D., Mavilakandy, A. K., Pepper, C., Bountziouka, V., Chen, L., Kotb, A. I., Antoun, I., et al. (2022) · EP Europace · doi:10.1093/europace/euac135 · Cited by 64
A Novel Method of Rolling Bearing Fault Diagnosis Under Strong Noise Backgrounds
Tong, J., Tang, S., Wu, Y., Pan, H., & Zheng, J. (2022) · Measurement · doi:10.1016/j.measurement.2022.112282 · Cited by 68
DeepCarc: Deep Learning-Powered Carcinogenicity Prediction Using Model-Level Representation
Li, T., Tong, W., Roberts, R. A., Liu, Z., & Thakkar, S. (2021) · Frontiers in Artificial Intelligence · doi:10.3389/frai.2021.757780 · Cited by 65
“…learning (DL) has been successfully applied to predict complex endpoints, such as drug-induced liver injury (DILI) (Hwang et al., 2020; Li et al., 2020; Semenova et al., 2020) and cardiovascular toxicity (Wang et al., 2017; Maher et al., 2020; Rashed-Al-Mahfuz et al., 2021; Zeleznik et al., 2021).”
BackgroundSelf‐Curable Synaptic Ferroelectric FET Arrays for Neuromorphic Convolutional Neural Network
Shin, W., Im, J., Koo, R., Kim, J., Kwon, K.-R., Kwon, D., Kim, J., Lee, J., & Kwon, D. (2023) · Advanced Science · doi:10.1002/advs.202207661 · Cited by 63
Medical multimodal multitask foundation model for lung cancer screening
Niu, C., Lyu, Q., Carothers, C. D., Kaviani, P., Tan, J., Yan, P., Kalra, M. K., Whitlow, C. T., & Wang, G. (2025) · Nature Communications · doi:10.1038/s41467-025-56822-w · Cited by 72
“Figure 4a summarizes the key results of M3FM against the previous SOTA models 14,16,34,42 – 45 and the most powerful generalist AI model GPT-4o 46 on the OpenM3Chest dataset.”
The year in cardiovascular medicine 2021: digital health and innovation
Vardas, P. E., Asselbergs, F. W., van Smeden, M., & Friedman, P. A. (2021) · European Heart Journal · doi:10.1093/eurheartj/ehab874 · Cited by 52
Deep learning to estimate lung disease mortality from chest radiographs
Weiß, J., Raghu, V. K., Bontempi, D., Christiani, D. C., Mak, R. H., Lu, M. T., & Aerts, H. J. W. L. (2023) · Nature Communications · doi:10.1038/s41467-023-37758-5 · Cited by 56
Self-citationAbut, S., Okut, H., & Kallail, K. J. (2023) · Expert Systems with Applications · doi:10.1016/j.eswa.2023.122983 · Cited by 62
Winkel, D. J., Suryanarayana, V., Ali, A. M., Görich, J., Buss, S. J., Mendoza, A., Schwemmer, C., Sharma, P. K., Schoepf, U. J., & Rapaka, S. (2021) · European Heart Journal - Cardiovascular Imaging · doi:10.1093/ehjci/jeab119 · Cited by 53
Ihdayhid, A. R., Lan, N. S. R., Williams, M. C., Newby, D. E., Flack, J., Kwok, S., Joyner, J., Gera, S., Dembo, L. G., Adler, B. D., et al. (2022) · European Radiology · doi:10.1007/s00330-022-09028-3 · Cited by 48
“However, given the reduced fidelity of non-gated chest CT, automated CAC score accuracies remain low (kappa coefficient in the range of 0.6 to 0.7) [20, 25].”
BackgroundInfluentialArtificial Intelligence in Coronary Artery Calcium Scoring Detection and Quantification
Abdelrahman, K., Shiyovich, A., Huck, D. M., Berman, A. N., Weber, B., Gupta, S., Cardoso, R. N., & Blankstein, R. (2024) · Diagnostics · doi:10.3390/diagnostics14020125 · Cited by 48
“For example, the high-risk calcium group had a HR of 3.87 (95% CI = 2.45–6.11, p 0.001) compared with the reference group [66].”
BackgroundResultInfluentialCharting the Unseen: How Non-Invasive Imaging Could Redefine Cardiovascular Prevention
Trimarchi, G., Pizzino, F., Paradossi, U., Gueli, I. A., Palazzini, M., Gentile, P., Di Spigno, F., Ammirati, E., Garascia, A., Tedeschi, A., et al. (2024) · Journal of Cardiovascular Development and Disease · doi:10.3390/jcdd11080245 · Cited by 45
“These algorithms have also proven to be strong predictors of cardiovascular events, independent of traditional risk factors [199].”
BackgroundForaker, R., Sperling, L., Bratzke, L., Budoff, M., Leppert, M., Razavi, A. C., Rodriguez, F., Shapiro, M. D., Whelton, S., Wong, N. D., et al. (2025) · Circulation · doi:10.1161/cir.0000000000001382 · Cited by 44
Filist, S., Al-Kasasbeh, R. T., Шаталова, О. В., et al. (2021) · Computer Methods in Biomechanics & Biomedical Engineering · doi:10.1080/10255842.2021.1986486 · Cited by 44
“A database where information about each patient is compiled as a multidimensional vector, including data from clinical examination, identified diseases, and medical laboratory studies (Bhake et al., 2013; Zeleznik et al., 2021).”
BackgroundMethodA Deep Convolutional Neural Network for Classification of Aedes Albopictus Mosquitoes
Adhane, G. W., Dehshibi, M. M., & Masip, D. (2021) · IEEE Access · doi:10.1109/access.2021.3079700 · Cited by 45
Guo, Y., Li, T., Gong, B., Hu, Y., Wang, S., Yang, L., & Zheng, C. (2024) · Advanced Science · doi:10.1002/advs.202408069 · Cited by 49
Performance of artificial intelligence-based coronary artery calcium scoring in non-gated chest CT
Xu, J., Liu, J., Guo, N., Chen, L., Song, W., Guo, D., Zhang, Y., & Zheng, F. (2021) · European Journal of Radiology · doi:10.1016/j.ejrad.2021.110034 · Cited by 42
Shariati, L., Esmaeili, Y., Rahimmanesh, I., Babolmorad, S., Ziaei, G., Hasan, A., Boshtam, M., & Makvandi, P. (2023) · Environmental Research · doi:10.1016/j.envres.2023.116933 · Cited by 41
Williams, M. C., Weir-McCall, J. R., Baldassarre, L. A., Cecco, C. N. D., Choi, A. D., Dey, D., Dweck, M. R., Išgum, I., Kolossváry, M., Leipsic, J. A., et al. (2024) · Journal of cardiovascular computed tomography · doi:10.1016/j.jcct.2024.08.003 · Cited by 38
Self-citationRecent Trends in Artificial Intelligence-Assisted Coronary Atherosclerotic Plaque Characterization
Gudigar, A., Nayak, S., Samanth, J., Raghavendra, U., Ashwal, A. J., Barua, P. D., Hasan, M. N., Ciaccio, E. J., Tan, R., & Acharya, U. R. (2021) · International Journal of Environmental Research and Public Health · doi:10.3390/ijerph181910003 · Cited by 37
Rojas, M. G., Olivera, A. C., & Vidal, P. J. (2022) · Array · doi:10.1016/j.array.2022.100173 · Cited by 42
Clinician's guide to trustworthy and responsible artificial intelligence in cardiovascular imaging
Szabó, L. E., Raisi‐Estabragh, Z., Salih, A. M., McCracken, C., Pujadas, E. R., Gkontra, P., Kiss, M., Maurovich‐Horvat, P., Vágó, H., Merkely, B. P., et al. (2022) · Frontiers in Cardiovascular Medicine · doi:10.3389/fcvm.2022.1016032 · Cited by 42
Adopting artificial intelligence in cardiovascular medicine: a scoping review
Makimoto, H., & Kohro, T. (2023) · Hypertension Research · doi:10.1038/s41440-023-01469-7 · Cited by 38
Ansari, M. Y., Qaraqe, M., Righetti, R., Serpedin, E., & Qaraqe, K. A. (2024) · Frontiers in Cardiovascular Medicine · doi:10.3389/fcvm.2024.1424585 · Cited by 35
Zhen, J., Li, X., Yu, H., & Du, B. (2024) · Journal of Nanobiotechnology · doi:10.1186/s12951-024-02529-x · Cited by 41
“Nano-platforms that specifically target atherosclerotic plaques, which can be difficult to detect with traditional CT imaging, can increase the sensitivity and specificity of CT imaging for diagnosing early-stage CVD [107].”
BackgroundMachine learning in cardiovascular risk assessment: Towards a precision medicine approach
Wang, Y., Aivalioti, E., Stamatelopoulos, K., Zervas, G., Mortensen, M. B., Zeller, M., Liberale, L., Vece, D. D., Schweiger, V., Camici, G. G., et al. (2025) · European Journal of Clinical Investigation · doi:10.1111/eci.70017 · Cited by 44
“In this regard, a DL-based coronary artery calcium (CAC) scoring system has demonstrated expert-level accuracy in predicting cardiovascular risk, 32 with calcification > 400 Agatston units—especially in the left-main or anterior descending coronary artery—being strongly linked to increased…”
Kwan, J. M., Oikonomou, E. K., Henry, M. L., & Sinusas, A. J. (2022) · Frontiers in Cardiovascular Medicine · doi:10.3389/fcvm.2022.829553 · Cited by 35
“…found in the field of computed tomography (CT) imaging, where automated tools enable an accurate assessment of coronary artery calcium burden, which can be generalized to both gated and non-gated CT scans of the chest, with the latter often used in the staging or monitoring of patients ( 163, 164).”
BackgroundLanglais, É. L., Thériault-Lauzier, P., Marquis‐Gravel, G., Kulbay, M., So, D. Y. F., Tanguay, J., Ly, H. Q., Gallo, R., Lesage, F., & Avram, R. (2022) · Journal of Cardiovascular Translational Research · doi:10.1007/s12265-022-10260-x · Cited by 35
“CT scan • Coronary artery calcium scoring [18] • Prediction of cardiovascular events and death [19, 20]”
BackgroundCurrent and Future Applications of Artificial Intelligence in Cardiac CT
Joshi, M. M., Melo, D. P., Ouyang, D., Slomka, P. J., Williams, M. C., & Dey, D. (2023) · Current Cardiology Reports · doi:10.1007/s11886-022-01837-8 · Cited by 32
The Role of Imaging in Cardiovascular Prevention: A Comprehensive Review
Carerj, M. L., Restelli, D., Poleggi, C., Bella, G. D., Zito, C., Manganaro, R., Piccione, M. C., Trimarchi, G., Farina, A., Micari, A., et al. (2025) · Journal of Cardiovascular Echography · doi:10.4103/jcecho.jcecho_26_25 · Cited by 33
Artificial Intelligence in Nuclear Cardiology: An Update and Future Trends
Miller, R. J. H., & Slomka, P. J. (2024) · Seminars in Nuclear Medicine · doi:10.1053/j.semnuclmed.2024.02.005 · Cited by 30
A novel percussion-based approach for pipeline leakage detection with improved MobileNetV2
Peng, L., Zhang, J., Li, Y., et al. (2024) · Engineering Applications of Artificial Intelligence · doi:10.1016/j.engappai.2024.108537 · Cited by 30
Atkins, K. M., Weiss, J., Zeleznik, R., Bitterman, D. S., Chaunzwa, T. L., Huynh, E., Guthier, C., Kozono, D. E., Lewis, J. H., Tamarappoo, B. K., et al. (2022) · JCO Clinical Cancer Informatics · doi:10.1200/cci.21.00095 · Cited by 30
“The primary objective of the current study was to quantify CAC from non–ECG-gated, nonrespiratory-gated (free breathing) radiotherapy planning CT scans in patients with locally advanced non–small-cell lung cancer using a previously validated automated DL model trained on ECGgated cardiovascular medical imaging and val…”
MethodSelf-citationDeep learning–based atherosclerotic coronary plaque segmentation on coronary CT angiography
Jávorszky, N., Homonnay, B., Gerstenblith, G., Bluemke, D. A., Kiss, P., Török, M., Celentano, D. D., Lai, H. C., Lai, S., & Kolossváry, M. (2022) · European Radiology · doi:10.1007/s00330-022-08801-8 · Cited by 29
“Several promising results in the area of cardiovascular imaging show that the U-net DL architecture is especially well suited to accurately define given organs or abnormalities on radiological images [16, 17].”
BackgroundDSC-Ghost-Conv: A compact convolution module for building efficient neural network architectures
Wang, T., & Zhang, S. (2023) · Multimedia Tools and Applications · doi:10.1007/s11042-023-16120-3 · Cited by 27
“During the past two decades, Convolutional Neural Networks (CNNs) have exhibited tremendous success in object detection [8, 12, 14] and image recognition [7, 15, 16], due to its powerful feature learning ability.”
Lee, J., Pereira, G. T. R., Gharaibeh, Y., Kolluru, C., Zimin, V. N., Dallan, L. A. P., Kim, J. N., Hoori, A. O., Al-Kindi, S. G., Guagliumi, G., et al. (2022) · Scientific Reports · doi:10.1038/s41598-022-24884-1 · Cited by 26
Reddy, S., & Murthy, G. V. (2025) · SN Computer Science · doi:10.1007/s42979-025-03723-w · Cited by 24
Artificial intelligence for disease diagnosis and risk prediction in nuclear cardiology
Miller, R. J. H., Huang, C., Liang, J. X., et al. (2022) · Journal of Nuclear Cardiology · doi:10.1007/s12350-022-02977-8 · Cited by 24
Artificial Intelligence in Cardiology: Applications and Obstacles
Danilov, A., & Aronow, W. S. (2023) · Current Problems in Cardiology · doi:10.1016/j.cpcardiol.2023.101750 · Cited by 28
Alkhodari, M., Xiong, Z., Khandoker, A. H., Hadjileontiadis, L. J., Leeson, P., & Lapidaire, W. (2023) · Expert Review of Cardiovascular Therapy · doi:10.1080/14779072.2023.2223978 · Cited by 23
“For example, in the presence of imaging data, each layer applies a set of feature extraction mathematical operations, i.e. convolutions, on the previous layer’s features to identify deeper markers such as sharper edges or blurred color spread as used in convolutional neural networks (CNN) [51].”
BackgroundMeasurement and Application of Incidentally Detected Coronary Calcium
Parsa, S., Saleh, A., Raygor, V., Hoeting, N., Rao, A., Navar, A. M., Rohatgi, A., Kay, F., Abbara, S., Khera, A., et al. (2024) · Journal of the American College of Cardiology · doi:10.1016/j.jacc.2024.01.039 · Cited by 23
Artificial Intelligence in Cardiovascular Disease Prevention: Is it Ready for Prime Time?
Parsa, S., Somani, S. S., Dudum, R., Jain, S. S., & Rodríguez, F. (2024) · Current Atherosclerosis Reports · doi:10.1007/s11883-024-01210-w · Cited by 22
“After smaller studies focused on algorithm creation, the first large study of over twenty thousand individuals performed in Framingham, PROMISE, and ROMICAT-II cohorts created and validated a deep learning algorithm based on CNNs capable of assessing CAC burden on low-dose chest CT scans [78].”
The Role of Artificial Intelligence and Machine Learning in Cardiovascular Imaging and Diagnosis
Reza-Soltani, S., Alam, L. F., Debellotte, O., Monga, T. S., Coyalkar, V. R., Tarnate, V. C. A., Ozoalor, C. U., Allam, S. R., Afzal, M., Shah, G. K., et al. (2024) · Cureus · doi:10.7759/cureus.68472 · Cited by 27
“For cardiac CT, deep learning algorithms have shown promise in coronary artery calcium scoring, plaque characterization, and coronary stenosis detection [15].”
MethodXu, C., Guo, H., Xu, M., Duan, M., Wang, M., Liu, P., Luo, X., Jin, Z., Liu, H., & Wang, Y. (2022) · Quantitative Imaging in Medicine and Surgery · doi:10.21037/qims-21-1017 · Cited by 22
Sunilkumar, G., & Kumaresan, P. (2024) · IEEE Access · doi:10.1109/access.2024.3514093 · Cited by 30
“Zeleznik et al. [113].”
Yu, J., Qian, L., Sun, W., Nie, Z., Zheng, D., Han, P., Shi, H., Zheng, C., & Yang, F. (2022) · BMC Medical Imaging · doi:10.1186/s12880-022-00907-1 · Cited by 21
“incremental prognostic value to the total Agatston CAC score, this would be a specific shortcoming of chest CT for per-vessel CAC scoring compared to dedicated cardiac CT [11, 14, 19, 20].”
Zhou, Z., Qian, X., Hu, J., Chen, G., Zhang, C., Zhu, J., & Dai, Y. (2023) · Quantitative Imaging in Medicine and Surgery · doi:10.21037/qims-23-20 · Cited by 21
Emerging advances in fluorescence imaging and phototherapy of arthritis
Wang, X., Dai, J., Shao, C., Goto, T., & Dai, H. (2023) · Interdisciplinary materials · doi:10.1002/idm2.12130 · Cited by 21
Cardiovascular Disease Detection from Multi-view Chest X-Rays with BI-Mamba
Yang, Z., Zhang, J., Wang, G., et al. (2024) · Lecture notes in computer science · doi:10.1007/978-3-031-72086-4_13 · Cited by 21
Radiomics in Cardiovascular Disease Imaging: from Pixels to the Heart of the Problem
Spadarella, G., Perillo, T., Ugga, L., & Cuocolo, R. (2022) · Current Cardiovascular Imaging Reports · doi:10.1007/s12410-022-09563-z · Cited by 23
“These patients were clinically followed for more than 9 years, and ML accurately identified subjects at risk of major cardiovascular events among them [31].”
BackgroundDeep learning analysis of epicardial adipose tissue to predict cardiovascular risk in heavy smokers
Foldyna, B., Hadžić, I., Zeleznik, R., Langenbach, M. C., Raghu, V. K., Mayrhofer, T., Lu, M. T., & Aerts, H. J. W. L. (2024) · Communications Medicine · doi:10.1038/s43856-024-00475-1 · Cited by 22
“%) participants, CAC scores (Agatston score), calculated from a deep learning algorithm, were available as previously published 4 .”
Self-citationMultimodal knowledge graph construction for risk identification in water diversion projects
Wang, L., Liu, X., Liu, Y., Li, H., Liu, J., & Yang, L. (2024) · Journal of Hydrology · doi:10.1016/j.jhydrol.2024.131155 · Cited by 21
Zhang, T. G., Zhu, C., Zhao, Y., Zhao, M., Wang, Z., Song, R., Meng, N., Sial, A. W., Diwan, A. D., Liu, J., et al. (2022) · Research Square · doi:10.21203/rs.3.rs-1655808/v1 · Cited by 19
Langenbach, I. L., Hadžić, I., Zeleznik, R., Langenbach, M. C., Maintz, D. C., Mayrhofer, T., Lu, M. T., Aerts, H. J. W. L., & Foldyna, B. (2025) · Radiology · doi:10.1148/radiol.240473 · Cited by 21
Self-citationArtificial intelligence in cardiovascular imaging: enhancing image analysis and risk stratification
Lin, A., Pieszko, K., Park, C., Ignor, K., Williams, M. C., Slomka, P. J., & Dey, D. (2023) · BJR|Open · doi:10.1259/bjro.20220021 · Cited by 18
Maragna, R., Giacari, C. M., Guglielmo, M., Baggiano, A., Fusini, L., Guaricci, A. I., Rossi, A., Rabbat, M., & Pontone, G. (2021) · Frontiers in Cardiovascular Medicine · doi:10.3389/fcvm.2021.736223 · Cited by 20
“Recently, a study by Zeleznik et al. (16) confirmed the possibility to broadly use AI applications to use CTs acquired in different clinical scenarios to screen for CAD using CAC score.”
BackgroundEvidenceCap: Towards trustworthy medical image segmentation via evidential identity capPreprint
Zou, K., Yuan, X., Shen, X., Chen, Y., Wang, M., Goh, R. S. M., Liu, Y., & Fu, H. (2023) · Research Square · doi:10.21203/rs.3.rs-2558155/v1 · Cited by 18
Wang, J., Zhang, H., Wan, W., et al. (2024) · Nanomedicine · doi:10.1080/17435889.2024.2364581 · Cited by 17
Prospects for cardiovascular medicine using artificial intelligence
Kodera, S., Akazawa, H., Morita, H., & Komuro, I. (2021) · Journal of Cardiology · doi:10.1016/j.jjcc.2021.10.016 · Cited by 21
Active multitask learning with uncertainty‐weighted loss for coronary calcium scoring
Föllmer, B., Biavati, F., Wald, C., Stober, S., Ma, J., Dewey, M., & Samek, W. (2022) · Medical Physics · doi:10.1002/mp.15870 · Cited by 17
Canan, A., Ghandour, A., Saboo, S. S., & Rajiah, P. S. (2023) · Cardiovascular Diagnosis and Therapy · doi:10.21037/cdt-23-79 · Cited by 21
“…score obtained from low-dose chest CT is a strong predictor of cardiovascular events, and demonstrates high correlation with manual quantification (152) Similarly , a deep learning algorithm for automated coronary and thoracic aortic calcium scoring on various types thoracic CTs that included the…”
Mascalchi, M., Picozzi, G., Puliti, D., Diciotti, S., Deliperi, A., Romei, C., Falaschi, F., Pistelli, F., Grazzini, M., Vannucchi, L., et al. (2023) · Diagnostics · doi:10.3390/diagnostics13132197 · Cited by 17
“On its turn, automatic analyses of LDCT images with deeplearning algorithms helps in detection of lung nodules [140–142], nodule characterization in terms of malignancy [143,144], quantification of vascular calcifications [114,145], assessment of diffuse lung abnormalities [146,147], and prediction of future LC risk w…”
BackgroundMethodThe Pivotal Role of Baseline LDCT for Lung Cancer Screening in the Era of Artificial Intelligence
Luca, G. R. D., Diciotti, S., & Mascalchi, M. (2024) · Archivos de Bronconeumología · doi:10.1016/j.arbres.2024.11.001 · Cited by 16
AI Opportunistic Coronary Calcium Screening at Veterans Affairs Hospitals
Hagopian, R., Strebel, T., Bernatz, S., Myers, G. A., Offerman, E. J., Zuniga, E., Kim, C. Y., Ng, A. T., Iwaz, J. A., Nürnberg, L., et al. (2025) · NEJM AI · doi:10.1056/aioa2400937 · Cited by 16
Self-citationMehta, V. S., O’Brien, H., Elliott, M. K., Wijesuriya, N., Auricchio, A., Ayis, S. A., Blomström‐Lundqvist, C., Bongiorni, M. G., Butter, C., Deharo, J., et al. (2022) · Heart Rhythm · doi:10.1016/j.hrthm.2021.12.036 · Cited by 16
“Identifying a neural network as the optimal ML predictor of cardiovascular end points is consistent with previous studies.(32)”
ResultChen, Q., Zhou, F., Xie, G., Tang, C. X., Gao, X., Zhang, Y., Yin, X., Xu, H., & Zhang, L. J. (2024) · Reviews in Cardiovascular Medicine · doi:10.31083/j.rcm2501027 · Cited by 16
“[26] 1636 CAC scans CNN The DL algorithm showed good agreement with expert manual scoring in both ECG-gated and non-gated CT. Velzen et al .”
MethodSelf-citationMachine learning with convolutional neural networks for clinical cardiologists
Howard, J. P., & Francis, D. P. (2021) · Heart · doi:10.1136/heartjnl-2020-318686 · Cited by 17
“19 This process can be applied to 3D volumetric data, allowing the quantification of epicardial adipose tissue 20 and coronary calcium on even non-gated CT scans, 21 with evidence that such systems prove useful in cardiac risk prediction.”
MethodAutomated Prediction of Crack Propagation Using H2O AutoML
Omar, I., Khan, M., Starr, A. G., & Ba, K. A. R. (2023) · Sensors · doi:10.3390/s23208419 · Cited by 15
Construction of Risk Prediction Model of Type 2 Diabetic Kidney Disease Based on Deep Learning
Yun, C., Tang, F., Gao, Z., Wang, W., Bai, F., Miller, J. D., Liu, H., Lee, Y., & Lou, Q. (2024) · Diabetes & Metabolism Journal · doi:10.4093/dmj.2023.0033 · Cited by 19
“In the medical field, deep learning techniques can be used to predict the risk of disease, including breast cancer risk prediction [11-13], cardio-vascular disease risk [14-16], and risk of acute respiratory disease events and death in smoking patients [17].”
BackgroundPalm, V., Norajitra, T., von Stackelberg, O., Heußel, C. P., Skornitzke, S., Weinheimer, O., Kopytova, T., Klein, A., Almeida, S. D., Baumgartner, M., et al. (2022) · Healthcare · doi:10.3390/healthcare10112166 · Cited by 14
“Previous works have addressed automated segmentation and quantification of calcification using various machine learning approaches, ranging from random forests [54,55] to single-stage and multi-stage deep learning approaches [56,57].”
BackgroundLi, C., Bagher‐Ebadian, H., Sultan, R. I., Elshaikh, M. A., Movsas, B., Zhu, D., & Chetty, I. J. (2023) · Medical Physics · doi:10.1002/mp.16750 · Cited by 14
Elvas, L. B., Almeida, A. G., Rosário, L. B., Dias, M. S., & Ferreira, J. C. (2021) · Journal of Personalized Medicine · doi:10.3390/jpm11070598 · Cited by 14
“According to the Agatston method, calcium quantification by cardiac CT is usually presented as a calcium score and has been validated by histopathology [28].”
BackgroundMethodTang, L.-Z., Wang, X., Yang, J., Wang, Y., Qu, M., & Li, H. (2023) · Computer Methods and Programs in Biomedicine · doi:10.1016/j.cmpb.2023.107882 · Cited by 14
Savitha, S., Kannan, A. R., & Logeswaran, K. (2025) · Cognitive Computation · doi:10.1007/s12559-025-10406-4 · Cited by 13
“Zeleznik et al. (2021) [13] introduced a quick DL technique for routine cardiac-gated and non-gated CT that can reliably quantify coronary calcium.”
Xu, Y., Sushmit, A., Lyu, Q., Li, Y., Cao, X., Maltz, J. S., Wang, G., & Yu, H. (2022) · Journal of X-Ray Science and Technology · doi:10.3233/xst-211109 · Cited by 13
“DL has demonstrated the ability to perform clinical decision making that is on a par or exceeds that of expert human operators [13–19].”
Artificial intelligence in coronary computed tomography angiography
Xu, P., Liu, T. Y., Zhou, F., Chen, Q., Rowe, J., Tesche, C., & Zhang, L. J. (2024) · Medicine Plus · doi:10.1016/j.medp.2023.100001 · Cited by 12
Self-citationScalia, I. G., Pathangey, G., Abdelnabi, M. H., Ibrahim, O., Abdelfattah, F. E., Pereyra, M., Ibrahim, R., Farina, J., Banerjee, I., Tamarappoo, B. K., et al. (2025) · Cancers · doi:10.3390/cancers17040605 · Cited by 14
Srilakshmi, V., Anuradha, K., & Bindu, C. S. (2022) · Advances in Engineering Software · doi:10.1016/j.advengsoft.2022.103198 · Cited by 12
Artificial Intelligence in Nuclear Cardiology
Miller, R. J. H. (2023) · Cardiology Clinics · doi:10.1016/j.ccl.2023.01.004 · Cited by 12
Yamaoka, T., & Watanabe, S. (2023) · European Journal of Radiology · doi:10.1016/j.ejrad.2023.110855 · Cited by 15
Brendel, J. M., Mayrhofer, T., Hadžić, I., Norton, E., Langenbach, I. L., Langenbach, M. C., Jung, M., Raghu, V. K., Nikolaou, K., Douglas, P. S., et al. (2025) · European Heart Journal - Cardiovascular Imaging · doi:10.1093/ehjci/jeaf257 · Cited by 13
“13,15,19 The primary variables of interest were EAT volume (cm 3 ) and density (HU).”
Self-citationOpportunistic Screening for Coronary Artery Disease: An Untapped Population Health Resource
Malik, R. F., Sun, K. J., Azadi, J. R., Lau, B. D., Whelton, S. P., Arbab‐Zadeh, A., Wilson, R. F., & Johnson, P. T. (2024) · Journal of the American College of Radiology · doi:10.1016/j.jacr.2024.02.010 · Cited by 12
Artificial Intelligence in Coronary Artery Calcium Scoring
Aromiwura, A. A., & Kalra, D. K. (2024) · Journal of Clinical Medicine · doi:10.3390/jcm13123453 · Cited by 11
Kim, S., Park, E., Ahn, C., Jeong, B., Lee, Y. S., Lee, W., & Kim, J. H. (2025) · European Radiology · doi:10.1007/s00330-025-11559-4 · Cited by 11
“While prior studies have employed the DL-based approach to automatically extract calcium scores, they have evaluated LDCT scans without incorporating advanced noise reduction techniques [16 – 21].”
Influential
Metadata
- Authors
- Zeleznik, R., Foldyna, B., Eslami, P., Weiss, J., Alexander, I., Taron, J., Parmar, C., Alvi, R. M., Banerji, D., Uno, M., Kikuchi, Y., Karady, J., Zhang, L., Scholtz, J.-E., Mayrhofer, T., Lyass, A., Mahoney, T. F., Massaro, J. M., Vasan, R. S., Douglas, P. S., Hoffmann, U., Lu, M. T., & Aerts, H. J. W. L.
- Affiliations
- Brigham and Women's Hospital (US)
- Harvard University (US)
- Boston University (US)
- Duke University (US)
- Corresponding author
- Aerts, Hugo J. W. L.
- ORCID
- Venue
- Nature Communications
- Published
- 2021-01-29
- Volume
- 12
- Issue
- 1
- Pages
- 715-715
- ISSN
- 2041-1723 (ISSN-L)
- PMC
- PMC7846726
- OpenAlex
- W3126008863
- Cited by
- 240
- References
- 59
- Citations by year
- 2026: 33 · 2025: 48 · 2024: 61 · 2023: 36 · 2022: 42 · 2021: 20
- FWCI
- 19.23
- Type
- journal article
- Language
- en
- Open access
- gold
- doi.org
- Locations
- Nature Communications (publishedVersion, cc-by)
- PubMed (publishedVersion)
- Research Publications (Maastricht University) (publishedVersion, cc-by)
- Europe PMC (PubMed Central) (submittedVersion, other-oa)
- PubMed Central (submittedVersion, cc-by)
- RePEc: Research Papers in Economics (submittedVersion)
- DOAJ (DOAJ: Directory of Open Access Journals) (submittedVersion, cc-by-sa)
- Research Publications (Maastricht University) (submittedVersion, other-oa)
- Funders
- American Heart Association (5T32HL076136, 5K24HL113128, 18UNPG34030172, 5R01-HL109711, HHSN268201500001I, 5U01HL123339)
- American College of Radiology Imaging Network
- European Commission
- Deutsche Forschungsgemeinschaft
- National Institutes of Health (75N92019D00031, NIH-USA R35CA22052, 5k24hl113128-09, 5u01hl123339-06, R35CA22052, n01hc25195-41-0-1, 18UNPG34030172, HHSN268201500001I, U01-CA209414, NIH/NHLBI 5K24HL113128, NIH‐USA U24CA194354, NIH-USA U01CA190234, NIH-USA U01CA209414, U24CA194354, NHLBI 5K24HL113128, NO1-HC-25195, NIH-USA U24CA194354, NIH-USA U01CA190234, U01CA190234, 5K24HL113128)
- National Heart, Lung, and Blood Institute (K24HL113128, 5K24HL113128, HHSN268201500001I, 5U01HL123339, HHSN268201500001C, 75N92019D00031, N01-HC-025195, R01HL109711, U01 CA209414, T32HL076136, NO1‐HC‐25195, 5R01-HL109711, U01 HL123339, E0583118)
- National Cancer Institute (U24-CA194354, U01-CA190234, U01-CA209414, R35CA22052)
- H2020 European Research Council (866504)
- Topics
- Health Sciences › Medicine › Radiology, Nuclear Medicine and Imaging › Cardiac Imaging and Diagnostics
- Health Sciences › Medicine › Health Informatics › Artificial Intelligence in Healthcare and Education
- Health Sciences › Medicine › Radiology, Nuclear Medicine and Imaging › Radiomics and Machine Learning in Medical Imaging
- Keywords
- coronary artery calcium, cardiovascular risk prediction, deep learning, computed tomography, cardiovascular events, imaging biomarkers, test-retest reliability, chest pain, Framingham Heart Study, promise
- MeSH terms
- Deep Learning, Heart Disease Risk Factors, Aged, Calcium, Cardiovascular Diseases, Chest Pain, Coronary Vessels, Female, Follow-Up Studies, Humans, Image Processing, Computer-Assisted, Male, Middle Aged, Retrospective Studies, Tomography, X-Ray Computed, Reproducibility of Results, Risk Assessment, Asymptomatic Diseases
About these checks
Registry, retraction, Cites and statistics results are computed, not judged, with one exception: a printed reference that no index lists is read once by a model before it counts as a citation error. Claims are extracted by a model and kept only when their quote appears verbatim in the text; each cited source is then checked, with a model’s help, for whether it says what the claim relies on. Those verdicts can be wrong — read the claim’s quote and the cited source before relying on one.
A language model drew the claims from the paper on 2026-10-27, under version 3 of the claim definition (model deepseek-v4.1-flash, prompt extract-v3).
A second model labelled each claim on 2026-10-27 (model jev-1.13-20260917, definition revision gold-guideline-v0.2).
Cited sources are checked with a language model’s help (gpt-6-sol).
Statistics and arithmetic are recomputed, not judged.
Confidence bands are shown only for fields calibrated on our annotated test set. None is calibrated yet, so no band is shown.
What counts as a claim ›How we measure confidence ›How we check this ›
Are you an author, or do you see a problem with this page? Request a review
