

The DOI matches its Crossref record; 88 of the 88 references it cites were found in a registry or an index; 9 of the 78 sources its claims cite were checked for support.
Neuronal and glial 3D chromatin architecture informs the cellular etiology of brain disorders
Open accessAbstract
Cellular heterogeneity in the human brain obscures the identification of robust cellular regulatory networks, which is necessary to understand the function of non-coding elements and the impact of non-coding genetic variation. Here we integrate genome-wide chromosome conformation data from purified neurons and glia with transcriptomic and enhancer profiles, to characterize the gene regulatory landscape of two major cell classes in the human brain. We then leverage cell-type-specific regulatory landscapes to gain insight into the cellular etiology of several brain disorders. We find that Alzheimer’s disease (AD)-associated epigenetic dysregulation is linked to neurons and oligodendrocytes, whereas genetic risk factors for AD highlighted microglia, suggesting that different cell types may contribute to disease risk, via different mechanisms. Moreover, integration of glutamatergic and GABAergic regulatory maps with genetic risk factors for schizophrenia (SCZ) and bipolar disorder (BD) identifies shared (parvalbumin-expressing interneurons) and distinct cellular etiologies (upper layer neurons for BD, and deeper layer projection neurons for SCZ). Collectively, these findings shed new light on cell-type-specific gene regulatory networks in brain disorders.
Overview
AI snapshot
Written from the paper’s full text.
TL;DR
This paper integrates Hi–C chromosome conformation from sorted human neurons (NeuN+) and glia (NeuN−) with transcriptomic and enhancer data to map cell-type-specific 3D regulatory architecture in the brain. It uses these maps to refine the cellular etiology of Alzheimer’s disease, schizophrenia, and bipolar disorder.
Key findings
- NeuN+ and NeuN− cells show extensive cell-type-specific chromatin architecture: 287 differential FIREs (145 NeuN+, 142 NeuN−), 253 NeuN+ super-FIREs and 157 NeuN− super-FIREs with only 9 shared, and 187,674 NeuN+ versus 167,551 NeuN− promoter-based interactions.
- AD-associated epigenetic dysregulation maps to different cell classes by direction: AD hyperacetylated H3K27ac peaks were largely active in NeuN− cells and linked to 676 genes, while AD hypoacetylated peaks were largely active in NeuN+ cells and linked to 460 genes.
- AD genetic risk converged on microglia: AD SNP-based heritability was enriched in NeuN− enhancers (NeuN− p = 8.41 × 10⁻⁹; NeuN+ p = 0.205), and NeuN− H-MAGMA identified 181 AD risk genes, enriched in microglial co-expression modules upregulated in AD.
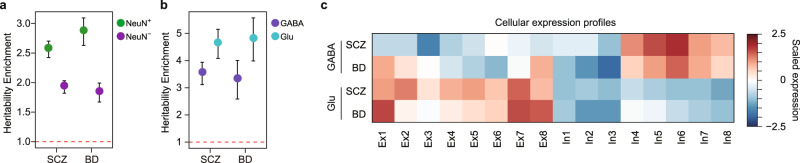
- SCZ and BD showed neuronal heritability enrichment and both mapped to Glu- and GABA-specific enhancers; risk genes shared parvalbumin-expressing interneuron (In6) enrichment, while BD showed upper-layer Ex1 specificity and SCZ showed Ex2 specificity.
Methods
- Hi–C libraries were generated from FANS-sorted NeuN+ and NeuN− nuclei from four dorsolateral prefrontal cortex (DLPFC) samples; RNA-seq was also generated from sorted nuclei, and published H3K27ac data from Glu and GABA neurons were integrated.
- Chromatin architecture was analyzed as A/B compartments, TADs, FIREs/super-FIREs, and promoter-anchored loops; cell-type-specific enhancer–promoter relationships were built by overlapping differential H3K27ac peaks with Hi–C interactions.
- Disease analyses used LDSC for SNP-based heritability enrichment and H-MAGMA to map GWAS risk variants to genes using NeuN−, Glu, or GABA regulatory maps; GWAS datasets included AD, SCZ, and BD.
Limitations
- The paper states that neuronal subtype-specific findings need verification with neuronal subtype-specific Hi–C data (e.g., Glu and GABA Hi–C) and that CRISPR/Cas9 enhancer targeting could further test risk-gene enhancer roles.
- The paper states that AD epigenetic changes may reflect either cellular composition changes or changes in regulatory landscape/cellular function, requiring future investigation.
- Evident from the text: Hi–C was based on only four DLPFC samples, and NeuN+/NeuN− fractions are broad cell classes rather than pure cell types; Glu/GABA regulatory maps were inferred by integrating subtype H3K27ac peaks with NeuN+ Hi–C rather than subtype Hi–C.
Model-written summary. Check it against the paper before relying on it.
Integrity signals
Registry
Cites
Statistics
Figures
Verification
Claims the paper makes
54 Own result · 45 Not checked yet · 22 Own interpretation · 3 Partly supported · 1 Supported · accuracy not yet measured
Every source the paper cites for this claim was checked and supports it.
In the paper
“Studies in AD have revealed changes in gene regulation manifested by differences in H3K27ac in bulk tissue38, but how this relates to cell-type-specific vulnerability is not known.”
§ Neuronal and glial 3D chromatin architecture informs the cellular etiology of brain disorders > Results > Cell-type-specific nature of AD-associated epigenetic dysregulation
What the sources say
- Supportedcites [38] Marzi, S. J. et al. A histone acetylome-wide association study of Alzheimer’s disease identifies disease-associated H3K27ac differences in the entorhinal cortex. Nat. Neurosci. 21, 1618–1627 (2018). source
The Discussion reports widespread AD-associated H3K27ac variation in post-mortem entorhinal cortex tissue samples and relates it to potential regulatory genomic pathways. The differential-acetylation section reports 4,162 peaks differing between AD cases and controls. These passages support the cited clause about H3K27ac differences in tissue; the subsequent statement about cell-type-specific vulnerability is not attributed to this source. (LLM, conf=0.93)
plaincorrelational- Asserted: passes — The authors put it forward as true.
- Checkable: passes — It can be checked against evidence.
- Load-bearing: passes — The paper’s conclusions depend on it.
- Based: passes — The paper gives a reason why it holds.
- Supported
The cited sources support only part of this claim — read each source’s verdict below.
In the paper
“Given that genetic correlation between SCZ and BD is remarkably high (rg = 0.67)46,53,54, these findings suggest cellular substrates for molecular convergence (Ex7 and In6 are shared between two disorders) and divergence (Ex1 is BD-specific, while Ex2 is SCZ-specific) among two highly genetically correlated disorders.”
§ Neuronal and glial 3D chromatin architecture informs the cellular etiology of brain disorders > Results > Refined cellular etiology of SCZ and BD
What the sources say
- Partly supportedcites [46] Sey, N. Y. A. et al. A computational tool (H-MAGMA) for improved prediction of brain-disorder risk genes by incorporating brain chromatin interaction profiles. Nat. Neurosci. https://doi.org/10.1038/s41593-020-0603-0 (2020). sourceExperimental — accuracy not yet measured
The Results section, “Shared genetic architecture among brain disorders” (page unavailable), reports strong gene-level overlap among adult-onset psychiatric disorders including BD and SCZ. Extended Data Fig. 7 also describes strong genetic relationships among psychiatric disorders. Our copy does not give an SCZ–BD genetic correlation of rg = 0.67; the reported 0.79 is a correlation between two methods of measuring genetic relationships, not the SCZ–BD value. (LLM, conf=0.85)
- Not checked yetcites [53] Brainstorm Consortium, The Brainstorm et al. Analysis of shared heritability in common disorders of the brain. Science 360, eaap8757 (2018).
- Partly supportedcites [54] Ruderfer, D. M. et al. Polygenic dissection of diagnosis and clinical dimensions of bipolar disorder and schizophrenia. Mol. Psychiatry 19, 1017–1024 (2014). sourceExperimental — accuracy not yet measured
The Introduction (page unavailable in our copy) describes a substantial genetic correlation between schizophrenia and bipolar disorder, and the Discussion describes them as genetically related. Our copy does not give the claimed estimate of rg = 0.67; searches for that value and for a genetic-correlation estimate did not find it. (LLM, conf=0.88)
plaincorrelational- Asserted: passes — The authors put it forward as true.
- Checkable: passes — It can be checked against evidence.
- Load-bearing: passes — The paper’s conclusions depend on it.
- Based: passes — The paper gives a reason why it holds.
- Partly supported
A result the paper reports from its own data — it cites no other source for it, so there is none to check. The quote shows it is in the paper.
In the paper
“Genes located in common FIREs were involved in housekeeping functions (e.g., microtubule polymerization, cell junction assembly) as well as pathways that involve both neurons and oligodendrocytes (e.g., main axon, Supplementary Data 1).”
§ Neuronal and glial 3D chromatin architecture informs the cellular etiology of brain disorders > Results > Differential FIREs and super-FIREs are associated with cell-type-specific gene regulation
plaincorrelational- Asserted: passes — The authors put it forward as true.
- Checkable: passes — It can be checked against evidence.
- Load-bearing: unclear — It is unclear whether the paper’s conclusions depend on it.
- Based: passes — The paper gives a reason why it holds.
A result the paper reports from its own data — it cites no other source for it, so there is none to check. The quote shows it is in the paper.
In the paper
“Among them, 1248 FIREs were shared between NeuN+ and NeuN− cells based on the coordinate-level overlap and similarities in FIRE scores (hereafter referred to as common FIREs, “Methods”, Supplementary Data 1).”
§ Neuronal and glial 3D chromatin architecture informs the cellular etiology of brain disorders > Results > Differential FIREs and super-FIREs are associated with cell-type-specific gene regulation
plaincorrelational- Asserted: passes — The authors put it forward as true.
- Checkable: passes — It can be checked against evidence.
- Load-bearing: passes — The paper’s conclusions depend on it.
- Based: passes — The paper gives a reason why it holds.
A result the paper reports from its own data — it cites no other source for it, so there is none to check. The quote shows it is in the paper.
In the paper
“A substantial fraction of chromatin interactions were distal, as ~50% of chromatin interactions brought two genomic regions linearly separated by 320 kb or more into close proximity (Supplementary Fig. 7c) and captured complex enhancer–promoter interactions.”
§ Neuronal and glial 3D chromatin architecture informs the cellular etiology of brain disorders > Results > Characteristics of chromatin interactions in NeuN+ and NeuN− cells
plain- Asserted: passes — The authors put it forward as true.
- Checkable: passes — It can be checked against evidence.
- Load-bearing: unclear — It is unclear whether the paper’s conclusions depend on it.
- Based: passes — The paper gives a reason why it holds.
A result the paper reports from its own data — it cites no other source for it, so there is none to check. The quote shows it is in the paper.
In the paper
“NeuN− distal enhancers were also enriched for motifs for the IRF family, such as IRF4, IRF7, IRF8, and IRF9 (Supplementary Fig. 7g), which contains key regulators of neural immune pathways expressed in glial cells31.”
§ Neuronal and glial 3D chromatin architecture informs the cellular etiology of brain disorders > Results > Characteristics of chromatin interactions in NeuN+ and NeuN− cells
plaincorrelational- Asserted: passes — The authors put it forward as true.
- Checkable: passes — It can be checked against evidence.
- Load-bearing: unclear — It is unclear whether the paper’s conclusions depend on it.
- Based: passes — The paper gives a reason why it holds.
A result the paper reports from its own data — it cites no other source for it, so there is none to check. The quote shows it is in the paper.
In the paper
“Over 75% of promoter-based interactions were detected within TADs (Supplementary Fig. 7a).”
§ Neuronal and glial 3D chromatin architecture informs the cellular etiology of brain disorders > Results > Characteristics of chromatin interactions in NeuN+ and NeuN− cells
plain- Asserted: passes — The authors put it forward as true.
- Checkable: passes — It can be checked against evidence.
- Load-bearing: unclear — It is unclear whether the paper’s conclusions depend on it.
- Based: passes — The paper gives a reason why it holds.
In the paper
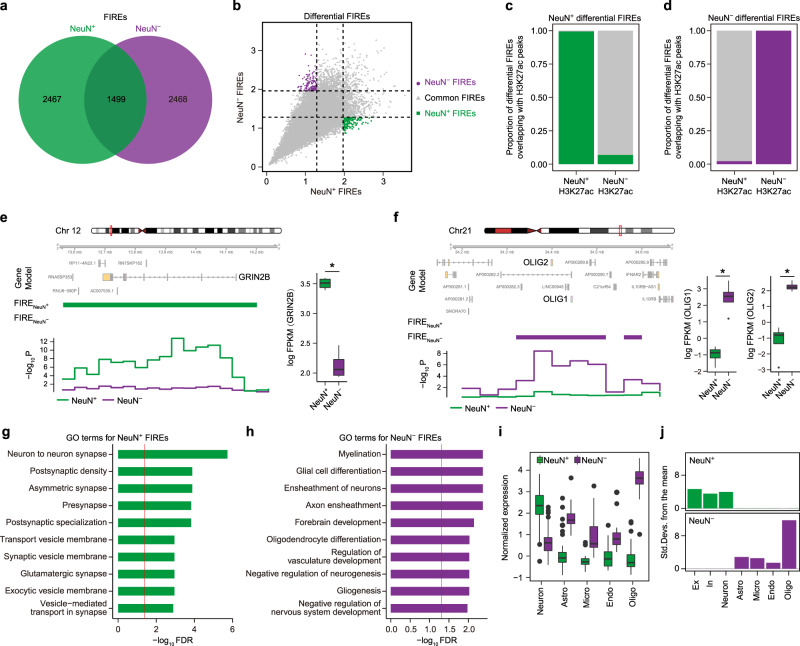
“We found that the majority of NeuN+ and NeuN− FIREs overlapped with NeuN+ and NeuN− differential H3K27ac peaks, respectively, displaying remarkable cell-type-specificity (Fig. 1c, d).”
§ Neuronal and glial 3D chromatin architecture informs the cellular etiology of brain disorders > Results > Differential FIREs and super-FIREs are associated with cell-type-specific gene regulation
What the sources say
- Not checked yetcites [27] Girdhar, K. et al. Cell-specific histone modification maps in the human frontal lobe link schizophrenia risk to the neuronal epigenome. Nat. Neurosci. 21, 1126–1136 (2018). source
plaincorrelational- Asserted: passes — The authors put it forward as true.
- Checkable: passes — It can be checked against evidence.
- Load-bearing: passes — The paper’s conclusions depend on it.
- Based: passes — The paper gives a reason why it holds.
A result the paper reports from its own data — it cites no other source for it, so there is none to check. The quote shows it is in the paper.
In the paper
“TFs involved in neuronal fate commitment, including ZBTB18, SMARCC1, TBR1, and NEUROD2, were enriched in NeuN+ cells (Supplementary Fig. 7g).”
§ Neuronal and glial 3D chromatin architecture informs the cellular etiology of brain disorders > Results > Characteristics of chromatin interactions in NeuN+ and NeuN− cells
plaincorrelational- Asserted: passes — The authors put it forward as true.
- Checkable: passes — It can be checked against evidence.
- Load-bearing: passes — The paper’s conclusions depend on it.
- Based: passes — The paper gives a reason why it holds.
None of the sources cited for this claim have been checked yet.
In the paper
“Notably, the number of enhancers that interact with promoters was strikingly correlated with gene regulation, as gene expression linearly increased with the number of physically interacting enhancers up to a total of 10 or more (Supplementary Fig. 7e)3,28.”
§ Neuronal and glial 3D chromatin architecture informs the cellular etiology of brain disorders > Results > Characteristics of chromatin interactions in NeuN+ and NeuN− cells
What the sources say
- Not checked yetcites [3] Wang, D. et al. Comprehensive functional genomic resource and integrative model for the human brain. Science 362, eaat8464 (2018).
- Not checked yetcites [28] Kozlenkov, A. et al. Evolution of regulatory signatures in primate cortical neurons at cell-type resolution. Proc. Natl Acad. Sci. USA 117, 28422–28432 (2020). source
boostedcorrelational- Asserted: passes — The authors put it forward as true.
- Checkable: passes — It can be checked against evidence.
- Load-bearing: unclear — It is unclear whether the paper’s conclusions depend on it.
- Based: passes — The paper gives a reason why it holds.
- It may state two separate claims as one. 51
- Probably not a substantial claim. 7
The cited sources support only part of this claim — read each source’s verdict below.
In the paper
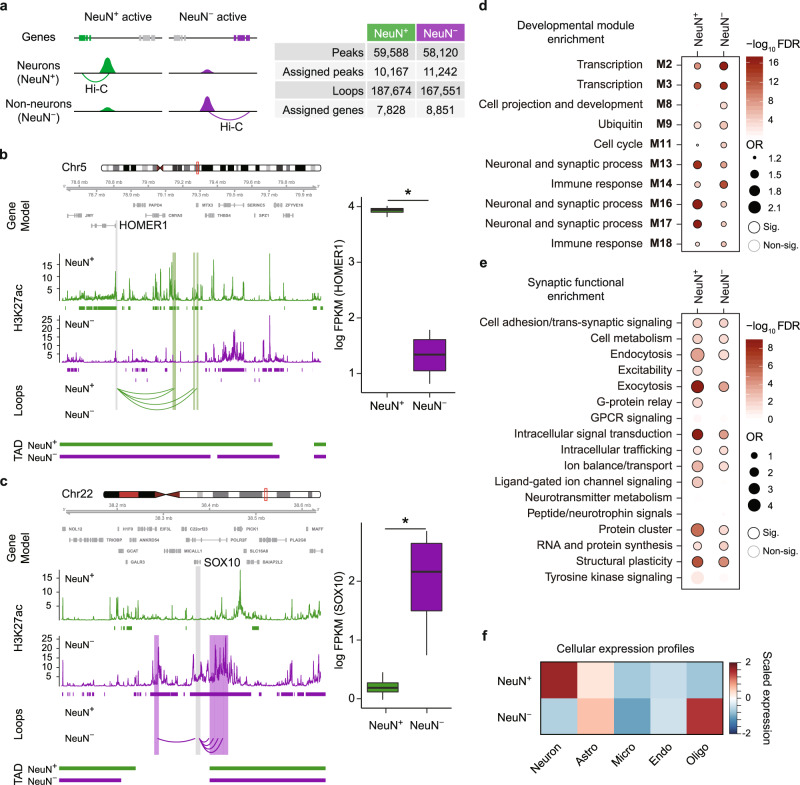
“We detected 187,674 and 167,551 promoter-based interactions3,4 from NeuN+ and NeuN− cells, respectively (Fig. 2a).”
§ Neuronal and glial 3D chromatin architecture informs the cellular etiology of brain disorders > Results > Characteristics of chromatin interactions in NeuN+ and NeuN− cells
What the sources say
- Not checked yetcites [3] Wang, D. et al. Comprehensive functional genomic resource and integrative model for the human brain. Science 362, eaat8464 (2018).
- Partly supportedcites [4] Won, H. et al. Chromosome conformation elucidates regulatory relationships in developing human brain. Nature 538, 523–527 (2016). sourceExperimental — accuracy not yet measured
The Methods section (‘Identification of Hi-C interacting regions’; page unavailable) describes identifying enhancer–promoter interactions, so the source supports the general type of interaction cited. It does not report 187,674 interactions in NeuN+ cells or 167,551 in NeuN− cells; searches for both the counts and NeuN terminology found no supporting passage. The citing sentence presents those counts as its authors’ own detections. (LLM, conf=0.82)
plain- Asserted: passes — The authors put it forward as true.
- Checkable: passes — It can be checked against evidence.
- Load-bearing: unclear — It is unclear whether the paper’s conclusions depend on it.
- Based: passes — The paper gives a reason why it holds.
It may state two separate claims as one.
The cited sources support only part of this claim — read each source’s verdict below.
In the paper
“In contrast to AD in which multiple glial cells are implicated, previous work has indicated neurons as the central cell-type harboring genetic risk for the majority of psychiatric disorders3,22,46,58–61.”
§ Neuronal and glial 3D chromatin architecture informs the cellular etiology of brain disorders > Discussion
What the sources say
- Not checked yetcites [3] Wang, D. et al. Comprehensive functional genomic resource and integrative model for the human brain. Science 362, eaat8464 (2018).
- Partly supportedcites [22] Polioudakis, D. et al. A single-cell transcriptomic atlas of human neocortical development during mid-gestation. Neuron 103, 785–801.e8 (2019). sourceExperimental — accuracy not yet measured
The Cellular Determinants of Disease section (p. 11) reports that most ASD risk genes were expressed in developing glutamatergic neurons; the discussion on p. 11 reports similar neuronal findings for epilepsy and enrichment in neurons for intellectual disability. But the paper does not establish that neurons are the central risk-bearing cell type for the majority of psychiatric disorders. Its schizophrenia analysis (p. 13) also implicates progenitors, OPCs, and microglia. (LLM, conf=0.87)
- Supportedcites [46] Sey, N. Y. A. et al. A computational tool (H-MAGMA) for improved prediction of brain-disorder risk genes by incorporating brain chromatin interaction profiles. Nat. Neurosci. https://doi.org/10.1038/s41593-020-0603-0 (2020). source
The Results section, under “Cell-type specificity” (page not provided), reports that psychiatric disorder-associated genes coalesced in neurons, in contrast to degenerative disorder-associated genes, which were highly expressed in glia. It also reports excitatory-neuron enrichment across development, supporting the cited contrast. (LLM, conf=0.91)
- Partly supportedcites [58] Satterstrom, F. K. et al. Large-scale exome sequencing study implicates both developmental and functional changes in the neurobiology of autism. Cell. https://doi.org/10.1016/j.cell.2019.12.036 (2020). sourceExperimental — accuracy not yet measured
The section “ASD Genes Are Enriched in Maturing Inhibitory and Excitatory Neurons” (p. 13) reports enrichment of ASD risk genes in neuronal lineages. It does not establish that neurons harbor genetic risk for the majority of psychiatric disorders; the finding presented here is specific to ASD. (LLM, conf=0.87)
- Partly supportedcites [59] Gandal, M. J. et al. Transcriptome-wide isoform-level dysregulation in ASD, schizophrenia, and bipolar disorder. Science 362, eaat8127 (2018). sourceExperimental — accuracy not yet measured
In “Neuronal Isoform Networks Capture Disease Specificity” (page not available), the paper reports genetic-risk enrichment in a neuronal module for schizophrenia, bipolar disorder, and major depressive disorder, consistent with a role for neurons in psychiatric risk. It does not establish neurons as the central cell type harboring genetic risk for the majority of psychiatric disorders; the Discussion also describes glial alterations. (LLM, conf=0.84)
- Partly supportedcites [60] Ruzzo, E. K. et al. Inherited and de novo genetic risk for autism impacts shared networks. Cell 178, 850–866.e26 (2019). sourceExperimental — accuracy not yet measured
The Results (page unavailable) report enrichment of ASD-risk genes in mid-gestation and adult glutamatergic projection neurons. That supports a neuronal role in autism genetic risk, but this paper does not establish that neurons are the central cell type harboring risk for the majority of psychiatric disorders. (LLM, conf=0.86)
- Not checked yetcites [61] Skene, N. G. et al. Genetic identification of brain cell types underlying schizophrenia. Nat. Genet. 50, 825–833 (2018). source
hedgedcorrelational- Asserted: passes — The authors put it forward as true.
- Checkable: passes — It can be checked against evidence.
- Load-bearing: passes — The paper’s conclusions depend on it.
- Based: passes — The paper gives a reason why it holds.
Probably not a substantial claim.
A result the paper reports from its own data — it cites no other source for it, so there is none to check. The quote shows it is in the paper.
In the paper
“Over 95% of super-FIREs overlapped with differential H3K27ac peaks and all super-FIREs overlapped with promoters, indicating that they have a particularly strong cell-type-specific regulatory impact (Supplementary Fig. 5b, c).”
§ Neuronal and glial 3D chromatin architecture informs the cellular etiology of brain disorders > Results > Differential FIREs and super-FIREs are associated with cell-type-specific gene regulation
plaincorrelational- Asserted: passes — The authors put it forward as true.
- Checkable: passes — It can be checked against evidence.
- Load-bearing: passes — The paper’s conclusions depend on it.
- Based: passes — The paper gives a reason why it holds.
It may state two separate claims as one.
A result the paper reports from its own data — it cites no other source for it, so there is none to check. The quote shows it is in the paper.
In the paper
“We detected extensive compartment switching between NeuN+ and NeuN− cells: 4,333 regions (in 100kb resolution) switched from compartment A to B between NeuN− to NeuN+ cells, while 2098 regions switched from compartment B to A in NeuN+ to NeuN− cells.”
§ Neuronal and glial 3D chromatin architecture informs the cellular etiology of brain disorders > Results > Differential FIREs and super-FIREs are associated with cell-type-specific gene regulation
plaincorrelational- Asserted: passes — The authors put it forward as true.
- Checkable: passes — It can be checked against evidence.
- Load-bearing: passes — The paper’s conclusions depend on it.
- Based: passes — The paper gives a reason why it holds.
It may state two separate claims as one.
A result the paper reports from its own data — it cites no other source for it, so there is none to check. The quote shows it is in the paper.
In the paper
“Only 9 super-FIREs were detected in both NeuN+ and NeuN− cells, leaving 253 and 157 cell-type-specific super-FIREs in NeuN+ and NeuN− cells, respectively (Supplementary Fig. 5a, Supplementary Data 2).”
§ Neuronal and glial 3D chromatin architecture informs the cellular etiology of brain disorders > Results > Differential FIREs and super-FIREs are associated with cell-type-specific gene regulation
plain- Asserted: passes — The authors put it forward as true.
- Checkable: passes — It can be checked against evidence.
- Load-bearing: passes — The paper’s conclusions depend on it.
- Based: passes — The paper gives a reason why it holds.
It may state two separate claims as one.
A result the paper reports from its own data — it cites no other source for it, so there is none to check. The quote shows it is in the paper.
In the paper
“detecting 287 differential FIREs between NeuN+ (145) and NeuN− (142) cells (hereby referred to as NeuN+ and NeuN− FIREs, respectively, Fig. 1b, Supplementary Data 2).”
§ Neuronal and glial 3D chromatin architecture informs the cellular etiology of brain disorders > Results > Differential FIREs and super-FIREs are associated with cell-type-specific gene regulation
plain- Asserted: passes — The authors put it forward as true.
- Checkable: passes — It can be checked against evidence.
- Load-bearing: passes — The paper’s conclusions depend on it.
- Based: passes — The paper gives a reason why it holds.
It may state two separate claims as one.
In the paper
“We detected 3966 and 3967 FIREs in NeuN+ and NeuN− cells, respectively (Fig. 1a and Supplementary Data 1)24.”
§ Neuronal and glial 3D chromatin architecture informs the cellular etiology of brain disorders > Results > Differential FIREs and super-FIREs are associated with cell-type-specific gene regulation
What the sources say
- Not checked yetcites [24] Crowley, C. et al. FIREcaller: detecting frequently interacting regions from Hi-C data. Comput. Struct. Biotechnol. J. 19, 355–362 (2021). source
plain- Asserted: passes — The authors put it forward as true.
- Checkable: passes — It can be checked against evidence.
- Load-bearing: unclear — It is unclear whether the paper’s conclusions depend on it.
- Based: passes — The paper gives a reason why it holds.
It may state two separate claims as one.
A result the paper reports from its own data — it cites no other source for it, so there is none to check. The quote shows it is in the paper.
In the paper
“Importantly, genes located in compartments that switch from A to B between NeuN− and NeuN+ were highly expressed in oligodendrocytes and astrocytes, while those that switch from B to A in NeuN− to NeuN+ were highly expressed in neurons, suggesting that the difference in chromosome conformation between NeuN+ and NeuN− cells is associated with cell-type-specific gene regulation (Supplementary Fig. 3”
§ Neuronal and glial 3D chromatin architecture informs the cellular etiology of brain disorders > Results > Differential FIREs and super-FIREs are associated with cell-type-specific gene regulation
hedgedcorrelational- Asserted: passes — The authors put it forward as true.
- Checkable: passes — It can be checked against evidence.
- Load-bearing: passes — The paper’s conclusions depend on it.
- Based: passes — The paper gives a reason why it holds.
It may state two separate claims as one.
A result the paper reports from its own data — it cites no other source for it, so there is none to check. The quote shows it is in the paper.
In the paper
“NeuN+ super-FIREs overlapped with genes functioning in synapses and ion gated channels that were highly expressed in neurons, while NeuN− super-FIREs overlapped with genes involved in cell adhesion, myelination, and ensheathment of neurons, with high expression in glia (Supplementary Fig. 5d-f, 6).”
§ Neuronal and glial 3D chromatin architecture informs the cellular etiology of brain disorders > Results > Differential FIREs and super-FIREs are associated with cell-type-specific gene regulation
plaincorrelational- Asserted: passes — The authors put it forward as true.
- Checkable: passes — It can be checked against evidence.
- Load-bearing: passes — The paper’s conclusions depend on it.
- Based: passes — The paper gives a reason why it holds.
It may state two separate claims as one.
A result the paper reports from its own data — it cites no other source for it, so there is none to check. The quote shows it is in the paper.
In the paper
“NeuN+ cells showed high similarity with adult brains, fetal brains, and iPSC-derived neurons.”
§ Neuronal and glial 3D chromatin architecture informs the cellular etiology of brain disorders > Results > Differential FIREs and super-FIREs are associated with cell-type-specific gene regulation
plaincorrelational- Asserted: passes — The authors put it forward as true.
- Checkable: passes — It can be checked against evidence.
- Load-bearing: unclear — It is unclear whether the paper’s conclusions depend on it.
- Based: passes — The paper gives a reason why it holds.
It may state two separate claims as one.
A result the paper reports from its own data — it cites no other source for it, so there is none to check. The quote shows it is in the paper.
In the paper
“Roughly 37% of interactions occurred between enhancers and promoters and ~23% of interactions occurred between two different promoters (Supplementary Fig. 7b).”
§ Neuronal and glial 3D chromatin architecture informs the cellular etiology of brain disorders > Results > Characteristics of chromatin interactions in NeuN+ and NeuN− cells
plain- Asserted: passes — The authors put it forward as true.
- Checkable: passes — It can be checked against evidence.
- Load-bearing: unclear — It is unclear whether the paper’s conclusions depend on it.
- Based: passes — The paper gives a reason why it holds.
It may state two separate claims as one.
A result the paper reports from its own data — it cites no other source for it, so there is none to check. The quote shows it is in the paper.
In the paper
“Salient examples include GRIN2B, which overlaps with a NeuN+ FIRE, and OLIG1 and OLIG2, which overlap with a NeuN− FIRE (Fig. 1e, f, Supplementary Fig. 4).”
§ Neuronal and glial 3D chromatin architecture informs the cellular etiology of brain disorders > Results > Differential FIREs and super-FIREs are associated with cell-type-specific gene regulation
plaincorrelational- Asserted: passes — The authors put it forward as true.
- Checkable: passes — It can be checked against evidence.
- Load-bearing: unclear — It is unclear whether the paper’s conclusions depend on it.
- Based: passes — The paper gives a reason why it holds.
It may state two separate claims as one.
A result the paper reports from its own data — it cites no other source for it, so there is none to check. The quote shows it is in the paper.
In the paper
“Indeed, NeuN+ FIREs overlapped with neuronal genes that were enriched for synaptic function (Fig. 1g), while NeuN− FIREs overlapped with genes involved in myelination, glial differentiation, and oligodendrocyte differentiation (Fig. 1h).”
§ Neuronal and glial 3D chromatin architecture informs the cellular etiology of brain disorders > Results > Differential FIREs and super-FIREs are associated with cell-type-specific gene regulation
plaincorrelational- Asserted: passes — The authors put it forward as true.
- Checkable: passes — It can be checked against evidence.
- Load-bearing: passes — The paper’s conclusions depend on it.
- Based: passes — The paper gives a reason why it holds.
It may state two separate claims as one.
A result the paper reports from its own data — it cites no other source for it, so there is none to check. The quote shows it is in the paper.
In the paper
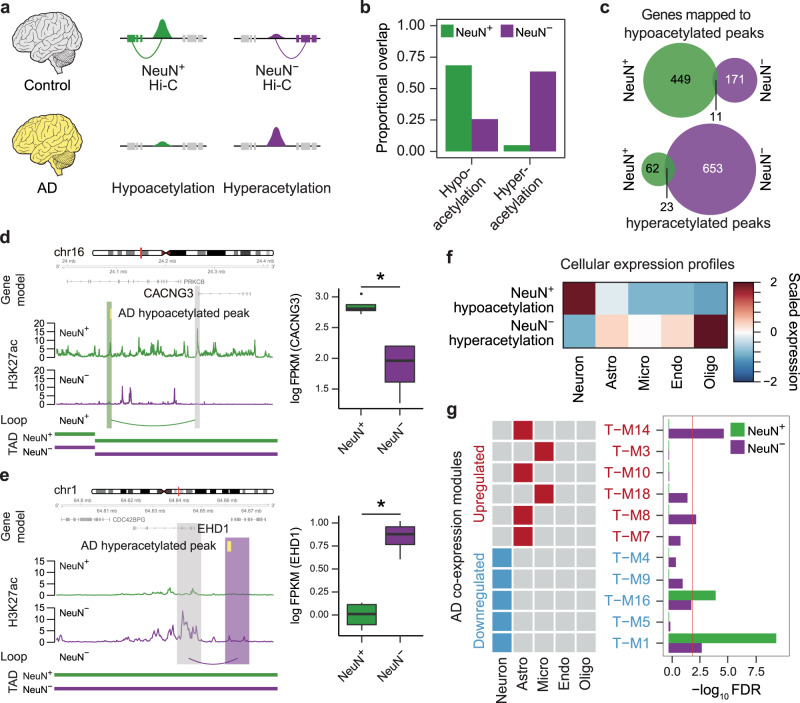
“We were able to link hypoacetylated peaks in AD to 460 genes using NeuN+ Hi–C data and hyperacetylated peaks in AD to 676 genes using NeuN− Hi–C data (hereby referred to as NeuN+ hypo- and NeuN− hyperacetylated genes, respectively, Fig. 3c, Supplementary Data 5).”
§ Neuronal and glial 3D chromatin architecture informs the cellular etiology of brain disorders > Results > Cell-type-specific nature of AD-associated epigenetic dysregulation
plaincorrelational- Asserted: passes — The authors put it forward as true.
- Checkable: passes — It can be checked against evidence.
- Load-bearing: passes — The paper’s conclusions depend on it.
- Based: passes — The paper gives a reason why it holds.
It may state two separate claims as one.
None of the sources cited for this claim have been checked yet.
In the paper
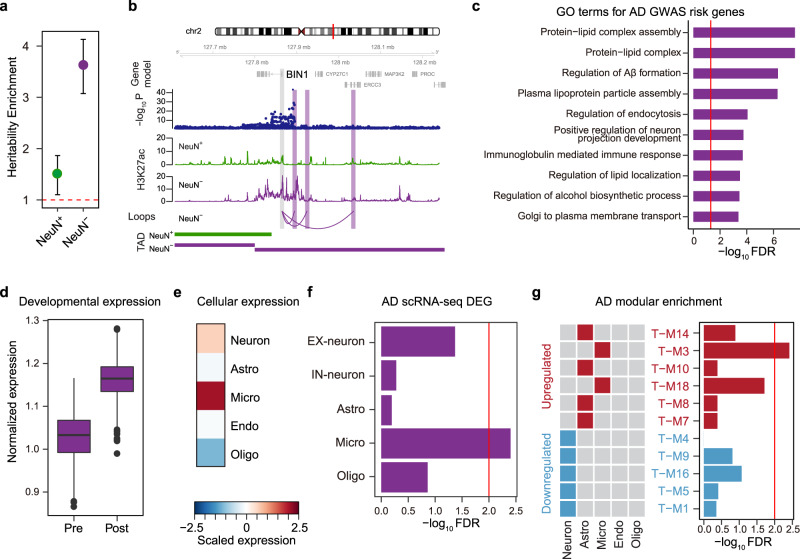
“Consistent with previous studies16,42,49, these genes were highly expressed in the postnatal brain samples (Fig. 4d) and microglia (Fig. 4e).”
§ Neuronal and glial 3D chromatin architecture informs the cellular etiology of brain disorders > Results > Genetic risk factors associated with AD converge onto microglial function
What the sources say
- Not checked yetcites [16] Nott, A. et al. Brain cell type–specific enhancer–promoter interactome maps and disease-risk association. Science 366, 1134–1139 (2019). source
- Not checked yetcites [42] Lambert, J. C. et al. Meta-analysis of 74,046 individuals identifies 11 new susceptibility loci for Alzheimer’s disease. Nat. Genet. 45, 1452–1458 (2013). source
- Not checked yetcites [49] Jansen, I. E. et al. Genome-wide meta-analysis identifies new loci and functional pathways influencing Alzheimer’s disease risk. Nat. Genet. 51, 404–413 (2019). source
plaincorrelational- Asserted: passes — The authors put it forward as true.
- Checkable: passes — It can be checked against evidence.
- Load-bearing: passes — The paper’s conclusions depend on it.
- Based: passes — The paper gives a reason why it holds.
It may state two separate claims as one.
In the paper
“For example, a gene that encodes a synaptic scaffolding protein, HOMER132, was engaged in NeuN+ specific peaks and loops and its expression was significantly higher in NeuN+ cells compared with NeuN− cells (Fig. 2b).”
§ Neuronal and glial 3D chromatin architecture informs the cellular etiology of brain disorders > Results > Characteristics of chromatin interactions in NeuN+ and NeuN− cells
What the sources say
- Not checked yetcites [32] Tu, J. C. et al. Homer binds a novel proline-rich motif and links group 1 metabotropic glutamate receptors with IP3 receptors. Neuron 21, 717–726 (1998). source
plaincorrelational- Asserted: passes — The authors put it forward as true.
- Checkable: passes — It can be checked against evidence.
- Load-bearing: unclear — It is unclear whether the paper’s conclusions depend on it.
- Based: passes — The paper gives a reason why it holds.
It may state two separate claims as one.
A result the paper reports from its own data — it cites no other source for it, so there is none to check. The quote shows it is in the paper.
In the paper
“We obtained 45,911 Glu-specific and 32,169 GABA-specific H3K27ac peaks and assigned them to 6234 and 4342 genes, respectively (Supplementary Fig. 8a, Supplementary Data 4).”
§ Neuronal and glial 3D chromatin architecture informs the cellular etiology of brain disorders > Results > Enhancer–promoter interactions in glutamatergic and GABAergic neurons
plaincorrelational- Asserted: passes — The authors put it forward as true.
- Checkable: passes — It can be checked against evidence.
- Load-bearing: passes — The paper’s conclusions depend on it.
- Based: passes — The paper gives a reason why it holds.
It may state two separate claims as one.
A result the paper reports from its own data — it cites no other source for it, so there is none to check. The quote shows it is in the paper.
In the paper
“Lastly, genes assigned to NeuN+ specific peaks were more highly expressed in neurons, while those assigned to NeuN− specific peaks were highly expressed in oligodendrocytes and astrocytes (Fig. 2f), demonstrating the tight relationship between cell-type-specific chromatin architecture and expression signature.”
§ Neuronal and glial 3D chromatin architecture informs the cellular etiology of brain disorders > Results > Characteristics of chromatin interactions in NeuN+ and NeuN− cells
boostedcorrelational- Asserted: passes — The authors put it forward as true.
- Checkable: passes — It can be checked against evidence.
- Load-bearing: passes — The paper’s conclusions depend on it.
- Based: passes — The paper gives a reason why it holds.
It may state two separate claims as one.
A result the paper reports from its own data — it cites no other source for it, so there is none to check. The quote shows it is in the paper.
In the paper
“In line with these findings, NeuN+ enhancer–promoter interactions were enriched for synaptic and axonal genes, whereas NeuN− enhancer–promoter interactions were associated with actin-based motility (Supplementary Data 3).”
§ Neuronal and glial 3D chromatin architecture informs the cellular etiology of brain disorders > Results > Characteristics of chromatin interactions in NeuN+ and NeuN− cells
plaincorrelational- Asserted: passes — The authors put it forward as true.
- Checkable: passes — It can be checked against evidence.
- Load-bearing: passes — The paper’s conclusions depend on it.
- Based: passes — The paper gives a reason why it holds.
It may state two separate claims as one.
A result the paper reports from its own data — it cites no other source for it, so there is none to check. The quote shows it is in the paper.
In the paper
“GO analysis demonstrated that NeuN+ hypoacetylated genes included synaptic genes while NeuN− hyperacetylated genes were involved in catalytic activity and glycoprotein binding (Supplementary Data 5).”
§ Neuronal and glial 3D chromatin architecture informs the cellular etiology of brain disorders > Results > Cell-type-specific nature of AD-associated epigenetic dysregulation
boostedcorrelational- Asserted: passes — The authors put it forward as true.
- Checkable: passes — It can be checked against evidence.
- Load-bearing: passes — The paper’s conclusions depend on it.
- Based: passes — The paper gives a reason why it holds.
It may state two separate claims as one.
A result the paper reports from its own data — it cites no other source for it, so there is none to check. The quote shows it is in the paper.
In the paper
“Notably, the BIN1 promoter was connected to multiple enhancers in NeuN−, but not in NeuN+ cells, demonstrating the highly cell-type-specific gene regulatory landscape within the locus.”
§ Neuronal and glial 3D chromatin architecture informs the cellular etiology of brain disorders > Results > Genetic risk factors associated with AD converge onto microglial function
boostedcorrelational- Asserted: passes — The authors put it forward as true.
- Checkable: passes — It can be checked against evidence.
- Load-bearing: passes — The paper’s conclusions depend on it.
- Based: passes — The paper gives a reason why it holds.
It may state two separate claims as one.
In the paper
“These modules were involved in transcriptional regulation and cellular proliferation and were annotated as astrocyte-specific41.”
§ Neuronal and glial 3D chromatin architecture informs the cellular etiology of brain disorders > Results > Cell-type-specific nature of AD-associated epigenetic dysregulation
What the sources say
- Not checked yetcites [41] Seyfried, N. T. et al. A multi-network approach identifies protein-specific co-expression in asymptomatic and symptomatic Alzheimer’s disease. Cell Syst. 4, 60–72.e4 (2017). source
plaincorrelational- Asserted: passes — The authors put it forward as true.
- Checkable: passes — It can be checked against evidence.
- Load-bearing: passes — The paper’s conclusions depend on it.
- Based: passes — The paper gives a reason why it holds.
It may state two separate claims as one.
A result the paper reports from its own data — it cites no other source for it, so there is none to check. The quote shows it is in the paper.
In the paper
“Cellular expression profiles also confirmed these findings, as NeuN+ hypoacetylated genes were highly expressed in neurons, while NeuN− hyperacetylated genes were highly expressed in oligodendrocytes, astrocytes, and endothelial cells (Fig. 3f).”
§ Neuronal and glial 3D chromatin architecture informs the cellular etiology of brain disorders > Results > Cell-type-specific nature of AD-associated epigenetic dysregulation
plaincorrelational- Asserted: passes — The authors put it forward as true.
- Checkable: passes — It can be checked against evidence.
- Load-bearing: passes — The paper’s conclusions depend on it.
- Based: passes — The paper gives a reason why it holds.
It may state two separate claims as one.
In the paper
“In contrast, a glial gene, SOX1033, was engaged in NeuN− specific H3K27ac peaks and Hi–C loops, and had higher expression in NeuN− cells than in NeuN+ cells (Fig. 2c).”
§ Neuronal and glial 3D chromatin architecture informs the cellular etiology of brain disorders > Results > Characteristics of chromatin interactions in NeuN+ and NeuN− cells
What the sources say
- Not checked yetcites [33] Kuhlbrodt, K., Herbarth, B., Sock, E., Hermans-Borgmeyer, I. & Wegner, M. Sox10, a novel transcriptional modulator in glial cells. J. Neurosci. 18, 237–250 (1998). source
plaincorrelational- Asserted: passes — The authors put it forward as true.
- Checkable: passes — It can be checked against evidence.
- Load-bearing: unclear — It is unclear whether the paper’s conclusions depend on it.
- Based: passes — The paper gives a reason why it holds.
It may state two separate claims as one.
A result the paper reports from its own data — it cites no other source for it, so there is none to check. The quote shows it is in the paper.
In the paper
“AD risk genes were enriched for amyloid−beta (Aβ) pathways, lipoprotein assembly, and immune processes (Fig. 4c, Supplementary Data 6).”
§ Neuronal and glial 3D chromatin architecture informs the cellular etiology of brain disorders > Results > Genetic risk factors associated with AD converge onto microglial function
plaincorrelational- Asserted: passes — The authors put it forward as true.
- Checkable: passes — It can be checked against evidence.
- Load-bearing: passes — The paper’s conclusions depend on it.
- Based: passes — The paper gives a reason why it holds.
It may state two separate claims as one.
A result the paper reports from its own data — it cites no other source for it, so there is none to check. The quote shows it is in the paper.
In the paper
“Genes assigned to Glu peaks were highly expressed in excitatory neurons, such as layers (L)2/3 pyramidal neurons (Ex1) and L5/6 corticothalamic projection neurons (Ex7), while genes assigned to GABA peaks were highly expressed in inhibitory neurons, such as parvalbumin-expressing GABA interneurons (In6, Supplementary Fig. 8b, the definition of Ex1–8 and In1–8 neuronal subtypes is available in”
§ Neuronal and glial 3D chromatin architecture informs the cellular etiology of brain disorders > Results > Enhancer–promoter interactions in glutamatergic and GABAergic neurons
plaincorrelational- Asserted: passes — The authors put it forward as true.
- Checkable: passes — It can be checked against evidence.
- Load-bearing: passes — The paper’s conclusions depend on it.
- Based: passes — The paper gives a reason why it holds.
It may state two separate claims as one.
A result the paper reports from its own data — it cites no other source for it, so there is none to check. The quote shows it is in the paper.
In the paper
“EHD1 was both hyperacetylated and highly expressed in neurotypical NeuN− cells compared to NeuN+ cells.”
§ Neuronal and glial 3D chromatin architecture informs the cellular etiology of brain disorders > Results > Cell-type-specific nature of AD-associated epigenetic dysregulation
plaincorrelational- Asserted: passes — The authors put it forward as true.
- Checkable: passes — It can be checked against evidence.
- Load-bearing: passes — The paper’s conclusions depend on it.
- Based: passes — The paper gives a reason why it holds.
It may state two separate claims as one.
A result the paper reports from its own data — it cites no other source for it, so there is none to check. The quote shows it is in the paper.
In the paper
“We detected that AD-associated hyperacetylated peaks were largely active in NeuN− cells, while AD-associated hypoacetylated peaks were largely active in NeuN+ cells in neurotypical controls (Fig. 3b).”
§ Neuronal and glial 3D chromatin architecture informs the cellular etiology of brain disorders > Results > Cell-type-specific nature of AD-associated epigenetic dysregulation
plaincorrelational- Asserted: passes — The authors put it forward as true.
- Checkable: passes — It can be checked against evidence.
- Load-bearing: passes — The paper’s conclusions depend on it.
- Based: passes — The paper gives a reason why it holds.
It may state two separate claims as one.
A result the paper reports from its own data — it cites no other source for it, so there is none to check. The quote shows it is in the paper.
In the paper
“NeuN+ hypoacetylated genes include CACNG3, whose promoter formed a loop with a peak, which was preferentially active in NeuN+ cells and was hypoacetylated in postmortem AD brain.”
§ Neuronal and glial 3D chromatin architecture informs the cellular etiology of brain disorders > Results > Cell-type-specific nature of AD-associated epigenetic dysregulation
plaincorrelational- Asserted: passes — The authors put it forward as true.
- Checkable: passes — It can be checked against evidence.
- Load-bearing: passes — The paper’s conclusions depend on it.
- Based: passes — The paper gives a reason why it holds.
It may state two separate claims as one.
None of the sources cited for this claim have been checked yet.
In the paper
“GRIK4, a gene that encodes an ionotropic class of glutamate receptor36, displayed complex chromatin interactions with multiple Glu peaks. In contrast, GAD1, a gene that encodes a well-known cellular marker for inhibitory neurons37, was engaged in GABA peaks via chromatin interactions (Supplementary Fig. 8c).”
§ Neuronal and glial 3D chromatin architecture informs the cellular etiology of brain disorders > Results > Enhancer–promoter interactions in glutamatergic and GABAergic neurons
What the sources say
- Not checked yetcites [36] Szpirer, C. et al. The genes encoding the glutamate receptor subunits KA1 and KA2 (GRIK4 and GRIK5) are located on separate chromosomes in human, mouse, and rat. Proc. Natl Acad. Sci. USA 91, 11849–11853 (1994). source
- Not checked yetcites [37] Erlander, M. G., Tillakaratne, N. J., Feldblum, S., Patel, N. & Tobin, A. J. Two genes encode distinct glutamate decarboxylases. Neuron 7, 91–100 (1991). source
plaincorrelational- Asserted: passes — The authors put it forward as true.
- Checkable: passes — It can be checked against evidence.
- Load-bearing: unclear — It is unclear whether the paper’s conclusions depend on it.
- Based: passes — The paper gives a reason why it holds.
It may state two separate claims as one.
A result the paper reports from its own data — it cites no other source for it, so there is none to check. The quote shows it is in the paper.
In the paper
“We were able to assign 10,167 and 11,242 cell-type-specific H3K27ac peaks to 7828 and 8851 genes via chromatin interactions in NeuN+ and NeuN− cells, respectively (Fig. 2a, Supplementary Data 3).”
§ Neuronal and glial 3D chromatin architecture informs the cellular etiology of brain disorders > Results > Characteristics of chromatin interactions in NeuN+ and NeuN− cells
plaincorrelational- Asserted: passes — The authors put it forward as true.
- Checkable: passes — It can be checked against evidence.
- Load-bearing: passes — The paper’s conclusions depend on it.
- Based: passes — The paper gives a reason why it holds.
It may state two separate claims as one.
A result the paper reports from its own data — it cites no other source for it, so there is none to check. The quote shows it is in the paper.
In the paper
“Glu-BD genes were enriched for neurogenesis, cell adhesion molecules, and synapses, while GABA-BD genes were enriched for transcriptional regulation and NMDA receptor activity (Supplementary Data 7).”
§ Neuronal and glial 3D chromatin architecture informs the cellular etiology of brain disorders > Results > Refined cellular etiology of SCZ and BD
plaincorrelational- Asserted: passes — The authors put it forward as true.
- Checkable: passes — It can be checked against evidence.
- Load-bearing: passes — The paper’s conclusions depend on it.
- Based: passes — The paper gives a reason why it holds.
It may state two separate claims as one.
A result the paper reports from its own data — it cites no other source for it, so there is none to check. The quote shows it is in the paper.
In the paper
“It is of note that while AD-associated hyperacetylation was linked to oligodendrocyte genes and astrocyte co-expression modules, genetic risk factors for AD were mapped onto a different glial cell type, microglia.”
§ Neuronal and glial 3D chromatin architecture informs the cellular etiology of brain disorders > Discussion
plaincorrelational- Asserted: passes — The authors put it forward as true.
- Checkable: passes — It can be checked against evidence.
- Load-bearing: passes — The paper’s conclusions depend on it.
- Based: passes — The paper gives a reason why it holds.
It may state two separate claims as one.
A result the paper reports from its own data — it cites no other source for it, so there is none to check. The quote shows it is in the paper.
In the paper
“Notably, AD-associated hyperacetylation was enriched for glial enhancers that are associated with upregulation of astrocytic co-expression modules in AD, while AD-associated hypoacetylation was enriched for neuronal enhancers that potentially affect downregulation of a neuronal co-expression module in AD.”
§ Neuronal and glial 3D chromatin architecture informs the cellular etiology of brain disorders > Discussion
hedgedcorrelational- Asserted: passes — The authors put it forward as true.
- Checkable: passes — It can be checked against evidence.
- Load-bearing: passes — The paper’s conclusions depend on it.
- Based: passes — The paper gives a reason why it holds.
It may state two separate claims as one.
A result the paper reports from its own data — it cites no other source for it, so there is none to check. The quote shows it is in the paper.
In the paper
“obtaining 753 SCZ risk genes from Glu (hereby referred to as Glu-SCZ genes) and 624 risk genes from GABA-specific regulatory interactions integrated via H-MAGMA (GABA-SCZ genes) (Supplementary Data 7).”
§ Neuronal and glial 3D chromatin architecture informs the cellular etiology of brain disorders > Results > Refined cellular etiology of SCZ and BD
plaincorrelational- Asserted: passes — The authors put it forward as true.
- Checkable: passes — It can be checked against evidence.
- Load-bearing: passes — The paper’s conclusions depend on it.
- Based: passes — The paper gives a reason why it holds.
It may state two separate claims as one.
A result the paper reports from its own data — it cites no other source for it, so there is none to check. The quote shows it is in the paper.
In the paper
“The genome-wide analysis of chromosome conformation in these two cell classes captures the major known elements of 3D architecture such as compartments, FIREs, and loops, addressing the roles and impact of these different hierarchical units in cell-type-specific gene regulation.”
§ Neuronal and glial 3D chromatin architecture informs the cellular etiology of brain disorders > Discussion
plaincorrelationaln = 2- Asserted: passes — The authors put it forward as true.
- Checkable: passes — It can be checked against evidence.
- Load-bearing: passes — The paper’s conclusions depend on it.
- Based: passes — The paper gives a reason why it holds.
It may state two separate claims as one.
In the paper
“Glu-SCZ genes displayed widespread expression among many Glu neuronal subclasses, with relatively higher expression signatures in L3/4 neurons (Ex2) and L5/6 corticothalamic projection neurons (Ex7).”
§ Neuronal and glial 3D chromatin architecture informs the cellular etiology of brain disorders > Results > Refined cellular etiology of SCZ and BD
What the sources say
- Not checked yetcites [8] Lake, B. B. et al. Neuronal subtypes and diversity revealed by single-nucleus RNA sequencing of the human brain. Science 352, 1586–1590 (2016). source
plaincorrelational- Asserted: passes — The authors put it forward as true.
- Checkable: passes — It can be checked against evidence.
- Load-bearing: passes — The paper’s conclusions depend on it.
- Based: passes — The paper gives a reason why it holds.
It may state two separate claims as one.
A result the paper reports from its own data — it cites no other source for it, so there is none to check. The quote shows it is in the paper.
In the paper
“We also identified 143 and 101 BD candidate risk genes from Glu (Glu-BD genes) and GABA (GABA-BD genes) H-MAGMA, respectively (Supplementary Data 7).”
§ Neuronal and glial 3D chromatin architecture informs the cellular etiology of brain disorders > Results > Refined cellular etiology of SCZ and BD
plain- Asserted: passes — The authors put it forward as true.
- Checkable: passes — It can be checked against evidence.
- Load-bearing: passes — The paper’s conclusions depend on it.
- Based: passes — The paper gives a reason why it holds.
It may state two separate claims as one.
A result the paper reports from its own data — it cites no other source for it, so there is none to check. The quote shows it is in the paper.
In the paper
“We further refined maps of neuronal chromatin architecture by integrating Hi–C data from sorted neurons with H3K27ac peaks identified in two major neuronal subtypes, Glu and GABA neurons, which led to a successful delineation of neuronal subtype-specific regulatory relationships.”
§ Neuronal and glial 3D chromatin architecture informs the cellular etiology of brain disorders > Discussion
plaindirect- Asserted: passes — The authors put it forward as true.
- Checkable: passes — It can be checked against evidence.
- Load-bearing: passes — The paper’s conclusions depend on it.
- Based: passes — The paper gives a reason why it holds.
It may state two separate claims as one.
A result the paper reports from its own data — it cites no other source for it, so there is none to check. The quote shows it is in the paper.
In the paper
“Glu-SCZ genes were implicated in synaptic organization, ion channel activity, and neuron projection, while GABA-SCZ genes were associated with dendrite, axon, and hormonal response (Supplementary Data 7).”
§ Neuronal and glial 3D chromatin architecture informs the cellular etiology of brain disorders > Results > Refined cellular etiology of SCZ and BD
plaincorrelational- Asserted: passes — The authors put it forward as true.
- Checkable: passes — It can be checked against evidence.
- Load-bearing: passes — The paper’s conclusions depend on it.
- Based: passes — The paper gives a reason why it holds.
It may state two separate claims as one.
None of the sources cited for this claim have been checked yet.
In the paper
“It is also of note that common genetic risk for SCZ and BD also indicated shared pathways coalescing onto parvalbumin-positive interneurons, paralleling what has been among the most robust pathologic findings in SCZ and BD63,64.”
§ Neuronal and glial 3D chromatin architecture informs the cellular etiology of brain disorders > Discussion
What the sources say
- Not checked yetcites [63] Enwright Iii, J. F. et al. Transcriptome alterations of prefrontal cortical parvalbumin neurons in schizophrenia. Mol. Psychiatry 23, 1606–1613 (2018). source
- Not checked yetcites [64] Mellios, N. et al. Molecular determinants of dysregulated GABAergic gene expression in the prefrontal cortex of subjects with schizophrenia. Biol. Psychiatry 65, 1006–1014 (2009). source
hedgedcorrelational- Asserted: passes — The authors put it forward as true.
- Checkable: passes — It can be checked against evidence.
- Load-bearing: unclear — It is unclear whether the paper’s conclusions depend on it.
- Based: passes — The paper gives a reason why it holds.
It may state two separate claims as one.
In the paper
“The fact that NeuN+ cells show high similarity with fetal brain may reflect extensive neurogenesis at midgestation, the developmental stage at which the fetal brain was obtained22.”
§ Neuronal and glial 3D chromatin architecture informs the cellular etiology of brain disorders > Results > Differential FIREs and super-FIREs are associated with cell-type-specific gene regulation
What the sources say
- Not checked yetcites [22] Polioudakis, D. et al. A single-cell transcriptomic atlas of human neocortical development during mid-gestation. Neuron 103, 785–801.e8 (2019). source
hedgedconditional- Asserted: passes — The authors put it forward as true.
- Checkable: passes — It can be checked against evidence.
- Load-bearing: fails — The paper’s conclusions may not depend on it.
- Based: passes — The paper gives a reason why it holds.
Probably not a substantial claim. The paper’s conclusions may not depend on it.
A conclusion the paper draws from its own results — it cites no other source for it, so there is none to check. The quote shows it is in the paper.
In the paper
“Together, our results confirmed that gene expression was coordinately controlled by physical interactions of promoters with enhancers, indicative of transcriptional regulators that underlie cell-type-specific gene regulation.”
§ Neuronal and glial 3D chromatin architecture informs the cellular etiology of brain disorders > Results > Characteristics of chromatin interactions in NeuN+ and NeuN− cells
boosteddirect- Asserted: passes — The authors put it forward as true.
- Checkable: passes — It can be checked against evidence.
- Load-bearing: passes — The paper’s conclusions depend on it.
- Based: passes — The paper gives a reason why it holds.
It may state two separate claims as one.
None of the sources cited for this claim have been checked yet.
In the paper
“consistent with the previous findings that multiple enhancers can interact with one promoter3,7.”
§ Neuronal and glial 3D chromatin architecture informs the cellular etiology of brain disorders > Results > Characteristics of chromatin interactions in NeuN+ and NeuN− cells
What the sources say
- Not checked yetcites [3] Wang, D. et al. Comprehensive functional genomic resource and integrative model for the human brain. Science 362, eaat8464 (2018).
- Not checked yetcites [7] Jung, I. et al. A compendium of promoter-centered long-range chromatin interactions in the human genome. Nat. Genet. 51, 1442–1449 (2019). source
plaincorrelational- Asserted: passes — The authors put it forward as true.
- Checkable: passes — It can be checked against evidence.
- Load-bearing: fails — The paper’s conclusions may not depend on it.
- Based: passes — The paper gives a reason why it holds.
Probably not a substantial claim. The paper’s conclusions may not depend on it.
In the paper
“Notably, we found that samples were clustered by cell types, not individuals, and showed high correlation between the same cell types from different individuals (NeuN+ = 0.95–0.97; NeuN− = 0.86-0.91; Supplementary Fig. 3a), demonstrating the reproducibility across Hi–C libraries.”
§ Neuronal and glial 3D chromatin architecture informs the cellular etiology of brain disorders > Results > Differential FIREs and super-FIREs are associated with cell-type-specific gene regulation
What the sources say
- Not checked yetcites [19] Yang, T. et al. HiCRep: assessing the reproducibility of Hi-C data using a stratum-adjusted correlation coefficient. Genome Res. 27, 1939–1949 (2017). source
boostedcorrelational- Asserted: passes — The authors put it forward as true.
- Checkable: passes — It can be checked against evidence.
- Load-bearing: passes — The paper’s conclusions depend on it.
- Based: passes — The paper gives a reason why it holds.
It may state two separate claims as one.
In the paper
“Recently, promoter interaction profiles were inferred from three types of brain cells (neurons, oligodendrocytes, and microglia) obtained from the postnatal human cerebral cortex16.”
§ Neuronal and glial 3D chromatin architecture informs the cellular etiology of brain disorders > Introduction
What the sources say
- Not checked yetcites [16] Nott, A. et al. Brain cell type–specific enhancer–promoter interactome maps and disease-risk association. Science 366, 1134–1139 (2019). source
plain- Asserted: passes — The authors put it forward as true.
- Checkable: passes — It can be checked against evidence.
- Load-bearing: passes — The paper’s conclusions depend on it.
- Based: passes — The paper gives a reason why it holds.
Probably not a substantial claim.
A conclusion the paper draws from its own results — it cites no other source for it, so there is none to check. The quote shows it is in the paper.
In the paper
“These results collectively suggest that in AD brains, many neuronal genes are downregulated due to their hypoacetylation in neurons, whereas many glial genes are upregulated due to their hyperacetylation in glia.”
§ Neuronal and glial 3D chromatin architecture informs the cellular etiology of brain disorders > Results > Cell-type-specific nature of AD-associated epigenetic dysregulation
hedgeddirect- Asserted: passes — The authors put it forward as true.
- Checkable: passes — It can be checked against evidence.
- Load-bearing: passes — The paper’s conclusions depend on it.
- Based: passes — The paper gives a reason why it holds.
It may state two separate claims as one.
In the paper
“which contains key regulators of neural immune pathways expressed in glial cells31.”
§ Neuronal and glial 3D chromatin architecture informs the cellular etiology of brain disorders > Results > Characteristics of chromatin interactions in NeuN+ and NeuN− cells
What the sources say
- Not checked yetcites [31] Tamura, T., Yanai, H., Savitsky, D. & Taniguchi, T. The IRF family transcription factors in immunity and Oncogenesis. Annu. Rev. Immunol. 26, 535–584 (2008). source
plaincorrelational- Asserted: passes — The authors put it forward as true.
- Checkable: passes — It can be checked against evidence.
- Load-bearing: fails — The paper’s conclusions may not depend on it.
- Based: passes — The paper gives a reason why it holds.
Probably not a substantial claim. The paper’s conclusions may not depend on it.
A conclusion the paper draws from its own results — it cites no other source for it, so there is none to check. The quote shows it is in the paper.
In the paper
“Since genetic risk resides at the initiation of the causal chain in disease pathogenesis, this differential enrichment of genetic risk factors and epigenetic regulation underscores different expression signatures in AD with distinct cellular specificities and likely causal relationships.”
§ Neuronal and glial 3D chromatin architecture informs the cellular etiology of brain disorders > Results > Genetic risk factors associated with AD converge onto microglial function
hedgedconditional- Asserted: passes — The authors put it forward as true.
- Checkable: passes — It can be checked against evidence.
- Load-bearing: passes — The paper’s conclusions depend on it.
- Based: passes — The paper gives a reason why it holds.
It may state two separate claims as one.
- Rests on an assumption: Genetic risk resides at the initiation of the causal chain in disease pathogenesis.
None of the sources cited for this claim have been checked yet.
In the paper
“This is consistent with recent single-cell sequencing studies identifying genetic risk enrichment and gene expression changes within microglia in AD, accompanied by significant gene expression changes in other cells, including astrocytes50–52, which is where we observe epigenetic signature enrichment.”
§ Neuronal and glial 3D chromatin architecture informs the cellular etiology of brain disorders > Results > Genetic risk factors associated with AD converge onto microglial function
What the sources say
- Not checked yetcites [50] Mathys, H. et al. Single-cell transcriptomic analysis of Alzheimer’s disease. Nature 570, 332–337 (2019). source
- Not checked yetcites [51] Grubman, A. et al. A single-cell atlas of entorhinal cortex from individuals with Alzheimer’s disease reveals cell-type-specific gene expression regulation. Nat. Neurosci. 22, 2087–2097 (2019). source
- Not checked yetcites [52] Sala Frigerio, C. et al. The major risk factors for Alzheimer’s disease: age, sex, and genes modulate the microglia response to Aβ plaques. Cell Rep. 27, 1293–1306.e6 (2019). source
plaincorrelational- Asserted: passes — The authors put it forward as true.
- Checkable: passes — It can be checked against evidence.
- Load-bearing: passes — The paper’s conclusions depend on it.
- Based: passes — The paper gives a reason why it holds.
It may state two separate claims as one.
A conclusion the paper draws from its own results — it cites no other source for it, so there is none to check. The quote shows it is in the paper.
In the paper
“These results highlight the importance of obtaining cell-type-specific epigenetic landscapes in diseases.”
§ Neuronal and glial 3D chromatin architecture informs the cellular etiology of brain disorders > Discussion
plain- Asserted: passes — The authors put it forward as true.
- Checkable: fails — It may be too vague to check against evidence.
- Load-bearing: passes — The paper’s conclusions depend on it.
- Based: passes — The paper gives a reason why it holds.
Probably not a substantial claim. It may be too vague to check against evidence.
A conclusion the paper draws from its own results — it cites no other source for it, so there is none to check. The quote shows it is in the paper.
In the paper
“so this initial assignment is likely to be underpowered and inaccurate.”
§ Neuronal and glial 3D chromatin architecture informs the cellular etiology of brain disorders > Discussion
hedged- Asserted: passes — The authors put it forward as true.
- Checkable: passes — It can be checked against evidence.
- Load-bearing: passes — The paper’s conclusions depend on it.
- Based: passes — The paper gives a reason why it holds.
It may state two separate claims as one.
A conclusion the paper draws from its own results — it cites no other source for it, so there is none to check. The quote shows it is in the paper.
In the paper
“Furthermore, these peaks were obtained from the brain homogenates, which would mask opposing interactions and obscure the cell-type-specific substrate of these changes.”
§ Neuronal and glial 3D chromatin architecture informs the cellular etiology of brain disorders > Discussion
hedgeddirect- Asserted: passes — The authors put it forward as true.
- Checkable: passes — It can be checked against evidence.
- Load-bearing: passes — The paper’s conclusions depend on it.
- Based: passes — The paper gives a reason why it holds.
It may state two separate claims as one.
A conclusion the paper draws from its own results — it cites no other source for it, so there is none to check. The quote shows it is in the paper.
In the paper
“Here, we reasoned that neuronal subtype-specific gene regulatory networks would help refine the cellular etiology of disease and potentially identify discrete molecular neuropathology across psychiatric disorders.”
§ Neuronal and glial 3D chromatin architecture informs the cellular etiology of brain disorders > Discussion
hedgedconditional- Asserted: passes — The authors put it forward as true.
- Checkable: passes — It can be checked against evidence.
- Load-bearing: passes — The paper’s conclusions depend on it.
- Based: passes — The paper gives a reason why it holds.
Probably not a substantial claim. It may state two separate claims as one.
A conclusion the paper draws from its own results — it cites no other source for it, so there is none to check. The quote shows it is in the paper.
In the paper
“these findings suggest cellular substrates for molecular convergence (Ex7 and In6 are shared between two disorders) and divergence (Ex1 is BD-specific, while Ex2 is SCZ-specific) among two highly genetically correlated disorders.”
§ Neuronal and glial 3D chromatin architecture informs the cellular etiology of brain disorders > Results > Refined cellular etiology of SCZ and BD
hedgedcorrelational- Asserted: passes — The authors put it forward as true.
- Checkable: passes — It can be checked against evidence.
- Load-bearing: passes — The paper’s conclusions depend on it.
- Based: passes — The paper gives a reason why it holds.
It may state two separate claims as one.
In the paper
“In their original work, Marzi et al.38 reported AD-associated H3K27ac peaks that are either hypo- or hyperacetylated in AD-affected individuals compared to age-matched low-pathology controls38 and linked these peaks to target genes on the basis of linear distance.”
§ Neuronal and glial 3D chromatin architecture informs the cellular etiology of brain disorders > Discussion
What the sources say
- Not checked yetcites Marzi et al.38 Marzi, S. J. et al. A histone acetylome-wide association study of Alzheimer’s disease identifies disease-associated H3K27ac differences in the entorhinal cortex. Nat. Neurosci. 21, 1618–1627 (2018). source
plaincorrelational- Asserted: passes — The authors put it forward as true.
- Checkable: passes — It can be checked against evidence.
- Load-bearing: passes — The paper’s conclusions depend on it.
- Based: passes — The paper gives a reason why it holds.
It may state two separate claims as one.
A conclusion the paper draws from its own results — it cites no other source for it, so there is none to check. The quote shows it is in the paper.
In the paper
“Our study provides a foundation for such future study by characterizing cell-type-specific 3D chromatin structure in the adult human brain, which we show can be used to improve our understanding of gene regulatory landscape in brain disorders.”
§ Neuronal and glial 3D chromatin architecture informs the cellular etiology of brain disorders > Discussion
plaindirect- Asserted: passes — The authors put it forward as true.
- Checkable: passes — It can be checked against evidence.
- Load-bearing: passes — The paper’s conclusions depend on it.
- Based: passes — The paper gives a reason why it holds.
It may state two separate claims as one.
The paper relies on this without support.
Changes in gene expression or histone modifications may be a consequence or compensatory in disease and not necessarily causal.
“Changes in gene expression or histone modifications may be a consequence or compensatory in disease and not necessarily causal.”
The paper relies on this without support.
How AD-associated H3K27ac changes relate to cell-type-specific vulnerability is not known.
“Studies in AD have revealed changes in gene regulation manifested by differences in H3K27ac in bulk tissue38, but how this relates to cell-type-specific vulnerability is not known.”
The paper relies on this without support.
Hi-C data from neuronal subtypes is unavailable.
“Since Hi–C data from neuronal subtypes is yet unavailable, we constructed Glu and GABA H-MAGMA maps by integrating Glu- and GABA-enhancers with NeuN+ Hi–C data, respectively (“Methods”)”
The paper relies on this without support.
Genetic risk resides at the initiation of the causal chain in disease pathogenesis.
“Since genetic risk resides at the initiation of the causal chain in disease pathogenesis, this differential enrichment of genetic risk factors and epigenetic regulation underscores different expression signatures in AD with distinct cellular specificities and likely causal relationships.”
Claims other papers make about this one
Each is checked against this paper’s own text: does it say what the citing paper says it does?
In the citing paper
“The 3D genome plays an important role in neuronal gene expression and function”
From Neuronal DNA double-strand breaks lead to genome structural variations and 3D genome disruption in neurodegeneration (2023) · cites this paper as [97]
Self-check
Percentages, sums and reported differences re-computed from the paper’s own numbers.
Each contradiction between two passages listed here was confirmed by an independent check.
Rated minor: it would not touch a result — a value no result rests on, a p-value that stays on the same side of the significance level, or a conflict that is clerical, resolved elsewhere in the paper, or outside its own findings.
In the paper
§ Neuronal and glial 3D chromatin architecture informs the cellular etiology of brain disorders > Methods > FIRE analysis
“NeuN− differential FIREs were defined in the opposite way; NeuN− FIRE scores<qnorm (0.9) & NeuN+ FIRE scores>qnorm (0.95).”
§ Neuronal and glial 3D chromatin architecture informs the cellular etiology of brain disorders > Methods > FIRE analysis
“NeuN+ differential FIREs were identified by obtaining the genomic regions that have NeuN+ FIRE scores greater than qnorm (0.975) and NeuN− FIRE scores lower than qnorm (0.9).”
Rated minor: it would not touch a result — a value no result rests on, a p-value that stays on the same side of the significance level, or a conflict that is clerical, resolved elsewhere in the paper, or outside its own findings.
In the paper
§ Neuronal and glial 3D chromatin architecture informs the cellular etiology of brain disorders > Results > Refined cellular etiology of SCZ and BD
“Ex1 is BD-specific, while Ex2 is SCZ-specific”
§ Neuronal and glial 3D chromatin architecture informs the cellular etiology of brain disorders > Discussion
“discrete cellular substrates that may contribute to difference between BD (Ex1) and SCZ (Ex5)”
Rated minor: it would not touch a result — a value no result rests on, a p-value that stays on the same side of the significance level, or a conflict that is clerical, resolved elsewhere in the paper, or outside its own findings.
In the paper
§ Neuronal and glial 3D chromatin architecture informs the cellular etiology of brain disorders > Results > Differential FIREs and super-FIREs are associated with cell-type-specific gene regulation
“2098 regions switched from compartment B to A in NeuN+ to NeuN− cells.”
§ Neuronal and glial 3D chromatin architecture informs the cellular etiology of brain disorders > Results > Differential FIREs and super-FIREs are associated with cell-type-specific gene regulation
“those that switch from B to A in NeuN− to NeuN+ were highly expressed in neurons”
Citations
Cites
Moderated estimation of fold change and dispersion for RNA-seq data with DESeq2
Love, M. I., Huber, W., & Anders, S. (2014) · Genome Biology · doi:10.1186/s13059-014-0550-8 · Cited by 95,106
Fast gapped-read alignment with Bowtie 2
Langmead, B., & Salzberg, S. L. (2012) · Nature Methods · doi:10.1038/nmeth.1923 · Cited by 56,400
Cutadapt removes adapter sequences from high-throughput sequencing reads
Martin, M. (2011) · EMBnet.journal · doi:10.14806/ej.17.1.200 · Cited by 33,889
Model-based Analysis of ChIP-Seq (MACS)
Zhang, Y., Liu, T., Meyer, C. A., Eeckhoute, J., Johnson, D. S., Bernstein, B. E., Nusbaum, C., Myers, R. M., Brown, M., Li, W., et al. (2008) · Genome Biology · doi:10.1186/gb-2008-9-9-r137 · Cited by 18,386
Self-citationGraph-based genome alignment and genotyping with HISAT2 and HISAT-genotype
Kim, D., Paggi, J. M., Park, C., Bennett, C., & Salzberg, S. L. (2019) · Nature Biotechnology · doi:10.1038/s41587-019-0201-4 · Cited by 15,022
StringTie enables improved reconstruction of a transcriptome from RNA-seq reads
Pertea, M., Pertea, G. M., Antonescu, C. M., Chang, T.-C., Mendell, J. T., & Salzberg, S. L. (2015) · Nature Biotechnology · doi:10.1038/nbt.3122 · Cited by 14,406
Neurotoxic reactive astrocytes are induced by activated microglia
Liddelow, S. A., Guttenplan, K. A., Clarke, L. E., Bennett, F. C., Bohlen, C. J., Schirmer, L., Bennett, M. L., Münch, A. E., Chung, W.-S., Peterson, T. C., et al. (2017) · Nature · doi:10.1038/nature21029 · Cited by 7,971
Topological domains in mammalian genomes identified by analysis of chromatin interactions
Dixon, J. R., Selvaraj, S., Yue, F., Kim, A., Li, Y., Shen, Y., Hu, M., Liu, J. S., & Ren, B. (2012) · Nature · doi:10.1038/nature11082 · Cited by 6,829
Integrative analysis of 111 reference human epigenomes
Roadmap Epigenomics Consortium, Kundaje, A., Meuleman, W., Ernst, J., Bilenky, M., Yen, A., Heravi-Moussavi, A., Kheradpour, P., Zhang, Z., Wang, J., et al. (2015) · Nature · doi:10.1038/nature14248 · Cited by 6,368
Self-citationREVIGO summarizes and visualizes long lists of gene ontology terms
Supek, F., Bošnjak, M., Škunca, N., & Šmuc, T. (2011) · PLoS ONE · doi:10.1371/journal.pone.0021800 · Cited by 6,264
Raudvere, U., Kolberg, L., Kuzmin, I., Arak, T., Adler, P., Peterson, H., & Vilo, J. (2019) · Nucleic Acids Research · doi:10.1093/nar/gkz369 · Cited by 5,045
Meta-Analysis of 74,046 Individuals Identifies 11 New Susceptibility Loci for Alzheimer’s Disease
(EADI), E. A. D. I., Lambert, J.-C., (GERAD), G. A. E. R. I. A. D., Alzheimer's Disease Genetic Consortium (ADGC), (CHARGE), C. F. H. A. A. R. I. G. E., Ibrahim-Verbaas, C. A., Harold, D., Naj, A. C., Sims, R., Bellenguez, C., et al. (2013) · Nature Genetics · doi:10.1038/ng.2802 · Cited by 4,336
Partitioning heritability by functional annotation using genome-wide association summary statistics
ReproGen Consortium, Finucane, H. K., Schizophrenia Working Group of the Psychiatric Genomics Consortium, The RACI Consortium, Bulik-Sullivan, B., Gusev, A., Trynka, G., Reshef, Y., Loh, P.-R., Anttila, V., et al. (2015) · Nature Genetics · doi:10.1038/ng.3404 · Cited by 2,604
Self-citationSingle-cell transcriptomic analysis of Alzheimer’s disease
Mathys, H., Davila-Velderrain, J., Peng, Z., Gao, F., Mohammadi, S., Young, J. Z., Menon, M., He, L., Abdurrob, F., Jiang, X., et al. (2019) · Nature · doi:10.1038/s41586-019-1195-2 · Cited by 2,568
fitdistrplus : An R Package for Fitting Distributions
Delignette‐Muller, M. L., & Dutang, C. (2015) · Journal of Statistical Software · doi:10.18637/jss.v064.i04 · Cited by 2,391
Satterstrom, F. K., Kosmicki, J. A., Wang, J., Breen, M. S., De Rubeis, S., An, J.-Y., Peng, M., Collins, R., Grove, J., Klei, L., et al. (2020) · Cell · doi:10.1016/j.cell.2019.12.036 · Cited by 2,321
Self-citationJansen, I. E., Savage, J. E., Watanabe, K., Bryois, J., Williams, D. M., Steinberg, S., Sealock, J., Karlsson, I. K., Hägg, S., Athanasiu, L., et al. (2019) · Nature Genetics · doi:10.1038/s41588-018-0311-9 · Cited by 2,277
Self-citationAnalysis of shared heritability in common disorders of the brain
The Brainstorm Consortium, Anttila, V., Bulik-Sullivan, B., Finucane, H. K., Walters, R. K., Bras, J., Duncan, L., Escott-Price, V., Falcone, G. J., Gormley, P., et al. (2018) · Science · doi:10.1126/science.aap8757 · Cited by 1,924
Self-citationGERAD1 Consortium, Pardiñas, A. F., CRESTAR Consortium, Holmans, P., Pocklington, A. J., Escott-Price, V., Ripke, S., Carrera, N., Legge, S. E., Bishop, S., et al. (2018) · Nature Genetics · doi:10.1038/s41588-018-0059-2 · Cited by 1,552
Self-citationGenome-wide association study identifies 30 loci associated with bipolar disorder
eQTLGen Consortium, Stahl, E. A., BIOS Consortium, the Bipolar Disorder Working Group of the Psychiatric Genomics Consortium, Breen, G., Forstner, A. J., McQuillin, A., Ripke, S., Trubetskoy, V., Mattheisen, M., et al. (2019) · Nature Genetics · doi:10.1038/s41588-019-0397-8 · Cited by 1,519
Self-citationIterative correction of Hi-C data reveals hallmarks of chromosome organization
Imakaev, M., Fudenberg, G., McCord, R. P., Naumova, N., Goloborodko, A., Lajoie, B. R., Dekker, J., & Mirny, L. A. (2012) · Nature Methods · doi:10.1038/nmeth.2148 · Cited by 1,423
A survey of human brain transcriptome diversity at the single cell level
Darmanis, S., Sloan, S. A., Zhang, Y., Enge, M., Caneda, C., Shuer, L. M., Hayden Gephart, M. G., Barres, B. A., & Quake, S. R. (2015) · Proceedings of the National Academy of Sciences · doi:10.1073/pnas.1507125112 · Cited by 1,401
Genomic Relationships, Novel Loci, and Pleiotropic Mechanisms across Eight Psychiatric Disorders
Lee, P. H., Anttila, V., Won, H., Feng, Y.-C. A., Rosenthal, J., Zhu, Z., Tucker-Drob, E. M., Nivard, M. G., Grotzinger, A. D., Posthuma, D., et al. (2019) · Cell · doi:10.1016/j.cell.2019.11.020 · Cited by 1,381
Self-citationThe IRF Family Transcription Factors in Immunity and Oncogenesis
Tamura, T., Yanai, H., Savitsky, D., & Taniguchi, T. (2008) · Annual Review of Immunology · doi:10.1146/annurev.immunol.26.021607.090400 · Cited by 1,259
Transcriptome-wide isoform-level dysregulation in ASD, schizophrenia, and bipolar disorder
Gandal, M. J., Zhang, P., Hadjimichael, E., Walker, R. L., Chen, C., Liu, S., Won, H., van Bakel, H., Varghese, M., Wang, Y., et al. (2018) · Science · doi:10.1126/science.aat8127 · Cited by 1,247
Self-citationTwo genes encode distinct glutamate decarboxylases
Erlander, M. G., Tillakaratne, N. J. K., Feldblum, S., Patel, N., & Tobin, A. J. (1991) · Neuron · doi:10.1016/0896-6273(91)90077-d · Cited by 1,213
Massively parallel single-nucleus RNA-seq with DroNc-seq
Habib, N., Avraham-Davidi, I., Basu, A., Burks, T., Shekhar, K., Hofree, M., Choudhury, S. R., Aguet, F., Gelfand, E., Ardlie, K., et al. (2017) · Nature Methods · doi:10.1038/nmeth.4407 · Cited by 1,069
Integrative functional genomic analyses implicate specific molecular pathways and circuits in autism
Parikshak, N. N., Luo, R., Zhang, A., Won, H., Lowe, J. K., Chandran, V., Horvath, S., & Geschwind, D. H. (2013) · Cell · doi:10.1016/j.cell.2013.10.031 · Cited by 1,039
Self-citationHigh-resolution TADs reveal DNA sequences underlying genome organization in flies
Ramírez, F., Bhardwaj, V., Arrigoni, L., Lam, K. C., Grüning, B. A., Villaveces, J. M., Habermann, B. H., Akhtar, A., & Manke, T. (2018) · Nature Communications · doi:10.1038/s41467-017-02525-w · Cited by 993
Integrative single-cell analysis of transcriptional and epigenetic states in the human adult brain
Lake, B. B., Chen, S., Sos, B. C., Fan, J., Kaeser, G. E., Yung, Y. C., Duong, T. E., Gao, D., Chun, J., Kharchenko, P. V., et al. (2018) · Nature Biotechnology · doi:10.1038/nbt.4038 · Cited by 983
Comprehensive functional genomic resource and integrative model for the human brain
Wang, D., Liu, S., Warrell, J., Won, H., Shi, X., Navarro, F. C. P., Clarke, D., Gu, M., Emani, P., Yang, Y. T., et al. (2018) · Science · doi:10.1126/science.aat8464 · Cited by 965
Self-citationNeuronal subtypes and diversity revealed by single-nucleus RNA sequencing of the human brain
Lake, B. B., Ai, R., Kaeser, G. E., Salathia, N. S., Yung, Y. C., Liu, R., Wildberg, A., Gao, D., Fung, H.-L., Chen, S., et al. (2016) · Science · doi:10.1126/science.aaf1204 · Cited by 957
Grubman, A., Chew, G., Ouyang, J. F., Sun, G., Choo, X. Y., McLean, C., Simmons, R. K., Buckberry, S., Vargas-Landin, D. B., Poppe, D., et al. (2019) · Nature Neuroscience · doi:10.1038/s41593-019-0539-4 · Cited by 956
Sala Frigerio, C., Wolfs, L., Fattorelli, N., Thrupp, N., Voytyuk, I., Schmidt, I., Mancuso, R., Chen, W.-T., Woodbury, M. E., Srivastava, G., et al. (2019) · Cell Reports · doi:10.1016/j.celrep.2019.03.099 · Cited by 926
A compendium of chromatin contact maps reveals spatially active regions in the human genome
Schmitt, A. D., Hu, M., Jung, I., Xu, Z., Qiu, Y., Tan, C. L., Li, Y., Lin, S., Lin, Y., Barr, C. L., et al. (2016) · Cell Reports · doi:10.1016/j.celrep.2016.10.061 · Cited by 866
Tu, J. C., Xiao, B., Yuan, J. P., Lanahan, A. A., Leoffert, K., Li, M., Linden, D. J., & Worley, P. F. (1998) · Neuron · doi:10.1016/s0896-6273(00)80589-9 · Cited by 862
Integrative functional genomic analysis of human brain development and neuropsychiatric risks
Li, M., Santpere, G., Imamura Kawasawa, Y., Evgrafov, O. V., Gulden, F. O., Pochareddy, S., Sunkin, S. M., Li, Z., Shin, Y., Zhu, Y., et al. (2018) · Science · doi:10.1126/science.aat7615 · Cited by 810
Self-citationSox10, a Novel Transcriptional Modulator in Glial Cells
Kuhlbrodt, K., Herbarth, B., Sock, E., Hermans-Borgmeyer, I., & Wegner, M. (1998) · The Journal of Neuroscience · doi:10.1523/jneurosci.18-01-00237.1998 · Cited by 781
A Single-Cell Atlas of In Vivo Mammalian Chromatin Accessibility
Cusanovich, D. A., Hill, A. J., Aghamirzaie, D., Daza, R. M., Pliner, H. A., Berletch, J. B., Filippova, G. N., Huang, X., Christiansen, L., DeWitt, W. S., et al. (2018) · Cell · doi:10.1016/j.cell.2018.06.052 · Cited by 759
The role of microglia in amyloid clearance from the AD brain
Lee, C. Y. D., & Landreth, G. E. (2010) · Journal of Neural Transmission · doi:10.1007/s00702-010-0433-4 · Cited by 701
Brain cell type–specific enhancer–promoter interactome maps and disease - risk association
Nott, A., Holtman, I. R., Coufal, N. G., Schlachetzki, J. C. M., Yu, M., Hu, R., Han, C. Z., Pena, M., Xiao, J., Wu, Y., et al. (2019) · Science · doi:10.1126/science.aay0793 · Cited by 699
Genetic identification of brain cell types underlying schizophrenia
Major Depressive Disorder Working Group of the Psychiatric Genomics Consortium, Skene, N. G., Bryois, J., Bakken, T. E., Breen, G., Crowley, J. J., Gaspar, H. A., Giusti-Rodriguez, P., Hodge, R. D., Miller, J. A., et al. (2018) · Nature Genetics · doi:10.1038/s41588-018-0129-5 · Cited by 651
Self-citationChromosome conformation elucidates regulatory relationships in developing human brain
Won, H., de la Torre-Ubieta, L., Stein, J. L., Parikshak, N. N., Huang, J., Opland, C. K., Gandal, M. J., Sutton, G. J., Hormozdiari, F., Lu, D., et al. (2016) · Nature · doi:10.1038/nature19847 · Cited by 584
Self-citationHiCRep: assessing the reproducibility of Hi-C data using a stratum-adjusted correlation coefficient
Yang, T., Zhang, F., Yardımcı, G. G., Song, F., Hardison, R. C., Noble, W. S., Yue, F., & Li, Q. (2017) · Genome Research · doi:10.1101/gr.220640.117 · Cited by 533
A Single-Cell Transcriptomic Atlas of Human Neocortical Development during Mid-gestation
Polioudakis, D., de la Torre-Ubieta, L., Langerman, J., Elkins, A. G., Shi, X., Stein, J. L., Vuong, C. K., Nichterwitz, S., Gevorgian, M., Opland, C. K., et al. (2019) · Neuron · doi:10.1016/j.neuron.2019.06.011 · Cited by 513
Self-citationSeyfried, N. T., Dammer, E. B., Swarup, V., Nandakumar, D., Duong, D. M., Yin, L., Deng, Q., Nguyen, T., Hales, C. M., Wingo, T., et al. (2017) · Cell Systems · doi:10.1016/j.cels.2016.11.006 · Cited by 477
Self-citationInherited and de novo genetic risk for autism impacts shared networks
Ruzzo, E. K., Pérez-Cano, L., Jung, J.-Y., Wang, L.-K., Kashef-Haghighi, D., Hartl, C., Singh, C., Xu, J., Hoekstra, J. N., Leventhal, O., et al. (2019) · Cell · doi:10.1016/j.cell.2019.07.015 · Cited by 457
Self-citationIncreased expression of BIN1 mediates Alzheimer genetic risk by modulating tau pathology
GERAD consortium, Chapuis, J., Hansmannel, F., Gistelinck, M., Mounier, A., Van Cauwenberghe, C., Kolen, K. V., Geller, F., Sottejeau, Y., Harold, D., et al. (2013) · Molecular Psychiatry · doi:10.1038/mp.2013.1 · Cited by 407
Garwood, C. J., Pooler, A. M., Atherton, J., Hanger, D. P., & Noble, W. (2011) · Cell Death & Disease · doi:10.1038/cddis.2011.50 · Cited by 379
Polygenic dissection of diagnosis and clinical dimensions of bipolar disorder and schizophrenia
Ruderfer, D. M., Fanous, A. H., Ripke, S., McQuillin, A., Amdur, R. L., Schizophrenia Working Group of the Psychiatric Genomics Consortium, Bipolar Disorder Working Group of the Psychiatric Genomics Consortium, Cross-Disorder Working Group of the Psychiatric Genomics Consortium, Gejman, P. V., O'Donovan, M. C., et al. (2014) · Molecular Psychiatry · doi:10.1038/mp.2013.138 · Cited by 364
Self-citationA compendium of promoter-centered long-range chromatin interactions in the human genome
Jung, I., Schmitt, A., Diao, Y., Lee, A. J., Liu, T., Yang, D., Tan, C., Eom, J., Chan, M., Chee, S., et al. (2019) · Nature Genetics · doi:10.1038/s41588-019-0494-8 · Cited by 362
The Dynamic Landscape of Open Chromatin during Human Cortical Neurogenesis
de la Torre-Ubieta, L., Stein, J. L., Won, H., Opland, C. K., Liang, D., Lu, D., & Geschwind, D. H. (2018) · Cell · doi:10.1016/j.cell.2017.12.014 · Cited by 353
Self-citationSkene, N., & Grant, S. G. N. (2016) · Frontiers in Neuroscience · doi:10.3389/fnins.2016.00016 · Cited by 345
Glia in mammalian development and disease
Zuchero, J. B., & Barres, B. A. (2015) · Development · doi:10.1242/dev.129304 · Cited by 304
Sey, N. Y. A., Hu, B., Mah, W., Fauni, H., McAfee, J. C., Rajarajan, P., Brennand, K. J., Akbarian, S., & Won, H. (2020) · Nature Neuroscience · doi:10.1038/s41593-020-0603-0 · Cited by 297
Self-citationMellios, N., Huang, H.-S., Baker, S. P., Galdzicka, M., Ginns, E., & Akbarian, S. (2009) · Biological Psychiatry · doi:10.1016/j.biopsych.2008.11.019 · Cited by 266
Chromatin accessibility dynamics in a model of human forebrain development
Trevino, A. E., Sinnott-Armstrong, N., Andersen, J., Yoon, S.-J., Huber, N., Pritchard, J. K., Chang, H. Y., Greenleaf, W. J., & Pașca, S. P. (2020) · Science · doi:10.1126/science.aay1645 · Cited by 251
Marzi, S. J., Leung, S. K., Ribarska, T., Hannon, E., Smith, A. R., Pishva, E., Poschmann, J., Moore, K., Troakes, C., Al-Sarraj, S., et al. (2018) · Nature Neuroscience · doi:10.1038/s41593-018-0253-7 · Cited by 232
Identifying statistically significant chromatin contacts from Hi-C data with FitHiC2
Kaul, A., Bhattacharyya, S., & Ay, F. (2020) · Nature Protocols · doi:10.1038/s41596-019-0273-0 · Cited by 226
Neuron-specific signatures in the chromosomal connectome associated with schizophrenia risk
Rajarajan, P., Borrman, T., Liao, W., Schrode, N., Flaherty, E., Casiño, C., Powell, S., Yashaswini, C., LaMarca, E. A., Kassim, B., et al. (2018) · Science · doi:10.1126/science.aat4311 · Cited by 219
Self-citationAMPH-1/Amphiphysin/Bin1 functions with RME-1/Ehd1 in endocytic recycling
Pant, S., Sharma, M., Patel, K., Caplan, S., Carr, C. M., & Grant, B. D. (2009) · Nature Cell Biology · doi:10.1038/ncb1986 · Cited by 218
Novikova, G., Kapoor, M., TCW, J., Abud, E. M., Efthymiou, A. G., Chen, S. X., Cheng, H., Fullard, J. F., Bendl, J., Liu, Y., et al. (2021) · Nature Communications · doi:10.1038/s41467-021-21823-y · Cited by 214
Self-citationDiBind : Dierential binding analysis of ChIP-Seq peak data
Stark, R., & Brown, G. (2016) · Cited by 179
GimmeMotifs: a de novo motif prediction pipeline for ChIP-sequencing experiments
van Heeringen, S. J., & Veenstra, G. J. C. (2010) · Bioinformatics · doi:10.1093/bioinformatics/btq636 · Cited by 178
Functional gene group analysis identifies synaptic gene groups as risk factor for schizophrenia
the International Schizophrenia Consortium, Lips, E. S., Cornelisse, L. N., Toonen, R. F., Min, J. L., Hultman, C. M., Holmans, P. A., O'Donovan, M. C., Purcell, S. M., Smit, A. B., et al. (2012) · Molecular Psychiatry · doi:10.1038/mp.2011.117 · Cited by 167
Dual clumped isotope thermometry resolves kinetic biases in carbonate formation temperatures
Bajnai, D., Guo, W., Spötl, C., Coplen, T. B., Methner, K., Löffler, N., Krsnik, E., Gischler, E., Hansen, M., Henkel, D., et al. (2020) · Nature Communications · doi:10.1038/s41467-020-17501-0 · Cited by 147
Girdhar, K., Hoffman, G. E., Jiang, Y., Brown, L., Kundakovic, M., Hauberg, M. E., Francoeur, N. J., Wang, Y.-C., Shah, H., Kavanagh, D. H., et al. (2018) · Nature Neuroscience · doi:10.1038/s41593-018-0187-0 · Cited by 139
Self-citationNeuronal Nuclei Isolation from Human Postmortem Brain Tissue
Matevossian, A., & Akbarian, S. (2008) · Journal of Visualized Experiments · doi:10.3791/914 · Cited by 126
Self-citationTranscriptome alterations of prefrontal cortical parvalbumin neurons in schizophrenia
Enwright III, J. F., Huo, Z., Arion, D., Corradi, J. P., Tseng, G., & Lewis, D. A. (2018) · Molecular Psychiatry · doi:10.1038/mp.2017.216 · Cited by 109
Self-citationA unique role for DNA (hydroxy)methylation in epigenetic regulation of human inhibitory neurons
Kozlenkov, A., Li, J., Apontes, P., Hurd, Y. L., Byne, W. M., Koonin, E. V., Wegner, M., Mukamel, E. A., & Dracheva, S. (2018) · Science Advances · doi:10.1126/sciadv.aau6190 · Cited by 103
Self-citationHalvorsen, M., Huh, R., Oskolkov, N., Wen, J., Netotea, S., Giusti‐Rodríguez, P., Karlsson, R., Bryois, J., Nystedt, B., Ameur, A., et al. (2020) · Nature Communications · doi:10.1038/s41467-020-15707-w · Cited by 83
Self-citationCommon DNA sequence variation influences 3-dimensional conformation of the human genome
Gorkin, D. U., Qiu, Y., Hu, M., Fletez‐Brant, K., Liu, T., Schmitt, A. D., Noor, A., Chiou, J., Gaulton, K. J., Sebat, J. L., et al. (2019) · Genome biology · doi:10.1186/s13059-019-1855-4 · Cited by 82
Self-citationFullard, J. F., Giambartolomei, C., Hauberg, M. E., Xu, K., Voloudakis, G., Shao, Z., Bare, C., Dudley, J. T., Mattheisen, M., Robakis, N. K. R. K., et al. (2017) · Human Molecular Genetics · doi:10.1093/hmg/ddx103 · Cited by 75
Self-citationBlack, J. L., & Lennon, V. A. (1999) · Mayo Clinic Proceedings · doi:10.4065/74.4.357 · Cited by 58
Kundaković, M., Jiang, Y., Kavanagh, D. H., Dincer, A., Brown, L. M., Pothula, V., Zharovsky, E., Park, R., Jacobov, R., Magro, I. L., et al. (2016) · Biological Psychiatry · doi:10.1016/j.biopsych.2016.03.1048 · Cited by 50
Self-citationFIREcaller: Detecting frequently interacting regions from Hi-C data
Crowley, C., Yang, Y., Qiu, Y., Hu, B., Abnousi, A., Lipiński, J., Plewczyński, D., Wu, D., Won, H., Ren, B., et al. (2021) · Computational and Structural Biotechnology Journal · doi:10.1016/j.csbj.2020.12.026 · Cited by 37
Self-citationA chromosomal connectome for psychiatric and metabolic risk variants in adult dopaminergic neurons
Espeso‐Gil, S., Halene, T. B., Bendl, J. M., Kassim, B. S., Hutta, G. B., Iskhakova, M., Shokrian, N., Auluck, P. K., Javidfar, B., Rajarajan, P., et al. (2020) · Genome Medicine · doi:10.1186/s13073-020-0715-x · Cited by 35
Self-citationSingle cell epigenomic atlas of the developing human brain and organoids
Ziffra, R. S., Kim, C. N., Wilfert, A., Turner, T. N., Haeussler, M., Casella, A. M., Przytycki, P. F., Kreimer, A., Pollard, K. S., Ament, S. A., et al. (2019) · doi:10.1101/2019.12.30.891549 · Cited by 33
Evolution of regulatory signatures in primate cortical neurons at cell-type resolution
Kozlenkov, A., Vermunt, M. W., Apontes, P., Li, J., Hao, K., Sherwood, C. C., Hof, P. R., Ely, J. J., Wegner, M., Mukamel, E. A., et al. (2020) · Proceedings of the National Academy of Sciences · doi:10.1073/pnas.2011884117 · Cited by 30
Self-citationNovikova, G., Kapoor, M., TCW, J., Abud, E. M., Efthymiou, A. G., Cheng, H., Fullard, J. F., Bendl, J., Roussos, P., Poon, W. W., et al. (2019) · doi:10.1101/694281 · Cited by 27
Self-citationSzpirer, C., Molné, M., Antonacci, R., Jenkins, N. A., Finelli, P., Szpirer, J., Riviere, M., Rocchi, M., Gilbert, D. J., & Copeland, N. G. (1994) · Proceedings of the National Academy of Sciences · doi:10.1073/pnas.91.25.11849 · Cited by 26
Halene, T. B., Kozlenkov, A., Jiang, Y., Mitchell, A. C., Javidfar, B., Dincer, A., Park, R., Wiseman, J., Croxson, P. L., Giannaris, E. L., et al. (2016) · Schizophrenia Research · doi:10.1016/j.schres.2015.12.016 · Cited by 18
Self-citationde Leeuw, C., Sey, N. Y. A., Posthuma, D., & Won, H. (2020) · bioRxiv (Cold Spring Harbor Laboratory) · doi:10.1101/2020.09.25.310722 · Cited by 13
Self-citationGenetic variation within transcriptional regulatory elements and its implications for human disease
Rada-Iglesias, A. (2014) · Biological Chemistry · doi:10.1515/hsz-2014-0109 · Cited by 7
Romm, S. (1982) · PubMed · Cited by 5
Matoba, N., Quiroga, I. Y., Phanstiel, D. H., & Won, H. (2020) · Journal of Visualized Experiments · doi:10.3791/60428 · Cited by 4
Self-citationHu, B., & Hyejungwon (2021) · Zenodo (CERN European Organization for Nuclear Research) · doi:10.5281/zenodo.4552590 · Cited by 1
Self-citation(2021) · Zenodo · doi:10.5281/zenodo.4552591
Research works printed but not linked: 1
- Stark, R. et al. DiffBind: differential binding analysis of ChIP-Seq peak data. R. Package Version 100, 4–3 (2011).
Cited by
Sorted by citations
Neuroinflammation in Alzheimer disease
Heneka, M. T., van der Flier, W. M., Jessen, F., Hoozemanns, J., Thal, D. R., Boche, D., Brosseron, F., Teunissen, C., Zetterberg, H., Jacobs, A. H., et al. (2025) · Nature Reviews Immunology · doi:10.1038/s41577-024-01104-7 · Cited by 638
Kundaković, M., & Rocks, D. (2022) · Frontiers in Neuroendocrinology · doi:10.1016/j.yfrne.2022.101010 · Cited by 356
“…elements and is also thought to play an important role in dynamic transcriptional regulation in the brain (Beagan et al., 2020; Fernandez-Albert et al., 2019; Harabula and Pombo, 2021; Marco et al., 2020) and has been implicated in psychiatric disorders (Girdhar et al., 2022; Hu et al., 2021).”
Single-cell genomics and regulatory networks for 388 human brains
Emani, P. S., Liu, J. J., Clarke, D., Jensen, M., Warrell, J., Gupta, C., Meng, R., Lee, C.-Y., Xu, S., Dursun, C., et al. (2024) · Science · doi:10.1126/science.adi5199 · Cited by 188
Self-citationSingle-cell DNA methylation and 3D genome architecture in the human brain
Tian, W., Zhou, J., Bartlett, A., Zeng, Q., Liu, H., Castanon, R. G., Kenworthy, M., Altshul, J., Valadon, C., Aldridge, A., et al. (2023) · Science · doi:10.1126/science.adf5357 · Cited by 154
“Given that circulating-free DNAmethylation has been recognized as a robust tool for cancer diagnosis (58) and has provided promising biomarkers for brain disorders (59), our scMCode method BRAIN CELL CENSUS”
MethodDileep, V., Boix, C. A., Mathys, H., Marco, A., Welch, G. M., Meharena, H. S., Loon, A., Jeloka, R., Peng, Z., Bennett, D. A., et al. (2023) · Cell · doi:10.1016/j.cell.2023.08.038 · Cited by 130
Metadata
- Authors
- Hu, B., Won, H., Mah, W., Park, R. B., Kassim, B., Spiess, K., Kozlenkov, A., Crowley, C. A., Pochareddy, S., The PsychENCODE Consortium, Ashley-Koch, A. E., Crawford, G. E., Garrett, M. E., Song, L., Safi, A., Johnson, G. D., Wray, G. A., Reddy, T. E., Goes, F. S., Zandi, P., Bryois, J., Jaffe, A. E., Price, A. J., Ivanov, N. A., Collado-Torres, L., Hyde, T. M., Burke, E. E., Kleiman, J. E., Tao, R., Shin, J. H., Girdhar, K., Jiang, Y., Kundakovic, M., Brown, L., Wiseman, J. R., Zharovsky, E., Jacobov, R., Devillers, O., Flatow, E., Hoffman, G. E., Belmont, J., Del Valle, D., Francoeur, N., Hadjimichael, E., Pinto, D., van Bakel, H., Roussos, P., Fullard, J. F., Bendl, J., Hauberg, M. E., Charney, A. W., Haroutunian, V., Lipska, B. K., Lewis, D. A., Hahn, C.-G., Mangravite, L. M., Peters, M. A., Chae, Y., Peng, J., Niu, M., Wang, X., Webster, M. J., Beach, T. G., Chen, C., Jiang, Y., Dai, R., Wang, Y., Xia, Y., Shieh, A. W., Liu, C., Grennan, K. S., Vadukapuram, R., Giase, G., Fitzgerald, D., Cheng, L., Brown, M., Brown, M., Brunetti, T., Goodman, T., Alsayed, M., White, K. P., Ray, M., Polioudakis, D., Wamsley, B., Yin, J., De La Torre Ubieta, L., Gandal, M. J., Swarup, V., Sanders, S. J., State, M. W., Werling, D. M., An, J.-Y., Sheppard, B., Willsey, A. J., Kefi, A., Mattei, E., Purcaro, M., Weng, Z., Moore, J., Pratt, H., Huey, J., Borrman, T., Sullivan, P. F., Giusti-Rodriguez, P., Kim, Y., Szatkiewicz, J., Rhie, S. K., Armoskus, C., Camarena, A., Farnham, P. J., Spitsyna, V. N., Witt, H., Schreiner, S., Evgrafov, O. V., Knowles, J. A., Gerstein, M., Liu, S., Navarro, F. C. P., Warrell, J., Clarke, D., Emani, P. S., Gu, M., Shi, X., Xu, M., Yang, Y. T., Kitchen, R. R., Gürsoy, G., Zhang, J., Carlyle, B. C., Nairn, A. C., Li, M., Skarica, M., Li, Z., Sousa, A. M. M., Santpere, G., Choi, J., Zhu, Y., Gao, T., Miller, D. J., Cherskov, A., Yang, M., Amiri, A., Coppola, G., Mariani, J., Scuderi, S., Szekely, A., Vaccarino, F. M., Wu, F., Weissman, S., Wang, D., Roychowdhury, T., Abyzov, A., Li, Y., Dracheva, S., Sestan, N., Akbarian, S., & Geschwind, D. H.
- Affiliations
- University of North Carolina at Chapel Hill (US)
- Icahn School of Medicine at Mount Sinai (US)
- James J. Peters VA Medical Center (US)
- Yale University (US)
- Duke University (US)
- Johns Hopkins University (US)
- Karolinska Institutet (SE)
- Lieber Institute for Brain Development (US)
- Central South University (CN)
- National Institutes of Health (US)
- University of Pittsburgh (US)
- University of Pennsylvania (US)
- Sage Bionetworks (US)
- St. Jude Children's Research Hospital (US)
- Stanley Medical Research Institute (US)
- Banner Sun Health Research Institute (US)
- SUNY Upstate Medical University (US)
- University of Chicago (US)
- University of California, Los Angeles (US)
- University of California, San Francisco (US)
- University of Illinois Chicago (US)
- University of Massachusetts Chan Medical School (US)
- University of Southern California (US)
- SUNY Downstate Health Sciences University (US)
- University of Wisconsin–Madison (US)
- Mayo Clinic (US)
- Corresponding author
- Won, Hyejung
- Geschwind, Daniel H.
- ORCID
- Hu, Benxia
- Won, Hyejung
- Park, Royce B.
- Spiess, Keeley
- Kozlenkov, Alexey
- Crowley, Cheynna A.
- Pochareddy, Sirisha
- Crawford, Gregory E.
- Song, Lingyun
- Safi, Alexias
- Johnson, Graham D.
- Wray, Gregory A.
- Reddy, Timothy E.
- Goes, Fernando S.
- Zandi, Peter
- Bryois, Julien
- Jaffe, Andrew E.
- Price, Amanda J.
- Ivanov, Nikolay A.
- Hyde, Thomas M.
- Tao, Ran
- Shin, Joo Heon
- Girdhar, Kiran
- Jiang, Yan
- Wiseman, Jennifer R.
- Zharovsky, Elizabeth
- Hoffman, Gabriel E.
- Francoeur, Nancy
- Hadjimichael, Evi
- Pinto, Dalila
- Roussos, Panos
- Fullard, John F.
- Bendl, Jaroslav
- Hauberg, Mads E.
- Charney, Alexander W.
- Haroutunian, Vahram
- Lewis, David A.
- Mangravite, Lara M.
- Peters, Mette A.
- Peng, Junmin
- Wang, Xusheng
- Webster, Maree J.
- Beach, Thomas G.
- Chen, Chao
- Jiang, Yi
- Dai, Rujia
- Wang, Yongjun
- Xia, Yan
- Shieh, Annie W.
- Liu, Chunyu
- Giase, Gina
- Fitzgerald, Dominic
- Cheng, Lijun
- Brown, Miguel
- Brunetti, Tonya
- White, Kevin P.
- Wamsley, Brie
- Yin, Jiani
- Gandal, Michael J.
- Swarup, Vivek
- Sanders, Stephan J.
- State, Matthew W.
- Werling, Donna M.
- An, Joon-Yong
- Sheppard, Brooke
- Willsey, A. Jeremy
- Kefi, Amira
- Mattei, Eugenio
- Purcaro, Michael
- Weng, Zhiping
- Pratt, Henry
- Huey, Jack
- Borrman, Tyler
- Sullivan, Patrick F.
- Kim, Yunjung
- Szatkiewicz, Jin
- Rhie, Suhn Kyong
- Camarena, Adrian
- Farnham, Peggy J.
- Spitsyna, Valeria N.
- Witt, Heather
- Schreiner, Shannon
- Evgrafov, Oleg V.
- Knowles, James A.
- Gerstein, Mark
- Liu, Shuang
- Warrell, Jonathan
- Clarke, Declan
- Emani, Prashant S.
- Gu, Mengting
- Shi, Xu
- Xu, Min
- Yang, Yucheng T.
- Kitchen, Robert R.
- Gürsoy, Gamze
- Zhang, Jing
- Carlyle, Becky C.
- Nairn, Angus C.
- Li, Mingfeng
- Li, Zhen
- Santpere, Gabriel
- Choi, Jinmyung
- Zhu, Ying
- Gao, Tianliuyun
- Miller, Daniel J.
- Cherskov, Adriana
- Yang, Mo
- Amiri, Anahita
- Coppola, Gianfilippo
- Mariani, Jessica
- Scuderi, Soraya
- Szekely, Anna
- Vaccarino, Flora M.
- Wu, Feinan
- Wang, Daifeng
- Roychowdhury, Tanmoy
- Abyzov, Alexej
- Li, Yun
- Dracheva, Stella
- Sestan, Nenad
- Akbarian, Schahram
- Geschwind, Daniel H.
- Venue
- Nature Communications
- Published
- 2021-06-25
- Volume
- 12
- Issue
- 1
- Pages
- 3968-3968
- ISSN
- 2041-1723 (ISSN-L)
- PMC
- PMC8233376
- OpenAlex
- W3173670503
- Semantic Scholar
- 723f2286bfab54bcc9d0127b5899e81ffa957786
- Cited by
- 103
- References
- 86
- Citations by year
- 2026: 6 · 2025: 21 · 2024: 24 · 2023: 22 · 2022: 24 · 2021: 5
- FWCI
- 5.96
- Type
- journal article
- Language
- en
- Open access
- gold
- doi.org
- Locations
- Nature Communications (publishedVersion, cc-by)
- PubMed Central (publishedVersion, cc-by)
- PubMed (publishedVersion)
- eScholarship@UMassChan (submittedVersion, cc-by)
- RePEc: Research Papers in Economics (submittedVersion)
- DOAJ (DOAJ: Directory of Open Access Journals) (submittedVersion, cc-by-sa)
- eScholarship (California Digital Library) (submittedVersion)
- eScholarship (California Digital Library) (submittedVersion, cc-by)
- Repositori digital de la UPF (Universitat Pompeu Fabra) (submittedVersion, cc-by)
- Funders
- U.S. Department of Health & Human Services | NIH | National Institute of Mental Health (R00MH113823, DP2MH122403, P50MH106438, R01MH094714, U01MH103339, R01MH110927, R01MH100027)
- U.S. Department of Health & Human Services | NIH | National Institute on Drug Abuse (R21DA051921)
- U.S. Department of Health & Human Services | NIH | National Institute on Aging (R01AG066871)
- Topics
- Life Sciences › Biochemistry, Genetics and Molecular Biology › Molecular Biology › Genomics and Chromatin Dynamics
- Life Sciences › Biochemistry, Genetics and Molecular Biology › Genetics › Genetic Associations and Epidemiology
- Life Sciences › Biochemistry, Genetics and Molecular Biology › Molecular Biology › Epigenetics and DNA Methylation
- Keywords
- 3D genome organization, chromosome conformation, neurons, glia, oligodendrocytes, microglia, Alzheimer's disease, schizophrenia, bipolar disorder, enhancers, non-coding variants, parvalbumin interneurons, glutamatergic neurons, GABAergic neurons, epigenetic dysregulation
- MeSH terms
- Chromatin Immunoprecipitation Sequencing, Acetylation, Alzheimer Disease, Bipolar Disorder, Chromatin, Enhancer Elements, Genetic, Gene Expression Regulation, Histones, Humans, Lysine, Neuroglia, Neurons, Promoter Regions, Genetic, Schizophrenia, Epigenesis, Genetic, Genome-Wide Association Study, GABAergic Neurons
About these checks
Registry, retraction, Cites and statistics results are computed, not judged, with one exception: a printed reference that no index lists is read once by a model before it counts as a citation error. Claims are extracted by a model and kept only when their quote appears verbatim in the text; each cited source is then checked, with a model’s help, for whether it says what the claim relies on. Those verdicts can be wrong — read the claim’s quote and the cited source before relying on one.
A language model drew the claims from the paper on 2026-10-10, under version 3 of the claim definition (model deepseek-v4.1-flash, prompt extract-v3).
A second model labelled each claim on 2026-10-10 (model jev-1.13-20260917, definition revision gold-guideline-v0.2).
Cited sources are checked with a language model’s help (gpt-6-sol).
Statistics and arithmetic are recomputed, not judged.
Confidence bands are shown only for fields calibrated on our annotated test set. None is calibrated yet, so no band is shown.
What counts as a claim ›How we measure confidence ›How we check this ›
Are you an author, or do you see a problem with this page? Request a review
