

The DOI matches its Crossref record; 96 of the 100 references it cites were found in a registry or an index; 26 of the 48 sources its claims cite were checked for support.
Inferring gene regulatory networks from single-cell multiome data using atlas-scale external data
Open accessPublished version of a preprint
Abstract
Existing methods for gene regulatory network (GRN) inference rely on gene expression data alone or on lower resolution bulk data. Despite the recent integration of chromatin accessibility and RNA sequencing data, learning complex mechanisms from limited independent data points still presents a daunting challenge. Here we present LINGER (Lifelong neural network for gene regulation), a machine-learning method to infer GRNs from single-cell paired gene expression and chromatin accessibility data. LINGER incorporates atlas-scale external bulk data across diverse cellular contexts and prior knowledge of transcription factor motifs as a manifold regularization. LINGER achieves a fourfold to sevenfold relative increase in accuracy over existing methods and reveals a complex regulatory landscape of genome-wide association studies, enabling enhanced interpretation of disease-associated variants and genes. Following the GRN inference from reference single-cell multiome data, LINGER enables the estimation of transcription factor activity solely from bulk or single-cell gene expression data, leveraging the abundance of available gene expression data to identify driver regulators from case-control studies.
Overview
AI snapshot
Written from the paper’s full text.
TL;DR
LINGER infers gene regulatory networks from paired single-cell gene expression and chromatin accessibility data by pretraining on atlas-scale bulk ENCODE data and incorporating TF–motif prior knowledge as manifold regularization. It reports a fourfold to sevenfold relative increase in accuracy over existing methods and enables GWAS interpretation and TF activity estimation from expression data alone.
Key findings
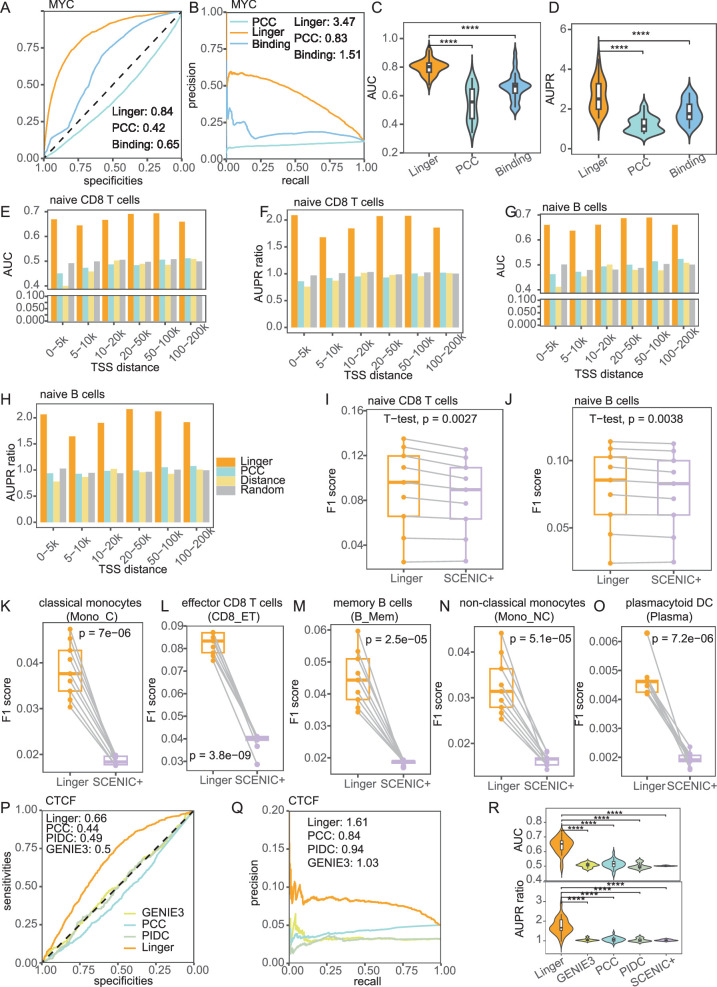
- LINGER improved population-level GRN inference over scNN, BulkNN and PCC across 20 blood ChIP–seq ground-truth datasets, with significantly higher AUC and AUPR ratio; for trans-regulatory potential, other methods averaged AUPR ratios of 1.17–1.29, 0.17–0.29 units above random, whereas LINGER achieved 1.25 units above random, described as a fourfold to sevenfold relative increase.
- For cell type-specific TF–RE binding in naive CD4 T cells, LINGER reached AUC 0.92 and AUPR ratio 5.17 for ETS1, versus PCC (AUC 0.78; AUPR ratio 2.71) and motif binding affinity (AUC 0.70; AUPR ratio 1.92); for cis-regulatory potential in naive CD4 T cells, LINGER achieved AUC 0.66–0.70 and AUPR ratio 1.81–2.16 across distance groups, while other methods were close to random.
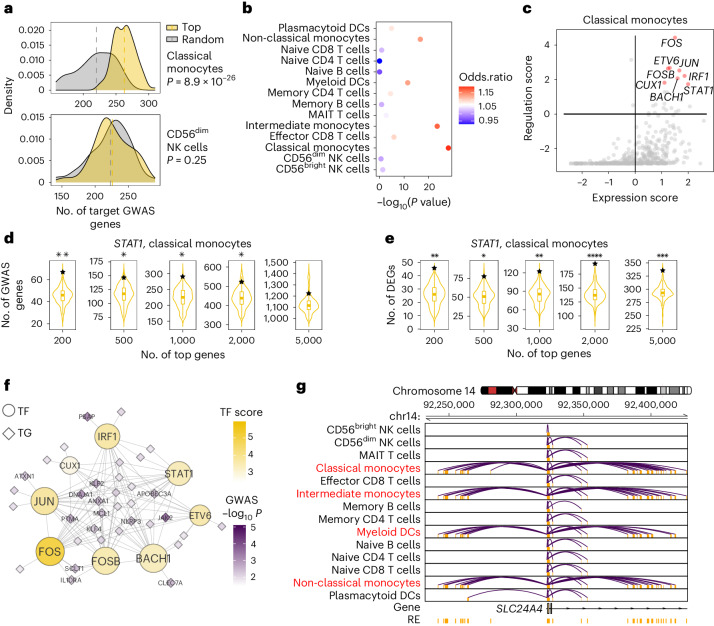
- In IBD GWAS analysis using risk loci from about 330,000 individuals, classical monocytes showed significantly higher trait regulation scores for top-expressed TFs than random TFs (P = 8.9 × 10⁻²⁹); among the top 200 STAT1 target genes in classical monocytes, 67 overlapped GWAS genes (P < 0.01), and the SLC24A4 cis-regulatory network was dense near risk SNP rs11626366 (P = 7.4 × 10⁻³).
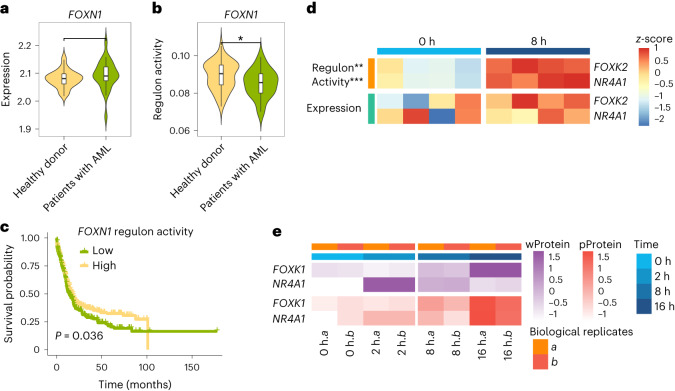
- LINGER estimated TF activity from expression alone: FOXN1 activity was lower in AML patients than healthy donors (P = 0.035) despite no significant expression difference, and high FOXN1 activity was associated with higher survival; upon TCR stimulation, FOXK2 and NR4A1 regulon activity increased at 8 h (P = 0.0057 and P = 0.00081, respectively) without significant expression changes.
Methods
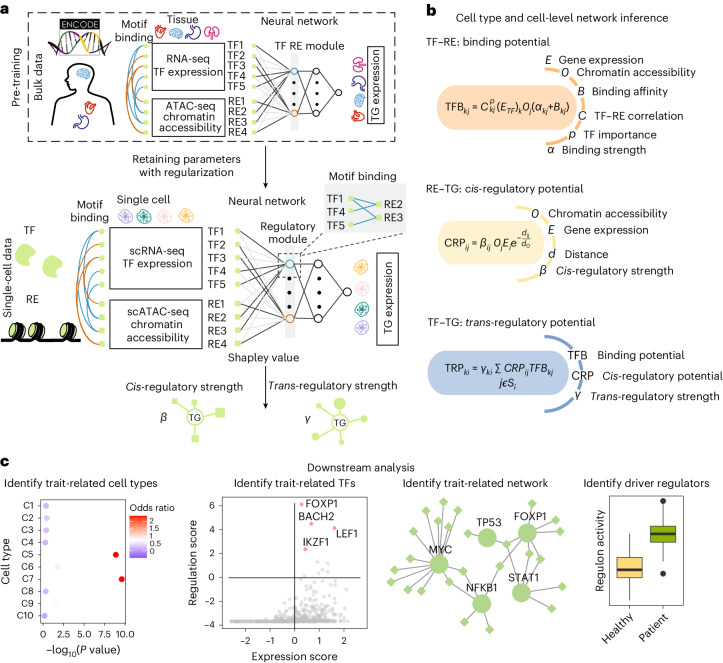
- LINGER uses a neural network to predict target-gene expression from TF expression and regulatory-element accessibility, pretraining on 201 ENCODE bulk samples across diverse cellular contexts, then refining on single-cell multiome data with elastic weight consolidation and manifold regularization based on TF–RE motif matching; Shapley values infer TF–TG and RE–TG regulatory strengths.
- Data included 10x Genomics PBMC multiome data (11,909 cells; after filtering, 9,543 cells; metacells used for training), an in silico mixture of H1, BJ, GM12878 and K562 from SNARE-seq, and ground truth from ChIP–seq, eQTLGen/GTEx, promoter-capture Hi-C, single-cell eQTL, KnockTF perturbation data and GWAS summary statistics.
- Performance was assessed mainly by AUC, AUPR ratio, F1 score and paired t-tests, with comparisons to scNN, BulkNN, PCC, motif binding affinity, GENIE3, PIDC, SCENIC+ and CellOracle.
Limitations
- The paper states that TF self-regulation is not considered because it is challenging to model without additional data.
- The paper states that lifelong learning involves a tradeoff between retaining bulk prior knowledge and fitting new single-cell data, and that the flexibility of variation in prior knowledge is not constrained when fitting new data.
- Evident from the text: benchmarking is largely limited to blood/PBMC and the H1 cell line, with ground truth restricted to available ChIP–seq, eQTL, Hi-C and perturbation datasets; generalization to other tissues or cell types is not established here.
Model-written summary. Check it against the paper before relying on it.
Integrity signals
Registry
Cites
Statistics
Figures
Verification
Claims the paper makes
51 Own result · 18 Own interpretation · 10 No basis given · 9 Supported · 7 Partly supported · 4 No full text of the sources · 3 Sources not found · 2 Supported so far · 2 Own method · accuracy not yet measured
Every source the paper cites for this claim was checked and supports it.
In the paper
“Despite extensive efforts, GRN inference accuracy has remained disappointingly low, marginally exceeding random predictions39.”
- Also stated in: § Main · plain
“Third, inferred GRN accuracy assessed by experimental data is only marginally better than random prediction39.”
§ Inferring gene regulatory networks from single-cell multiome data using atlas-scale external data > Main
What the sources say
- Supportedcites [39] Pratapa, A., Jalihal, A. P., Law, J. N., Bharadwaj, A. & Murali, T. M. Benchmarking algorithms for gene regulatory network inference from single-cell transcriptomic data. Nat. Methods 17, 147–154 (2020). source
The Discussion says reported GRN algorithm performance was often close to that of a random predictor, “as we also observed.” The Results for curated models likewise report that many algorithms had early-precision ratios close to one, similar to random prediction. These passages support the paraphrase in the context of single-cell GRN inference. (LLM, conf=0.92)
plain- Asserted: passes — The authors put it forward as true.
- Checkable: passes — It can be checked against evidence.
- Load-bearing: passes — The paper’s conclusions depend on it.
- Based: passes — The paper gives a reason why it holds.
- Also stated in: § Main · plain
The cited sources support only part of this claim — read each source’s verdict below.
In the paper
“Single-cell RNA sequencing (scRNA-seq) data enables cell type-specific trans-regulation inference through co-expression analysis such as PIDC and SCENIC21–30.”
§ Inferring gene regulatory networks from single-cell multiome data using atlas-scale external data > Main
What the sources say
- Partly supportedcites [21] Chan, T. E., Stumpf, M. P. H. & Babtie, A. C. Gene regulatory network inference from single-cell data using multivariate information measures. Cell Syst. 5, 251–267.e3 (2017). sourceExperimental — accuracy not yet measured
The Introduction describes using statistical relationships among single-cell gene-expression profiles to infer putative regulatory relationships, and the Results show PIDC identifying relationships specific to cell subpopulations. But the paper’s experimental applications use single-cell qPCR data, not scRNA-seq, and its inferred relationships do not establish specific trans-regulatory interactions. (LLM, conf=0.83)
- Supportedcites [22] Aibar, S. et al. SCENIC: single-cell regulatory network inference and clustering. Nat. Methods 14, 1083–1086 (2017). source
The SCENIC workflow passage describes inferring transcription-factor-associated gene modules from single-cell co-expression, then refining them with cis-regulatory motif analysis. The paper also reports identifying cell types and potential regulators per cell type. SCENIC is therefore an example of the approach cited, though co-expression is not its only step. (LLM, conf=0.91)
- Supportedcites [23] Matsumoto, H. et al. SCODE: an efficient regulatory network inference algorithm from single-cell RNA-seq during differentiation. Bioinformatics 33, 2314–2321 (2017). source
The Introduction states that scRNA-seq permits accurate gene-expression correlations without mixing cell types, and that each cell type’s co-expression pattern can reveal regulatory factors. This supports the attributed claim that single-cell data enable cell-type-specific regulatory inference through co-expression; the citation does not require SCODE itself to be a co-expression method. (LLM, conf=0.88)
- Partly supportedcites [24] Papili Gao, N., Ud-Dean, S. M. M., Gandrillon, O. & Gunawan, R. SINCERITIES: inferring gene regulatory networks from time-stamped single cell transcriptional expression profiles. Bioinformatics 34, 258–266 (2018). sourceExperimental — accuracy not yet measured
The Introduction and Discussion say that single-cell expression data can be used to infer gene regulatory networks while revealing cellular heterogeneity. But the Discussion describes SINCERITIES as inferring networks from time-stamped changes in expression distributions, not co-expression analysis; the paper does not establish the claim specifically for cell type-specific trans-regulation or identify PIDC and SCENIC as examples. (LLM, conf=0.84)
- Not checked — no full text of the sourcecites [25] Sanchez-Castillo, M., Blanco, D., Tienda-Luna, I. M., Carrion, M. C. & Huang, Y. A Bayesian framework for the inference of gene regulatory networks from time and pseudo-time series data. Bioinformatics 34, 964–970 (2018). source
- Partly supportedcites [26] Hu, Y., Peng, T., Gao, L. & Tan, K. CytoTalk: de novo construction of signal transduction networks using single-cell transcriptomic data. Sci. Adv. 7, eabf1356 (2021). sourceExperimental — accuracy not yet measured
The Materials and Methods section (“Construction of intracellular functional gene interaction network”; page unavailable) says CytoTalk builds a coexpression network for each cell type from single-cell data. But the paper uses those networks to infer signal-transduction pathways between cell types; the cited passages do not establish cell type-specific trans-regulatory inference or describe PIDC or SCENIC. (LLM, conf=0.83)
- Partly supportedcites [27] Frankowski, P. C. A. & Vert, J. P. Gene regulation inference from single-cell RNA-seq data with linear differential equations and velocity inference. Bioinformatics 36, 4774–4780 (2020). sourceExperimental — accuracy not yet measured
The Abstract says scRNA-seq offers possibilities for inferring gene regulatory networks, supporting the general inference claim. It describes the paper’s approach as velocity inference and differential-equation modeling, but does not support the more specific claim of cell type-specific inference through co-expression analysis such as PIDC or SCENIC. (LLM, conf=0.85)
- Partly supportedcites [28] Specht, A. T. & Li, J. LEAP: constructing gene co-expression networks for single-cell RNA-sequencing data using pseudotime ordering. Bioinformatics 33, 764–766 (2017). sourceExperimental — accuracy not yet measured
The Methods and Conclusion describe using scRNA-seq co-expression to identify directional associations that may reflect gene regulation. The Results apply LEAP to dendritic cells, but the paper does not establish cell type-specific trans-regulation inference; it characterizes the inferred associations as likely regulatory rather than confirmed regulation. (LLM, conf=0.84)
- Not checked — no full text of the sourcecites [29] Moerman, T. et al. GRNBoost2 and Arboreto: efficient and scalable inference of gene regulatory networks. Bioinformatics 35, 2159–2161 (2019). source
- Not matchedcites [30] Zhang, S. et al. Inference of cell type-specific gene regulatory networks on cell lineages from single cell omic datasets. Nat. Commun. 14, 3064 (2023).
Couldn’t be matched to a paper in Crossref, so it can’t be checked.
plaindirect- Asserted: passes — The authors put it forward as true.
- Checkable: passes — It can be checked against evidence.
- Load-bearing: passes — The paper’s conclusions depend on it.
- Based: passes — The paper gives a reason why it holds.
- Partly supported
The cited sources support only part of this claim — read each source’s verdict below.
In the paper
“These TFs have been previously reported to be associated with IBD in the literature.”
§ Inferring gene regulatory networks from single-cell multiome data using atlas-scale external data > Results > LINGER reveals the regulatory landscape of GWAS traits
What the sources say
- Partly supportedcites [66] Wang, X., Guo, R., Lv, Y. & Fu, R. The regulatory role of Fos related antigen-1 in inflammatory bowel disease. Mol. Med. Rep. 17, 1979–1985 (2018). sourceExperimental — accuracy not yet measured
The Introduction reports an association between Fra-1 expression in intestinal epithelial cells and IBD activity, and the Discussion reports elevated STAT1, STAT6 and CREB signaling in IBD patients. The citing sentence does not identify which transcription factors “these TFs” refers to, so this paper cannot verify the claim for the entire unspecified group. (LLM, conf=0.78)
- Supportedcites [67] Nowak, J. K. et al. Characterisation of the circulating transcriptomic landscape in inflammatory bowel disease provides evidence for dysregulation of multiple transcription factors including NFE2, SPI1, CEBPB, and IRF2. J. Crohns Colitis 16, 1255–1268 (2022). source
Results §3.9 identifies NFE2, SPI1, CEBPB, and IRF2 in IBD analyses and reports increased predicted activity for all four. The Conclusion (§4.8) likewise implicates these TFs in IBD inflammation, supporting the claim that they had been reported as associated with IBD. (LLM, conf=0.91)
- Not checked — no full text of the sourcecites [68] Broom, O. J., Widjaya, B., Troelsen, J., Olsen, J. & Nielsen, O. H. Mitogen activated protein kinases: A role in inflammatory bowel disease? Clin. Exp. Immunol. 158, 272–280 (2009). source
plaincorrelational- Asserted: passes — The authors put it forward as true.
- Checkable: passes — It can be checked against evidence.
- Load-bearing: unclear — It is unclear whether the paper’s conclusions depend on it.
- Based: passes — The paper gives a reason why it holds.
- Partly supported
The cited sources support only part of this claim — read each source’s verdict below.
In the paper
“Extended Data Fig. 4a,b shows that LINGER outperforms all other methods (P ≤ 3.72 × 10⁻⁴).”
§ Inferring gene regulatory networks from single-cell multiome data using atlas-scale external data > Results > LINGER improves the cell type-specific GRN inference
What the sources say
- Partly supportedcites [59] Feng, C. et al. KnockTF: a comprehensive human gene expression profile database with knockdown/knockout of transcription factors. Nucleic Acids Res. 48, D93–D100 (2020). sourceExperimental — accuracy not yet measured
The Introduction identifies KnockTF as a database of human TF knockdown/knockout expression datasets, and Data Source and Processing describes its differentially expressed gene analyses. This supports citing KnockTF as a data source, but our copy does not report eight PBMC datasets or compare LINGER with other methods; it does not support the stated performance result or P-value. (LLM, conf=0.86)
plaindirect- Asserted: passes — The authors put it forward as true.
- Checkable: passes — It can be checked against evidence.
- Load-bearing: passes — The paper’s conclusions depend on it.
- Based: passes — The paper gives a reason why it holds.
- Rests on an assumption: Perturbation experiment data from KnockTF are valid ground truth for direct DEGs under TF perturbation.
- Partly supported
The sources with a verdict support this claim; the rest weren’t checked yet, have no full text we could read, or their verdicts aren’t rated yet.
In the paper
“Other studies have also shown that FOXK2 affects the activation of T lymphocytes77,78 and revealed the essential roles of NR4A1 in regulatory T cell differentiation79,80, suggesting that the identified TFs have important roles in naive CD4+ T cell response upon TCR stimulation.”
§ Inferring gene regulatory networks from single-cell multiome data using atlas-scale external data > Results > Identify driver regulators based on transcription profiles
What the sources say
- Not checked — no full text of the sourcecites [77] Blanchett, S., Boal-Carvalho, I., Layzell, S. & Seddon, B. NF-κB and extrinsic cell death pathways—entwined do-or-die decisions for T cells. Trends Immunol. 42, 76–88 (2021). source
- Could not verifycites [78] Oh, H. & Ghosh, S. NF-κB: roles and regulation in different CD4+ T-cell subsets. Immunol. Rev. 252, 41–51 (2013). sourceExperimental — accuracy not yet measured
The Introduction discusses TCR-stimulated T-cell activation, and the section on natural regulatory T-cell development discusses NF-κB and FoxP3. Searches for NR4A1 and FOXK2 returned no passages linking either factor to regulatory T-cell differentiation or naive CD4+ T-cell responses. Our copy therefore does not address the claim about these two factors. (LLM, conf=0.76)
- Not checked — no full text of the sourcecites [79] Sekiya, T. et al. Essential roles of the transcription factor NR4A1 in regulatory T cell differentiation under the influence of immunosuppressants. J. Immunol. 208, 2122–2130 (2022). source
- Supportedcites [80] Fassett, M. S., Jiang, W., D’Alise, A. M., Mathis, D. & Benoist, C. Nuclear receptor Nr4a1 modulates both regulatory T-cell (Treg) differentiation and clonal deletion. Proc. Natl Acad. Sci. USA 109, 3891–3896 (2012). source
The Nr4a1 section reports that Nr4a1 dampens selection into the thymic Treg lineage at an early stage driven by TCR signals. This supports the cited point about NR4A1's role in regulatory T-cell differentiation; the broader statement about naive CD4+ T-cell responses is the citing authors’ inference, not a finding attributed specifically to this paper. (LLM, conf=0.92)
hedgedcorrelational- Asserted: passes — The authors put it forward as true.
- Checkable: passes — It can be checked against evidence.
- Load-bearing: passes — The paper’s conclusions depend on it.
- Based: passes — The paper gives a reason why it holds.
Every source the paper cites for this claim was checked and supports it.
In the paper
“Apart from GWAS-relevant genes, we collected the DEGs between inflamed biopsies and non-inflamed biopsies71 and we found that these DEGs significantly overlapped with the top-ranked TGs of STAT1 (one-sided bootstrap hypothesis testing; Fig. 5e).”
§ Inferring gene regulatory networks from single-cell multiome data using atlas-scale external data > Results > LINGER reveals the regulatory landscape of GWAS traits
What the sources say
- Supportedcites [71] Hu, S. et al. Inflammation status modulates the effect of host genetic variation on intestinal gene expression in inflammatory bowel disease. Nat. Commun. 12, 1122 (2021). source
The citation is attached to the DEGs collected from inflamed versus non-inflamed biopsies, not to the citing authors’ subsequent STAT1 overlap test. The Results section reports 1,131 differentially expressed genes from that comparison. The one-sided bootstrap result is presented as the citing authors’ own finding. (LLM, conf=0.94)
plaincorrelational- Asserted: passes — The authors put it forward as true.
- Checkable: passes — It can be checked against evidence.
- Load-bearing: passes — The paper’s conclusions depend on it.
- Based: passes — The paper gives a reason why it holds.
- Supported
A result the paper reports from its own data — it cites no other source for it, so there is none to check. The quote shows it is in the paper.
In the paper
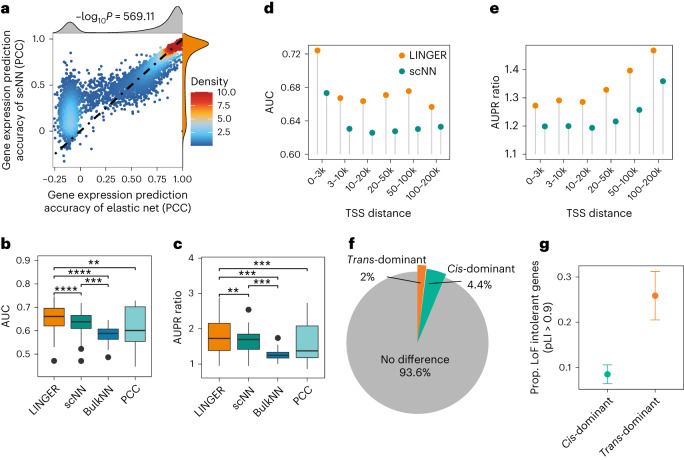
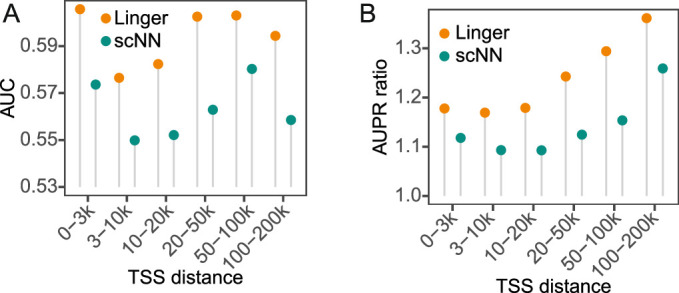
“LINGER achieved a higher AUC and AUPR ratio than scNN in all different distance groups in eQTLGen (Fig. 2d,e) as well as GTEx (Extended Data Fig. 1a,b).”
§ Inferring gene regulatory networks from single-cell multiome data using atlas-scale external data > Results > LINGER improves the cellular population GRN inference
plaincorrelational- Asserted: passes — The authors put it forward as true.
- Checkable: passes — It can be checked against evidence.
- Load-bearing: passes — The paper’s conclusions depend on it.
- Based: passes — The paper gives a reason why it holds.
A result the paper reports from its own data — it cites no other source for it, so there is none to check. The quote shows it is in the paper.
In the paper
“Specifically, 4.37% of genes are cis-regulation dominant, while 2.00% are trans-regulation dominant (Fig. 2f).”
§ Inferring gene regulatory networks from single-cell multiome data using atlas-scale external data > Results > LINGER improves the cellular population GRN inference
plain- Asserted: passes — The authors put it forward as true.
- Checkable: passes — It can be checked against evidence.
- Load-bearing: unclear — It is unclear whether the paper’s conclusions depend on it.
- Based: passes — The paper gives a reason why it holds.
A result the paper reports from its own data — it cites no other source for it, so there is none to check. The quote shows it is in the paper.
In the paper
“Results show that scNN performs better than PCC and BulkNN.”
§ Inferring gene regulatory networks from single-cell multiome data using atlas-scale external data > Results > LINGER improves the cellular population GRN inference
plaincorrelational- Asserted: passes — The authors put it forward as true.
- Checkable: passes — It can be checked against evidence.
- Load-bearing: unclear — It is unclear whether the paper’s conclusions depend on it.
- Based: passes — The paper gives a reason why it holds.
The paper states this without a source or data behind it here, so there is nothing to check it against. The quote shows it is in the paper.
In the paper
“LINGER achieves a fourfold to sevenfold relative increase in accuracy over existing methods”
- Also stated in: § Main · plain
“Third, the accuracy of LINGER represents a fourfold to sevenfold relative increase.”
§ Inferring gene regulatory networks from single-cell multiome data using atlas-scale external data > Abstract
plaindirect- Asserted: passes — The authors put it forward as true.
- Checkable: passes — It can be checked against evidence.
- Load-bearing: passes — The paper’s conclusions depend on it.
- Based: passes — The paper gives a reason why it holds.
- Rests on an assumption: Shapley value estimates the contribution of each feature for each gene.
- Rests on an assumption: The correlation of TF and RE parameters learned in the second layer reflects TF–RE binding strength.
- Also stated in: § Main · plain
- Probably not a substantial claim. 24
- It may state two separate claims as one. 30
- The quote only partly states this claim. 2
Every source the paper cites for this claim was checked and supports it.
In the paper
“EWC regularization encourages the posterior to remain close to the prior, retaining knowledge while adapting, preventing excessive changes and ensuring a more stable learning process47.”
§ Inferring gene regulatory networks from single-cell multiome data using atlas-scale external data > Results > LINGER: using bulk data to infer GRNs from single-cell multiome data
What the sources say
- Supportedcites [47] Kirkpatrick, J. et al. Overcoming catastrophic forgetting in neural networks. Proc. Natl Acad. Sci. USA 114, 3521–3526 (2017). source
The Discussion (p. 6) says EWC protects knowledge during new learning by pulling important weights toward their old values. It also describes the posterior from previous tasks as the prior for a new task, supporting the claim’s Bayesian paraphrase. The results in §2.1 (p. 3) show learning a new task without forgetting the old one. (LLM, conf=0.90)
plaindirect- Asserted: passes — The authors put it forward as true.
- Checkable: passes — It can be checked against evidence.
- Load-bearing: passes — The paper’s conclusions depend on it.
- Based: passes — The paper gives a reason why it holds.
Probably not a substantial claim. It may state two separate claims as one.
- Supported
The cited sources support only part of this claim — read each source’s verdict below.
In the paper
“Lifelong learning has been proven to leverage the knowledge learned in previous tasks to learn the new task better45.”
§ Inferring gene regulatory networks from single-cell multiome data using atlas-scale external data > Results > LINGER: using bulk data to infer GRNs from single-cell multiome data
What the sources say
- Partly supportedcites [45] Parisi, G. I., Kemker, R., Part, J. L., Kanan, C. & Wermter, S. Continual lifelong learning with neural networks: a review. Neural Netw. 113, 54–71 (2019). sourceExperimental — accuracy not yet measured
Section 3.5 defines positive forward transfer as prior learning improving performance on a later task, and Section 4.3 describes approaches that reuse knowledge across tasks. But Section 4.3 calls transfer learning an open challenge, while Section 3.5 also recognizes negative transfer. The review therefore supports that lifelong-learning approaches can improve later-task learning, not that lifelong learning has generally been proven to do so. Page numbers were not provided in the passages. (LLM, conf=0.87)
boosteddirect- Asserted: passes — The authors put it forward as true.
- Checkable: passes — It can be checked against evidence.
- Load-bearing: passes — The paper’s conclusions depend on it.
- Based: passes — The paper gives a reason why it holds.
Probably not a substantial claim.
- Partly supported
The cited sources support only part of this claim — read each source’s verdict below.
In the paper
“Genome-wide measurements of chromatin accessibility, such as DNase-seq17 and assay for transposase-accessible chromatin sequencing (ATAC-seq)18, locate REs, enabling TF–RE connections by motif matching and connecting REs to their nearby TGs19.”
§ Inferring gene regulatory networks from single-cell multiome data using atlas-scale external data > Main
What the sources say
- Not matchedcites DNase-seq17
Couldn’t be matched to a paper in Crossref, so it can’t be checked.
- Not matchedcites ATAC-seq18
Couldn’t be matched to a paper in Crossref, so it can’t be checked.
- Partly supportedcites [19] Neph, S. et al. Circuitry and dynamics of human transcription factor regulatory networks. Cell 150, 1274–1286 (2012). sourceExperimental — accuracy not yet measured
The Experimental Procedures (Regulatory network construction; page unavailable) describe matching TF motifs to DNaseI footprints and linking those footprints to genes whose transcription start sites are within 5,000 nucleotides. This supports the proposed connection method, but the study constructed networks for TF genes specifically, not target genes generally; the Discussion also cautions that proximity does not reliably assign distal regulatory elements to their target genes. (LLM, conf=0.85)
plaindirect- Asserted: passes — The authors put it forward as true.
- Checkable: passes — It can be checked against evidence.
- Load-bearing: passes — The paper’s conclusions depend on it.
- Based: passes — The paper gives a reason why it holds.
It may state two separate claims as one.
- Not matched
Every source the paper cites for this claim was checked and supports it.
In the paper
“Recently, scJoint38 was developed to transfer labels from scRNA-seq to scATAC-seq data, which may enable improved cell GRN inference.”
§ Inferring gene regulatory networks from single-cell multiome data using atlas-scale external data > Main
What the sources say
- Supportedcites [38] Lin, Y. et al. scJoint integrates atlas-scale single-cell RNA-seq and ATAC-seq data with transfer learning. Nat. Biotechnol. 40, 703–710 (2022). source
The Discussion describes scJoint as a transfer-learning method that cotrains labeled scRNA-seq data and unlabeled scATAC-seq data, and the Results describe its transfer of cell-type labels to ATAC cells. The suggestion that this may improve cell GRN inference is the citing authors’ prospective inference, not a result attributed to scJoint. (LLM, conf=0.90)
hedgedconditional- Asserted: passes — The authors put it forward as true.
- Checkable: passes — It can be checked against evidence.
- Load-bearing: fails — The paper’s conclusions may not depend on it.
- Based: passes — The paper gives a reason why it holds.
Probably not a substantial claim. The paper’s conclusions may not depend on it. It may state two separate claims as one.
- Supported
The cited sources support only part of this claim — read each source’s verdict below.
In the paper
“FOXK2 and NR4A1 are activated at 8 h based on regulon activity (Fig. 6d), which is consistent with the whole proteomics and phosphoproteomics data (Fig. 6e)76.”
§ Inferring gene regulatory networks from single-cell multiome data using atlas-scale external data > Results > Identify driver regulators based on transcription profiles
What the sources say
- Partly supportedcites [76] Tan, H. et al. Integrative proteomics and phosphoproteomics profiling reveals dynamic signaling networks and bioenergetics pathways underlying T cell activation. Immunity 46, 488–503 (2017). sourceExperimental — accuracy not yet measured
The Results section on TCR-stimulated proteome changes places NR4A1 in a whole-proteome cluster that rises at 2 h and then gradually declines. The cited paper does not establish FOXK2 or NR4A1 activation at 8 h based on regulon activity, nor does the retrieved phosphoproteomics discussion show matching changes for those factors. Its NR4A1 finding therefore supports only part of the claimed consistency. (LLM, conf=0.84)
plaincorrelational- Asserted: passes — The authors put it forward as true.
- Checkable: passes — It can be checked against evidence.
- Load-bearing: unclear — It is unclear whether the paper’s conclusions depend on it.
- Based: passes — The paper gives a reason why it holds.
It may state two separate claims as one.
- Partly supported
Every source the paper cites for this claim was checked and supports it.
In the paper
“GWASs have identified thousands of disease variants, but the active cells and functions involving variant-regulated genes remain largely unknown61.”
§ Inferring gene regulatory networks from single-cell multiome data using atlas-scale external data > Results > LINGER reveals the regulatory landscape of GWAS traits
What the sources say
- Supportedcites [61] Jagadeesh, K. A. et al. Identifying disease-critical cell types and cellular processes by integrating single-cell RNA-sequencing and human genetics. Nat. Genet. 54, 1479–1492 (2022). source
The Introduction states that GWAS have identified thousands of disease-associated variants, while the cellular mechanisms through which they act remain largely unknown. It specifically points to limited knowledge of the cells and functional programs in which the genes regulated by those variants are active. (LLM, conf=0.94)
plain- Asserted: passes — The authors put it forward as true.
- Checkable: passes — It can be checked against evidence.
- Load-bearing: passes — The paper’s conclusions depend on it.
- Based: passes — The paper gives a reason why it holds.
Probably not a substantial claim. It may state two separate claims as one.
- Supported
The cited sources support only part of this claim — read each source’s verdict below.
In the paper
“EWC constrains the parameters of the first layer to stay in a region of , which is previously learned from the bulk data45.”
§ Inferring gene regulatory networks from single-cell multiome data using atlas-scale external data > Methods > GRN inference by lifelong learning
What the sources say
- Partly supportedcites [45] Parisi, G. I., Kemker, R., Part, J. L., Kanan, C. & Wermter, S. Continual lifelong learning with neural networks: a review. Neural Netw. 113, 54–71 (2019). sourceExperimental — accuracy not yet measured
Section 3.2 (page unavailable) describes EWC as penalizing changes to task-relevant parameters relative to values learned on a previous task. It does not restrict this constraint to the first layer or describe the previous training data as “bulk data.” (LLM, conf=0.88)
plaindirect- Asserted: passes — The authors put it forward as true.
- Checkable: passes — It can be checked against evidence.
- Load-bearing: passes — The paper’s conclusions depend on it.
- Based: passes — The paper gives a reason why it holds.
Probably not a substantial claim.
- Partly supported
The sources with a verdict support this claim; the rest weren’t checked yet, have no full text we could read, or their verdicts aren’t rated yet.
In the paper
“These findings align with previous studies linking monocytes to the pathogenesis of IBD64,65.”
§ Inferring gene regulatory networks from single-cell multiome data using atlas-scale external data > Results > LINGER reveals the regulatory landscape of GWAS traits
What the sources say
- Not checked — no full text of the sourcecites [64] Anderson, A. et al. Monocytosis is a biomarker of severity in inflammatory bowel disease: analysis of a 6-year prospective natural history registry. Inflamm. Bowel Dis. 28, 70–78 (2022). source
- Supportedcites [65] Aschenbrenner, D. et al. Deconvolution of monocyte responses in inflammatory bowel disease reveals an IL-1 cytokine network that regulates IL-23 in genetic and acquired IL-10 resistance. Gut 70, 1023–1036 (2021). source
The Discussion links inflammatory monocytes in patients with ulcerative colitis and Crohn’s disease to intestinal inflammation and suggests they are major sources of IL-23 in the inflamed intestine. The Results also report that inflammatory-monocyte gene expression predicted disease activity in a Crohn’s disease cohort. These passages support the broad claim that monocytes are linked to IBD pathogenesis. (LLM, conf=0.92)
plaincorrelational- Asserted: passes — The authors put it forward as true.
- Checkable: passes — It can be checked against evidence.
- Load-bearing: fails — The paper’s conclusions may not depend on it.
- Based: passes — The paper gives a reason why it holds.
Probably not a substantial claim. The paper’s conclusions may not depend on it.
Every source the paper cites for this claim was checked and supports it.
In the paper
“we calculated the TF activity of the transcriptome profile (bulk RNA-seq data) of 671 individuals with AML73 and performed survival analysis, which indicated that individuals with high FOXN1 activity level tend to have a higher survival probability (Fig. 6c).”
§ Inferring gene regulatory networks from single-cell multiome data using atlas-scale external data > Results > Identify driver regulators based on transcription profiles
What the sources say
- Supportedcites [73] Bottomly, D. et al. Integrative analysis of drug response and clinical outcome in acute myeloid leukemia. Cancer Cell 40, 850–864.e9 (2022). source
The citation is attached to the AML RNA-seq cohort, not to the citing authors’ FOXN1 survival result. The Results describe an AML cohort with harmonized RNA-seq data, and STAR Methods (RNA Sequencing; page unavailable) describes its gene-level counts. The FOXN1 analysis is presented as the citing authors’ own work. (LLM, conf=0.87)
hedgedcorrelationaln = 671- Asserted: passes — The authors put it forward as true.
- Checkable: passes — It can be checked against evidence.
- Load-bearing: passes — The paper’s conclusions depend on it.
- Based: passes — The paper gives a reason why it holds.
The quote only partly states this claim.
- Rests on an assumption: TF activity, focusing on the DNA-binding component of TF proteins, is a more reliable metric than mRNA for identifying driver regulators.
- Rests on an assumption: Estimating TF activity based on the expression patterns of downstream TGs requires an accurate GRN.
- The authors state this as an assumption: The GRN structure is consistent for the same cell type across individuals.
- Supported
Every source the paper cites for this claim was checked and supports it.
In the paper
“The Shapley value measures the contribution of features in a machine-learning model and is widely used in algorithms such as deep learning, graphical models and reinforcement learning85.”
§ Inferring gene regulatory networks from single-cell multiome data using atlas-scale external data > Methods > GRN inference by Shapley value
What the sources say
- Supportedcites [85] Rozemberczki, B. et al. The Shapley value in machine learning. Preprint at https://doi.org/10.48550/arXiv.2202.05594 (2022). source
Section 4.4 (Explainable Machine Learning) says Shapley values measure input features’ contributions to model outputs and describes approaches for deep learning and graphical models. Section 4.5 (Multi-Agent Reinforcement Learning) describes their use to attribute agents’ contributions to a global reward. Together, these passages support the cited sentence’s broad account of the Shapley value’s uses. (LLM, conf=0.90)
plain- Asserted: passes — The authors put it forward as true.
- Checkable: passes — It can be checked against evidence.
- Load-bearing: fails — The paper’s conclusions may not depend on it.
- Based: passes — The paper gives a reason why it holds.
Probably not a substantial claim. The paper’s conclusions may not depend on it. It may state two separate claims as one.
- Supported
Every source the paper cites for this claim was checked and supports it.
In the paper
“which aligns with the conclusion that chromatin accessibility alterations occur in age-related macular degeneration54.”
§ Inferring gene regulatory networks from single-cell multiome data using atlas-scale external data > Results > LINGER improves the cellular population GRN inference
What the sources say
- Supportedcites [54] Wang, J. et al. ATAC-seq analysis reveals a widespread decrease of chromatin accessibility in age-related macular degeneration. Nat. Commun. 9, 1364 (2018). source
The Discussion states that the authors profiled changes in chromatin accessibility during AMD progression in the retinal pigment epithelium and retina. The Results report broadly decreased accessibility in AMD samples compared with healthy samples, directly supporting the cited conclusion. (LLM, conf=0.94)
plain- Asserted: passes — The authors put it forward as true.
- Checkable: passes — It can be checked against evidence.
- Load-bearing: fails — The paper’s conclusions may not depend on it.
- Based: passes — The paper gives a reason why it holds.
Probably not a substantial claim. The paper’s conclusions may not depend on it.
- Supported
Every source the paper cites for this claim was checked and supports it.
In the paper
“A previous study found that disease-associated genes from GWAS were enriched in selectively constrained genes, while eQTL genes were depleted in selectively constrained genes52.”
§ Inferring gene regulatory networks from single-cell multiome data using atlas-scale external data > Results > LINGER improves the cellular population GRN inference
What the sources say
- Supportedcites [52] Mostafavi, H., Spence, J. P., Naqvi, S. & Pritchard, J. K. Systematic differences in discovery of genetic effects on gene expression and complex traits. Nat. Genet. 55, 1866–1875 (2023). source
The Results section, “Constrained genes are enriched in GWAS genes but depleted in eQTL genes,” reports enrichment of high-pLI genes among GWAS genes and depletion among eQTL genes, each compared with control SNP-linked genes. It describes high pLI as a proxy for selective constraint. (LLM, conf=0.92)
plaincorrelational- Asserted: passes — The authors put it forward as true.
- Checkable: passes — It can be checked against evidence.
- Load-bearing: passes — The paper’s conclusions depend on it.
- Based: passes — The paper gives a reason why it holds.
Probably not a substantial claim. It may state two separate claims as one.
- Supported
A result the paper reports from its own data — it cites no other source for it, so there is none to check. The quote shows it is in the paper.
In the paper
“Points show estimated success probability from binomial distribution, at 0.26 and 0.09 for trans-dominant and cis-dominant, respectively.”
§ Inferring gene regulatory networks from single-cell multiome data using atlas-scale external data > Results > LINGER improves the cellular population GRN inference
hedgedn = 317- Asserted: passes — The authors put it forward as true.
- Checkable: passes — It can be checked against evidence.
- Load-bearing: unclear — It is unclear whether the paper’s conclusions depend on it.
- Based: passes — The paper gives a reason why it holds.
It may state two separate claims as one.
The paper states this without a source or data behind it here, so there is nothing to check it against. The quote shows it is in the paper.
In the paper
“TFs contribute more to predicting the expression of trans-dominant genes, while REs contribute more to cis-dominant genes.”
§ Inferring gene regulatory networks from single-cell multiome data using atlas-scale external data > Results > LINGER improves the cellular population GRN inference
plaincorrelational- Asserted: passes — The authors put it forward as true.
- Checkable: passes — It can be checked against evidence.
- Load-bearing: unclear — It is unclear whether the paper’s conclusions depend on it.
- Based: passes — The paper gives a reason why it holds.
It may state two separate claims as one.
A result the paper reports from its own data — it cites no other source for it, so there is none to check. The quote shows it is in the paper.
In the paper
“reveals a complex regulatory landscape of genome-wide association studies, enabling enhanced interpretation of disease-associated variants and genes.”
§ Inferring gene regulatory networks from single-cell multiome data using atlas-scale external data > Abstract
plaindirect- Asserted: passes — The authors put it forward as true.
- Checkable: passes — It can be checked against evidence.
- Load-bearing: passes — The paper’s conclusions depend on it.
- Based: passes — The paper gives a reason why it holds.
It may state two separate claims as one.
- Rests on an assumption: Shapley value estimates the contribution of each feature for each gene.
- Rests on an assumption: The correlation of TF and RE parameters learned in the second layer reflects TF–RE binding strength.
A result the paper reports from its own data — it cites no other source for it, so there is none to check. The quote shows it is in the paper.
In the paper
“We found that scNN modeled gene expression better than elastic net, with −log10P = 572.09, especially for those substantial proportions of genes that show negative Pearson’s correlation coefficient (PCC) in elastic net predictions (−log10P = 1,060.17; Fig. 2a).”
- Also stated in: § LINGER improves the cellular population GRN inference · boosted
“This demonstrates that the three-layer neural network model scNN outperforms the elastic net model in predicting gene expression.”
§ Inferring gene regulatory networks from single-cell multiome data using atlas-scale external data > Results > LINGER improves the cellular population GRN inference
boostedcorrelational- Asserted: passes — The authors put it forward as true.
- Checkable: passes — It can be checked against evidence.
- Load-bearing: passes — The paper’s conclusions depend on it.
- Based: passes — The paper gives a reason why it holds.
It may state two separate claims as one.
- Also stated in: § LINGER improves the cellular population GRN inference · boosted
A result the paper reports from its own data — it cites no other source for it, so there is none to check. The quote shows it is in the paper.
In the paper
“Compared to other methods, LINGER performs better, with a significantly higher AUC (Fig. 2b) and AUPR ratio (Fig. 2c) across all ground truth data.”
§ Inferring gene regulatory networks from single-cell multiome data using atlas-scale external data > Results > LINGER improves the cellular population GRN inference
plaincorrelational- Asserted: passes — The authors put it forward as true.
- Checkable: passes — It can be checked against evidence.
- Load-bearing: passes — The paper’s conclusions depend on it.
- Based: passes — The paper gives a reason why it holds.
It may state two separate claims as one.
The paper states this without a source or data behind it here, so there is nothing to check it against. The quote shows it is in the paper.
In the paper
“Following the GRN inference from reference single-cell multiome data, LINGER enables the estimation of transcription factor activity solely from bulk or single-cell gene expression data, leveraging the abundance of available gene expression data to identify driver regulators from case-control studies.”
- Also stated in: § Main · plain
“Fourth, LINGER enables the estimation of TF activity solely from gene expression data, identifying driver regulators.”
§ Inferring gene regulatory networks from single-cell multiome data using atlas-scale external data > Abstract
plaindirect- Asserted: passes — The authors put it forward as true.
- Checkable: passes — It can be checked against evidence.
- Load-bearing: passes — The paper’s conclusions depend on it.
- Based: passes — The paper gives a reason why it holds.
It may state two separate claims as one.
- Rests on an assumption: Shapley value estimates the contribution of each feature for each gene.
- Rests on an assumption: The correlation of TF and RE parameters learned in the second layer reflects TF–RE binding strength.
- Also stated in: § Main · plain
A result the paper reports from its own data — it cites no other source for it, so there is none to check. The quote shows it is in the paper.
In the paper
“LINGER improves the cellular population GRN inference”
§ Inferring gene regulatory networks from single-cell multiome data using atlas-scale external data > Results > LINGER improves the cellular population GRN inference
plaindirect- Asserted: passes — The authors put it forward as true.
- Checkable: passes — It can be checked against evidence.
- Load-bearing: passes — The paper’s conclusions depend on it.
- Based: unclear — It is unclear why the paper says it holds.
The quote only partly states this claim.
- Rests on an assumption: Shapley value estimates the contribution of each feature for each gene.
- Rests on an assumption: The correlation of TF and RE parameters learned in the second layer reflects TF–RE binding strength.
A result the paper reports from its own data — it cites no other source for it, so there is none to check. The quote shows it is in the paper.
In the paper
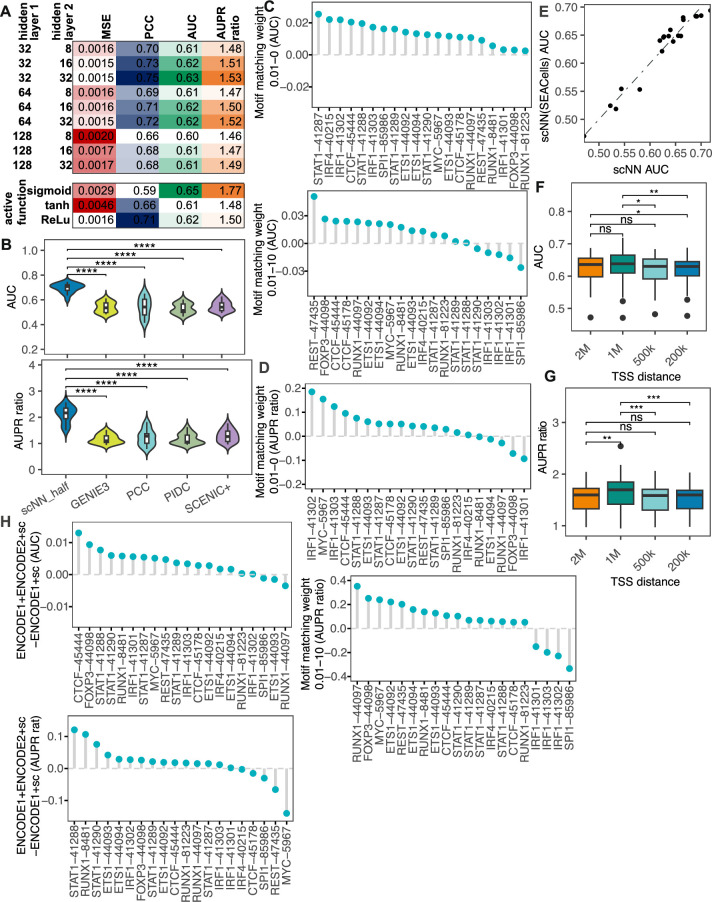
“Note that the sigmoid activation function would not improve the gene expression prediction but would improve the GRN inference (Extended Data Fig. 2a).”
§ Inferring gene regulatory networks from single-cell multiome data using atlas-scale external data > Results > LINGER improves the cellular population GRN inference
hedgeddirect- Asserted: passes — The authors put it forward as true.
- Checkable: passes — It can be checked against evidence.
- Load-bearing: unclear — It is unclear whether the paper’s conclusions depend on it.
- Based: passes — The paper gives a reason why it holds.
It may state two separate claims as one.
A result the paper reports from its own data — it cites no other source for it, so there is none to check. The quote shows it is in the paper.
In the paper
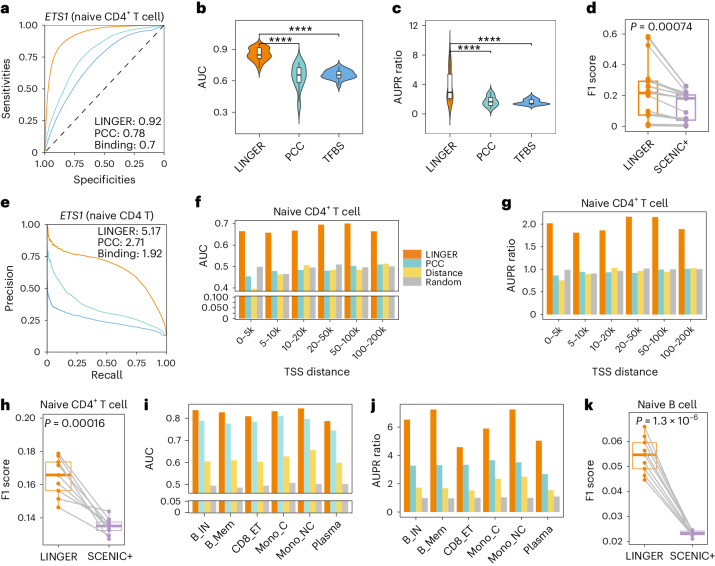
“In naive CD4 T cells, LINGER achieves AUC ranging from 0.66 to 0.70 (Fig. 3f) and AUPR ratio ranging from 1.81 to 2.16 (Fig. 3g) across all distance groups, while other methods are close to random.”
§ Inferring gene regulatory networks from single-cell multiome data using atlas-scale external data > Results > LINGER improves the cell type-specific GRN inference
plaincorrelational- Asserted: passes — The authors put it forward as true.
- Checkable: passes — It can be checked against evidence.
- Load-bearing: passes — The paper’s conclusions depend on it.
- Based: passes — The paper gives a reason why it holds.
It may state two separate claims as one.
A result the paper reports from its own data — it cites no other source for it, so there is none to check. The quote shows it is in the paper.
In the paper
“For example, in naive CD4 T cells, LINGER achieves an AUC of 0.92 and an AUPR ratio of 5.17 for ETS1, which is an improvement over PCC (AUC, 0.78; AUPR ratio, 2.71) and motif binding affinity (AUC, 0.70; AUPR ratio, 1.92) (Fig. 3a,e).”
§ Inferring gene regulatory networks from single-cell multiome data using atlas-scale external data > Results > LINGER improves the cell type-specific GRN inference
plaincorrelational- Asserted: passes — The authors put it forward as true.
- Checkable: passes — It can be checked against evidence.
- Load-bearing: passes — The paper’s conclusions depend on it.
- Based: passes — The paper gives a reason why it holds.
It may state two separate claims as one.
The paper states this without a source or data behind it here, so there is nothing to check it against. The quote shows it is in the paper.
In the paper
“However, the use of lifelong learning to leverage external data does not lead to improved gene expression prediction but does improve the GRN inference.”
§ Inferring gene regulatory networks from single-cell multiome data using atlas-scale external data > Conclusions and discussions
plaindirect- Asserted: passes — The authors put it forward as true.
- Checkable: passes — It can be checked against evidence.
- Load-bearing: passes — The paper’s conclusions depend on it.
- Based: passes — The paper gives a reason why it holds.
It may state two separate claims as one.
A result the paper reports from its own data — it cites no other source for it, so there is none to check. The quote shows it is in the paper.
In the paper
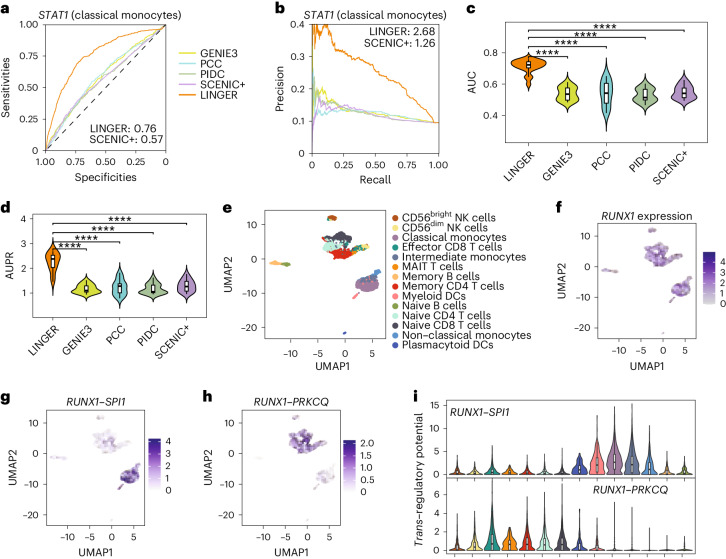
“Among the top 200 TGs regulated by STAT1 in classical monocytes, 67 of them overlap with the GWAS genes, which is statistically significant with a P value of less than 0.01 based on a background distribution from a random selection of TFs (one-sided bootstrap hypothesis testing).”
§ Inferring gene regulatory networks from single-cell multiome data using atlas-scale external data > Results > LINGER reveals the regulatory landscape of GWAS traits
plaincorrelational- Asserted: passes — The authors put it forward as true.
- Checkable: passes — It can be checked against evidence.
- Load-bearing: passes — The paper’s conclusions depend on it.
- Based: passes — The paper gives a reason why it holds.
It may state two separate claims as one.
A result the paper reports from its own data — it cites no other source for it, so there is none to check. The quote shows it is in the paper.
In the paper
“CellOracle predictions based on the LINGER GRN showed that GATA1 knockout shifted proerythroblasts to a megakaryocytic or erythroid progenitor state (Extended Data Fig. 4e), consistent with the functional role of GATA1 in inhibiting erythroblast maturation.”
§ Inferring gene regulatory networks from single-cell multiome data using atlas-scale external data > Results > In silico perturbation
plaindirect- Asserted: passes — The authors put it forward as true.
- Checkable: passes — It can be checked against evidence.
- Load-bearing: passes — The paper’s conclusions depend on it.
- Based: passes — The paper gives a reason why it holds.
It may state two separate claims as one.
A result the paper reports from its own data — it cites no other source for it, so there is none to check. The quote shows it is in the paper.
In the paper
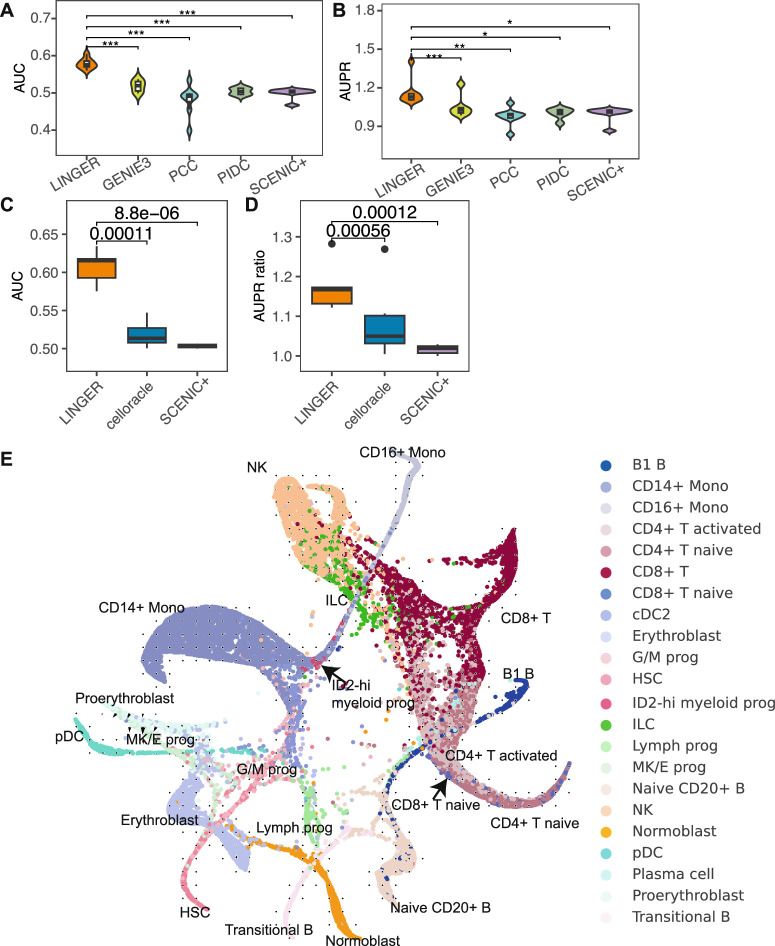
“Overall, LINGER consistently performs better than other methods for all 20 TFs in PBMCs, with a significantly higher AUC and AUPR ratio (P ≤ 9.49 × 10⁻⁹; Fig. 4c,d and Supplementary Table 7).”
§ Inferring gene regulatory networks from single-cell multiome data using atlas-scale external data > Results > LINGER improves the cell type-specific GRN inference
plaincorrelational- Asserted: passes — The authors put it forward as true.
- Checkable: passes — It can be checked against evidence.
- Load-bearing: passes — The paper’s conclusions depend on it.
- Based: passes — The paper gives a reason why it holds.
It may state two separate claims as one.
- Rests on an assumption: ChIP-seq putative targets are valid ground truth for trans-regulatory potential.
A result the paper reports from its own data — it cites no other source for it, so there is none to check. The quote shows it is in the paper.
In the paper
“Figure 5c lists the top eight candidate TFs in classical monocytes.”
§ Inferring gene regulatory networks from single-cell multiome data using atlas-scale external data > Results > LINGER reveals the regulatory landscape of GWAS traits
plain- Asserted: passes — The authors put it forward as true.
- Checkable: passes — It can be checked against evidence.
- Load-bearing: fails — The paper’s conclusions may not depend on it.
- Based: passes — The paper gives a reason why it holds.
Probably not a substantial claim. The paper’s conclusions may not depend on it.
A result the paper reports from its own data — it cites no other source for it, so there is none to check. The quote shows it is in the paper.
In the paper
“For all 20 TFs in PBMCs, LINGER consistently exhibits the highest AUC and AUPR ratios, and the overall distributions are significantly higher than others in PBMCs (P ≤ 8.72 × 10⁻⁵; Fig. 3b,c and Supplementary Table 6).”
§ Inferring gene regulatory networks from single-cell multiome data using atlas-scale external data > Results > LINGER improves the cell type-specific GRN inference
plaincorrelational- Asserted: passes — The authors put it forward as true.
- Checkable: passes — It can be checked against evidence.
- Load-bearing: passes — The paper’s conclusions depend on it.
- Based: passes — The paper gives a reason why it holds.
It may state two separate claims as one.
A result the paper reports from its own data — it cites no other source for it, so there is none to check. The quote shows it is in the paper.
In the paper
“The numbers of overlapped TGs are all significant for the top 500, 1,000, 2,000 and 5,000 TGs (Fig. 5d).”
§ Inferring gene regulatory networks from single-cell multiome data using atlas-scale external data > Results > LINGER reveals the regulatory landscape of GWAS traits
plaincorrelational- Asserted: passes — The authors put it forward as true.
- Checkable: passes — It can be checked against evidence.
- Load-bearing: passes — The paper’s conclusions depend on it.
- Based: passes — The paper gives a reason why it holds.
It may state two separate claims as one.
A result the paper reports from its own data — it cites no other source for it, so there is none to check. The quote shows it is in the paper.
In the paper
“The average AUPR ratio across ground truth datasets for other methods was 1.17–1.29, 0.17–0.29 units above random prediction, whereas LINGER achieves 1.25 units above random prediction, indicating a fourfold to sevenfold relative increase (Fig. 4d).”
§ Inferring gene regulatory networks from single-cell multiome data using atlas-scale external data > Results > LINGER improves the cell type-specific GRN inference
hedgeddirect- Asserted: passes — The authors put it forward as true.
- Checkable: passes — It can be checked against evidence.
- Load-bearing: passes — The paper’s conclusions depend on it.
- Based: passes — The paper gives a reason why it holds.
It may state two separate claims as one.
- Rests on an assumption: ChIP-seq putative targets are valid ground truth for trans-regulatory potential.
A result the paper reports from its own data — it cites no other source for it, so there is none to check. The quote shows it is in the paper.
In the paper
“Compared to 0, weight 0.01 improved the performance on 100% (Extended Data Fig. 2c) and 80% (Extended Data Fig. 2d) of ground truth data based on the AUC and AUPR ratio, respectively.”
§ Inferring gene regulatory networks from single-cell multiome data using atlas-scale external data > Results > LINGER improves the cellular population GRN inference
plaindirect- Asserted: passes — The authors put it forward as true.
- Checkable: passes — It can be checked against evidence.
- Load-bearing: passes — The paper’s conclusions depend on it.
- Based: passes — The paper gives a reason why it holds.
It may state two separate claims as one.
A result the paper reports from its own data — it cites no other source for it, so there is none to check. The quote shows it is in the paper.
In the paper
“Taking eQTL as ground truth, the F1 score of LINGER is significantly higher than SCENIC+ (Fig. 3k) and other cell types (Extended Data Fig. 3k–o).”
§ Inferring gene regulatory networks from single-cell multiome data using atlas-scale external data > Results > LINGER improves the cell type-specific GRN inference
plaincorrelational- Asserted: passes — The authors put it forward as true.
- Checkable: passes — It can be checked against evidence.
- Load-bearing: passes — The paper’s conclusions depend on it.
- Based: passes — The paper gives a reason why it holds.
It may state two separate claims as one.
None of the sources cited for this claim could be matched to a paper in Crossref, so there is nothing to check it against.
In the paper
“Those methods, including IReNA32, SOMatic33, UnpairReg34, CoupledNMF35,36, DC3 (ref. 36) and others37 link TFs to REs by motif matching and link REs to TGs using the covariation of RE–TG or physical base pair distance.”
§ Inferring gene regulatory networks from single-cell multiome data using atlas-scale external data > Main
What the sources say
- Not matchedcites IReNA32
Couldn’t be matched to a paper in Crossref, so it can’t be checked.
- Not matchedcites SOMatic33
Couldn’t be matched to a paper in Crossref, so it can’t be checked.
- Not matchedcites UnpairReg34
Couldn’t be matched to a paper in Crossref, so it can’t be checked.
plaincorrelational- Asserted: passes — The authors put it forward as true.
- Checkable: passes — It can be checked against evidence.
- Load-bearing: unclear — It is unclear whether the paper’s conclusions depend on it.
- Based: passes — The paper gives a reason why it holds.
It may state two separate claims as one.
- Not matched
In the paper
“Single-cell sequencing assay for transposase-accessible chromatin (scATAC-seq) can be used to infer trans-regulation, as in DeepTFni31.”
§ Inferring gene regulatory networks from single-cell multiome data using atlas-scale external data > Main
What the sources say
- Not checked — no full text of the sourcecites [31] Li, H. et al. Inferring transcription factor regulatory networks from single-cell ATAC-seq data based on graph neural networks. Nat. Mach. Intell. 4, 389–400 (2022). source
plaindirect- Asserted: passes — The authors put it forward as true.
- Checkable: passes — It can be checked against evidence.
- Load-bearing: fails — The paper’s conclusions may not depend on it.
- Based: passes — The paper gives a reason why it holds.
Probably not a substantial claim. The paper’s conclusions may not depend on it.
In the paper
“Moreover, co-expressions are interpreted as correlations rather than causal regulations16.”
§ Inferring gene regulatory networks from single-cell multiome data using atlas-scale external data > Main
What the sources say
- Not checked — no full text of the sourcecites [16] Wang, Y. X. R. & Huang, H. Review on statistical methods for gene network reconstruction using expression data. J. Theor. Biol. 362, 53–61 (2014). source
plaincorrelational- Asserted: passes — The authors put it forward as true.
- Checkable: passes — It can be checked against evidence.
- Load-bearing: passes — The paper’s conclusions depend on it.
- Based: passes — The paper gives a reason why it holds.
Probably not a substantial claim.
None of the sources cited for this claim could be matched to a paper in Crossref, so there is nothing to check it against.
In the paper
“Co-expression-based methods such as WGCNA14, ARACNe9 and GENIE3 (ref. 15) infer the TF–TG trans-regulation from gene expression by capturing the TF–TG covariation.”
§ Inferring gene regulatory networks from single-cell multiome data using atlas-scale external data > Main
What the sources say
- Not matchedcites WGCNA14
Couldn’t be matched to a paper in Crossref, so it can’t be checked.
- Not matchedcites ARACNe9
Couldn’t be matched to a paper in Crossref, so it can’t be checked.
- Not matchedcites GENIE3 (ref. 15)
Couldn’t be matched to a paper in Crossref, so it can’t be checked.
plaindirect- Asserted: passes — The authors put it forward as true.
- Checkable: passes — It can be checked against evidence.
- Load-bearing: passes — The paper’s conclusions depend on it.
- Based: passes — The paper gives a reason why it holds.
Probably not a substantial claim.
- Not matched
What the paper did — it cites no source for this, so there is none to check. The quote shows it is in the paper.
In the paper
“We assessed the gene expression prediction ability of the two models using fivefold cross-validation.”
§ Inferring gene regulatory networks from single-cell multiome data using atlas-scale external data > Results > LINGER improves the cellular population GRN inference
plain- Asserted: passes — The authors put it forward as true.
- Checkable: passes — It can be checked against evidence.
- Load-bearing: passes — The paper’s conclusions depend on it.
- Based: passes — The paper gives a reason why it holds.
Probably not a substantial claim.
The paper states this without a source or data behind it here, so there is nothing to check it against. The quote shows it is in the paper.
In the paper
“Many methods integrate unpaired scRNA-seq and scATAC-seq data to infer trans-regulation.”
§ Inferring gene regulatory networks from single-cell multiome data using atlas-scale external data > Main
plaincorrelational- Asserted: passes — The authors put it forward as true.
- Checkable: passes — It can be checked against evidence.
- Load-bearing: fails — The paper’s conclusions may not depend on it.
- Based: passes — The paper gives a reason why it holds.
Probably not a substantial claim. The paper’s conclusions may not depend on it.
A conclusion the paper draws from its own results — it cites no other source for it, so there is none to check. The quote shows it is in the paper.
In the paper
“The extent to which the final result deviates from the prior knowledge depends on the loss incurred in fitting the new data.”
§ Inferring gene regulatory networks from single-cell multiome data using atlas-scale external data > Conclusions and discussions
plaindirect- Asserted: passes — The authors put it forward as true.
- Checkable: passes — It can be checked against evidence.
- Load-bearing: passes — The paper’s conclusions depend on it.
- Based: fails — The paper may give no reason why it holds.
Probably not a substantial claim. The paper may give no reason why it holds.
A conclusion the paper draws from its own results — it cites no other source for it, so there is none to check. The quote shows it is in the paper.
In the paper
“The lack of significant overlap between DEGs and GWAS genes (P = 0.15, two-sided Fisher’s exact test) but the significant overlap of both DEGs and GWAS with the top-ranked TGs of STAT1 indicates the robustness and unbiased nature of our method.”
§ Inferring gene regulatory networks from single-cell multiome data using atlas-scale external data > Results > LINGER reveals the regulatory landscape of GWAS traits
hedgedcorrelational- Asserted: passes — The authors put it forward as true.
- Checkable: passes — It can be checked against evidence.
- Load-bearing: passes — The paper’s conclusions depend on it.
- Based: passes — The paper gives a reason why it holds.
It may state two separate claims as one.
A conclusion the paper draws from its own results — it cites no other source for it, so there is none to check. The quote shows it is in the paper.
In the paper
“These results demonstrate that LINGER can not only predict gene expression under perturbation but also enable downstream characterizations of differentiation trajectories through integration with complementary analytical frameworks like CellOracle.”
§ Inferring gene regulatory networks from single-cell multiome data using atlas-scale external data > Results > In silico perturbation
boosteddirectSingle case- Asserted: passes — The authors put it forward as true.
- Checkable: passes — It can be checked against evidence.
- Load-bearing: passes — The paper’s conclusions depend on it.
- Based: passes — The paper gives a reason why it holds.
It may state two separate claims as one.
A conclusion the paper draws from its own results — it cites no other source for it, so there is none to check. The quote shows it is in the paper.
In the paper
“The flexibility of the variation in prior knowledge is not constrained when fitting the new data.”
§ Inferring gene regulatory networks from single-cell multiome data using atlas-scale external data > Conclusions and discussions
plain- Asserted: passes — The authors put it forward as true.
- Checkable: passes — It can be checked against evidence.
- Load-bearing: passes — The paper’s conclusions depend on it.
- Based: fails — The paper may give no reason why it holds.
Probably not a substantial claim. The paper may give no reason why it holds.
A conclusion the paper draws from its own results — it cites no other source for it, so there is none to check. The quote shows it is in the paper.
In the paper
“LINGER’s lifelong learning approach has the advantage of pre-training on bulk collections, allowing users to easily retrain the model for their own studies while capitalizing on publicly available resources without direct access.”
§ Inferring gene regulatory networks from single-cell multiome data using atlas-scale external data > Conclusions and discussions
plaindirect- Asserted: passes — The authors put it forward as true.
- Checkable: passes — It can be checked against evidence.
- Load-bearing: passes — The paper’s conclusions depend on it.
- Based: fails — The paper may give no reason why it holds.
Probably not a substantial claim. The paper may give no reason why it holds. It may state two separate claims as one.
A conclusion the paper draws from its own results — it cites no other source for it, so there is none to check. The quote shows it is in the paper.
In the paper
“The first hidden layer has 64 neurons with rectified linear unit activation that can capture regulatory modules, each of which contains multiple TFs and REs.”
§ Inferring gene regulatory networks from single-cell multiome data using atlas-scale external data > Methods > GRN inference by lifelong learning
plaindirect- Asserted: passes — The authors put it forward as true.
- Checkable: passes — It can be checked against evidence.
- Load-bearing: fails — The paper’s conclusions may not depend on it.
- Based: passes — The paper gives a reason why it holds.
Probably not a substantial claim. The paper’s conclusions may not depend on it. It may state two separate claims as one.
The paper states this without a source or data behind it here, so there is nothing to check it against. The quote shows it is in the paper.
In the paper
“For a random predictor, the AUPR equals the fraction of positive samples in the dataset.”
§ Inferring gene regulatory networks from single-cell multiome data using atlas-scale external data > Methods > AUPR ratio
plain- Asserted: passes — The authors put it forward as true.
- Checkable: passes — It can be checked against evidence.
- Load-bearing: fails — The paper’s conclusions may not depend on it.
- Based: fails — The paper may give no reason why it holds.
Probably not a substantial claim. The paper’s conclusions may not depend on it. The paper may give no reason why it holds.
A conclusion the paper draws from its own results — it cites no other source for it, so there is none to check. The quote shows it is in the paper.
In the paper
“These regulatory modules are characterized by enriched motifs of the TFs on the corresponding REs.”
§ Inferring gene regulatory networks from single-cell multiome data using atlas-scale external data > Methods > GRN inference by lifelong learning
plaincorrelational- Asserted: passes — The authors put it forward as true.
- Checkable: passes — It can be checked against evidence.
- Load-bearing: fails — The paper’s conclusions may not depend on it.
- Based: fails — The paper may give no reason why it holds.
Probably not a substantial claim. The paper’s conclusions may not depend on it. The paper may give no reason why it holds.
A conclusion the paper draws from its own results — it cites no other source for it, so there is none to check. The quote shows it is in the paper.
In the paper
“The lifelong learning mechanism will encourage the model to retain prior knowledge from the bulk data when adapting to the new single-cell data.”
§ Inferring gene regulatory networks from single-cell multiome data using atlas-scale external data > Conclusions and discussions
hedgeddirect- Asserted: passes — The authors put it forward as true.
- Checkable: passes — It can be checked against evidence.
- Load-bearing: passes — The paper’s conclusions depend on it.
- Based: fails — The paper may give no reason why it holds.
Probably not a substantial claim. The paper may give no reason why it holds.
A conclusion the paper draws from its own results — it cites no other source for it, so there is none to check. The quote shows it is in the paper.
In the paper
“LINGER will learn this tradeoff automatically to obtain a maximized usage of the information from both datasets.”
§ Inferring gene regulatory networks from single-cell multiome data using atlas-scale external data > Conclusions and discussions
plaindirect- Asserted: passes — The authors put it forward as true.
- Checkable: passes — It can be checked against evidence.
- Load-bearing: passes — The paper’s conclusions depend on it.
- Based: fails — The paper may give no reason why it holds.
Probably not a substantial claim. The paper may give no reason why it holds.
A conclusion the paper draws from its own results — it cites no other source for it, so there is none to check. The quote shows it is in the paper.
In the paper
“It is a tradeoff between retaining prior knowledge and fitting new data.”
§ Inferring gene regulatory networks from single-cell multiome data using atlas-scale external data > Conclusions and discussions
plaincorrelational- Asserted: passes — The authors put it forward as true.
- Checkable: passes — It can be checked against evidence.
- Load-bearing: passes — The paper’s conclusions depend on it.
- Based: passes — The paper gives a reason why it holds.
Probably not a substantial claim.
The paper relies on this without support.
Most single-cell data points are not independent.
“Although single-cell data offers a large number of cells, most of them are not independent.”
The paper relies on this without support.
Incorporating prior knowledge such as motif matching into non-linear models is challenging.
“Second, incorporating prior knowledge such as motif matching into non-linear models is challenging.”
The paper relies on this without support.
Learning a complex mechanism like GRN from limited data points remains a challenge.
“First, learning such a complex mechanism from limited data points remains a challenge.”
The paper relies on this without support.
Shapley value estimates the contribution of each feature for each gene.
“we infer the regulatory strength of TF–TG and RE–TG interactions using the Shapley value, which estimates the contribution of each feature for each gene.”
The paper relies on this without support.
The correlation of TF and RE parameters learned in the second layer reflects TF–RE binding strength.
“The TF–RE binding strength is generated by the correlation of TF and RE parameters learned in the second layer (Fig. 1a).”
The paper relies on this without support.
ChIP-seq putative targets are valid ground truth for trans-regulatory potential.
“The ground truth data in a–d are putative targets of TFs from ChIP–seq data for the corresponding cell types in PBMCs.”
The paper relies on this without support.
Perturbation experiment data from KnockTF are valid ground truth for direct DEGs under TF perturbation.
“using perturbation experiment data as ground truth”
The paper relies on this without support.
The underlying regulatory drivers of disease remain elusive despite researchers often identifying DEGs between cases and controls using bulk or single-cell expression data.
“Researchers often identify DEGs between cases and controls using bulk or single-cell expression data, but the underlying regulatory drivers remain elusive.”
The paper relies on this without support.
TF activity, focusing on the DNA-binding component of TF proteins, is a more reliable metric than mRNA for identifying driver regulators.
“TF activity, focusing on the DNA-binding component of TF proteins, is a more reliable metric than mRNA for identifying driver regulators.”
The paper relies on this without support.
Estimating TF activity based on the expression patterns of downstream TGs requires an accurate GRN.
“One feasible approach is to estimate TF activity based on the expression patterns of downstream TGs, which necessitates the availability of an accurate GRN.”
The authors state this as an assumption.
The GRN structure is consistent for the same cell type across individuals.
“Assuming that the GRN structure is consistent for the same cell type across individuals”
The paper relies on this without support.
Traditionally, GRN inference performance is assessed by gene expression prediction.
“Traditionally, GRN inference performance is assessed by gene expression prediction.”
Self-check
Percentages, sums and reported differences re-computed from the paper’s own numbers.
Each contradiction between two passages listed here was confirmed by an independent check.
Rated major: it would touch a result — a value a result rests on, reported and recomputed p-values on opposite sides of the significance level, two passages that conflict with no sign which is right, or a cited work retracted before this paper was published.
In the paper
§ Inferring gene regulatory networks from single-cell multiome data using atlas-scale external data > Results > Identify driver regulators based on transcription profiles
“FOXK2 and NR4A1 are activated at 8 h based on regulon activity (Fig. 6d), which is consistent with the whole proteomics and phosphoproteomics data (Fig. 6e)76.”
§ Inferring gene regulatory networks from single-cell multiome data using atlas-scale external data > Results > Identify driver regulators based on transcription profiles
“Two-sided unpaired t-test for the difference in regulon activity, P = 0.0057 and P = 0.00081 for FOXK1 and NR4A1, respectively; the P value for gene expression is >0.05.”
Rated minor: it would not touch a result — a value no result rests on, a p-value that stays on the same side of the significance level, or a conflict that is clerical, resolved elsewhere in the paper, or outside its own findings.
In the paper
§ Inferring gene regulatory networks from single-cell multiome data using atlas-scale external data > Results > LINGER improves the cell type-specific GRN inference
“For c, −log10(P values) are 11.12, 7.72, 11,13 and 10.17 for GENIE3, PCC, PIDC and SCENIC+, respectively.”
§ Inferring gene regulatory networks from single-cell multiome data using atlas-scale external data > Results > LINGER improves the cell type-specific GRN inference
“Overall, LINGER consistently performs better than other methods for all 20 TFs in PBMCs, with a significantly higher AUC and AUPR ratio (P ≤ 9.49 × 10⁻⁹; Fig. 4c,d and Supplementary Table 7).”
Citations
Cites
An integrated encyclopedia of DNA elements in the human genome
The ENCODE Project Consortium (2012) · Nature · doi:10.1038/nature11247 · Cited by 18,072
Integrated analysis of multimodal single-cell data
Hao, Y., Hao, S., Andersen-Nissen, E., Mauck, W. M., Zheng, S., Butler, A., Lee, M. J., Wilk, A. J., Darby, C., Zagar, M., et al. (2020) · doi:10.1101/2020.10.12.335331 · Cited by 15,508
Heinz, S., Benner, C., Spann, N., Bertolino, E., Lin, Y. C., Laslo, P., Cheng, J. X., Murre, C., Singh, H., & Glass, C. K. (2010) · Molecular Cell · doi:10.1016/j.molcel.2010.05.004 · Cited by 13,382 · cited 1×
“We perform the motif enrichment analysis 86 to identify the motifs significantly enriched in the binding sites of the top 5,000 cell type-specific REs.”
Enrichr: a comprehensive gene set enrichment analysis web server 2016 update
Kuleshov, M. V., Jones, M. R., Rouillard, A. D., Fernandez, N. F., Duan, Q., Wang, Z., Koplev, S., Jenkins, S. L., Jagodnik, K. M., Lachmann, A., et al. (2016) · Nucleic Acids Research · doi:10.1093/nar/gkw377 · Cited by 10,799 · cited 1×
“Functional enrichment analysis 53 shows that the cis -regulatory dominant genes were significantly enriched in 38 GTEx aging signatures (Supplementary Table 3), which aligns with the conclusion that chromatin accessibility alterations occur in age-related macular degeneration 54 .”
Analysis of protein-coding genetic variation in 60,706 humans
Exome Aggregation Consortium, Lek, M., Karczewski, K. J., Minikel, E. V., Samocha, K. E., Banks, E., Fennell, T., O’Donnell-Luria, A. H., Ware, J. S., Hill, A. J., et al. (2016) · Nature · doi:10.1038/nature19057 · Cited by 9,587 · cited 1×
“To discern evolutionary distinctions between trans -dominant and cis -dominant genes, we compared their strength of selection using pLI, which is an estimate of the ‘probability of being loss of function intolerant’ 51 .”
Overcoming catastrophic forgetting in neural networks
Kirkpatrick, J., Pascanu, R., Rabinowitz, N., Veness, J., Desjardins, G., Rusu, A. A., Milan, K., Quan, J., Ramalho, T., Grabska-Barwinska, A., et al. (2017) · Proceedings of the National Academy of Sciences · doi:10.1073/pnas.1611835114 · Cited by 7,899 · cited 1×
“EWC regularization encourages the posterior to remain close to the prior, retaining knowledge while adapting, preventing excessive changes and ensuring a more stable learning process 47 .”
Scenic: single-cell regulatory network inference and clustering.
Aibar, S., González-Blas, C. B., Moerman, T., Huynh-Thu, V. A., Imrichova, H., Hulselmans, G., Rambow, F., Marine, J.-C., Geurts, P., Aerts, J., et al. (2017) · Nature Methods · doi:10.1038/nmeth.4463 · Cited by 6,520
Buenrostro, J. D., Giresi, P. G., Zaba, L. C., Chang, H. Y., & Greenleaf, W. J. (2013) · Nature Methods · doi:10.1038/nmeth.2688 · Cited by 6,422 · cited 1×
“Genome-wide measurements of chromatin accessibility, such as DNase-seq 17 and assay for transposase-accessible chromatin sequencing (ATAC-seq) 18 , locate REs, enabling TF–”
Continual lifelong learning with neural networks: A review
Parisi, G. I., Kemker, R., Part, J. L., Kanan, C., & Wermter, S. (2019) · Neural Networks · doi:10.1016/j.neunet.2019.01.012 · Cited by 3,117
Võsa, U., Claringbould, A., Westra, H.-J., Bonder, M. J., Deelen, P., Zeng, B., Kirsten, H., Saha, A., Kreuzhuber, R., Yazar, S., et al. (2021) · Nature Genetics · doi:10.1038/s41588-021-00913-z · Cited by 2,607
Margolin, A. A., Nemenman, I., Basso, K., Wiggins, C., Stolovitzky, G., Favera, R. D., & Califano, A. (2006) · BMC Bioinformatics · doi:10.1186/1471-2105-7-s1-s7 · Cited by 2,420
Margolin, A. A., Nemenman, I. M., Basso, K., Wiggins, C. H., Stolovitzky, G. A., Favera, R. D., & Califano, A. (2006) · BMC Bioinformatics · doi:10.7916/d8g15zbp · Cited by 2,260
Inferring Regulatory Networks from Expression Data Using Tree-Based Methods
Huynh-Thu, V. A., Irrthum, A., Wehenkel, L., & Geurts, P. (2010) · PLoS ONE · doi:10.1371/journal.pone.0012776 · Cited by 2,131
The NHGRI-EBI GWAS Catalog: knowledgebase and deposition resource
Sollis, E., Mosaku, A., Abid, A., Buniello, A., Cerezo, M., Gil, L., Groza, T., Güneş, O., Hall, P., Hayhurst, J., et al. (2023) · Nucleic Acids Research · doi:10.1093/nar/gkac1010 · Cited by 1,641 · cited 1×
“In our specific study on inflammatory bowel disease (IBD), we collected the risk loci based on a GWAS meta-analysis of about 330,000 individuals from the NHGRI-EBI GWAS catalog 62 for study GCST90225550 63 .”
High-Resolution Mapping and Characterization of Open Chromatin across the Genome
Boyle, A. P., Davis, S., Shulha, H. P., Meltzer, P., Margulies, E. H., Weng, Z., Furey, T. S., & Crawford, G. E. (2008) · Cell · doi:10.1016/j.cell.2007.12.014 · Cited by 1,415
Javierre, B. M., Burren, O. S., Wilder, S. P., Kreuzhuber, R., Hill, S. M., Sewitz, S., Cairns, J., Wingett, S. W., Várnai, C., Thiecke, M. J., et al. (2016) · Cell · doi:10.1016/j.cell.2016.09.037 · Cited by 1,046
On the Regulation of Gene ActivityPreprint
Jacob, F., & Monod, J. (1961) · Cold Spring Harbor Symposia on Quantitative Biology · doi:10.1101/sqb.1961.026.01.024 · Cited by 891 · cited 1×
“GRNs 1,2 are collections of molecular regulators that interact with each other and determine gene activation and silencing in specific cellular contexts.”
High-throughput sequencing of the transcriptome and chromatin accessibility in the same cell
Chen, S., Lake, B. B., & Zhang, K. (2019) · Nature Biotechnology · doi:10.1038/s41587-019-0290-0 · Cited by 810 · cited 1×
“We evaluated the cell type-specific GRN inference (Methods) of LINGER in PBMCs sc-multiome data as well as an in-silico mixture of H1, BJ, GM12878 and K562 cell lines from single-nucleus chromatin accessibility and mRNA expression sequencing (SNARE-seq) data 55 .”
Benchmarking algorithms for gene regulatory network inference from single-cell transcriptomic data
Pratapa, A., Jalihal, A. P., Law, J. N., Bharadwaj, A., & Murali, T. M. (2020) · Nature Methods · doi:10.1038/s41592-019-0690-6 · Cited by 792 · cited 3×
“Despite extensive efforts, GRN inference accuracy has remained disap-pointingly low, marginally exceeding random predictions 39 .”
SCENIC+: single-cell multiomic inference of enhancers and gene regulatory networks
González-Blas, C. B., De Winter, S., Hulselmans, G., Hecker, N., Matetovici, I., Christiaens, V., Poovathingal, S., Wouters, J., Aibar, S., & Aerts, S. (2022) · doi:10.1101/2022.08.19.504505 · Cited by 778
SCENIC+: single-cell multiomic inference of enhancers and gene regulatory networks
Bravo González-Blas, C., De Winter, S., Hulselmans, G., Hecker, N., Matetovici, I., Christiaens, V., Poovathingal, S., Wouters, J., Aibar, S., & Aerts, S. (2023) · Nature Methods · doi:10.1038/s41592-023-01938-4 · Cited by 778
Innate Immune Activity Conditions the Effect of Regulatory Variants upon Monocyte Gene Expression
Fairfax, B. P., Humburg, P., Makino, S., Naranbhai, V., Wong, D., Lau, E., Jostins, L., Plant, K., Andrews, R., McGee, C., et al. (2014) · Science · doi:10.1126/science.1246949 · Cited by 764 · cited 3×
“2d,e) as well as GTEx (Extended Data Fig.”
Gene regulatory network inference: Data integration in dynamic models—A review
Hecker, M., Lambeck, S., Toepfer, S., van Someren, E., & Guthke, R. (2009) · Biosystems · doi:10.1016/j.biosystems.2008.12.004 · Cited by 755 · cited 2×
“Inference of GRNs is a central problem 2–4 , and there have been many attempts to approach this issue 2,5–13 .”
Cistrome: an integrative platform for transcriptional regulation studies
Liu, T., Ortiz, J. A., Taing, L., Meyer, C. A., Lee, B. T. K., Zhang, Y., Shin, H., Wong, S. S., Ma, J., Lei, Y., et al. (2011) · Genome biology · doi:10.1186/gb-2011-12-8-r83 · Cited by 722 · cited 2×
“RE binding prediction, we used ChIP–seq data as ground truth, including 20 TFs from four cell types within the blood and 33 TFs from the H1 cell line 48 (Supplementary Table 4).”
Single-cell eQTL mapping identifies cell type–specific genetic control of autoimmune disease
Yazar, S., Alquicira-Hernandez, J., Wing, K., Senabouth, A., Gordon, M. G., Andersen, S., Lu, Q., Rowson, A., Taylor, T. R. P., Clarke, L., et al. (2022) · Science · doi:10.1126/science.abf3041 · Cited by 682 · cited 1×
“For the cis -regulatory potential, we incorporated promoter-capture Hi-C data of three primary blood cell types (Supplementary Table 5) 56 and single-cell eQTL 57 , including six immune cell types as ground truth for PBMCs.”
Dissecting cell identity via network inference and in silico gene perturbation
Kamimoto, K., Stringa, B., Hoffmann, C. M., Jindal, K., Solnica-Krezel, L., & Morris, S. A. (2023) · Nature · doi:10.1038/s41586-022-05688-9 · Cited by 677 · cited 5×
“We used the LINGER-inferred GRN as an input to CellOracle.”
InfluentialGRNBoost2 and Arboreto: efficient and scalable inference of gene regulatory networks
Moerman, T., Aibar Santos, S., Bravo González-Blas, C., Simm, J., Moreau, Y., Aerts, J., & Aerts, S. (2019) · Bioinformatics · doi:10.1093/bioinformatics/bty916 · Cited by 621
Zou, M., & Conzen, S. D. (2005) · Bioinformatics · doi:10.1093/bioinformatics/bth463 · Cited by 587
Gene Regulatory Network Inference from Single-Cell Data Using Multivariate Information Measures
Chan, T. E., Stumpf, M. P. H., & Babtie, A. C. (2017) · Cell Systems · doi:10.1016/j.cels.2017.08.014 · Cited by 578
Thrun, S., & Mitchell, T. M. (1995) · Robotics and Autonomous Systems · doi:10.1016/0921-8890(95)00004-y · Cited by 536 · cited 1×
“First, LINGER uses lifelong learning, a previously defined concept 43 that incorporates large-scale external bulk data, mitigating the challenge of limited data”
Gene regulatory network inference in the era of single-cell multi-omics
Badia-i-Mompel, P., Wessels, L., Müller‐Dott, S., Trimbour, R., Flores, R. O. R., Argelaguet, R., & Sáez-Rodríguez, J. (2023) · Nature Reviews Genetics · doi:10.1038/s41576-023-00618-5 · Cited by 507 · cited 1×
“Inference of GRNs is a central problem 2–4 , and there have been many attempts to approach this issue 2,5–13 .”
Circuitry and Dynamics of Human Transcription Factor Regulatory Networks
Neph, S., Stergachis, A. B., Reynolds, A., Sandstrom, R., Borenstein, E., & Stamatoyannopoulos, J. A. (2012) · Cell · doi:10.1016/j.cell.2012.04.040 · Cited by 467 · cited 11×
“In our approach, we use a neural network model to fit the expression of TGs, taking as input TF expression and the accessibility of REs.”
InfluentialMatsumoto, H., Kiryu, H., Furusawa, C., Ko, M. S. H., Ko, S. B. H., Gouda, N., Hayashi, T., & Nikaido, I. (2017) · Bioinformatics · doi:10.1093/bioinformatics/btx194 · Cited by 439
Gene networks inference using dynamic Bayesian networks
Perrin, B.-E., Ralaivola, L., Mazurie, A., Bottani, S., Mallet, J. J., & d’Alché–Buc, F. (2003) · Bioinformatics · doi:10.1093/bioinformatics/btg1071 · Cited by 425
NF‐κB: roles and regulation in different CD 4+ T‐cell subsets
Oh, H., & Ghosh, S. (2013) · Immunological Reviews · doi:10.1111/imr.12033 · Cited by 408
Integrative Analysis of Drug Response and Clinical Outcome in Acute Myeloid Leukemia
Bottomly, D., Long, N., Schultz, A. R., Kurtz, S. E., Tognon, C. E., Johnson, K., Abel, M., Agarwal, A., Avaylon, S., Benton, E., et al. (2022) · Cancer Cell · doi:10.1016/j.ccell.2022.07.002 · Cited by 403
Yang, K., Shrestha, S., Zeng, H., Karmaus, P. W. F., Neale, G. A. M., Vogel, P., Guertin, D. A., Lamb, R. F., & Chi, H. (2013) · Immunity · doi:10.1016/j.immuni.2013.09.015 · Cited by 397 · cited 1×
“Example 2: We also present an example of the naive CD4 + T cell response upon T cell receptor (TCR) stimulation 75 , which induces T cell differentiation into various effector cells and activates T lymphocytes.”
Bansal, M., Gatta, G. D., & di Bernardo, D. (2006) · Bioinformatics · doi:10.1093/bioinformatics/btl003 · Cited by 389 · cited 1×
“Inference of GRNs is a central problem 2–4 , and there have been many attempts to approach this issue 2,5–13 .”
Weighted gene coexpression network analysis strategies applied to mouse weight
Fuller, T. F., Ghazalpour, A., Aten, J. E., Drake, T. A., Lusis, A. J., & Horvath, S. (2007) · Mammalian Genome · doi:10.1007/s00335-007-9043-3 · Cited by 372 · cited 1×
“Co-expression-based meth-ods such as WGCNA 14 , ARACNe 9 and GENIE3 (ref.”
Tan, H., Yang, K., Li, Y., Shaw, T. I., Wang, Y., Blanco, D. B., Wang, X., Cho, J.-H., Wang, H., Rankin, S., et al. (2017) · Immunity · doi:10.1016/j.immuni.2017.02.010 · Cited by 372 · cited 1×
“6e) 76 .”
The Shapley Value in Machine Learning
Rózemberczki, B., Watson, L., Bayer, P., Yang, H.-T., Kiss, O., Nilsson, S., & Sarkar, R. (2022) · International Joint Conference on Artificial Intelligence · doi:10.24963/ijcai.2022/778 · Cited by 342 · cited 1×
“The Shapley value measures the contribution of features in a machine-learning model and is widely used in algorithms such as deep learning, graphical models and reinforcement learning 85 .”
Systematic differences in discovery of genetic effects on gene expression and complex traits
Mostafavi, H., Spence, J. P., Naqvi, S., & Pritchard, J. K. (2023) · Nature Genetics · doi:10.1038/s41588-023-01529-1 · Cited by 336 · cited 1×
“A previous study found that disease-associated genes from GWAS were enriched in selectively constrained genes, while eQTL genes were depleted in selectively constrained genes 52 .”
Inferring gene regulatory networks from multiple microarray datasets
Wang, Y., Joshi, T., Zhang, X., Xu, D. H., & Chen, L. (2006) · Bioinformatics · doi:10.1093/bioinformatics/btl396 · Cited by 324
The Shapley Value in Machine Learning
Rozemberczki, B., Watson, L., Bayer, P., Yang, H.-T., Kiss, O., Nilsson, S., & Sarkar, R. (2022) · arXiv · doi:10.48550/arxiv.2202.05594 · Cited by 312
Jagadeesh, K. A., Dey, K. K., Montoro, D. T., Mohan, R., Gazal, S., Engreitz, J. M., Xavier, R. J., Price, A. L., & Regev, A. (2022) · Nature Genetics · doi:10.1038/s41588-022-01187-9 · Cited by 239 · cited 1×
“GWASs have identified thousands of disease variants, but the active cells and functions involving variant-regulated genes remain largely unknown 61 .”
Papili Gao, N., Ud-Dean, S. M. M., Gandrillon, O., & Gunawan, R. (2018) · Bioinformatics · doi:10.1093/bioinformatics/btx575 · Cited by 235
Integrative analysis of single-cell genomics data by coupled nonnegative matrix factorizations
Duren, Z., Chen, X. X., Zamanighomi, M., Zeng, W., Satpathy, A. T., Chang, H. Y., Wang, Y., & Wong, W. H. (2018) · Proceedings of the National Academy of Sciences · doi:10.1073/pnas.1805681115 · Cited by 197 · cited 1×
“Those meth-ods, including IReNA 32 , SOMatic 33 , UnpairReg 34 , CoupledNMF 35,36 , DC3 (ref.”
Self-citationSpecht, A. T., & Li, J. (2017) · Bioinformatics · doi:10.1093/bioinformatics/btw729 · Cited by 193
Identification of genes with abnormal expression changes in acute myeloid leukemia
Stirewalt, D. L., Meshinchi, S., Kopecky, K. J., Fan, W., Pogosova‐Agadjanyan, E. L., Engel, J. H., Cronk, M. R., Dorcy, K. S., McQuary, A. R., Hockenbery, D., et al. (2008) · Genes, Chromosomes and Cancer · doi:10.1002/gcc.20500 · Cited by 191 · cited 1×
“Example 1: We collected the bulk gene expression data from 26 patients with acute myeloid leukemia (AML) and 38 healthy donors 72 .”
Wang, J., Zibetti, C., Shang, P., Sripathi, S. R., Zhang, P., Cano, M., Hoang, T., Xia, S., Ji, H., Merbs, S. L., et al. (2018) · Nature Communications · doi:10.1038/s41467-018-03856-y · Cited by 185 · cited 1×
“Functional enrichment analysis 53 shows that the cis -regulatory dominant genes were significantly enriched in 38 GTEx aging signatures (Supplementary Table 3), which aligns with the conclusion that chromatin accessibility alterations occur in age-related macular degeneration 54 .”
Review on statistical methods for gene network reconstruction using expression data
Wang, Y. X. R., & Huang, H. (2014) · Journal of Theoretical Biology · doi:10.1016/j.jtbi.2014.03.040 · Cited by 182 · cited 1×
“Moreover, co-expressions are interpreted as correlations rather than causal regulations 16 .”
Molecular and Transcriptional Regulation of Megakaryocyte Differentiation
Shivdasani, R. A. (2001) · Stem Cells · doi:10.1634/stemcells.19-5-397 · Cited by 181
Mitogen activated protein kinases: a role in inflammatory bowel disease?
Broom, O. J., Widjaya, B., Troelsen, J., Olsen, J., & Nielsen, O. H. (2009) · Clinical and Experimental Immunology · doi:10.1111/j.1365-2249.2009.04033.x · Cited by 177 · cited 7×
“Finally, we extracted the sub-network of the eight candidate TFs from the classical monocyte trans -regulatory network for IBD (Fig.”
InfluentialWang, Z., Cui, M., Shah, A. M., Tan, W. H., Liu, N., Bassel‐Duby, R., & Olson, E. N. (2020) · Cell Reports · doi:10.1016/j.celrep.2020.108472 · Cited by 174
Modeling gene regulation from paired expression and chromatin accessibility data
Duren, Z., Chen, X., Jiang, R., Wang, Y., & Wong, W. (2017) · Proceedings of the National Academy of Sciences of the United States of America · doi:10.1073/pnas.1704553114 · Cited by 171 · cited 2×
“To overcome this limitation, we developed a statistical model, PECA 20 , to fit TG expression by TF expression and RE accessibility across a diverse panel of cell types.”
Self-citationscJoint integrates atlas-scale single-cell RNA-seq and ATAC-seq data with transfer learning
Lin, Y., Wu, T.-Y., Wan, S., Yang, J. Y. H., Wong, W. H., & Wang, Y. X. R. (2022) · Nature Biotechnology · doi:10.1038/s41587-021-01161-6 · Cited by 166 · cited 1×
“Recently, scJoint 38 was developed to transfer labels from scRNA-seq to scATAC-seq data, which may enable improved cell GRN inference.”
Sanchez-Castillo, M., Blanco, D., Tienda-Luna, I. M., Carrion, M. C., & Huang, Y. (2018) · Bioinformatics · doi:10.1093/bioinformatics/btx605 · Cited by 151
Feng, C., Song, C., Liu, Y., Qian, F., Gao, Y., Ning, Z., Wang, Q., Jiang, Y., Li, Y., Li, M., et al. (2020) · Nucleic Acids Research · doi:10.1093/nar/gkz881 · Cited by 147 · cited 1×
“We collected eight datasets for PBMCs (Supplementary Table 8) from the KnockTF database 59 .”
CytoTalk: De novo construction of signal transduction networks using single-cell transcriptomic data
Hu, Y., Peng, T., Gao, L., & Tan, K. (2021) · Science Advances · doi:10.1126/sciadv.abf1356 · Cited by 136
Inner Composition Alignment for Inferring Directed Networks from Short Time Series
Hempel, S., Koseska, A., Kurths, J., & Nikoloski, Z. (2011) · Physical Review Letters · doi:10.1103/physrevlett.107.054101 · Cited by 131
Nuclear receptor Nr4a1 modulates both regulatory T-cell (Treg) differentiation and clonal deletion
Fassett, M. S., Jiang, W., D'Alise, A. M., Mathis, D., & Benoist, C. (2012) · Proceedings of the National Academy of Sciences · doi:10.1073/pnas.1200090109 · Cited by 126
Zhang, S., Pyne, S., Pietrzak, S., Halberg, S., McCalla, S. G., Siahpirani, A. F., Sridharan, R., & Roy, S. (2023) · Nature Communications · doi:10.1038/s41467-023-38637-9 · Cited by 125 · cited 1×
“Single-cell RNA sequencing (scRNA-seq) data enables cell type-specific trans -regulation inference through co-expression analysis such as PIDC and SCENIC 21–30 .”
Aschenbrenner, D., Quaranta, M., Banerjee, S., Ilott, N., Jansen, J., Steere, B., Chen, Y.-H., Ho, S., Cox, K., Arancibia-Cárcamo, C. V., et al. (2021) · Gut · doi:10.1136/gutjnl-2020-321731 · Cited by 123 · cited 1×
“These findings align with previous studies linking monocytes to the pathogenesis of IBD 64,65 .”
Aubin-Frankowski, P.-C., & Vert, J.-P. (2020) · Bioinformatics · doi:10.1093/bioinformatics/btaa576 · Cited by 116
Fins, limbs, and tails: outgrowths and axial patterning in vertebrate evolution
Coates, M. I., & Cohn, M. J. (1998) · BioEssays · doi:10.1002/(sici)1521-1878(199805)20:5 · Cited by 107
Thrun, S., & Mitchell, T. M. (1995) · Springer eBooks · doi:10.1007/978-3-642-79629-6_7 · Cited by 107
Building gene regulatory networks from scATAC-seq and scRNA-seq using Linked Self Organizing Maps
Jansen, C. S., Ramírez, R. N., El-Ali, N. C., Gómez-Cabrero, D., Tegner, J. N., Merkenschlager, M., Conesa, A., & Mortazavi, A. (2019) · PLoS Computational Biology · doi:10.1371/journal.pcbi.1006555 · Cited by 91 · cited 1×
“Those meth-ods, including IReNA 32 , SOMatic 33 , UnpairReg 34 , CoupledNMF 35,36 , DC3 (ref.”
Limited overlap of eQTLs and GWAS hits due to systematic differences in discoveryPreprint
Mostafavi, H., Spence, J. P., Naqvi, S., & Pritchard, J. K. (2022) · bioRxiv (Cold Spring Harbor Laboratory) · doi:10.1101/2022.05.07.491045 · Cited by 86
Multimodal single cell data integration challenge: results and lessons learned
Lance, C., Luecken, M. D., Burkhardt, D. B., Cannoodt, R., Rautenstrauch, P., Laddach, A., Ubingazhibov, A., Cao, Z.-J., Deng, K., Khan, S., et al. (2022) · doi:10.1101/2022.04.11.487796 · Cited by 81 · cited 1×
“Examining bone marrow mononuclear cell data 82 , which contains progenitor populations, we performed an in silico knockout of GATA1 , a known key regulator of erythroid and megakaryocytic differentiation 83 .”
DC3 is a method for deconvolution and coupled clustering from bulk and single-cell genomics data
Zeng, W., Chen, X. X., Duren, Z., Wang, Y., Jiang, R., & Wong, W. H. (2019) · Nature Communications · doi:10.1038/s41467-019-12547-1 · Cited by 70 · cited 2×
“36) and others 37 link TFs to REs by motif matching and link REs Article https://doi.org/10.1038/s41587-024-02182-7 but extensive parameters.”
InfluentialSelf-citationRefining transcriptional regulatory networks using network evolutionary models and gene histories
Zhang, X., & Moret, B. M. E. (2010) · Algorithms for Molecular Biology · doi:10.1186/1748-7188-5-1 · Cited by 69
Li, H., Sun, Y., Hong, H., Huang, X., Tao, H., Huang, Q., Wang, L., Xu, K., Gan, J., Chen, H., et al. (2022) · Nature Machine Intelligence · doi:10.1038/s42256-022-00469-5 · Cited by 66 · cited 1×
“Single-cell sequencing assay for transposase-accessible chromatin (scATAC-seq) can be used to infer trans -regulation, as in DeepTFni 31 .”
Hu, S., Uniken Venema, W. T., Westra, H.-J., Vich Vila, A., Barbieri, R., Voskuil, M. D., Blokzijl, T., Jansen, B. H., Li, Y., Daly, M. J., et al. (2021) · Nature Communications · doi:10.1038/s41467-021-21458-z · Cited by 59 · cited 1×
“Apart from GWAS-relevant genes, we collected the DEGs between inflamed biopsies and non-inflamed biopsies 71 and we found that these DEGs significantly overlapped with the top-ranked TGs of STAT1 (one-sided bootstrap hypothesis testing; Fig.”
NF-κB and Extrinsic Cell Death Pathways – Entwined Do-or-Die Decisions for T cells
Blanchett, S., Boal-Carvalho, I., Layzell, S., & Seddon, B. (2021) · Trends in Immunology · doi:10.1016/j.it.2020.10.013 · Cited by 58 · cited 1×
“Other studies have also shown that FOXK2 affects the activation of T lymphocytes 77,78 and revealed the essential roles of NR4A1 in regulatory T cell differentiation 79,80 , suggesting that the identified TFs have important roles in naive CD4 + T cell response upon TCR stimulation.”
Benchmarking algorithms for gene regulatory network inference from single-cell transcriptomic dataPreprint
Pratapa, A., Jalihal, A. P., Law, J., et al. (2019) · bioRxiv (Cold Spring Harbor Laboratory) · doi:10.1101/642926 · Cited by 55
Satpathy, A. T., Briseño, C. G., Cai, X., Michael, D. G., Chou, C., Hsiung, S., Bhattacharya, D., Speck, N. A., & Egawa, T. (2014) · Blood · doi:10.1182/blood-2013-11-539643 · Cited by 54
Nowak, J. K., Adams, A. T., Kalla, R., Lindstrøm, J. C., Vatn, S., Bergemalm, D., Keita, Å. V., Gomollón, F., Jahnsen, J., Vatn, M. H., et al. (2022) · Journal of Crohn's and Colitis · doi:10.1093/ecco-jcc/jjac033 · Cited by 51 · cited 8×
“Finally, we extracted the sub-network of the eight candidate TFs from the classical monocyte trans -regulatory network for IBD (Fig.”
InfluentialTime course regulatory analysis based on paired expression and chromatin accessibility dataPreprint
Duren, Z., Chen, X. X., Xin, J., Wang, Y., & Wong, W. H. (2020) · Genome Research · doi:10.1101/gr.257063.119 · Cited by 50 · cited 3×
“We collected paired bulk data—gene expression profiles and chromatin accessibility matrices—from 201 samples from diverse cellular contexts 84 from the ENCODE project 46 .”
Self-citationYu, Y., Chen, M., Zhu, H., Zhuo, M., Chen, P., Mao, Y., Li, L., Zhao, Q., Wu, M., & Ye, M. (2021) · Clinical Epigenetics · doi:10.1186/s13148-021-01101-w · Cited by 47 · cited 7×
“Finally, we extracted the sub-network of the eight candidate TFs from the classical monocyte trans -regulatory network for IBD (Fig.”
InfluentialAnderson, A., Cherfane, C., Click, B., Ramos-Rivers, C., Koutroubakis, I. E., Hashash, J. G., Babichenko, D., Tang, G., Dunn, M., Barrie, A., et al. (2022) · Inflammatory Bowel Diseases · doi:10.1093/ibd/izab031 · Cited by 40 · cited 6×
“Finally, we extracted the sub-network of the eight candidate TFs from the classical monocyte trans -regulatory network for IBD (Fig.”
InfluentialJiang, J., Lyu, P., Li, J., Huang, S., Tao, J., Blackshaw, S., Qian, J. X., & Wang, J. (2022) · iScience · doi:10.1016/j.isci.2022.105359 · Cited by 40 · cited 1×
“Those meth-ods, including IReNA 32 , SOMatic 33 , UnpairReg 34 , CoupledNMF 35,36 , DC3 (ref.”
Duren, Z., Chang, F., Naqing, F., Xin, J., Liu, Q., & Wong, W. H. (2022) · Genome biology · doi:10.1186/s13059-022-02682-2 · Cited by 37 · cited 1×
“Recent advances in single-cell sequencing 40 provide opportunities to address these challenges 41 , exemplified by SCENIC+ 42 .”
Self-citationDuren, Z., Lu, W. S., Arthur, J. G., Shah, P., Xin, J., Meschi, F., Li, M. L., Nemec, C. M., Yin, Y., & Wong, W. H. (2021) · Nature Communications · doi:10.1038/s41467-021-25089-2 · Cited by 36 · cited 1×
“15) and PIDC 21 for comparison based on the benchmarking literature of GRN inference from single-cell data 39 that we chose in previous work 58 (see Methods).”
Self-citationGao, N. P., Ud-Dean, S. M. M., & Gunawan, R. (2016) · bioRxiv (Cold Spring Harbor Laboratory) · doi:10.1101/089110 · Cited by 30
Matsumoto, H., Kiryu, H., Furusawa, C., et al. (2016) · bioRxiv (Cold Spring Harbor Laboratory) · doi:10.1101/088856 · Cited by 29
Integration of single-cell multi-omics data by regression analysis on unpaired observations
Yuan, Q., & Duren, Z. (2022) · Genome biology · doi:10.1186/s13059-022-02726-7 · Cited by 19 · cited 1×
“Those meth-ods, including IReNA 32 , SOMatic 33 , UnpairReg 34 , CoupledNMF 35,36 , DC3 (ref.”
Self-citationDarsigny, M., St‐Jean, S., & Boudreau, F. (2010) · Inflammatory Bowel Diseases · doi:10.1002/ibd.21274 · Cited by 18 · cited 7×
“Finally, we extracted the sub-network of the eight candidate TFs from the classical monocyte trans -regulatory network for IBD (Fig.”
InfluentialCherfane, C. E., Anderson, A. J. M., Rivers, C. R., Schwartz, M. B., Barrie, A. M., Hashash, J. G., Regueiro, M. D., Dunn, M. A., Swoger, J. M., & Binion, D. G. (2016) · Gastroenterology · doi:10.1016/s0016-5085(16)30266-9 · Cited by 18
Sekiya, T., Kasahara, H., Takemura, R., Fujita, S., Kato, J., Doki, N., Katayama, Y., Ozawa, Y., Takada, S., Eto, T., et al. (2022) · The Journal of Immunology · doi:10.4049/jimmunol.2100808 · Cited by 16 · cited 1×
“Other studies have also shown that FOXK2 affects the activation of T lymphocytes 77,78 and revealed the essential roles of NR4A1 in regulatory T cell differentiation 79,80 , suggesting that the identified TFs have important roles in naive CD4 + T cell response upon TCR stimulation.”
Aubin-Frankowski, P.-C., & Vert, J. (2018) · bioRxiv (Cold Spring Harbor Laboratory) · doi:10.1101/464479 · Cited by 15
Computational methods to dissect gene regulatory networks in cancer
Iyer, A. S., Osmanbeyoglu, H. U., & Leslie, C. S. (2017) · Current Opinion in Systems Biology · doi:10.1016/j.coisb.2017.04.004 · Cited by 14
Inferring Regulatory Networks From Mixed Observational Data Using Directed Acyclic Graphs
Zhong, W., Li, D., Poston, T. B., Darville, T. L., Spracklen, C. N., Wu, D., Mohlke, K. L., Li, Y., Li, Q., & Zheng, X. (2020) · Frontiers in Genetics · doi:10.3389/fgene.2020.00008 · Cited by 14 · cited 1×
“Inference of GRNs is a central problem 2–4 , and there have been many attempts to approach this issue 2,5–13 .”
The regulatory role of Fos related antigen‑1 in inflammatory bowel disease
Wang, X., Guo, R., Lv, Y., & Fu, R. (2017) · Molecular Medicine Reports · doi:10.3892/mmr.2017.8071 · Cited by 11 · cited 7×
“Finally, we extracted the sub-network of the eight candidate TFs from the classical monocyte trans -regulatory network for IBD (Fig.”
InfluentialJi, X., Ji, Y., Wang, W., et al. (2018) · Oncology Letters · doi:10.3892/ol.2018.8210 · Cited by 8
Zhang, S., Pyne, S., Pietrzak, S., Halberg, S., McCalla, S. G., Siahpirani, A. F., Sridharan, R., & Roy, S. (2022) · bioRxiv (Cold Spring Harbor Laboratory) · doi:10.1101/2022.07.25.501350 · Cited by 7
Mize, T. J., & Evans, L. M. (2022) · European Journal of Human Genetics · doi:10.1038/s41431-022-01244-1 · Cited by 6 · cited 1×
“In our specific study on inflammatory bowel disease (IBD), we collected the risk loci based on a GWAS meta-analysis of about 330,000 individuals from the NHGRI-EBI GWAS catalog 62 for study GCST90225550 63 .”
Research works printed but not linked: 1
- Chaudhri, Z. & Liu, B. Lifelong Machine Learning (Springer International Publishing, 2022).
Cited by
Sorted by citations
New horizons at the interface of artificial intelligence and translational cancer research
Yates, J., & Allen, E. M. V. (2025) · Cancer Cell · doi:10.1016/j.ccell.2025.03.018 · Cited by 58
Kundu, B. S., & Tanti, B. (2025) · Plant Communications · doi:10.1016/j.xplc.2025.101668 · Cited by 57
“Recent advances in single-cell and spatial omics address these constraints, establishing systems-level frameworks that link molecular dynamics to whole-plant physiology and, ultimately, field performance (Loers and Vermeirssen, 2024; Yuan and Duren, 2025).”
Unlocking gene regulatory networks for crop resilience and sustainable agriculture
Leong, R., He, X., Beijen, B. S., Sakai, T., Gonçalves, J. M., & Ding, P. (2025) · Nature Biotechnology · doi:10.1038/s41587-025-02727-4 · Cited by 35
“This progression has been further accelerated by technological innovations, including multiomic integration 16,17 and the advent of single-cell datasets 18,19 .”
Recent advances in exploring transcriptional regulatory landscape of crops
Huo, Q., Song, R., & Ma, Z. (2024) · Frontiers in Plant Science · doi:10.3389/fpls.2024.1421503 · Cited by 33
“Additionally, many innovative approaches have emerged to utilize the matched scRNA-seq and scATAC-seq data (Ma et al., 2023a; Yuan and Duren, 2024).”
MethodLoers, J. U., & Vermeirssen, V. (2024) · Briefings in Bioinformatics · doi:10.1093/bib/bbae382 · Cited by 39
“Deep learning approaches such as LINGER first learn weights of a neural network for different tissues from bulk data, and in a second run refine the learned weights with single-cell data [140].”
Method
Metadata
- Authors
- Yuan, Q., & Duren, Z.
- Affiliations
- Clemson University (US)
- Corresponding author
- Duren, Zhana
- Venue
- Nature Biotechnology
- Published
- 2024-04-12
- Volume
- 43
- Issue
- 2
- Pages
- 247-257
- ISSN
- 0733-222X (ISSN-L)
- 1087-0156
- 1546-1696
- PMC
- PMC11825371
- OpenAlex
- W4394764901
- Semantic Scholar
- 93e99767340c76e0af7f776ed66f5a1299b84479
- Cited by
- 118
- References
- 100
- Citations by year
- 2026: 48 · 2025: 53 · 2024: 17
- FWCI
- 13.74
- Type
- journal article
- Language
- en
- Open access
- hybrid
- doi.org
- Locations
- Nature Biotechnology (publishedVersion, cc-by)
- Research Square (acceptedVersion, cc-by)
- PubMed (publishedVersion)
- PubMed Central (submittedVersion, cc-by)
- Funders
- U.S. Department of Health & Human Services | NIH | National Institute of General Medical Sciences (P20 GM139769, R35 GM150513)
- Topics
- Life Sciences › Biochemistry, Genetics and Molecular Biology › Molecular Biology › Gene Regulatory Network Analysis
- Life Sciences › Biochemistry, Genetics and Molecular Biology › Molecular Biology › Genomics and Chromatin Dynamics
- Life Sciences › Biochemistry, Genetics and Molecular Biology › Molecular Biology › Single-cell and spatial transcriptomics
- Keywords
- gene regulatory network inference, chromatin accessibility, gene expression, manifold regularization, transcription factor binding motifs, case-control study, disease-associated variants, genome-wide association study
- MeSH terms
- Machine Learning, Chromatin, Gene Expression Regulation, Humans, Transcription Factors, Neural Networks, Computer, Computational Biology, Gene Expression Profiling, Gene Regulatory Networks, Genome-Wide Association Study, Single-Cell Analysis
About these checks
Registry, retraction, Cites and statistics results are computed, not judged, with one exception: a printed reference that no index lists is read once by a model before it counts as a citation error. Claims are extracted by a model and kept only when their quote appears verbatim in the text; each cited source is then checked, with a model’s help, for whether it says what the claim relies on. Those verdicts can be wrong — read the claim’s quote and the cited source before relying on one.
A language model drew the claims from the paper on 2026-10-14, under version 3 of the claim definition (model deepseek-v4.1-flash, prompt extract-v3).
A second model labelled each claim on 2026-10-14 (model jev-1.13-20260917, definition revision gold-guideline-v0.2).
Cited sources are checked with a language model’s help (gpt-6-sol).
Statistics and arithmetic are recomputed, not judged.
Confidence bands are shown only for fields calibrated on our annotated test set. None is calibrated yet, so no band is shown.
What counts as a claim ›How we measure confidence ›How we check this ›
Are you an author, or do you see a problem with this page? Request a review
