

The DOI matches its Crossref record; 63 of the 63 references it cites were found in a registry or an index; 45 of the 53 sources its claims cite were checked for support.
Within-sibship genome-wide association analyses decrease bias in estimates of direct genetic effects
Open accessAbstract
Estimates from genome-wide association studies (GWAS) of unrelated individuals capture effects of inherited variation (direct effects), demography (population stratification, assortative mating) and relatives (indirect genetic effects). Family-based GWAS designs can control for demographic and indirect genetic effects, but large-scale family datasets have been lacking. We combined data from 178,086 siblings from 19 cohorts to generate population (between-family) and within-sibship (within-family) GWAS estimates for 25 phenotypes. Within-sibship GWAS estimates were smaller than population estimates for height, educational attainment, age at first birth, number of children, cognitive ability, depressive symptoms and smoking. Some differences were observed in downstream SNP heritability, genetic correlations and Mendelian randomization analyses. For example, the within-sibship genetic correlation between educational attainment and body mass index attenuated towards zero. In contrast, analyses of most molecular phenotypes (for example, low-density lipoprotein-cholesterol) were generally consistent. We also found within-sibship evidence of polygenic adaptation on taller height. Here, we illustrate the importance of family-based GWAS data for phenotypes influenced by demographic and indirect genetic effects.
Overview
AI snapshot
Written from the paper’s full text.
TL;DR
This study combined 178,086 siblings from 19 cohorts to compare population and within-sibship GWAS estimates for 25 phenotypes. Within-sibship estimates were smaller for several behavioral and anthropometric traits, with some downstream differences in heritability, genetic correlation, Mendelian randomization and polygenic adaptation analyses, while most molecular phenotypes were generally consistent.
Key findings
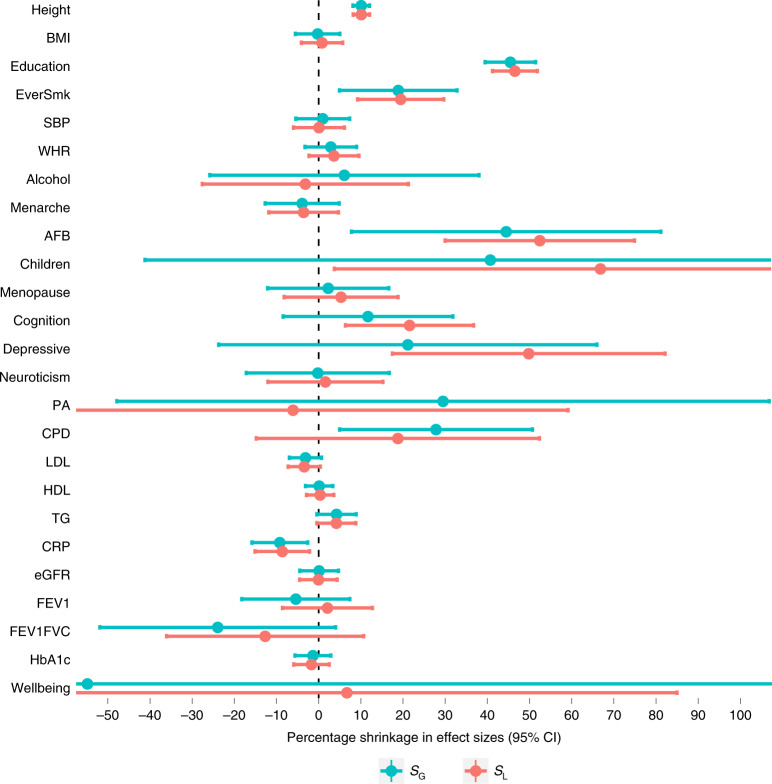
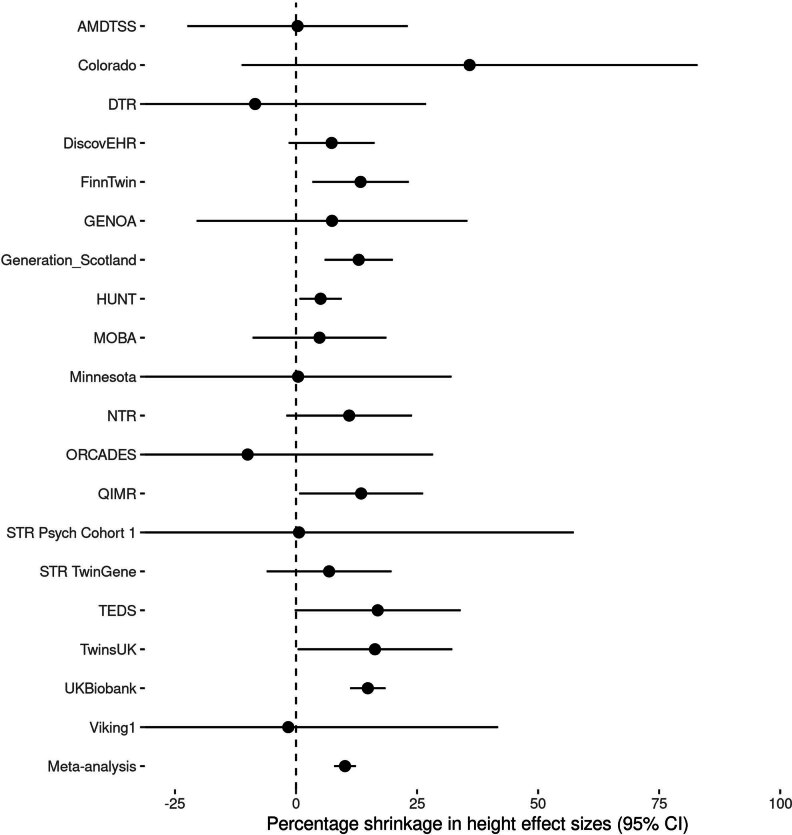
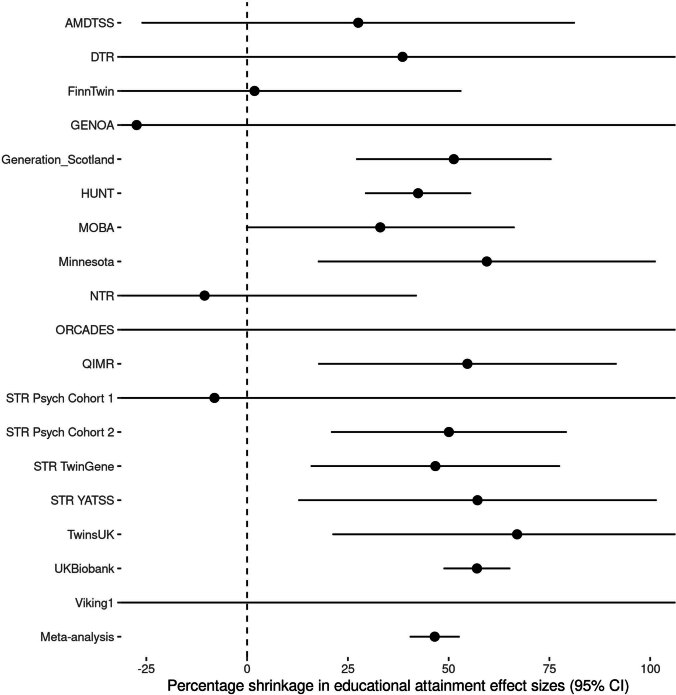
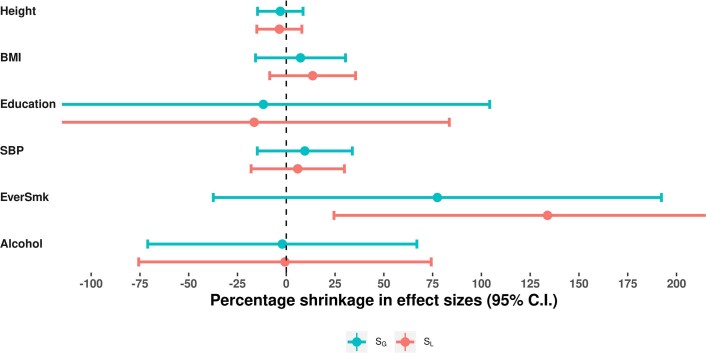
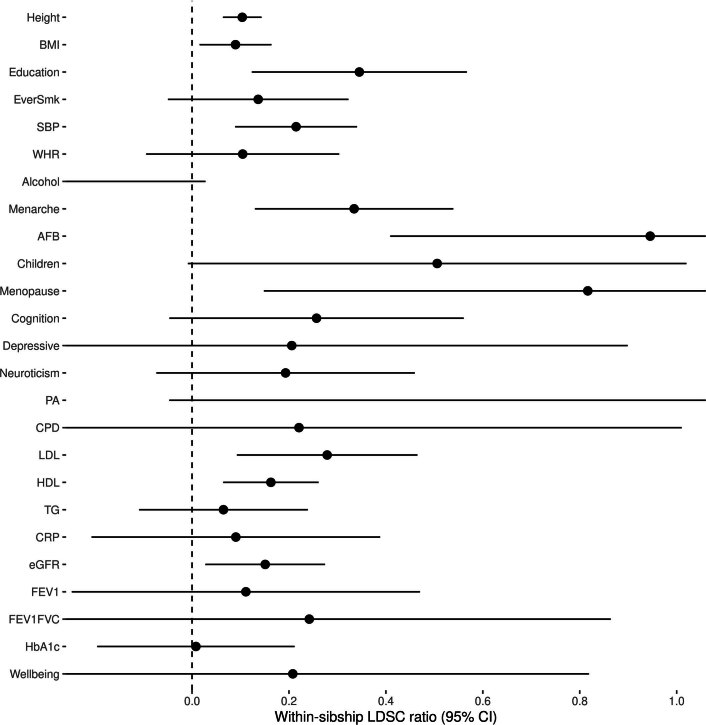
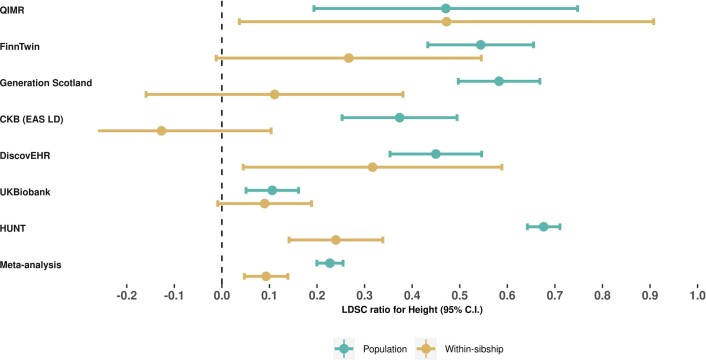
- Within-sibship shrinkage was largest for number of children (67%; 95% CI 4%, 130%), age at first birth (52%; 30%, 75%), depressive symptoms (50%; 18%, 82%) and educational attainment (47%; 41%, 52%); shrinkage was also found for cognitive ability (22%; 6%, 37%), ever smoking (19%; 9%, 30%) and height (10%; 8%, 12%), with limited evidence for the remaining 17 phenotypes including BMI and SBP.
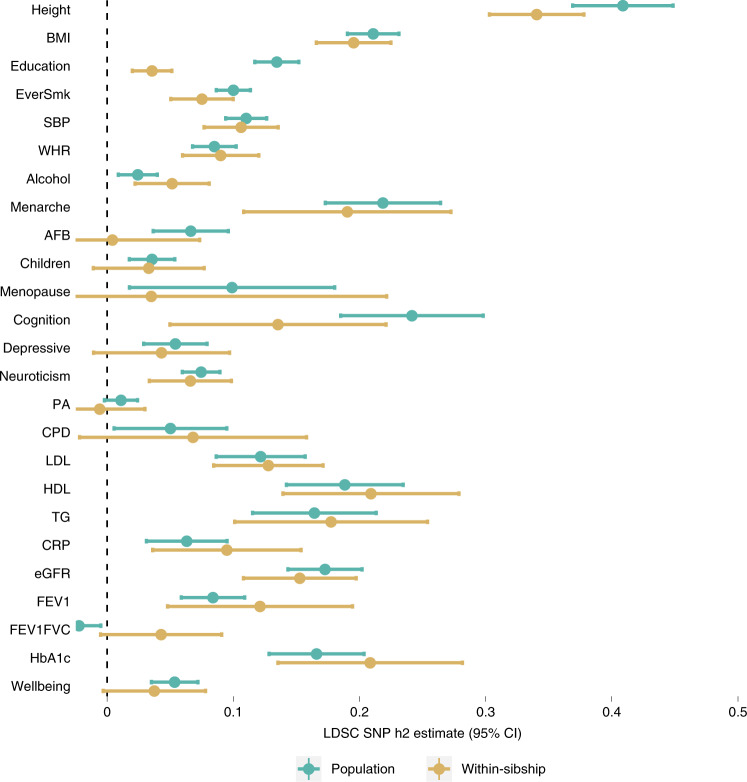
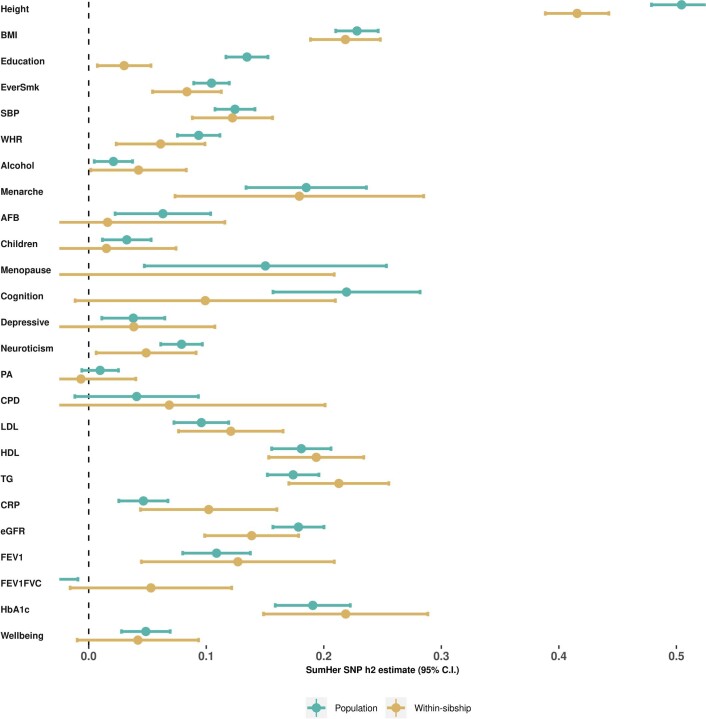
- SNP heritability attenuated for educational attainment (population h2 = 0.13 vs within-sibship h2 = 0.04; 76% attenuation; difference P = 5.3 × 10⁻²⁶), cognitive ability (0.24 vs 0.14; 44%; P = 0.011), ever smoking (0.10 vs 0.07; 25%; P = 0.029) and height (0.41 vs 0.34; 17%; P = 1.6 × 10⁻³).
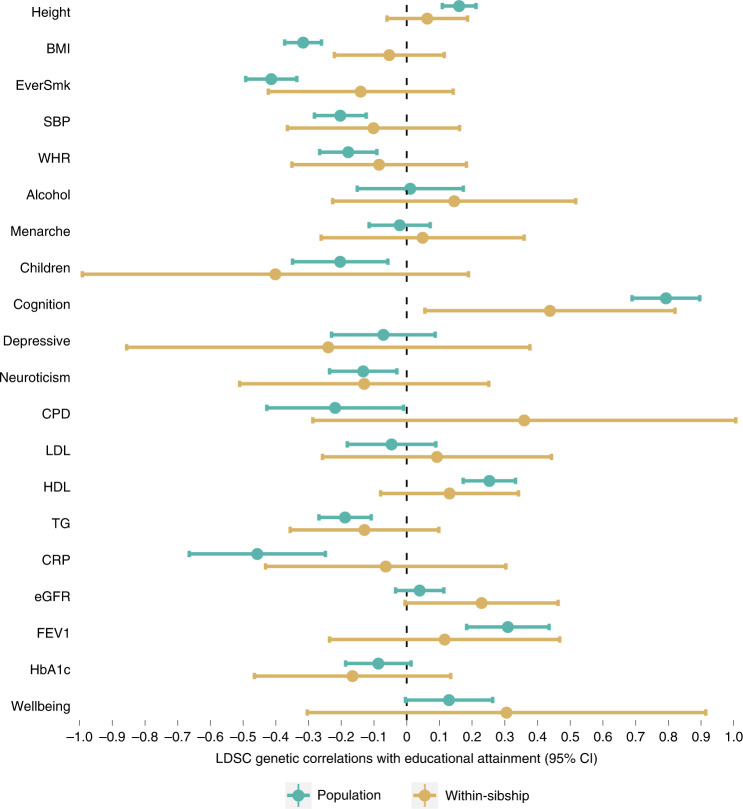
- Genetic correlations with educational attainment attenuated toward zero for BMI (rg = −0.32 to −0.05; difference P = 5.3 × 10⁻⁴), ever smoking (−0.41 to −0.14; P = 0.040) and CRP (−0.46 to −0.06; P = 0.039).
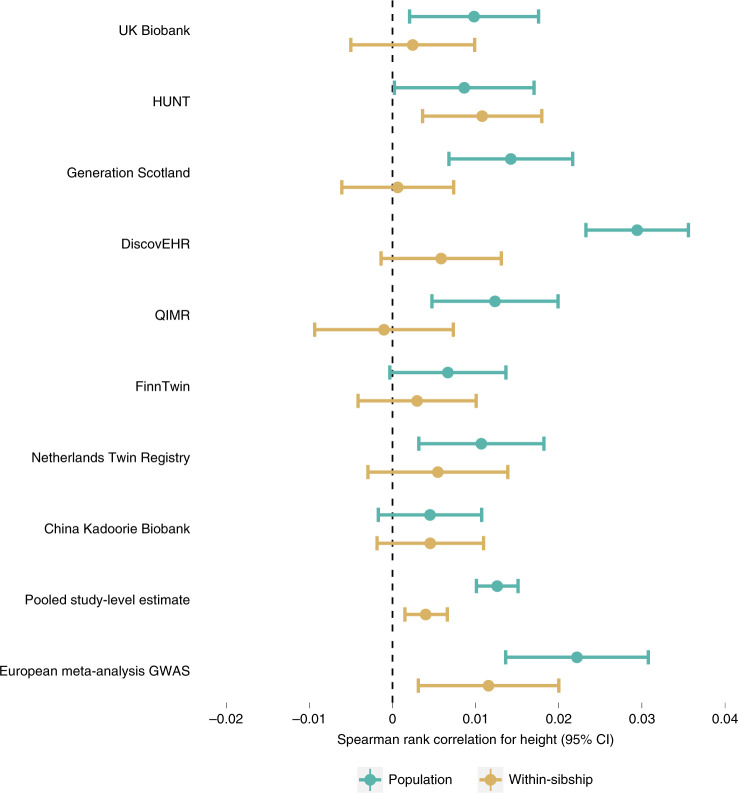
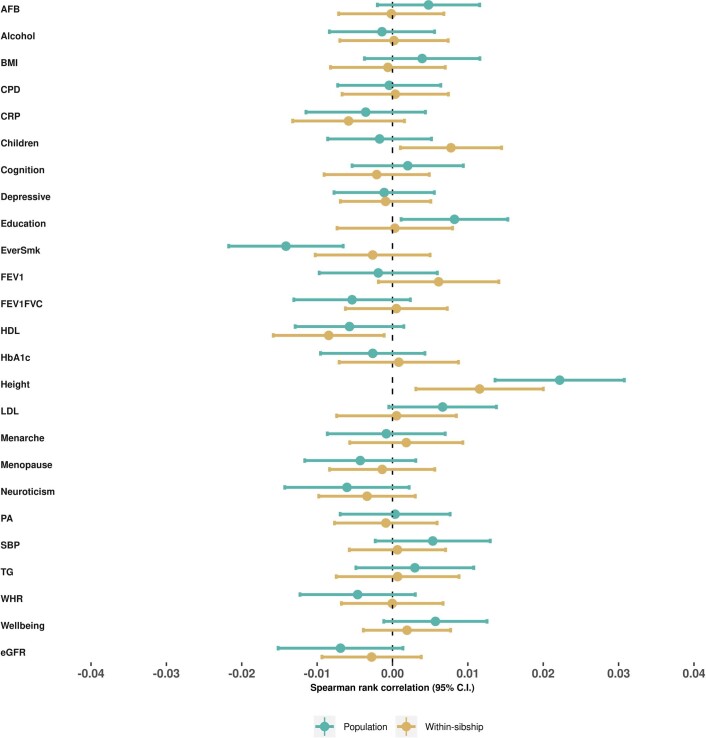
- Within-sibship MR estimates differed from population MR for height on educational attainment (0.06 s.d. vs 0.02 s.d.; difference P = 1.2 × 10⁻³) and BMI on educational attainment (−0.19 s.d. vs −0.05 s.d.; P < 0.001), age at first birth (P = 2.3 × 10⁻³) and cognitive ability (P = 0.020); polygenic adaptation on taller height was supported by population (r = 0.022; 95% CI 0.014, 0.031) and within-sibship (r = 0.012; 0.003, 0.020) estimates.
Methods
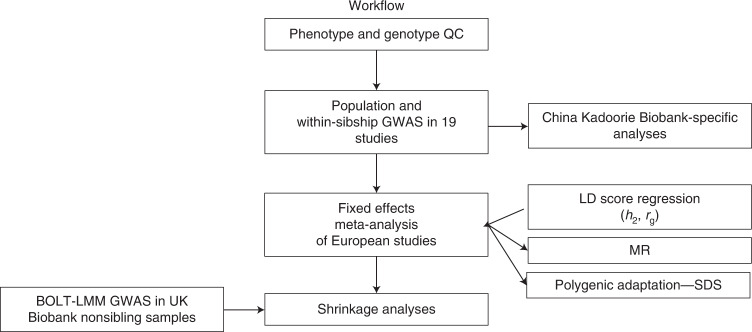
- Data came from 178,076 individuals with one or more genotyped siblings from 77,832 sibships in 19 cohorts; 25 phenotypes were analyzed, with phenotype sample sizes ranging from 13,375 to 163,748 (median 82,760). European-ancestry cohorts were meta-analyzed, and 13,856 individuals from the China Kadoorie Biobank were analyzed separately.
- Population and within-sibship linear regression models were fit in each cohort; the within-sibship model included the mean sibship genotype as a covariate and used family-mean-centered genotype, with age, sex and principal components as covariates and standard errors clustered by sibship. Fixed-effects meta-analysis was performed in METAL.
- Downstream analyses used LDSC and SumHer for SNP heritability and genetic correlations, within-sibship Mendelian randomization for height and BMI, and tSDS-based Spearman correlations for polygenic adaptation; simulations evaluated LDSC applicability and relatedness effects.
Limitations
- Stated in the paper: within-sibship models do not control for indirect genetic effects of siblings; assortative mating can bias within-sibship heritability estimates downward; findings are limited to adult phenotypes; family data and statistical inefficiency constrain within-family GWAS; and power was limited for heterogeneity analyses.
- Stated in the paper: LD score mismatch with 1000 Genomes LD scores in the Norwegian HUNT study and other studies likely inflated LDSC ratios in both population and within-sibship models, and cryptic relatedness likely inflated LDSC ratios in population models but not within-sibship data.
- Evident from the text: the main meta-analysis was restricted to European-ancestry cohorts, with non-European evidence limited to the China Kadoorie Biobank, and several LDSC confounding estimates were imprecise.
Model-written summary. Check it against the paper before relying on it.
Integrity signals
Registry
Cites
Statistics
Figures
Verification
Claims the paper makes
60 Own result · 16 Own interpretation · 14 Own method · 10 Partly supported · 7 Supported · 4 No basis given · 2 Supported so far · 1 Mixed support · accuracy not yet measured
The cited sources support only part of this claim — read each source’s verdict below.
In the paper
“Within-family genetic association estimates, such as those obtained from samples of siblings, can provide less biased estimates of direct genetic effects because they are unlikely to be affected by demographic and indirect genetic effects of parents7,17,30–34.”
§ Within-sibship genome-wide association analyses decrease bias in estimates of direct genetic effects > Main
What the sources say
- Supportedcites [7] Brumpton, B. et al. Within-family studies for Mendelian randomization: avoiding dynastic, assortative mating, and population stratification biases. Nat. Commun. 3519 (2020). source
Split into 2 atoms — 2 confirmed, 0 partially supported, 0 disputed, 0 misattributed, 0 unverifiable. Expand the claim to see per-atom verdicts.
- Supportedcites [17] Young, A. I., Benonisdottir, S., Przeworski, M. & Kong, A. Deconstructing the sources of genotype-phenotype associations in humans. Science 365, 1396–1400 (2019). source
Split into 2 atoms — 2 confirmed, 0 partially supported, 0 disputed, 0 misattributed, 0 unverifiable. Expand the claim to see per-atom verdicts.
- Partly supportedcites [30] Fulker, D. W., Cherny, S. S., Sham, P. C. & Hewitt, J. K. Combined linkage and association sib-pair analysis for quantitative traits. Am. J. Hum. Genet. 64, 259–267 (1999). sourceExperimental — accuracy not yet measured
Split into 2 atoms — 0 confirmed, 2 partially supported, 0 disputed, 0 misattributed, 0 unverifiable. Expand the claim to see per-atom verdicts.
- Partly supportedcites [31] Abecasis, G. R., Cardon, L. R. & Cookson, W. O. A general test of association for quantitative traits in nuclear families. Am. J. Hum. Genet. 66, 279–292 (2000). sourceExperimental — accuracy not yet measured
Split into 2 atoms — 1 confirmed, 1 partially supported, 0 disputed, 0 misattributed, 0 unverifiable. Expand the claim to see per-atom verdicts.
- Not checked — no full text of the sourcecites [32] Pingault, J.-B. et al. Using genetic data to strengthen causal inference in observational research. Nat. Rev. Genet. 19, 566–580 (2018). source
- Not checked — no full text of the sourcecites [33] Neale, M. C. et al. Distinguishing population stratification from genuine allelic effects with Mx: association of ADH2 with alcohol consumption. Behav. Genet. 29, 233–243 (1999). source
- Could not verifycites [34] Curtis, D., Miller, M. B. & Sham, P. C. Combining the sibling disequilibrium test and transmission/disequilibrium test for multiallelic markers. Am. J. Hum. Genet. 64, 1785 (1999). sourceExperimental — accuracy not yet measured
Split into 2 atoms — 0 confirmed, 0 partially supported, 0 disputed, 0 misattributed, 2 unverifiable. Expand the claim to see per-atom verdicts.
plainconditional- Asserted: passes — The authors put it forward as true.
- Checkable: passes — It can be checked against evidence.
- Load-bearing: passes — The paper’s conclusions depend on it.
- Based: passes — The paper gives a reason why it holds.
- Supported
Every source the paper cites for this claim was checked and supports it.
In the paper
“For example, Lee et al.14 found that within-sibship GWAS estimates for educational attainment variants were around 40% lower than estimates from unrelated individuals, indicating the presence of demographic and indirect genetic effects.”
§ Within-sibship genome-wide association analyses decrease bias in estimates of direct genetic effects > Main
What the sources say
- Supportedcites Lee et al. [14] Lee, J. J. et al. Gene discovery and polygenic prediction from a genome-wide association study of educational attainment in 1.1 million individuals. Nat. Genet. 50, 1112–1121 (2018). source
The Results section (“Within-Family Association Analyses”) compares estimates from 22,135 sibling pairs with GWAS estimates from a meta-analysis excluding those siblings. It reports that within-family effect sizes for educational attainment were roughly 40% smaller. (LLM, conf=0.94)
plaincorrelational- Asserted: passes — The authors put it forward as true.
- Checkable: passes — It can be checked against evidence.
- Load-bearing: passes — The paper’s conclusions depend on it.
- Based: passes — The paper gives a reason why it holds.
- Supported
The cited sources support only part of this claim — read each source’s verdict below.
In the paper
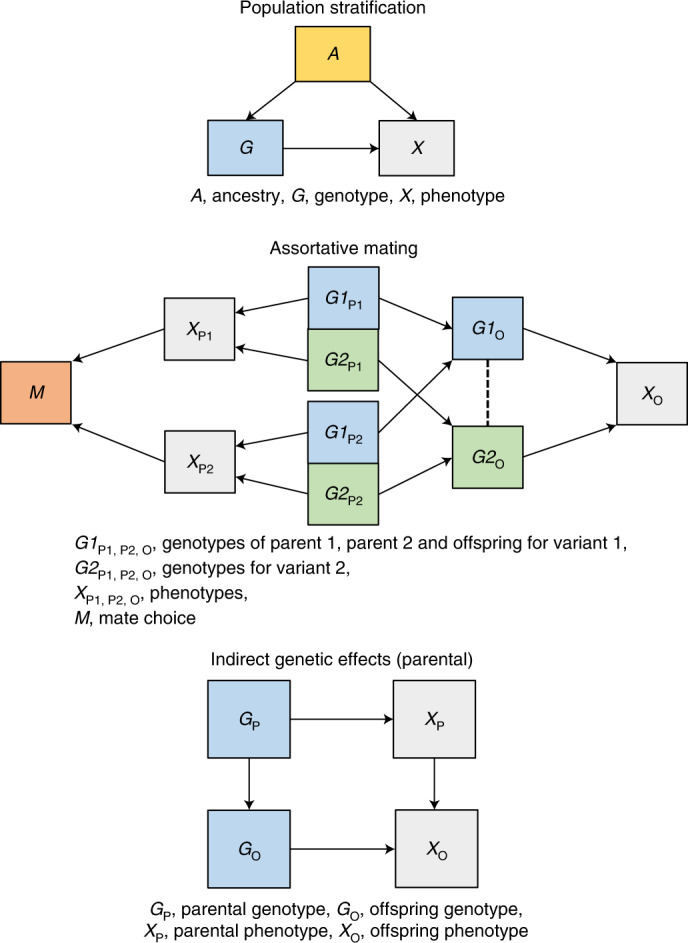
“However, there is growing evidence that GWAS associations for some phenotypes estimated from samples of unrelated individuals also capture effects of demography7,8 (assortative mating9–11 and population stratification12) and indirect genetic effects of relatives13–19 (Fig. 1).”
§ Within-sibship genome-wide association analyses decrease bias in estimates of direct genetic effects > Main
What the sources say
- Supportedcites [7] Brumpton, B. et al. Within-family studies for Mendelian randomization: avoiding dynastic, assortative mating, and population stratification biases. Nat. Commun. 3519 (2020). source
The Discussion says population structure, dynastic effects, and assortative mating may bias GWAS, and that estimates from unrelated individuals may be biased. The Introduction describes how relatives’ genotypes can affect an offspring’s phenotype through dynastic effects. The paper also qualifies that many traits, particularly biological traits, may be relatively unaffected. (LLM, conf=0.92)
- Supportedcites [8] Shen, H. & Feldman, M. W. Genetic nurturing, missing heritability, and causal analysis in genetic statistics. Proc. Natl Acad. Sci. USA 117, 25646–25654 (2020). source
The Regression Analysis section says genetic nurturing influences genotype–phenotype regression, including through parental alleles not transmitted to the child. The Missing Heritability? section further says genetic variance computed from GWAS depends on cultural-transmission parameters and is not purely genetic. Together, these support the part of the sentence attributed to this source: GWAS associations can capture indirect effects of relatives. (LLM, conf=0.86)
- Partly supportedcites [9] Howe, L. J. et al. Genetic evidence for assortative mating on alcohol consumption in the UK Biobank. Nat. Commun. https://doi.org/10.1038/s41467-019-12424-x (2019). sourceExperimental — accuracy not yet measured
The Introduction reports genetic evidence of assortative mating on alcohol consumption, and the Discussion says assortative mating could create associations between genetic and environmental factors in offspring. This supports the assortative-mating component for which this paper is cited, but our copy does not establish that GWAS associations estimated from unrelated individuals capture those effects. (LLM, conf=0.78)
- Partly supportedcites [10] Robinson, M. R. et al. Genetic evidence of assortative mating in humans. Nat. Hum. Behav. 1, 0016 (2017). sourceExperimental — accuracy not yet measured
The paper reports assortative mating at height- and BMI-associated loci and says it can create gametic phase disequilibrium, supporting the assortative-mating component of the cited sentence. It does not directly show that GWAS association estimates from unrelated individuals capture those effects. The citations for population stratification and relatives’ indirect genetic effects are attached to other parts of the sentence. (LLM, conf=0.79)
- Supportedcites [11] Yengo, L. et al. Imprint of assortative mating on the human genome. Nat. Hum. Behav. 2, 948–954 (2018). source
This source is cited for the assortative-mating part of the sentence, not the separately cited claims about population stratification or relatives’ indirect genetic effects. In the conclusion passage (indexed under Abstract; page unavailable), the paper reports a genomic imprint of assortative mating and predicts that, for affected traits, SNP-effect estimates from population samples tend to exceed within-family estimates. (LLM, conf=0.90)
- Supportedcites [12] Haworth, S. et al. Apparent latent structure within the UK Biobank sample has implications for epidemiological analysis. Nat. Commun. 10, 333 (2019). source
Citation 12 is attached to the population-stratification part of the sentence, not the separately cited claims about assortative mating or relatives. The Introduction questions whether genetic-variant discovery adequately addresses latent structure, and the Results ('Alignment of polygenic scores with geography'; 'Co-incident latent structure produces biased estimates', pages unavailable) show that scores built from published GWAS associations retain geographical structure and can yield confounded associations. (LLM, conf=0.87)
hedgedcorrelational- Asserted: passes — The authors put it forward as true.
- Checkable: passes — It can be checked against evidence.
- Load-bearing: passes — The paper’s conclusions depend on it.
- Based: passes — The paper gives a reason why it holds.
- Supported
The sources with a verdict support this claim; the rest weren’t checked yet, have no full text we could read, or their verdicts aren’t rated yet.
In the paper
“WS-MR is largely robust against demographic and indirect genetic effects that could distort estimates from nonfamily designs7,25.”
§ Within-sibship genome-wide association analyses decrease bias in estimates of direct genetic effects > Results > Within-sibship MR (WS-MR): effects of height and BMI
What the sources say
- Supportedcites [7] Brumpton, B. et al. Within-family studies for Mendelian randomization: avoiding dynastic, assortative mating, and population stratification biases. Nat. Commun. 3519 (2020). source
The Discussion states that within-family sibling estimates are robust to bias from dynastic effects, assortative mating, and fine population structure. The Introduction explains that population structure and parental effects can bias MR estimates from unrelated individuals. This supports the claim’s contrast between within-sibling MR and nonfamily designs. (LLM, conf=0.93)
- Not checked — no full text of the sourcecites [25] Davies, N. M. et al. Within family Mendelian randomization studies. Hum. Mol. Genet. 28, R170–R179 (2019). source
plain- Asserted: passes — The authors put it forward as true.
- Checkable: passes — It can be checked against evidence.
- Load-bearing: passes — The paper’s conclusions depend on it.
- Based: passes — The paper gives a reason why it holds.
- Supported
Every source the paper cites for this claim was checked and supports it.
In the paper
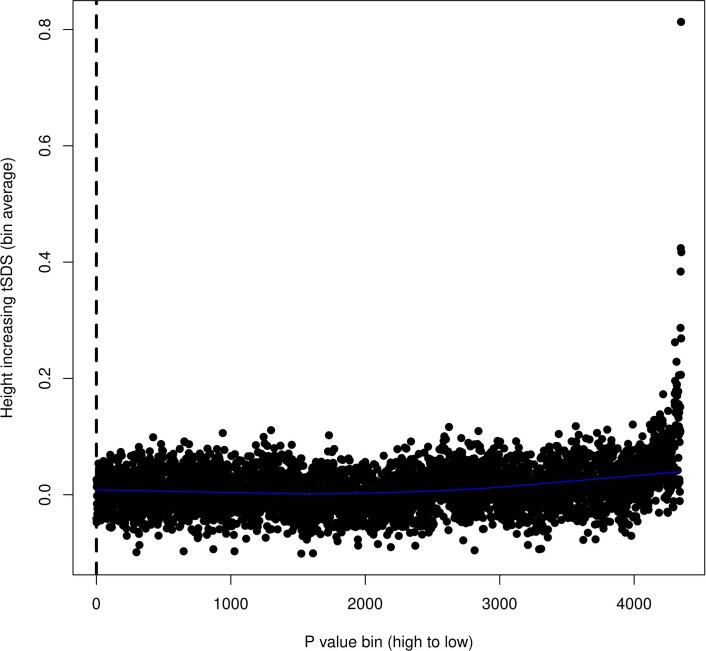
“However, this approach is sensitive to population stratification as illustrated by recent work using UK Biobank data which showed that population stratification in GWAS data likely confounded previous estimates of polygenic adaptation on height26,27.”
§ Within-sibship genome-wide association analyses decrease bias in estimates of direct genetic effects > Results > Polygenic adaptation
What the sources say
- Supportedcites [26] Berg, J. J. et al. Reduced signal for polygenic adaptation of height in UK Biobank. eLife 8, e39725 (2019). source
The Introduction says that earlier signals of selection on height generally did not replicate with UK Biobank estimates and that the GIANT and R15-sibs GWAS were confounded by stratification where those signals had been reported. The Results section says this confounding could drive false-positive signals in analyses of polygenic adaptation. The supplied passages have section labels but no page numbers. (LLM, conf=0.93)
- Supportedcites [27] Sohail, M. et al. Polygenic adaptation on height is overestimated due to uncorrected stratification in genome-wide association studies. eLife 8, e39702 (2019). source
The Results section (‘Population structure underlying discrepancies in GWAS’) attributes differences between GIANT and UK Biobank polygenic-adaptation signals to subtle GWAS biases arising from incomplete control of population structure. The Discussion says residual stratification can create highly significant artificial adaptation signals, especially when sub-significant SNPs are used. The paper also notes that signals based on genome-wide significant SNPs are more consistent, so the claim’s ‘likely confounded’ wording is appropriately qualified. (LLM, conf=0.94)
hedgedconditional- Asserted: passes — The authors put it forward as true.
- Checkable: passes — It can be checked against evidence.
- Load-bearing: passes — The paper’s conclusions depend on it.
- Based: passes — The paper gives a reason why it holds.
- Supported
The cited sources support only part of this claim — read each source’s verdict below.
In the paper
“A large proportion of samples in the meta-analysis were from UK-based studies such as UK Biobank and Generation Scotland, for which the LD scores, generated using 1000 Genomes project (phase 3) European samples (CEU, TSC, FIN, GBR), have been shown to fit reasonably well20.”
§ Within-sibship genome-wide association analyses decrease bias in estimates of direct genetic effects > Methods > Evaluation of LD score mismatch
What the sources say
- Partly supportedcites [20] Bulik-Sullivan, B. K. et al. LD score regression distinguishes confounding from polygenicity in genome-wide association studies. Nat. Genet. 47, 291–295 (2015). sourceExperimental — accuracy not yet measured
Split into 2 atoms — 0 confirmed, 1 partially supported, 0 disputed, 0 misattributed, 1 unverifiable. Expand the claim to see per-atom verdicts.
plain- Asserted: passes — The authors put it forward as true.
- Checkable: passes — It can be checked against evidence.
- Load-bearing: unclear — It is unclear whether the paper’s conclusions depend on it.
- Based: passes — The paper gives a reason why it holds.
- Partly supported
The cited sources support only part of this claim — read each source’s verdict below.
In the paper
“Within-sibship GWAS data are particularly useful in this context as they are robust against population stratification26,27,29.”
§ Within-sibship genome-wide association analyses decrease bias in estimates of direct genetic effects > Results > Polygenic adaptation
What the sources say
- Supportedcites [26] Berg, J. J. et al. Reduced signal for polygenic adaptation of height in UK Biobank. eLife 8, e39725 (2019). source
The Introduction (‘GWAS data used to study adaptation of height’) says family-based analyses protect against confounding due to stratification and describes sibling-based regression as immune to population-structure confounding. The Discussion distinguishes that protection in principle from a stratification problem caused by a bug in one study’s released effect sizes. (LLM, conf=0.91)
- Supportedcites [27] Sohail, M. et al. Polygenic adaptation on height is overestimated due to uncorrected stratification in genome-wide association studies. eLife 8, e39702 (2019). source
In Results, under “Effect size estimates from previously published family-based height GWAS” (page unavailable), the paper says within-family estimates are, in principle, robust to population structure, and its own UK Biobank sibling estimates appeared unconfounded. It also notes a technical-artifact exception in an earlier sibling dataset; robustness here does not mean every dataset is free of stratification. (LLM, conf=0.90)
- Could not verifycites [29] Chen, M. et al. Evidence of polygenic adaptation in Sardinia at height-associated loci ascertained from the Biobank Japan. Am. J. Hum. Genet. 107, 60–71 (2020). sourceExperimental — accuracy not yet measured
The retrieved passages have no section or page labels and contain only links or garbled text, not a readable discussion of within-sibship GWAS. Searches for within-sibship and within-family estimates, siblings, and population stratification found no passage in our copy that establishes the claimed robustness. (LLM, conf=0.72)
plain- Asserted: passes — The authors put it forward as true.
- Checkable: passes — It can be checked against evidence.
- Load-bearing: passes — The paper’s conclusions depend on it.
- Based: passes — The paper gives a reason why it holds.
- Supported
The cited sources support only part of this claim — read each source’s verdict below.
In the paper
“Consistent with previous studies13,14,19,40, we found that GWAS results and downstream analyses of behavioral phenotypes (for example, educational attainment, smoking behavior) as well as some anthropometric phenotypes (for example, height, BMI) are affected by demographic and indirect genetic effects.”
§ Within-sibship genome-wide association analyses decrease bias in estimates of direct genetic effects > Discussion
What the sources say
- Not checked — no full text of the sourcecites [13] Kong, A. et al. The nature of nurture: effects of parental genotypes. Science 359, 424–428 (2018). source
- Partly supportedcites [14] Lee, J. J. et al. Gene discovery and polygenic prediction from a genome-wide association study of educational attainment in 1.1 million individuals. Nat. Genet. 50, 1112–1121 (2018). sourceExperimental — accuracy not yet measured
The Results (Within-Family Association Analyses; page unavailable) find smaller within-family than GWAS effect sizes for educational attainment and compare the pattern with height. The Discussion (page unavailable) says indirect effects through the rearing environment may bias educational-attainment GWAS estimates and affect polygenic-score interpretation. The paper does not establish the same claim for smoking behavior or BMI, and it treats the proposed indirect-effect explanation for educational attainment as inconclusive. (LLM, conf=0.86)
- Partly supportedcites [19] Selzam, S. et al. Comparing within- and between-family polygenic score prediction. Am. J. Hum. Genet. 105, 351–363 (2019). sourceExperimental — accuracy not yet measured
The Discussion (Implications; page unavailable) links differences in educational-achievement polygenic-score prediction to family socioeconomic status and reports a modest attenuation for height that may reflect population stratification. But the paper does not study smoking behavior, and the Introduction says prior evidence found genetic-nurture effects for educational attainment but not height or BMI. It therefore supports the general concern about indirect and demographic effects, not the full set of examples implied by the citing sentence. (LLM, conf=0.87)
- Partly supportedcites [40] Mostafavi, H. et al. Variable prediction accuracy of polygenic scores within an ancestry group. eLife 9, e48376 (2020). sourceExperimental — accuracy not yet measured
In Results (no page number available), the paper reports that BMI and educational-attainment polygenic-score accuracy varies with age and socioeconomic status, and discusses indirect genetic effects for educational attainment. It suggests assortative mating may affect height prediction, but does not establish the claimed effects for smoking behavior; its account of the mechanisms is also more cautious than the citing sentence. (LLM, conf=0.84)
plaindirect- Asserted: passes — The authors put it forward as true.
- Checkable: passes — It can be checked against evidence.
- Load-bearing: passes — The paper’s conclusions depend on it.
- Based: passes — The paper gives a reason why it holds.
The cited sources support only part of this claim — read each source’s verdict below.
In the paper
“A previous study reporting polygenic adaptation on height in the UK population was found to be biased by population stratification in the Genetic Investigation of ANthropometric Traits (GIANT) consortium26–28.”
§ Within-sibship genome-wide association analyses decrease bias in estimates of direct genetic effects > Discussion
What the sources say
- Supportedcites [26] Berg, J. J. et al. Reduced signal for polygenic adaptation of height in UK Biobank. eLife 8, e39725 (2019). source
The Introduction identifies a prior study reporting a height-adaptation signal in a UK sample using GIANT data (Table 1). It says the GIANT analyses were confounded by population stratification, and the Discussion identifies that confounding as the main driver of the discrepancy with UK Biobank results. (LLM, conf=0.92)
- Supportedcites [27] Sohail, M. et al. Polygenic adaptation on height is overestimated due to uncorrected stratification in genome-wide association studies. eLife 8, e39702 (2019). source
In Results (‘Discrepancies in GWAS: height evolution within a single population’; page not available), the paper identifies an earlier finding of polygenic adaptation on height in the UK population based on GIANT estimates and reports that the signal disappeared when UK Biobank estimates were used. Results (‘Population structure underlying discrepancies in GWAS’; page not available) attributes the discrepancy to residual population-stratification bias in GIANT. (LLM, conf=0.92)
- Partly supportedcites [28] Field, Y. et al. Detection of human adaptation during the past 2000 years. Science https://doi.org/10.1126/science.aag0776 sourceExperimental — accuracy not yet measured
The height-analysis passage (section labeled Abstract; page unavailable) reports polygenic selection for increased height in the ancestors of modern Britons. It does not report that this finding was later found to be biased by population stratification in GIANT; instead, it says the observed correlation was not an artifact of uncontrolled population structure in the GWAS. This source supports the identification of the previous study, not the later bias finding. (LLM, conf=0.87)
plaindirect- Asserted: passes — The authors put it forward as true.
- Checkable: passes — It can be checked against evidence.
- Load-bearing: passes — The paper’s conclusions depend on it.
- Based: passes — The paper gives a reason why it holds.
- Supported
Every source the paper cites for this claim was checked and supports it.
In the paper
“However, a large number of samples were from Scandinavian populations (HUNT study, FinnTwin), where LD mismatch leading to elevated LDSC intercept/ratios has been previously discussed20.”
§ Within-sibship genome-wide association analyses decrease bias in estimates of direct genetic effects > Methods > Evaluation of LD score mismatch
What the sources say
- Supportedcites [20] Bulik-Sullivan, B. K. et al. LD score regression distinguishes confounding from polygenicity in genome-wide association studies. Nat. Genet. 47, 291–295 (2015). source
The Online Methods section, “Intra-European LD Score Differences,” says that using pan-European LD scores for a Finnish GWAS may bias the LDSC intercept upward. It also discusses how this mismatch can bias the estimated proportion of inflation attributed to confounding. The HUNT and FinnTwin sample description belongs to the citing paper, not to the point attributed to this source. (LLM, conf=0.90)
plaindirect- Asserted: passes — The authors put it forward as true.
- Checkable: passes — It can be checked against evidence.
- Load-bearing: unclear — It is unclear whether the paper’s conclusions depend on it.
- Based: passes — The paper gives a reason why it holds.
- Supported
- Probably not a substantial claim. 20
- It may state two separate claims as one. 27
Some cited sources support this claim and some don’t — read each source’s verdict below.
In the paper
“GWAS associations can be interpreted as estimates of direct individual genetic effects, that is, the effect of inheriting a genetic variant (or a correlated variant) on a phenotype4–6.”
§ Within-sibship genome-wide association analyses decrease bias in estimates of direct genetic effects > Main
What the sources say
- Partly supportedcites [4] Morris, T. T., Davies, N. M., Hemani, G. & Davey Smith, G. Population phenomena inflate genetic associations of complex social traits. Sci. Adv. 6, eaay0328 (2020). sourceExperimental — accuracy not yet measured
The Introduction (Estimation of genotype-phenotype associations; page unavailable) identifies individual-level variant substitution effects as the usual target of genotype–phenotype analyses and describes GWAS associations as per-SNP estimates. But the Discussion (page unavailable) cautions that a genetic association does not necessarily imply such an effect: population stratification, assortative mating, and dynastic effects can confound it. The claim omits that qualification on interpreting GWAS associations as direct effects. (LLM, conf=0.85)
- Not checked — no full text of the sourcecites [5] Fisher, R. A. The Genetical Theory of Natural Selection (Oxford Univ. Press, 1930). source
- Disputedcites [6] Young A. I. et al. Mendelian imputation of parental genotypes for genome-wide estimation of direct and indirect genetic effects. Preprint at biorXiv https://doi.org/10.1101/2020.07.02.185199 sourceExperimental — accuracy not yet measured
The Abstract says GWAS associations include direct genetic effects but can also include indirect effects and confounding. The results section states that a standard GWAS estimates a population effect—the direct effect plus an average nontransmitted coefficient—not the direct effect alone. The Abstract also reports that standard GWAS estimates were inaccurate estimates of direct effects for educational attainment and cognitive ability. (LLM, conf=0.88)
Checked by a reasoning model — may be wrong.
plaindirect- Asserted: passes — The authors put it forward as true.
- Checkable: passes — It can be checked against evidence.
- Load-bearing: passes — The paper’s conclusions depend on it.
- Based: passes — The paper gives a reason why it holds.
Probably not a substantial claim.
- Partly supported
The cited sources support only part of this claim — read each source’s verdict below.
In the paper
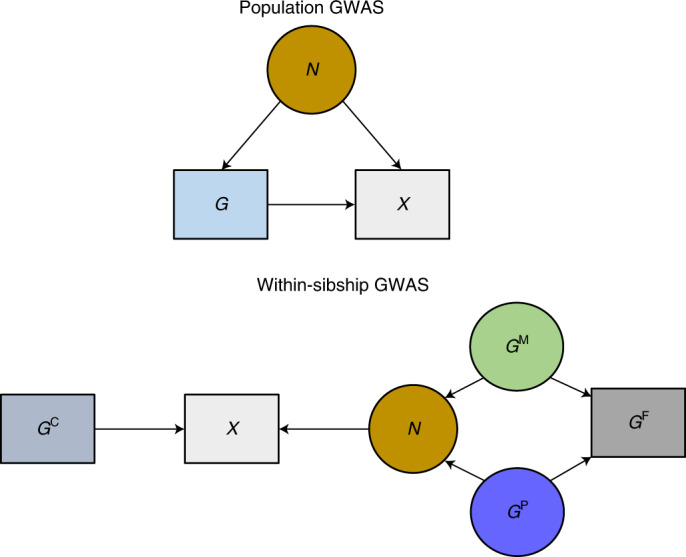
“GWAS using siblings (within-sibship GWAS) (Fig. 2) have been previously limited by available data, but are now feasible by combining well-established family studies with recent large biobanks that incidentally or by design contain thousands of sibships35–39.”
§ Within-sibship genome-wide association analyses decrease bias in estimates of direct genetic effects > Main
What the sources say
- Supportedcites [35] Bycroft, C. et al. The UK Biobank resource with deep phenotyping and genomic data. Nature 562, 203 (2018). source
In “Ancestral diversity and cryptic relatedness” (page unavailable), the paper identifies 22,666 sibling pairs in UK Biobank and notes that information about close relatives can matter for GWAS. As one of several citations attached to the sentence, it supports the point that a large biobank contains thousands of sibships available for such analyses. (LLM, conf=0.88)
- Not checked — no full text of the sourcecites [36] Krokstad, S. et al. Cohort profile: the HUNT Study, Norway. Int J. Epidemiol. 42, 968–-77 (2013). source
- Not checked — no full text of the sourcecites [37] Smith, B. H. et al. Cohort profile: Generation Scotland: Scottish Family Health Study (GS:SFHS). The study, its participants and their potential for genetic research on health and illness. Int J. Epidemiol. 42, 689–700 (2013). source
- Partly supportedcites [38] Chen, Z. et al. China Kadoorie Biobank of 0.5 million people: survey methods, baseline characteristics and long-term follow-up. Int J. Epidemiol. 40, 1652–1666 (2011). sourceExperimental — accuracy not yet measured
The Additional information section (page not supplied) reports that the China Kadoorie Biobank recruited 512,891 people and stored blood samples, supporting its identification as a large biobank. The Discussion describes its potential for genetic research, but our copy does not report thousands of sibships or address the feasibility of within-sibship GWAS; searches for “sibling” and “sibship” found no relevant passage. (LLM, conf=0.83)
- Partly supportedcites [39] Brumpton, B. M. et al. The HUNT Study: a population-based cohort for genetic research. Preprint medRxiv https://doi.org/10.1101/2021.12.23.21268305 sourceExperimental — accuracy not yet measured
The Causal inference and family effects section says a lack of genotyped family data previously limited these designs. The family-based design table reports more than 15,000 sibling pairs in HUNT and lists within-family GWAS, supporting their feasibility there. Our copy does not say that feasibility arose from combining established family studies with recent large biobanks. (LLM, conf=0.84)
plaindirect- Asserted: passes — The authors put it forward as true.
- Checkable: passes — It can be checked against evidence.
- Load-bearing: passes — The paper’s conclusions depend on it.
- Based: passes — The paper gives a reason why it holds.
It may state two separate claims as one.
- Supported
The cited sources support only part of this claim — read each source’s verdict below.
In the paper
“Linkage disequilibrium (LD) score regression (LDSC) can use GWAS data to estimate SNP heritability, the proportion of phenotypic variation explained by common SNPs20,23.”
§ Within-sibship genome-wide association analyses decrease bias in estimates of direct genetic effects > Results > Within-sibship SNP heritability estimates
What the sources say
- Partly supportedcites [20] Bulik-Sullivan, B. K. et al. LD score regression distinguishes confounding from polygenicity in genome-wide association studies. Nat. Genet. 47, 291–295 (2015). sourceExperimental — accuracy not yet measured
The Results (Overview of Methods; page unavailable) say the LD Score regression slope can be rescaled to estimate heritability explained by SNPs used to calculate LD Scores. But this requires strong assumptions about rare-variant effects; the paper does not present it as an unqualified estimate of the proportion of phenotypic variation explained specifically by common SNPs. (LLM, conf=0.86)
- Supportedcites [23] Bulik-Sullivan, B. et al. An atlas of genetic correlations across human diseases and traits. Nat. Genet. 47, 1236–1241 (2015). source
The Results (Overview of Methods) state that the method uses GWAS summary statistics and that, for a single trait, the regression estimates heritability. The Methods (Definition of Genetic Covariance and Correlation) define SNP heritability as heritability explained by a set of SNPs, including genotyped and imputed GWAS SNPs. (LLM, conf=0.91)
plaindirect- Asserted: passes — The authors put it forward as true.
- Checkable: passes — It can be checked against evidence.
- Load-bearing: passes — The paper’s conclusions depend on it.
- Based: passes — The paper gives a reason why it holds.
Probably not a substantial claim.
- Partly supported
The sources with a verdict support this claim; the rest weren’t checked yet, have no full text we could read, or their verdicts aren’t rated yet.
In the paper
“Notably, twin studies have indicated effects of the common environment on many of the phenotypes for which we observed shrinkage, such as educational attainment44, cognitive ability45 and smoking46, potentially consistent with indirect genetic effects of parents.”
§ Within-sibship genome-wide association analyses decrease bias in estimates of direct genetic effects > Discussion
What the sources say
- Supportedcites [44] Silventoinen, K. et al. Genetic and environmental variation in educational attainment: an individual-based analysis of 28 twin cohorts. Sci. Rep. 10, 12681 (2020). source
Split into 2 atoms — 2 confirmed, 0 partially supported, 0 disputed, 0 misattributed, 0 unverifiable. Expand the claim to see per-atom verdicts.
- Not checked — no full text of the sourcecites [45] Boomsma, D., Busjahn, A. & Peltonen, L. Classical twin studies and beyond. Nat. Rev. Genet. 3, 872–882 (2002). source
- Supportedcites [46] Maes, H. H. et al. A genetic epidemiological mega analysis of smoking initiation in adolescents. Nicotine Tob. Res. 19, 401–409 (2017). source
Split into 2 atoms — 2 confirmed, 0 partially supported, 0 disputed, 0 misattributed, 0 unverifiable. Expand the claim to see per-atom verdicts.
hedgedconditional- Asserted: passes — The authors put it forward as true.
- Checkable: passes — It can be checked against evidence.
- Load-bearing: unclear — It is unclear whether the paper’s conclusions depend on it.
- Based: passes — The paper gives a reason why it holds.
It may state two separate claims as one.
- Supported
Every source the paper cites for this claim was checked and supports it.
In the paper
“Polygenic adaptation was estimated using similar methods to a previous publication28.”
§ Within-sibship genome-wide association analyses decrease bias in estimates of direct genetic effects > Methods > Polygenic adaptation
What the sources say
- Supportedcites [28] Field, Y. et al. Detection of human adaptation during the past 2000 years. Science https://doi.org/10.1126/science.aag0776 source
The source describes a method for assessing polygenic adaptation: it calculates trait-SDS scores and tests their correlation with GWAS results for height and other traits. This supports citing it as a previous publication whose methods were used as a model. The indexed passage is labeled “Abstract”; no page number is available. (LLM, conf=0.88)
plain- Asserted: passes — The authors put it forward as true.
- Checkable: passes — It can be checked against evidence.
- Load-bearing: fails — The paper’s conclusions may not depend on it.
- Based: passes — The paper gives a reason why it holds.
Probably not a substantial claim. The paper’s conclusions may not depend on it.
- Supported
Every source the paper cites for this claim was checked and supports it.
In the paper
“Given previous concerns26,27, we performed several sensitivity analyses for the height analysis detailed in the Supplementary Methods.”
§ Within-sibship genome-wide association analyses decrease bias in estimates of direct genetic effects > Methods > Polygenic adaptation
What the sources say
- Supportedcites [26] Berg, J. J. et al. Reduced signal for polygenic adaptation of height in UK Biobank. eLife 8, e39725 (2019). source
The citation supports the ‘previous concerns’ motivating the citing authors’ analyses, not their statement that they performed sensitivity analyses. The Introduction explains that population structure can confound height GWAS and produce false-positive inferences of polygenic adaptation; the Discussion reports that signals from earlier datasets were absent or attenuated in UK Biobank data. (LLM, conf=0.93)
- Supportedcites [27] Sohail, M. et al. Polygenic adaptation on height is overestimated due to uncorrected stratification in genome-wide association studies. eLife 8, e39702 (2019). source
The Discussion describes residual population stratification as a concern in analyses of genetic height, and the Results report that height-score signals change when a different GWAS is used. The citation supports the citing authors’ reference to previous concerns; their statement that they performed sensitivity analyses describes their own work, not this source’s. (LLM, conf=0.90)
plain- Asserted: passes — The authors put it forward as true.
- Checkable: passes — It can be checked against evidence.
- Load-bearing: fails — The paper’s conclusions may not depend on it.
- Based: passes — The paper gives a reason why it holds.
Probably not a substantial claim. The paper’s conclusions may not depend on it.
- Supported
Every source the paper cites for this claim was checked and supports it.
In the paper
“Another limitation is that while assortative mating is unlikely to affect within-sibship GWAS estimates, it can bias within-sibship estimates of heritability downwards49 and so may have affected our LDSC SNP heritability and genetic correlation estimates.”
§ Within-sibship genome-wide association analyses decrease bias in estimates of direct genetic effects > Discussion
What the sources say
- Supportedcites [49] Kemper, K. E. et al. Phenotypic covariance across the entire spectrum of relatedness for 86 billion pairs of individuals. Nat. Commun. 12, 1050 (2021). source
The Results section (‘Adjusting parameter estimates for assortative mating’; page unavailable) shows that, under positive assortative mating, full-sib IBD regression estimates heritability below equilibrium heritability. This supports the downward-bias point attached to citation 49; the sentence’s possible effect on the citing authors’ LDSC estimates is their own inference. (LLM, conf=0.89)
hedgedconditional- Asserted: passes — The authors put it forward as true.
- Checkable: passes — It can be checked against evidence.
- Load-bearing: unclear — It is unclear whether the paper’s conclusions depend on it.
- Based: passes — The paper gives a reason why it holds.
It may state two separate claims as one.
- Rests on an assumption: Assortative mating is unlikely to affect within-sibship GWAS estimates.
- Supported
The cited sources support only part of this claim — read each source’s verdict below.
In the paper
“Previous evidence for adaptation on height using siblings in UK Biobank was suggestive of some adaptation, but statistically inconclusive26.”
§ Within-sibship genome-wide association analyses decrease bias in estimates of direct genetic effects > Discussion
What the sources say
- Partly supportedcites [26] Berg, J. J. et al. Reduced signal for polygenic adaptation of height in UK Biobank. eLife 8, e39725 (2019). sourceExperimental — accuracy not yet measured
The Results (GWAS datasets; no page supplied) identify a UK Biobank sibling-pair analysis, and the Discussion says UK Biobank selection signals were absent or greatly attenuated, with weak significance in some analyses. Those passages support a cautious reading of the evidence, but they do not specifically say that the sibling-based result was suggestive yet statistically inconclusive. (LLM, conf=0.78)
hedged- Asserted: passes — The authors put it forward as true.
- Checkable: passes — It can be checked against evidence.
- Load-bearing: fails — The paper’s conclusions may not depend on it.
- Based: passes — The paper gives a reason why it holds.
Probably not a substantial claim. The paper’s conclusions may not depend on it.
- Partly supported
Every source the paper cites for this claim was checked and supports it.
In the paper
“Sibling effects have been estimated to be modest compared with parental effects6,48 but could have impacted our GWAS estimates.”
§ Within-sibship genome-wide association analyses decrease bias in estimates of direct genetic effects > Discussion
What the sources say
- Supportedcites [6] Young A. I. et al. Mendelian imputation of parental genotypes for genome-wide estimation of direct and indirect genetic effects. Preprint at biorXiv https://doi.org/10.1101/2020.07.02.185199 source
In “Direct and indirect effects of an education PGI” (page unavailable), the paper reports that estimated sibling indirect effects were not statistically significant for any of nine phenotypes, whereas average parental nontransmitted coefficients were significant for most. “Imputation from siblings increases power” (page unavailable) also notes that a nonzero sibling effect could bias estimates. The possibility that sibling effects impacted the citing authors’ own GWAS estimates is their caveat, not a result attributed to this source. (LLM, conf=0.86)
- Supportedcites [48] Kong, A., Benonisdottir, S. and Young, A. I. Family analysis with Mendelian imputations. Preprint at biorXiv https://doi.org/10.1101/2020.07.02.185181 source
In the Empirical Study (page not provided), sibling-effect estimates were not significantly different from zero across four traits, whereas average parental-effect estimates were highly significant. This supports describing the estimated sibling effects as modest relative to parental effects. The possibility that they affected the citing authors’ GWAS estimates is the citing authors’ own qualification, not a finding attributed to this source. (LLM, conf=0.83)
hedgedconditional- Asserted: passes — The authors put it forward as true.
- Checkable: passes — It can be checked against evidence.
- Load-bearing: unclear — It is unclear whether the paper’s conclusions depend on it.
- Based: passes — The paper gives a reason why it holds.
It may state two separate claims as one.
- Supported
The cited sources support only part of this claim — read each source’s verdict below.
In the paper
“In contrast, twin studies do not find strong evidence for common environmental effects on height, where shrinkage is more likely to be a consequence of assortative mating10,46,47.”
§ Within-sibship genome-wide association analyses decrease bias in estimates of direct genetic effects > Discussion
What the sources say
- Partly supportedcites [10] Robinson, M. R. et al. Genetic evidence of assortative mating in humans. Nat. Hum. Behav. 1, 0016 (2017). sourceExperimental — accuracy not yet measured
The paper’s Abstract (page unavailable) reports evidence for assortative mating on height and predicts that it inflates height heritability relative to random mating. It does not report that twin studies find little common-environment effect on height or identify the claimed shrinkage as a consequence of assortative mating. (LLM, conf=0.79)
- Could not verifycites [46] Maes, H. H. et al. A genetic epidemiological mega analysis of smoking initiation in adolescents. Nicotine Tob. Res. 19, 401–409 (2017). sourceExperimental — accuracy not yet measured
The Discussion (page not provided) addresses shared environmental effects and assortative mating for adolescent smoking initiation, not height. Searches for height, shrinkage, and assortative mating found no passage assessing whether twin studies find common environmental effects on height or attributing shrinkage to assortative mating. (LLM, conf=0.75)
- Could not verifycites [47] Stulp, G., Simons, M. J., Grasman, S. & Pollet, T. V. Assortative mating for human height: A meta-analysis. Am. J. Hum. Biol. 29, e22917 (2017). sourceExperimental — accuracy not yet measured
The Discussion (page not available) reports moderate assortative mating for height, but does not assess common environmental effects in twin studies or explain shrinkage. Searches for “shrinkage,” “common environmental effects,” and shared environment found no passage addressing those claims. (LLM, conf=0.72)
hedgedconditional- Asserted: passes — The authors put it forward as true.
- Checkable: passes — It can be checked against evidence.
- Load-bearing: unclear — It is unclear whether the paper’s conclusions depend on it.
- Based: passes — The paper gives a reason why it holds.
It may state two separate claims as one.
- Partly supported
A result the paper reports from its own data — it cites no other source for it, so there is none to check. The quote shows it is in the paper.
In the paper
“UK Biobank estimates were largely consistent with zero confounding although confidence intervals were wide (Supplementary Table 13).”
§ Within-sibship genome-wide association analyses decrease bias in estimates of direct genetic effects > Methods > Evaluation of LD score mismatch
plain- Asserted: passes — The authors put it forward as true.
- Checkable: passes — It can be checked against evidence.
- Load-bearing: unclear — It is unclear whether the paper’s conclusions depend on it.
- Based: passes — The paper gives a reason why it holds.
It may state two separate claims as one.
A result the paper reports from its own data — it cites no other source for it, so there is none to check. The quote shows it is in the paper.
In the paper
“Confounding estimates were modest for height (10%; 95% CI 6%, 14%) and BMI (9%; 2%, 16%), while the estimate for educational attainment was imprecise (35%; 12%, 57%).”
§ Within-sibship genome-wide association analyses decrease bias in estimates of direct genetic effects > Methods > Applying LDSC to within-sibship data
plain- Asserted: passes — The authors put it forward as true.
- Checkable: passes — It can be checked against evidence.
- Load-bearing: unclear — It is unclear whether the paper’s conclusions depend on it.
- Based: passes — The paper gives a reason why it holds.
It may state two separate claims as one.
A result the paper reports from its own data — it cites no other source for it, so there is none to check. The quote shows it is in the paper.
In the paper
“Population MR estimates provided strong evidence that taller height and lower BMI increase educational attainment (0.06 s.d. increase in education per s.d. taller height; 95% CI 0.04, 0.07; 0.19 s.d. decrease in education per s.d. higher BMI; 0.16, 0.22).”
§ Within-sibship genome-wide association analyses decrease bias in estimates of direct genetic effects > Results > Within-sibship MR (WS-MR): effects of height and BMI
boosteddirect- Asserted: passes — The authors put it forward as true.
- Checkable: passes — It can be checked against evidence.
- Load-bearing: passes — The paper’s conclusions depend on it.
- Based: passes — The paper gives a reason why it holds.
It may state two separate claims as one.
A result the paper reports from its own data — it cites no other source for it, so there is none to check. The quote shows it is in the paper.
In the paper
“We performed simulations, described below, confirming that such relatedness can lead to underestimating standard errors in the population model and has no effect on the standard errors of the within-sibship model.”
§ Within-sibship genome-wide association analyses decrease bias in estimates of direct genetic effects > Methods > GWAS analyses
plaindirect- Asserted: passes — The authors put it forward as true.
- Checkable: passes — It can be checked against evidence.
- Load-bearing: passes — The paper’s conclusions depend on it.
- Based: passes — The paper gives a reason why it holds.
It may state two separate claims as one.
The paper states this without a source or data behind it here, so there is nothing to check it against. The quote shows it is in the paper.
In the paper
“The LDSC ratios in the population GWAS were also higher than previous studies.”
§ Within-sibship genome-wide association analyses decrease bias in estimates of direct genetic effects > Methods > Applying LDSC to within-sibship data
plaincorrelational- Asserted: passes — The authors put it forward as true.
- Checkable: passes — It can be checked against evidence.
- Load-bearing: fails — The paper’s conclusions may not depend on it.
- Based: passes — The paper gives a reason why it holds.
Probably not a substantial claim. The paper’s conclusions may not depend on it.
A result the paper reports from its own data — it cites no other source for it, so there is none to check. The quote shows it is in the paper.
In the paper
“The weak evidence for within-sibship shrinkage in the association between BMI genetic variants and BMI is in contrast to the strong evidence from MR analyses (and genetic correlation analyses) that the association between BMI genetic variants and educational attainment does attenuate.”
§ Within-sibship genome-wide association analyses decrease bias in estimates of direct genetic effects > Discussion
boostedcorrelational- Asserted: passes — The authors put it forward as true.
- Checkable: passes — It can be checked against evidence.
- Load-bearing: passes — The paper’s conclusions depend on it.
- Based: passes — The paper gives a reason why it holds.
It may state two separate claims as one.
A result the paper reports from its own data — it cites no other source for it, so there is none to check. The quote shows it is in the paper.
In the paper
“Seemingly unrelated regression standard errors were consistent with the jackknife approach standard errors.”
§ Within-sibship genome-wide association analyses decrease bias in estimates of direct genetic effects > Methods > Within-sibship and population-based GWAS comparison
plain- Asserted: passes — The authors put it forward as true.
- Checkable: passes — It can be checked against evidence.
- Load-bearing: fails — The paper’s conclusions may not depend on it.
- Based: passes — The paper gives a reason why it holds.
Probably not a substantial claim. The paper’s conclusions may not depend on it.
A result the paper reports from its own data — it cites no other source for it, so there is none to check. The quote shows it is in the paper.
In the paper
“In this sample, we found minimal evidence of shrinkage for height genetic variants but—consistent with the European meta-analysis—suggestive evidence of shrinkage for variants associated with smoking initiation.”
§ Within-sibship genome-wide association analyses decrease bias in estimates of direct genetic effects > Discussion
hedged- Asserted: passes — The authors put it forward as true.
- Checkable: passes — It can be checked against evidence.
- Load-bearing: passes — The paper’s conclusions depend on it.
- Based: passes — The paper gives a reason why it holds.
It may state two separate claims as one.
A result the paper reports from its own data — it cites no other source for it, so there is none to check. The quote shows it is in the paper.
In the paper
“We found little evidence of heterogeneity in shrinkage estimates at genetic variants strongly associated (P < 1 × 10⁻⁵) with height and educational attainment, although power was limited by available samples.”
§ Within-sibship genome-wide association analyses decrease bias in estimates of direct genetic effects > Discussion
plain- Asserted: passes — The authors put it forward as true.
- Checkable: passes — It can be checked against evidence.
- Load-bearing: unclear — It is unclear whether the paper’s conclusions depend on it.
- Based: passes — The paper gives a reason why it holds.
It may state two separate claims as one.
A result the paper reports from its own data — it cites no other source for it, so there is none to check. The quote shows it is in the paper.
In the paper
“Estimates failed to converge for genetic correlation analyses involving age at first birth and age at menopause, so these phenotypes were not analyzed here.”
§ Within-sibship genome-wide association analyses decrease bias in estimates of direct genetic effects > Methods > Within-sibship rg with educational attainment
plain- Asserted: passes — The authors put it forward as true.
- Checkable: passes — It can be checked against evidence.
- Load-bearing: fails — The paper’s conclusions may not depend on it.
- Based: passes — The paper gives a reason why it holds.
Probably not a substantial claim. The paper’s conclusions may not depend on it. It may state two separate claims as one.
A result the paper reports from its own data — it cites no other source for it, so there is none to check. The quote shows it is in the paper.
In the paper
“In contrast, WS-MR estimates for these relationships were greatly attenuated (height: 0.02 s.d. increase; −0.01, 0.04; difference P = 1.2 × 10⁻³; BMI: 0.05 s.d. decrease; 0.01, 0.09; difference P = 2.8 × 10⁻⁷).”
§ Within-sibship genome-wide association analyses decrease bias in estimates of direct genetic effects > Results > Within-sibship MR (WS-MR): effects of height and BMI
plaindirect- Asserted: passes — The authors put it forward as true.
- Checkable: passes — It can be checked against evidence.
- Load-bearing: passes — The paper’s conclusions depend on it.
- Based: passes — The paper gives a reason why it holds.
It may state two separate claims as one.
A result the paper reports from its own data — it cites no other source for it, so there is none to check. The quote shows it is in the paper.
In the paper
“We also observed similar attenuation from population MR and WS-MR estimates for BMI on age at first birth (difference P = 2.3 × 10⁻³) and cognitive ability (difference P = 0.020); phenotypes highly correlated with education.”
§ Within-sibship genome-wide association analyses decrease bias in estimates of direct genetic effects > Results > Within-sibship MR (WS-MR): effects of height and BMI
plain- Asserted: passes — The authors put it forward as true.
- Checkable: passes — It can be checked against evidence.
- Load-bearing: unclear — It is unclear whether the paper’s conclusions depend on it.
- Based: passes — The paper gives a reason why it holds.
It may state two separate claims as one.
A result the paper reports from its own data — it cites no other source for it, so there is none to check. The quote shows it is in the paper.
In the paper
“We found that standard errors for shrinkage estimates decreased by around 15% when the covariance was modeled (Supplementary Table 10).”
§ Within-sibship genome-wide association analyses decrease bias in estimates of direct genetic effects > Methods > Within-sibship and population-based GWAS comparison
plaindirect- Asserted: passes — The authors put it forward as true.
- Checkable: passes — It can be checked against evidence.
- Load-bearing: fails — The paper’s conclusions may not depend on it.
- Based: passes — The paper gives a reason why it holds.
Probably not a substantial claim. The paper’s conclusions may not depend on it.
A result the paper reports from its own data — it cites no other source for it, so there is none to check. The quote shows it is in the paper.
In the paper
“However, we observed differences between within-sibship and population MR estimates of height (on educational attainment) and BMI (on educational attainment, cognitive ability and age at first birth).”
§ Within-sibship genome-wide association analyses decrease bias in estimates of direct genetic effects > Discussion
plain- Asserted: passes — The authors put it forward as true.
- Checkable: passes — It can be checked against evidence.
- Load-bearing: passes — The paper’s conclusions depend on it.
- Based: passes — The paper gives a reason why it holds.
It may state two separate claims as one.
A result the paper reports from its own data — it cites no other source for it, so there is none to check. The quote shows it is in the paper.
In the paper
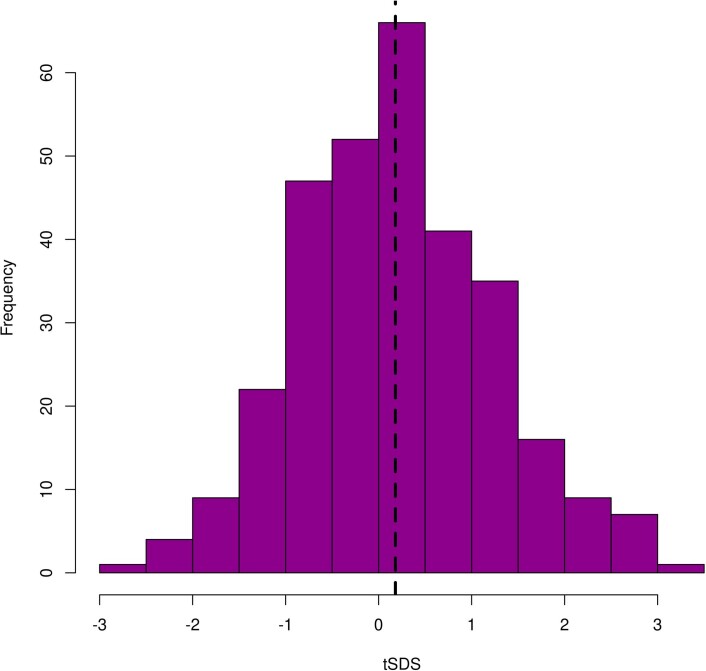
“Here, using within-sibship GWAS estimates from a larger (~4-fold) sample of siblings, we found strong evidence of polygenic adaptation on increased height and some evidence of adaptation on number of children and HDL-cholesterol.”
§ Within-sibship genome-wide association analyses decrease bias in estimates of direct genetic effects > Discussion
boostedcorrelational- Asserted: passes — The authors put it forward as true.
- Checkable: passes — It can be checked against evidence.
- Load-bearing: passes — The paper’s conclusions depend on it.
- Based: passes — The paper gives a reason why it holds.
It may state two separate claims as one.
A conclusion the paper draws from its own results — it cites no other source for it, so there is none to check. The quote shows it is in the paper.
In the paper
“The observed attenuations were consistent with theoretical expectation (Supplementary Table 4), suggesting that the lower within-sibship SNP heritability estimates are explained by genetic association estimate shrinkage.”
§ Within-sibship genome-wide association analyses decrease bias in estimates of direct genetic effects > Results > Within-sibship SNP heritability estimates
hedgeddirect- Asserted: passes — The authors put it forward as true.
- Checkable: passes — It can be checked against evidence.
- Load-bearing: passes — The paper’s conclusions depend on it.
- Based: passes — The paper gives a reason why it holds.
It may state two separate claims as one.
The paper states this without a source or data behind it here, so there is nothing to check it against. The quote shows it is in the paper.
In the paper
“LDSC requires nonzero heritability to generate meaningful rg estimates, so we restricted analyses to the 22 phenotypes with SNP heritability point estimates greater than zero in both population and within-sibship models (that is, omitted physical activity and ratio of forced expiratory volume (FEV1)/forced vital capacity (FEV1FVC)).”
§ Within-sibship genome-wide association analyses decrease bias in estimates of direct genetic effects > Methods > Within-sibship rg with educational attainment
plain- Asserted: passes — The authors put it forward as true.
- Checkable: passes — It can be checked against evidence.
- Load-bearing: passes — The paper’s conclusions depend on it.
- Based: passes — The paper gives a reason why it holds.
Probably not a substantial claim.
What the paper did — it cites no source for this, so there is none to check. The quote shows it is in the paper.
In the paper
“Our findings are also limited to adult phenotypes.”
§ Within-sibship genome-wide association analyses decrease bias in estimates of direct genetic effects > Discussion
plain- Asserted: passes — The authors put it forward as true.
- Checkable: passes — It can be checked against evidence.
- Load-bearing: fails — The paper’s conclusions may not depend on it.
- Based: passes — The paper gives a reason why it holds.
Probably not a substantial claim. The paper’s conclusions may not depend on it.
What the paper did — it cites no source for this, so there is none to check. The quote shows it is in the paper.
In the paper
“Note that this clustering accounts for sibling relationships but does not account for further relatedness present in each sample.”
§ Within-sibship genome-wide association analyses decrease bias in estimates of direct genetic effects > Methods > GWAS analyses
plain- Asserted: passes — The authors put it forward as true.
- Checkable: passes — It can be checked against evidence.
- Load-bearing: passes — The paper’s conclusions depend on it.
- Based: passes — The paper gives a reason why it holds.
It may state two separate claims as one.
What the paper did — it cites no source for this, so there is none to check. The quote shows it is in the paper.
In the paper
“However, we do not have an estimate of this covariance term because the two GWAS were fit in separate regression models.”
§ Within-sibship genome-wide association analyses decrease bias in estimates of direct genetic effects > Methods > Within-sibship and population-based GWAS comparison
plain- Asserted: passes — The authors put it forward as true.
- Checkable: passes — It can be checked against evidence.
- Load-bearing: fails — The paper’s conclusions may not depend on it.
- Based: passes — The paper gives a reason why it holds.
Probably not a substantial claim. The paper’s conclusions may not depend on it.
What the paper did — it cites no source for this, so there is none to check. The quote shows it is in the paper.
In the paper
“GWAS analyses were performed uniformly across individual studies using automated scripts and a preregistered analysis plan (https://github.com/LaurenceHowe/SiblingGWAS).”
§ Within-sibship genome-wide association analyses decrease bias in estimates of direct genetic effects > Methods > GWAS analyses
plain- Asserted: passes — The authors put it forward as true.
- Checkable: passes — It can be checked against evidence.
- Load-bearing: fails — The paper’s conclusions may not depend on it.
- Based: passes — The paper gives a reason why it holds.
Probably not a substantial claim. The paper’s conclusions may not depend on it. It may state two separate claims as one.
The paper states this without a source or data behind it here, so there is nothing to check it against. The quote shows it is in the paper.
In the paper
“Uniform shrinkage across the genome would lead to GWAS Z scores being multiplied by a factor (1 − k), where k is the shrinkage coefficient, and χ2 statistics being multiplied by (1 − k)2.”
§ Within-sibship genome-wide association analyses decrease bias in estimates of direct genetic effects > Methods > Within-sibship SNP heritability estimates
hedgeddirect- Asserted: passes — The authors put it forward as true.
- Checkable: passes — It can be checked against evidence.
- Load-bearing: passes — The paper’s conclusions depend on it.
- Based: fails — The paper may give no reason why it holds.
Probably not a substantial claim. The paper may give no reason why it holds. It may state two separate claims as one.
A conclusion the paper draws from its own results — it cites no other source for it, so there is none to check. The quote shows it is in the paper.
In the paper
“However, the within-sibship shrinkage in GWAS estimates and LDSC heritability estimates were largely consistent, suggesting any such bias is unlikely to have impacted our conclusions.”
§ Within-sibship genome-wide association analyses decrease bias in estimates of direct genetic effects > Discussion
hedgedcorrelational- Asserted: passes — The authors put it forward as true.
- Checkable: passes — It can be checked against evidence.
- Load-bearing: passes — The paper’s conclusions depend on it.
- Based: passes — The paper gives a reason why it holds.
It may state two separate claims as one.
What the paper did — it cites no source for this, so there is none to check. The quote shows it is in the paper.
In the paper
“Standard errors from both estimators were clustered over families at the sibling level to account for nonrandom clustering of siblings within families.”
§ Within-sibship genome-wide association analyses decrease bias in estimates of direct genetic effects > Methods > GWAS analyses
plaindirect- Asserted: passes — The authors put it forward as true.
- Checkable: passes — It can be checked against evidence.
- Load-bearing: passes — The paper’s conclusions depend on it.
- Based: passes — The paper gives a reason why it holds.
Probably not a substantial claim.
The paper states this without a source or data behind it here, so there is nothing to check it against. The quote shows it is in the paper.
In the paper
“Both of these tend to influence associations proportional to the direct effect, whereas population stratification is likely to have larger effects on ancestrally informative markers.”
§ Within-sibship genome-wide association analyses decrease bias in estimates of direct genetic effects > Discussion
hedgedcorrelational- Asserted: passes — The authors put it forward as true.
- Checkable: passes — It can be checked against evidence.
- Load-bearing: passes — The paper’s conclusions depend on it.
- Based: passes — The paper gives a reason why it holds.
It may state two separate claims as one.
What the paper did — it cites no source for this, so there is none to check. The quote shows it is in the paper.
In the paper
“We used the LDAK-Thin model with the precomputed tagging file over the BLD-LDAK model because of the limited power of our datasets (the BLD-LDAK model includes additional parameters so generates less precise estimates).”
§ Within-sibship genome-wide association analyses decrease bias in estimates of direct genetic effects > Methods > Within-sibship SNP heritability estimates
plaindirect- Asserted: passes — The authors put it forward as true.
- Checkable: passes — It can be checked against evidence.
- Load-bearing: fails — The paper’s conclusions may not depend on it.
- Based: passes — The paper gives a reason why it holds.
Probably not a substantial claim. The paper’s conclusions may not depend on it.
A conclusion the paper draws from its own results — it cites no other source for it, so there is none to check. The quote shows it is in the paper.
In the paper
“Thus, cryptic relatedness likely inflated LDSC ratios in the population models but not in the within-sibling data.”
§ Within-sibship genome-wide association analyses decrease bias in estimates of direct genetic effects > Methods > Cryptic relatedness
hedgedconditional- Asserted: passes — The authors put it forward as true.
- Checkable: passes — It can be checked against evidence.
- Load-bearing: passes — The paper’s conclusions depend on it.
- Based: passes — The paper gives a reason why it holds.
It may state two separate claims as one.
What the paper did — it cites no source for this, so there is none to check. The quote shows it is in the paper.
In the paper
“We estimated only pairwise genetic correlations between educational attainment and all other phenotypes because of previous evidence that educational attainment is influenced by demographic and indirect genetic effects and, given the limited statistical power, to reduce the multiple testing burden.”
§ Within-sibship genome-wide association analyses decrease bias in estimates of direct genetic effects > Methods > Within-sibship rg with educational attainment
plaindirect- Asserted: passes — The authors put it forward as true.
- Checkable: passes — It can be checked against evidence.
- Load-bearing: passes — The paper’s conclusions depend on it.
- Based: passes — The paper gives a reason why it holds.
Probably not a substantial claim. It may state two separate claims as one.
- Rests on an assumption: Educational attainment is influenced by demographic and indirect genetic effects.
What the paper did — it cites no source for this, so there is none to check. The quote shows it is in the paper.
In the paper
“The automated pipeline restricted analyses to common genetic variants (minor allele frequency (MAF) > 0.01) and removed poorly imputed variants (INFO: information score < 0.3).”
§ Within-sibship genome-wide association analyses decrease bias in estimates of direct genetic effects > Methods > GWAS analyses
plain- Asserted: passes — The authors put it forward as true.
- Checkable: passes — It can be checked against evidence.
- Load-bearing: fails — The paper’s conclusions may not depend on it.
- Based: passes — The paper gives a reason why it holds.
Probably not a substantial claim. The paper’s conclusions may not depend on it. It may state two separate claims as one.
What the paper did — it cites no source for this, so there is none to check. The quote shows it is in the paper.
In the paper
“Within-family GWAS are limited by both available family data and statistical inefficiency (homozygosity within families).”
§ Within-sibship genome-wide association analyses decrease bias in estimates of direct genetic effects > Discussion
plaindirect- Asserted: passes — The authors put it forward as true.
- Checkable: passes — It can be checked against evidence.
- Load-bearing: fails — The paper’s conclusions may not depend on it.
- Based: passes — The paper gives a reason why it holds.
Probably not a substantial claim. The paper’s conclusions may not depend on it. It may state two separate claims as one.
What the paper did — it cites no source for this, so there is none to check. The quote shows it is in the paper.
In the paper
“LDSC requires nonzero heritability to generate meaningful rg estimates, so we restricted analyses to the 22 phenotypes with SNP heritability point estimates greater than zero in both population and within-sibship models (that is, omitted physical activity and ratio of forced expiratory volume (FEV1)/forced vital capacity (FEV1FVC)).”
§ Within-sibship genome-wide association analyses decrease bias in estimates of direct genetic effects > Methods > Within-sibship rg with educational attainment
plain- Asserted: passes — The authors put it forward as true.
- Checkable: passes — It can be checked against evidence.
- Load-bearing: passes — The paper’s conclusions depend on it.
- Based: passes — The paper gives a reason why it holds.
Probably not a substantial claim.
The authors state this as an assumption.
Within-sibship models capture demographic and indirect genetic effects of parents in the family mean genotype covariate, so the within-sibship estimate is not influenced by these sources.
“Demography and indirect genetic effects of parents (N) will be captured by GF. The association between GC and X will not be influenced by these sources of association but could be affected by indirect effects of the siblings themselves, which are not controlled for.”
The paper relies on this without support.
Assortative mating is unlikely to affect within-sibship GWAS estimates.
“while assortative mating is unlikely to affect within-sibship GWAS estimates”
The authors state this as an assumption.
If biases affect the population and within-sibship SNP heritability estimates equally, then the difference between the two estimates will be unbiased.
“If we assume that biases affect the estimates equally then the difference between the two estimates will be unbiased.”
The authors state this as an assumption.
All other coefficients remain consistent when writing the expectation of hWS² as a function of k and hPop².
“Therefore, assuming all other coefficients remain consistent, the expectation of hWS² can be written as a function of k and hPop².”
The paper relies on this without support.
Effects from demographic and familial pathways inflate (rather than shrink) population-based estimates.
“In general, these effects have been shown to inflate (rather than shrink) population-based estimates, so we estimated within-sibship shrinkage (the % difference from population to within-sibship estimates).”
The paper relies on this without support.
Educational attainment is influenced by demographic and indirect genetic effects.
“We estimated only pairwise genetic correlations between educational attainment and all other phenotypes because of previous evidence that educational attainment is influenced by demographic and indirect genetic effects and, given the limited statistical power, to reduce the multiple testing burden.”
The paper relies on this without support.
There is previous evidence for shrinkage on height and educational attainment.
“These phenotypes were chosen because of previous evidence for shrinkage on these phenotypes and available data.”
The paper relies on this without support.
Cryptic relatedness, defined as nonindependence between close relatives in the study sample, leads to inflated precision in GWAS associations.
“One source of inflation in GWAS associations is cryptic relatedness: nonindependence between close relatives in the study sample results which leads to inflated precision.”
The paper relies on this without support.
Inflated signal relating to cryptic relatedness may result in confounded signal, which is detected by the LD score intercept/ratio.
“Inflated signal relating to cryptic relatedness may result in confounded signal, which is detected by the LD score intercept/ratio.”
Claims other papers make about this one
Each is checked against this paper’s own text: does it say what the citing paper says it does?
The source backs part of the claim, not all of it — or backs it for a different population, condition or comparison.
In the citing paper
“The sib-GWAS approach was used by Howe et al.9, which produced sib-GWAS estimates of DGEs on 24 phenotypes from a meta-analysis of European genetic ancestry cohorts.”
From Family-GWAS reveals effects of environment and mating on genetic associations (2024) · cites this paper as [9]
Experimental — accuracy not yet measuredThe source backs part of the claim, not all of it — or backs it for a different population, condition or comparison.
In the citing paper
“Because the segregation of chromosomes during meiosis is independent of environment, estimates of DGEs are free from confounding due to gene-environment correlation, including from IGEs and population-stratification3,9,15,16.”
From Family-GWAS reveals effects of environment and mating on genetic associations (2024) · cites this paper as [9]
Experimental — accuracy not yet measuredThe source backs part of the claim, not all of it — or backs it for a different population, condition or comparison.
In the citing paper
“However, we do not replicate the Howe et al. result for cognitive performance: we find similar SNP heritability from DGEs (0.188, S.E. 0.027) and population effects (0.186, S.E. 0.016), whereas Howe et al. found substantially smaller heritability from DGEs (0.14, S.E. 0.043) than from population effects (0.24, S.E. 0.031).”
From Family-GWAS reveals effects of environment and mating on genetic associations (2024) · cites this paper as [9]
Experimental — accuracy not yet measuredThe source backs part of the claim, not all of it — or backs it for a different population, condition or comparison.
In the citing paper
“Genome-wide summary statistics on DGEs from FGWAS can be used instead as inputs to LDSC9, thereby giving SNP heritability estimates that remove contributions from IGEs, population stratification, and inflation due to AM, bringing them closer to traditional definitions of heritability.”
From Family-GWAS reveals effects of environment and mating on genetic associations (2024) · cites this paper as [9]
Experimental — accuracy not yet measuredThe source backs part of the claim, not all of it — or backs it for a different population, condition or comparison.
In the citing paper
“Polygenic predictors (called polygenic indices, PGIs, or polygenic scores) based on DGE estimates from FGWAS – hereafter, DGE PGIs – have favorable properties due to the removal of confounding from PGI weights, making them suited to applications that are sensitive to confounding4,5,9,13,23.”
From Family-GWAS reveals effects of environment and mating on genetic associations (2024) · cites this paper as [9]
Experimental — accuracy not yet measured
The source backs part of the claim, not all of it — or backs it for a different population, condition or comparison.
In the citing paper
“Some, but not all, of these methods have been shown to be particularly vulnerable to biased inferences due to uncorrected population stratification confounding: for example, measuring the strength of AM23, assessing evidence for IGEs11,42,43, assessing evidence for polygenic selection using ancient and modern DNA4,5,9, and Mendelian Randomisation13.”
From Family-GWAS reveals effects of environment and mating on genetic associations (2024) · cites this paper as [9]
Experimental — accuracy not yet measuredThe source backs part of the claim, not all of it — or backs it for a different population, condition or comparison.
In the citing paper
“Since LDSC was designed for GWAS summary statistics on population effects derived from samples of unrelated individuals, we use the effective sample size for the required sample size input3,9.”
From Family-GWAS reveals effects of environment and mating on genetic associations (2024) · cites this paper as [9]
Experimental — accuracy not yet measuredThe cited source says what the claim attributes to it.
In the citing paper
“However, genetic associations can be affected by gene-environment correlations and non-random mating, which can lead to biased inferences in downstream analyses.”
From Family-GWAS reveals effects of environment and mating on genetic associations (2024) · cites this paper as [9]
The cited source says what the claim attributes to it.
In the citing paper
“Family-based GWAS (FGWAS) has been proposed as a solution to the problem of confounding in GWAS3,9,14–16 that also enables deeper investigation of the impact of gene-environment correlation — including from IGEs — and non-random mating, including population structure and assortative mating.”
From Family-GWAS reveals effects of environment and mating on genetic associations (2024) · cites this paper as [9]
The cited source says what the claim attributes to it.
In the citing paper
“Family-based GWAS (FGWAS) uses the natural experiment of random assignment of genotype within families to separate out the contribution of direct genetic effects (DGEs) — causal effects of alleles in an individual on an individual — from other factors contributing to genetic associations.”
From Family-GWAS reveals effects of environment and mating on genetic associations (2024) · cites this paper as [9]
The cited source says what the claim attributes to it.
In the citing paper
“An alternative study design, which we call sib-GWAS, uses genetic differences between siblings to estimate DGEs3,9.”
From Family-GWAS reveals effects of environment and mating on genetic associations (2024) · cites this paper as [9]
The cited source says what the claim attributes to it.
In the citing paper
“Our SNP heritability estimates are generally similar to those from Howe et al.9 although with greatly increased precision for some phenotypes.”
From Family-GWAS reveals effects of environment and mating on genetic associations (2024) · cites this paper as [9]
The cited source says what the claim attributes to it.
In the citing paper
“Beyond uncorrected-for population stratification, other phenomena may lead to LDSC intercepts above one, including: violation of LDSC assumptions about genetic architecture48, differences in LD between the reference and meta-analysis samples, and cryptic relatedness9.”
From Family-GWAS reveals effects of environment and mating on genetic associations (2024) · cites this paper as [9]
Self-check
Percentages, sums and reported differences re-computed from the paper’s own numbers.
Each contradiction between two passages listed here was confirmed by an independent check.
Rated minor: it would not touch a result — a value no result rests on, a p-value that stays on the same side of the significance level, or a conflict that is clerical, resolved elsewhere in the paper, or outside its own findings.
In the paper
§ Within-sibship genome-wide association analyses decrease bias in estimates of direct genetic effects > Abstract
“We combined data from 178,086 siblings from 19 cohorts”
§ Within-sibship genome-wide association analyses decrease bias in estimates of direct genetic effects > Results > Within-sibship and population-based GWAS comparison
“For GWAS analyses we used data from 178,076 individuals (with one or more genotyped siblings) from 77,832 sibships in 19 studies.”
Rated minor: it would not touch a result — a value no result rests on, a p-value that stays on the same side of the significance level, or a conflict that is clerical, resolved elsewhere in the paper, or outside its own findings.
In the paper
§ Within-sibship genome-wide association analyses decrease bias in estimates of direct genetic effects > Results > Polygenic adaptation
“Here, we recalculated Spearman’s rank correlation (r) between tSDS (SDS aligned with the phenotype-increasing allele) and our population/within-sibship GWAS P values for 25 phenotypes, with standard errors estimated using jackknifing over blocks of genetic variants.”
§ Within-sibship genome-wide association analyses decrease bias in estimates of direct genetic effects > Methods > Polygenic adaptation
“Spearman’s rank test was used to estimate the correlation between tSDS and the absolute value of GWAS Z scores from the population and within-sibship models.”
Citations
Cites
PLINK: a tool set for whole-genome association and population-based linkage analyses.
Purcell, S., Neale, B., Todd-Brown, K., Thomas, L., Ferreira, M. A. R., Bender, D., Maller, J., Sklar, P., de Bakker, P. I. W., Daly, M. J., et al. (2007) · The American Journal of Human Genetics · doi:10.1086/519795 · Cited by 34,089 · cited 1×
“53 ).”
A global reference for human genetic variation
The 1000 Genomes Project Consortium, authors, C., Auton, A., Abecasis, G. R., Steering committee, Altshuler, D. M., Durbin, R. M., Abecasis, G. R., Bentley, D. R., Chakravarti, A., et al. (2015) · Nature · doi:10.1038/nature15393 · Cited by 18,247
Self-citationThe genetical theory of natural selection
Fisher, R. A. (1930) · doi:10.5962/bhl.title.27468 · Cited by 17,617
The UK Biobank resource with deep phenotyping and genomic data
Bycroft, C., Freeman, C., Petkova, D., Band, G., Elliott, L. T., Sharp, K., Motyer, A., Vukcevic, D., Delaneau, O., O’Connell, J., et al. (2018) · Nature · doi:10.1038/s41586-018-0579-z · Cited by 8,876
Mendelian Randomization Analysis With Multiple Genetic Variants Using Summarized Data
Burgess, S., Butterworth, A., & Thompson, S. G. (2013) · Genetic Epidemiology · doi:10.1002/gepi.21758 · Cited by 6,050
Davey Smith, G., & Ebrahim, S. (2003) · International Journal of Epidemiology · doi:10.1093/ije/dyg070 · Cited by 5,882 · cited 2×
“MR was originally conceptualized in the context of parent–offspring trios where offspring inherit a random allele from each parent 24 .”
LD Score regression distinguishes confounding from polygenicity in genome-wide association studies
Schizophrenia Working Group of the Psychiatric Genomics Consortium, Bulik-Sullivan, B. K., Loh, P.-R., Finucane, H. K., Ripke, S., Yang, J., Patterson, N., Daly, M. J., Price, A. L., & Neale, B. M. (2015) · Nature Genetics · doi:10.1038/ng.3211 · Cited by 5,559 · cited 7×
“Linkage disequilibrium (LD) score regression (LDSC) can use GWAS data to estimate SNP heritability, the proportion of phenotypic variation explained by common SNPs 20,23 .”
InfluentialThe Future of Genetic Studies of Complex Human Diseases
Risch, N., & Merikangas, K. (1996) · Science · doi:10.1126/science.273.5281.1516 · Cited by 5,355
METAL: fast and efficient meta-analysis of genomewide association scans
Willer, C. J., Li, Y., & Abecasis, G. R. (2010) · Bioinformatics · doi:10.1093/bioinformatics/btq340 · Cited by 5,205 · cited 2×
“GWAS models were performed in individual studies, harmonized and then meta-analyzed for each phenotype using a fixed-effects model in METAL 50 with population and within-sibship data meta-analyzed separately.”
Mendelian randomization: Using genes as instruments for making causal inferences in epidemiology
Lawlor, D. A., Harbord, R. M., Sterne, J. A. C., Timpson, N., & Davey Smith, G. (2008) · Statistics in Medicine · doi:10.1002/sim.3034 · Cited by 4,618 · cited 1×
“MR uses genetic variants as instrumental variables to assess the causal effect of exposure phenotypes on outcomes 24,41 .”
Self-citation
Cited by
Sorted by citations
Sanderson, E., Glymour, M. M., Holmes, M. V., Kang, H., Morrison, J., Munafò, M. R., Palmer, T., Schooling, C. M., Wallace, C., Zhao, Q., et al. (2022) · Nature Reviews Methods Primers · doi:10.1038/s43586-021-00092-5 · Cited by 2,229
Guidelines for performing Mendelian randomization investigations
Burgess, S., Davey Smith, G., Davies, N. M., Dudbridge, F., Gill, D., Glymour, M. M., Hartwig, F. P., Holmes, M. V., Minelli, C., Relton, C. L., et al. (2020) · Wellcome Open Research · doi:10.12688/wellcomeopenres.15555.2 · Cited by 1,273
Self-citationGuidelines for performing Mendelian randomization investigations: update for summer 2023
Burgess, S., Smith, G. D., Davies, N. M., Dudbridge, F., Gill, D., Glymour, M. M., Hartwig, F. P., Kutalik, Z., Holmes, M. V., Minelli, C., et al. (2023) · Wellcome Open Research · doi:10.12688/wellcomeopenres.15555.3 · Cited by 747
Self-citation15 years of GWAS discovery: Realizing the promise
Abdellaoui, A., Yengo, L., Verweij, K. J. H., & Visscher, P. M. (2023) · The American Journal of Human Genetics · doi:10.1016/j.ajhg.2022.12.011 · Cited by 570
Participation bias in the UK Biobank distorts genetic associations and downstream analyses
Schoeler, T., Speed, D., Porcu, E., Pirastu, N., Pingault, J., & Kutalik, Z. (2023) · Nature Human Behaviour · doi:10.1038/s41562-023-01579-9 · Cited by 437
“Finally, comparing wGWA results with those obtained from standard GWA analyses, we assessed the impact of participation bias on the estimation of three frequently studied quantities: (1) the effect of genetic markers on complex traits, (2) heritability and genetic correlation estimates, and (3) exposure–outcome associ…”
BackgroundMethodSelf-citationAttention-deficit/hyperactivity disorder
Faraone, S. V., Bellgrove, M. A., Brikell, I., Cortese, S., Hartman, C. A., Hollis, C., Newcorn, J. H., Philipsen, A., Polanczyk, G. V., Rubia, K., et al. (2024) · Nature Reviews Disease Primers · doi:10.1038/s41572-024-00495-0 · Cited by 355
“GWAS suggest that the SES–ADHD association is due to both direct genetic parent-to-offspring transmission and the effects of a low SES environment on the mental health of offspring 101,102 .”
Andreassen, O. A., Hindley, G., Frei, O., & Smeland, O. B. (2023) · World Psychiatry · doi:10.1002/wps.21034 · Cited by 284
Self-citationDairying, diseases and the evolution of lactase persistence in Europe
Evershed, R. P., Smith, G. D., Roffet‐Salque, M., Timpson, A., Diekmann, Y., Lyon, M., Cramp, L., Casanova, E., Smyth, J., Whelton, H. L., et al. (2022) · Nature · doi:10.1038/s41586-022-05010-7 · Cited by 242
Self-citationGene–environment correlations across geographic regions affect genome-wide association studies
Abdellaoui, A., Dolan, C. V., Verweij, K. J. H., & Nivard, M. G. (2022) · Nature Genetics · doi:10.1038/s41588-022-01158-0 · Cited by 163
“The sample sizes are: Lee et al 16: N = 1,131,881; Abdellaoui et al (2022): N = 252,521; Wu et al (2020): N = 24,434; Young et al (2020)/Wu et al (2020): N = 22,207; Howe et al (2022): N = 128,777.”
Self-citationGenotyping and population characteristics of the China Kadoorie Biobank
Walters, R. G., Millwood, I. Y., Lin, K., Schmidt, D., McDonnell, P., Hacker, A., Avery, D., Edris, A., Fry, H., Cai, N., et al. (2023) · Cell Genomics · doi:10.1016/j.xgen.2023.100361 · Cited by 155
“The historical consanguinity and extensive relatedness in the CKB have been exploited in analysis of the impact of inbreeding on reproductive success(27) and for within-sibship GWASs to derive estimates of direct genetic effects unaffected by genetic nurture.(28) However, for the majority of studies, the population st…”
BackgroundSelf-citationThe selection landscape and genetic legacy of ancient Eurasians
Irving-Pease, E. K., Refoyo-Martínez, A., Barrie, W., Ingason, A., Pearson, A., Fischer, A., Sjögren, K.-G., Halgren, A. S., Macleod, R., Demeter, F., et al. (2024) · Nature · doi:10.1038/s41586-023-06705-1 · Cited by 126
Cross-trait assortative mating is widespread and inflates genetic correlation estimates
Border, R., Athanasiadis, G. I., Buil, A., Schork, A. J., Cai, N., Young, A. I., Werge, T. M., Flint, J., Kendler, K. S., Sankararaman, S., et al. (2022) · Science · doi:10.1126/science.abo2059 · Cited by 137
Timing of lifespan influences on brain and cognition
Walhovd, K. B., Lövden, M., & Fjell, A. M. (2023) · Trends in Cognitive Sciences · doi:10.1016/j.tics.2023.07.001 · Cited by 112
“Recently, family-based GWAS have enabled improved control of demographic and indirect genetic effects, such as population stratification, assortative mating, relatives, and social context [111,112].”
Corfield, E. C., Shadrin, A. A., Frei, O., Rahman, Z., Lin, A., Athanasiu, L., Akdeniz, B. C., Filiz, T. T., Hannigan, L. J., Wootton, R. E., et al. (2022) · bioRxiv (Cold Spring Harbor Laboratory) · doi:10.1101/2022.06.23.496289 · Cited by 108
“These include investigations of genetic and environmental mechanisms of intergenerational transmission [9], and interrogations of the role of familial confounding in observational associations [10].”
Self-citationGenetic and molecular architecture of complex traits
Lappalainen, T., Li, Y., Ramachandran, S., & Gusev, A. (2024) · Cell · doi:10.1016/j.cell.2024.01.023 · Cited by 125
Mendelian randomization: causal inference leveraging genetic data
Chen, L. G., Tubbs, J. D., Liu, Z., Thach, T., & Sham, P. C. (2024) · Psychological Medicine · doi:10.1017/s0033291724000321 · Cited by 93
Alemu, R. G., Sharew, N. T., Arsano, Y. Y., Ahmed, M. B., Ayele, F. T., Baye, T. M., & Amare, A. T. (2025) · Human Genomics · doi:10.1186/s40246-025-00718-9 · Cited by 99
Veller, C., & Coop, G. (2024) · PLoS Biology · doi:10.1371/journal.pbio.3002511 · Cited by 81
“Instead of using a set of SNPs and weights from a population GWAS, genetic correlations between traits due to pleiotropy could be estimated from the correlation of effect sizes estimated within families [33].”
1,000 ancient genomes uncover 10,000 years of natural selection in EuropePreprint
Le, M. K., Smith, O. S., Akbari, A., Harpak, A., Reich, D., & Narasimhan, V. M. (2022) · bioRxiv (Cold Spring Harbor Laboratory) · doi:10.1101/2022.08.24.505188 · Cited by 75
Examining the role of common variants in rare neurodevelopmental conditions
Huang, Q. Q., Wigdor, E. M., Malawsky, D. S., Campbell, P. H., Samocha, K. E., Chundru, V. K., Danecek, P., Lindsay, S., Marchant, T., Koko, M., et al. (2024) · Nature · doi:10.1038/s41586-024-08217-y · Cited by 86
“We also observed a significant non-transmitted coefficient in the mother when using a polygenic score derived from a within-family GWAS for educational attainment 25 (Supplementary Note 6).”
Wrestling with Social and Behavioral Genomics: Risks, Potential Benefits, and Ethical Responsibility
Meyer, M. N., Appelbaum, P. S., Benjamin, D. J., Callier, S., Comfort, N., Conley, D., Jeremy Freese, A., Garrison, N. A., Hammonds, E. M., Harden, K. P., et al. (2023) · The Hastings Center Report · doi:10.1002/hast.1477 · Cited by 72
Self-citationNivard, M. G., Belsky, D. W., Harden, K. P., Baier, T., Andreassen, O. A., Ystrøm, E., van Bergen, E., & Lyngstad, T. H. (2024) · Nature Human Behaviour · doi:10.1038/s41562-023-01796-2 · Cited by 65
“Such effects could reflect subtle socioeconomic and genetic-ancestry stratification co-occurring within homogeneous populations 4,30,31 .”
InfluentialSelf-citationHu, X., Cai, M., Xiao, J., Wan, X., Wang, Z., Zhao, H., & Yang, C. (2024) · The American Journal of Human Genetics · doi:10.1016/j.ajhg.2024.06.016 · Cited by 66
Dyslipidemia and Risk of Preeclampsia: A Multiancestry Mendelian Randomization Study
Hosier, H., Lipkind, H. S., Rasheed, H., DeWan, A. T., & Rogne, T. (2023) · Hypertension · doi:10.1161/hypertensionaha.122.20426 · Cited by 55
Self-citationCapalbo, A., de Wert, G. M. W. R., Mertes, H., Klausner, L., Coonen, E., Spinella, F., de Velde, H. V., Viville, S., Sermon, K., Vermeulen, N., et al. (2024) · Human Reproduction Update · doi:10.1093/humupd/dmae012 · Cited by 66
“…with indirect effects can be, for example, correlated with population affiliation or with the parental-provided environment (Selzam et al. , 2019; Young et al. , 2019; Morris et al. , 2020; Howe et al. , 2022) and would therefore be ineffective in predicting differences between sibling embryos.”
BackgroundAkbari, A., Barton, A. R., Gazal, S., Li, Z., Kariminejad, M., Perry, A., Zeng, Y., Mittnik, A., Patterson, N. J., Mah, M., et al. (2024) · bioRxiv (Cold Spring Harbor Laboratory) · doi:10.1101/2024.09.14.613021 · Cited by 57
Fan, C. C., Loughnan, R. J., Wilson, S., Hewitt, J. K., ABCD Genetic Working Group, Arpana Agrawal, A., Dowling, G. J., Garavan, H., LeBlanc, K. H., Neale, M. C., et al. (2023) · Behavior Genetics · doi:10.1007/s10519-023-10143-0 · Cited by 53
Self-citationBURT, C. H. (2022) · Behavioral and Brain Sciences · doi:10.1017/s0140525x22001145 · Cited by 55
Family-GWAS reveals effects of environment and mating on genetic associations
Tan, T., Jayashankar, H., Guan, J., Nehzati, S. M., Mir, M., Bennett, M., Agerbo, E., Ahlskog, R., de Andrade Anapaz, V. P., Benonisdottir, S., et al. (2024) · doi:10.1101/2024.10.01.24314703 · Cited by 47
“We analyzed both DGE and population effect estimates on EA and height from our European genetic ancestry meta-analysis, finding no discernable differences between enrichment estimates from DGE and population effects for either phenotypes (Supplementary Figures 8-9), although power for this analysis was limited for EA…”
InfluentialSelf-citationGenetic analyses implicate complex links between adult testosterone levels and health and disease
Leinonen, J. T., Mars, N., Lehtonen, L. E., Ahola‐Olli, A., Ruotsalainen, S., Lehtimäki, T. J., Kähönen, M. A. P., Raitakari, O. T., Mars, N., Ruotsalainen, S., et al. (2023) · Communications Medicine · doi:10.1038/s43856-022-00226-0 · Cited by 46
The genetic landscape of substance use disorders
Gerring, Z. F., Thorp, J. G., Treur, J. L., Verweij, K. J. H., & Derks, E. M. (2024) · Molecular Psychiatry · doi:10.1038/s41380-024-02547-z · Cited by 52
Willoughby, E. A., Polderman, T. J. C., & Boutwell, B. B. (2023) · Nature Reviews Methods Primers · doi:10.1038/s43586-022-00191-x · Cited by 42
Self-citationTrauma, adversity, and biological aging: behavioral mechanisms relevant to treatment and theory
Bourassa, K. J., & Sbarra, D. A. (2024) · Translational Psychiatry · doi:10.1038/s41398-024-03004-9 · Cited by 44
“…to yield dissociated fi ndings (and this is especially true when research incorporates analyses from between-and within-family models, see [168, 178, 179]) and triangulating across different approaches is a key element of scienti fi c falsi fi cation [180, 181], the powerful idea that scienti fi c…”
BackgroundExploring antidiabetic drug targets as potential disease-modifying agents in osteoarthritis
Fu, K., Si, S., Jin, X., Zhang, Y., Duong, V., Cai, Q., Li, G., Oo, W. M., Zheng, X., Boer, C. G., et al. (2024) · EBioMedicine · doi:10.1016/j.ebiom.2024.105285 · Cited by 41
“These include the HbA1c GWAS from MAGIC 19 and the Within Family GWAS consortium, 20 the T2DM GWAS from DIAGRAM, 21 FinnGen, as well as the fasting glucose data from MAGIC.”
MethodHowe, L. J., Rasheed, H., Jones, P. R., Boomsma, D. I., Evans, D. M., Giannelis, A., Hayward, C., Hopper, J. L., Hughes, A., Lahtinen, H., et al. (2023) · International Journal of Epidemiology · doi:10.1093/ije/dyad079 · Cited by 37
“More information on these models is contained in previous publications.(18,19) Using individual-level data on 72 932 individuals from 32 351 sibships of European ancestry from UK Biobank (n1⁄4 40 734) and HUNT (n1⁄432 198) we estimated the association between measured educational attainment and outcomes (BMI, pack yea…”
Self-citationInfluence of autozygosity on common disease risk across the phenotypic spectrum
Malawsky, D. S., van Walree, E. S., Jacobs, B. M., Heng, T. H., Huang, Q., Sabir, A. H., Rahman, S., Sharif, S. M., Khan, A., Mirkov, M. U., et al. (2023) · Cell · doi:10.1016/j.cell.2023.08.028 · Cited by 39
“This complementary approach exploits variation in FROH within nuclear families, which eliminates confounding due to population structure.(9,31,32) Confirming the results in Figure 3, we found no significant association (p > 0.”
The inheritance of social status: England, 1600 to 2022
Clark, G. (2023) · Proceedings of the National Academy of Sciences · doi:10.1073/pnas.2300926120 · Cited by 43
The importance of family-based sampling for biobanks
Davies, N. M., Hemani, G., Neiderhiser, J. M., Martin, H. C., Mills, M. C., Visscher, P. M., Yengo, L., Young, A. I., & Keller, M. C. (2024) · Nature · doi:10.1038/s41586-024-07721-5 · Cited by 34
“Similarly, family-based GWAS 29 data enable researchers to determine the degree to which estimated genetic correlations reflect shared direct genetic effects (pleiotropy) instead of confounding factors, including from the correlations between genetic variants induced by cross-trait assortative…”
InfluentialSelf-citationExamining the Lancet Commission risk factors for dementia using Mendelian randomisation
Desai, R., John, A., Saunders, R., Marchant, N. L., Buckman, J. E. J., Charlesworth, G. M., Zuber, V., & Stott, J. C. H. (2023) · BMJ Mental Health · doi:10.1136/bmjment-2022-300555 · Cited by 35
“18 This uncontrolled genetic variation can lead to a potential bias in the estimate of the direct effect between genetic variants and the phenotype in question.”
BackgroundConcerns about the use of polygenic embryo screening for psychiatric and cognitive traits
Lencz, T., Sabatello, M., Docherty, A. R., Peterson, R. E., Soda, T., Austin, J., Bierut, L. J., Crepaz‐Keay, D., Curtis, D., Degenhardt, F., et al. (2022) · The Lancet Psychiatry · doi:10.1016/s2215-0366(22)00157-2 · Cited by 39
Estimation of indirect genetic effects and heritability under assortative mating
Young, A. S. (2023) · doi:10.1101/2023.07.10.548458 · Cited by 32
Genetic associations between non-cognitive skills and academic achievement over development
Malanchini, M., Allegrini, A. G., Nivard, M. G., Biroli, P., Rimfeld, K., Cheesman, R., von Stumm, S., Demange, P., van Bergen, E., Grotzinger, A. D., et al. (2024) · Nature Human Behaviour · doi:10.1038/s41562-024-01967-9 · Cited by 53
Self-citationRare genetic variants explain missing heritability in smoking
Jang, S.-K., Evans, L. M., Fialkowski, A., Arnett, D. K., Ashley‐Koch, A. E., Barnes, K. C., Becker, D. M., Bis, J. C., Blangero, J., Bleecker, E. R., et al. (2022) · Nature Human Behaviour · doi:10.1038/s41562-022-01408-5 · Cited by 29
Self-citationA comparison of the genes and genesets identified by GWAS and EWAS of fifteen complex traits
Battram, T., Gaunt, T. R., Relton, C. L., Timpson, N. J., & Hemani, G. (2022) · Nature Communications · doi:10.1038/s41467-022-35037-3 · Cited by 35
“…to confounding due to various population phenomena such as population strati fi cation or dynastic effects 18 , but statistical adjustments are routinely applied to address this, and confounding is unlikely to be affecting a majority of GWAS signals, especially for clinical traits 19,20 .”
Self-citationDarrous, L., Hemani, G., Smith, G. D., & Kutalik, Z. (2024) · Nature Communications · doi:10.1038/s41467-024-45655-8 · Cited by 29
“In Howe et al.(2022) [18] , within-sibship (within-family) meta-analysed GWAS estimates were generated from 178,086 siblings across 19 cohorts.”
BackgroundMethodInfluentialSelf-citationMcAdams, T. A., Cheesman, R., & Ahmadzadeh, Y. I. (2022) · Journal of Child Psychology and Psychiatry · doi:10.1111/jcpp.13720 · Cited by 38
Self-citationTime Spent Outdoors Partly Accounts for the Effect of Education on Myopia
Clark, R., Kneepkens, S. C. M., Plotnikov, D., Shah, R. L., Huang, Y., Tideman, J. W. L., Klaver, C. C. W., Atan, D., Williams, C., & Guggenheim, J. A. (2023) · Investigative Ophthalmology & Visual Science · doi:10.1167/iovs.64.14.38 · Cited by 30
“…spent in full-time education (EduYears) performed in a sample of 128,777 adult siblings of European ancestry by the Within Family GWAS Consortium 33 were obtained from the UK Medical Research Council Integrative Epidemiology Unit (IEU) online database maintained by the University of Bristol…”
MethodInfluentialEVALUATING THE CAUSAL RELATIONSHIP BETWEEN EDUCATIONAL ATTAINMENT AND MENTAL HEALTH
Demange, P., Boomsma, D. I., van Bergen, E., & Nivard, M. G. (2023) · European Neuropsychopharmacology · doi:10.1016/j.euroneuro.2023.08.044 · Cited by 28
Self-citationHughes, A., Sanderson, E. C. M., Morris, T., Ayorech, Z., Tesli, M., Ask, H., Reichborn‐Kjennerud, T., Andreassen, O. A., Magnus, P. M., Helgeland, Ø., et al. (2022) · eLife · doi:10.7554/elife.74320 · Cited by 32
“Recent work has suggested that these biases may be especially pronounced for complex social and behavioural phenotypes ( Brumpton et al., 2020 ; Howe et al., 2022 ).”
Self-citationThe collaborative study on the genetics of alcoholism: Genetics
Johnson, E. C., Salvatore, J. E., Lai, D., Merikangas, A. K., Nürnberger, J. I., Tischfield, J. A., Xuei, X., Kamarajan, C., Wetherill, L. F., Collaborators, C., et al. (2023) · Genes Brain & Behavior · doi:10.1111/gbb.12856 · Cited by 28
The MedlinePlus public user interface: studies of design challenges and opportunities.
Marill, J. L., Miller, N., & Kitendaugh, P. (2006) · Europe PMC (PubMed Central) · Cited by 28
Causal interpretations of family GWAS in the presence of heterogeneous effects
Veller, C., Przeworski, M., & Coop, G. (2024) · Proceedings of the National Academy of Sciences · doi:10.1073/pnas.2401379121 · Cited by 27
Qin, J., Zhang, L., Ke, B., Liu, T., Kong, C., & Jin, C. (2023) · Frontiers in Immunology · doi:10.3389/fimmu.2023.1248325 · Cited by 28
“Furthermore, to validate the causal relationship between CRP and IgAV, we obtained another cohort with 20 623 European individuals containing 8.0 million SNPs (29).”
InfluentialMeijsen, J. J., Hu, K., Krebs, M. D., Athanasiadis, G. I., Washbrook, S., Zetterberg, R., Silva, R. N. A. E., Shorter, J. R., Gådin, J. R., Bergstedt, J., et al. (2024) · Nature Communications · doi:10.1038/s41467-024-49507-3 · Cited by 24
“…and of control participants recruited among overly healthy subjects, and thus, they are genuinely unrepresentative of the background population 16 ; second, the current examples deal with speci fi c disorders, and different populations and methods, but a systematic analysis for a large…”
BackgroundSelf-citationHuang, Y., Wang, J., Yang, H., Lin, Z., & Xu, L. (2022) · American Journal of Clinical Nutrition · doi:10.1016/j.ajcnut.2022.11.010 · Cited by 24
Why we need families in genomic research on developmental psychopathology
Cheesman, R., Ayorech, Z., Eilertsen, E. M., & Ystrøm, E. (2023) · JCPP Advances · doi:10.1002/jcv2.12138 · Cited by 25
Self-citationTwin modelling reveals partly distinct genetic pathways to music enjoyment
Bignardi, G., Wesseldijk, L. W., Herrero, E. M., Zatorre, R. J., Ullén, F., Fisher, S. E., & Mosing, M. A. (2025) · Nature Communications · doi:10.1038/s41467-025-58123-8 · Cited by 29
“…efforts to better understand the genetic architecture of complex traits focus on deconstructing indirect sources of heritability, which in fl ate estimates of genetic effects and confound the possible inferences that can be obtained from downstream analysis of genome-wide-derived estimates 60 – 62 .”
Celebrating a Century of Research in Behavioral Genetics
Plomin, R. J. (2023) · Behavior Genetics · doi:10.1007/s10519-023-10132-3 · Cited by 32
“…investigate genetic influence in samples of unrelated individuals, combining GWA genotypes with traditional quantitative genetic designs has also enriched causal modeling (McAdams et al. 2022), for example, by comparing results within and between families (Brumpton et al. 2020; Howe et al. 2022).”
ResultSelf-citationCausal association of leisure sedentary behavior with arthritis: A Mendelian randomization analysis
Cao, Z., Li, Q., Li, Y., & Wu, J. (2023) · Seminars in Arthritis and Rheumatism · doi:10.1016/j.semarthrit.2023.152171 · Cited by 25
Silventoinen, K., Piirtola, M., Jelenkovic, A., Sund, R., Tárnoki, Á. D., Tárnoki, D. L., Medda, E., Nisticò, L., Toccaceli, V., Honda, C., et al. (2022) · Scientific Reports · doi:10.1038/s41598-022-17536-x · Cited by 24
Self-citationAdams, M. J., Thorp, J. G., Jermy, B. S., Kwong, A. S. F., Kõiv, K., Grotzinger, A. D., Nivard, M. G., Marshall, S., Milaneschi, Y., Baune, B. T., et al. (2024) · Psychological Medicine · doi:10.1017/s0033291724001880 · Cited by 31
“…with Appetite / weight increase have primarily come up in GWAS of body mass index and related traits (Elsworth et al., 2020; Hoffmann et al., 2018; Howe et al., 2022; Yengo et al., 2018) but another SNP in the FTO gene has also been associated with atypical subtypes (Milaneschi et al., 2014).”
BackgroundSelf-citationGustavson, D. E., Morrison, C. L., Mallard, T. T., Jennings, M. V., Fontanillas, P., Elson, S. L., Palmer, A. A., Friedman, N. P., & Sanchez‐Roige, S. (2023) · Clinical Psychological Science · doi:10.1177/21677026231207845 · Cited by 24
“…such as 23andMe, that generally represent older participants with higher socioeconomic status than the general population (Sanchez-Roige et al., 2019), which may introduce biases that are due to gene–environment correlations (Abdellaoui et al., 2022; Howe et al., 2022) and reduce generalizability.”
Self-citationAkimova, E. T., Wolfram, T., Ding, X., Tropf, F. C., & Mills, M. C. (2024) · Nature Human Behaviour · doi:10.1038/s41562-024-02076-3 · Cited by 37
“Notably, traits related to socioeconomic status or other non-clinical outcomes tend to exhibit considerable within-family effect reductions 45 , potentially affecting their practical utility 47 .”
InfluentialSelf-citationBrain structure, phenotypic and genetic correlates of reading performance
Carrión-Castillo, A., Paz‐Alonso, P. M., & Carreiras, M. (2023) · Nature Human Behaviour · doi:10.1038/s41562-023-01583-z · Cited by 26
Ghirardi, G., & Bernardi, F. (2025) · Social Science Research · doi:10.1016/j.ssresearch.2025.103174 · Cited by 28
Socio-economic status is a social construct with heritable components and genetic consequences
Abdellaoui, A., Martin, H. C., Kolk, M., Rutherford, A. D., Muthukrishna, M., Tropf, F. C., Mills, M. C., Zietsch, B. P., Verweij, K. J. H., & Visscher, P. M. (2025) · Nature Human Behaviour · doi:10.1038/s41562-025-02150-4 · Cited by 39
“Molecular genetic evidence shows that SES-related genetic effects and environmental influences cluster on both a family level 61,89,90 and a regional level 87,91 , resulting in systematic differences in these environmental exposures.”
Self-citationWoodward, J., & Kendler, K. S. (2023) · Philosophy of Medicine · doi:10.5195/pom.2023.156 · Cited by 22
The impact of reproductive factors on the metabolic profile of females from menarche to menopause
Clayton, G., Borges, M. C., & Lawlor, D. A. (2024) · Nature Communications · doi:10.1038/s41467-023-44459-6 · Cited by 24
Self-citationBenonisdottir, S., Straub, V. J., Kong, A., & Mills, M. C. (2024) · Nature Aging · doi:10.1038/s43587-024-00733-w · Cited by 23
“One study comparing population (between-family) within-sibship (within-family) GWAS estimates for age at first birth and number of children in turn found that estimates were attenuated by 52% and 67%, respectively 97 .”
Self-citationYao, T., Wu, Z., Wang, Z., Chen, L., Liu, B., Lu, M., & Shen, N. (2023) · Frontiers in Pharmacology · doi:10.3389/fphar.2023.1267924 · Cited by 20
“007), (Howe et al., 2022), implying that the genetic variation associated with ACE inhibition could be used to mimic the effect of ACEIs.”
BackgroundFrach, L., Barkhuizen, W., Allegrini, A. G., Ask, H., Hannigan, L. J., Corfield, E. C., Andreassen, O. A., Dudbridge, F., Ystrøm, E., Havdahl, A., et al. (2024) · Molecular Psychiatry · doi:10.1038/s41380-023-02383-7 · Cited by 21
“This differs from studies focusing on behavioural outcomes such as smoking or education, which found that associations with polygenic scores substantially decrease in magnitude when adjusting for polygenic scores of related individuals [28, 40, 73].”
BackgroundSelf-citationNivard, M. G., Belsky, D. W., Harden, K. P., Baier, T., Andreassen, O. A., Ystrøm, E., van Bergen, E., & Lyngstad, T. H. (2022) · doi:10.31234/osf.io/bhpm5 · Cited by 20
Self-citationSocial-Science Genomics: Progress, Challenges, and Future Directions
Benjamin, D., Cesarini, D., Turley, P., & Young, A. S. (2024) · doi:10.3386/w32404 · Cited by 20
Self-citationGenetic architecture reconciles linkage and association studies of complex traits
Sidorenko, J., Couvy‐Duchesne, B., Kemper, K. E., Moen, G.-H., Bhatta, L., Åsvold, B. O., Mägi, R., Ani, A., Wang, R., Nolte, I. M., et al. (2024) · Nature Genetics · doi:10.1038/s41588-024-01940-2 · Cited by 19
“The imputation panel and the number of SNPs used in PGS calculations are reported in Supplementary Table 17 and the amount of variance explained by the PGS in each cohort is shown in Table 2.”
Self-citationDirect and indirect genetic effects on early neurodevelopmental traits
Hegemann, L., Eilertsen, E. M., Pettersen, J. H., Corfield, E. C., Cheesman, R., Frach, L., Bjørndal, L. D., Ask, H., Pourcain, B. S., Havdahl, A., et al. (2025) · Journal of Child Psychology and Psychiatry · doi:10.1111/jcpp.14122 · Cited by 20
“Future versions of scores used here based on more progressed GWAS will likely capture a larger proportion of these effects.”
InfluentialSelf-citationAndreu-Bernabeu, Á., González‐Peñas, J., Arango, C., & Díaz‐Caneja, C. M. (2023) · BMJ Mental Health · doi:10.1136/bmjment-2023-300821 · Cited by 19
“47 68–71 There is also a limitation in the characterisation of complex phenotypes such as intelligence or income in the GWAS studies.”
Trauma Matters: Integrating Genetic and Environmental Components of PTSD
Marchese, S., & Huckins, L. M. (2022) · Advanced Genetics · doi:10.1002/ggn2.202200017 · Cited by 21
Overcoming attenuation bias in regressions using polygenic indices
van Kippersluis, H., Biroli, P., Pereira, R. D., Galama, T. J., von Hinke, S., Meddens, S. F. W., Muslimova, D., Slob, E. A. W., de Vlaming, R., & Rietveld, C. A. (2023) · Nature Communications · doi:10.1038/s41467-023-40069-4 · Cited by 25
Wang, J., Li, M., Zhang, Z., Duan, Y., Zhang, Z., Liu, H., Yang, K., & Liu, J. (2025) · The Journal of Headache and Pain · doi:10.1186/s10194-025-02026-y · Cited by 20
“The GWAS summary data for depression in the forward MR analysis were obtained from The Within-family Consortium ( h t t p s : / / w w w . w i t h i n f a m i l y c o n s o r t i u m . c o m /), c o m p r i s i n g 47,517 samples [23].”
The next 10 years of behavioural genomic research
Plomin, R. J. (2022) · JCPP Advances · doi:10.1002/jcv2.12112 · Cited by 19
Self-citationChronic Pain, Analgesics, and Cognitive Status: A Comprehensive Mendelian Randomization Study
Guo, X., Hou, C., Tang, P., & Li, R. (2023) · Anesthesia & Analgesia · doi:10.1213/ane.0000000000006514 · Cited by 17
Lahtinen, H., Korhonen, K., Martikainen, P., & Morris, T. (2023) · Demography · doi:10.1215/00703370-10963788 · Cited by 19
“When com par ing con-ven tional and within-sibship esti ma tes, Howe et al. (2022) observed 47% shrink age of the esti mate between edu ca tion PGI and achieved edu ca tion.”
Self-citationGene-environment correlation: the role of family environment in academic development
Zhou, Q., Gidziela, A., Allegrini, A. G., Cheesman, R., Wertz, J., Maxwell, J. M., Plomin, R. J., Rimfeld, K., & Malanchini, M. (2024) · Molecular Psychiatry · doi:10.1038/s41380-024-02716-0 · Cited by 27
“Lastly, as new methodologies to partition between-family from within-family genetic effects emerge (78), we aim to extend our work and continue triangulating evidence across multiple methods.”
MethodSelf-citationSchwaba, T., Sullivan, M. L. C., Akingbuwa, W. A., Ilves, K., Tanksley, P. T., Williams, C. M., Dragostinov, Y., Liao, W., Ackerman, L. S., Fealy, J. C. M., et al. (2025) · bioRxiv (Cold Spring Harbor Laboratory) · doi:10.1101/2025.05.16.648988 · Cited by 17
“…= 31,544-50,725 across traits) that ascertained genetic data among family members using best-practices quality control (Tan et al., 2024), and we combined this with published within-family GWAS estimates of Neuroticism (Howe et al., 2022) ( Supplementary Table S41 ; Supplementary Figures S39-S43 ).”
InfluentialSelf-citationLoughnan, R. J., Palmer, C. E., Thompson, W. K., Dale, A. M., Jernigan, T. L., & Fan, C. C. (2023) · Psychological Science · doi:10.1177/09567976231160702 · Cited by 35
BURT, C. H. (2024) · Sociological Methodology · doi:10.1177/00811750241236482 · Cited by 17
Genetic causal role of body mass index in multiple neurological diseases
Xie, W., Chen, H., Chang, Z., Zhang, J., & Xie, D. (2024) · Scientific Reports · doi:10.1038/s41598-024-57260-2 · Cited by 16
“Data on BMI indicators were sourced from the IEU database, which contains genome-wide association summary data 28,29 (available at https:// gwas. mrcieu. ac. uk/ datas ets/ ieu-b-4816/).”
MethodMaternal depression and the polygenic p factor: A family perspective on direct and indirect effects
Ayorech, Z., Cheesman, R., Eilertsen, E. M., Bjørndal, L. D., Røysamb, E., McAdams, T. A., Havdahl, A., & Ystrøm, E. (2023) · Journal of Affective Disorders · doi:10.1016/j.jad.2023.03.043 · Cited by 14
“For example when a GWAS for depression was conducted both between families (standard approach with unrelated individuals) and within-families (using siblings), an up to 50 % shrinkage in effect size estimates was observed (Howe et al., 2022).”
MethodSelf-citationGenetic and neural bases of the neuroticism general factor
Kim, Y., Saunders, G., Giannelis, A., Willoughby, E. A., DeYoung, C. G., & Lee, J. J. (2023) · Biological Psychology · doi:10.1016/j.biopsycho.2023.108692 · Cited by 15
Self-citationChen, Y., Peng, W., Pang, M., Zhu, B., Liu, H., Hu, D., Luo, Y., Wang, S., Wu, S., He, J., et al. (2024) · Frontiers in Public Health · doi:10.3389/fpubh.2024.1306150 · Cited by 16
Young, A. S. (2024) · PLOS Biology · doi:10.1371/journal.pbio.3002568 · Cited by 14
Lu, T., Chen, Y., Yoshiji, S., Ilboudo, Y., Forgetta, V., Zhou, S., & Greenwood, C. M. T. (2024) · Biological Psychiatry · doi:10.1016/j.biopsych.2024.04.016 · Cited by 15
The Economics and Econometrics of Gene–Environment Interplay
Biroli, P., Galama, T. J., von Hinke, S., van Kippersluis, H., Rietveld, C. A., & Thom, K. (2025) · The Review of Economic Studies · doi:10.1093/restud/rdaf034 · Cited by 19
“An alternative strategy to establish causal genetic effects in the GWAS stage is to use a sample of sibling pairs and to run a sibling GWAS by including family fixed effects (Howe et al. , 2022).”
Wright, L., Shireby, G. L., Morris, T., Davies, N. M., & Bann, D. (2025) · PLoS Genetics · doi:10.1371/journal.pgen.1011775 · Cited by 16
Self-citationAspirin Use and Risk of Alzheimer’s Disease: A 2-Sample Mendelian Randomization Study
Ding, P., Gorenflo, M. P., Zhu, X., & Xu, R. (2023) · Journal of Alzheimer s Disease · doi:10.3233/jad-220787 · Cited by 14
Birth order differences in education originate in postnatal environments
Isungset, M. A., Jeremy Freese, A., Andreassen, O. A., & Lyngstad, T. H. (2022) · PNAS Nexus · doi:10.1093/pnasnexus/pgac051 · Cited by 15
“” Recent enthusiasm for using sibling-based GWAS to purge GWAS studies of indirect genetic effects assumes that these indirect genetic effects are primarily due to parents (59).”
BackgroundSelf-citationSocio-cultural practices may have affected sex differences in stature in Early Neolithic Europe
Cox, S. L., Nicklisch, N., Francken, M., Wahl, J., Meller, H., Haak, W., Alt, K. W., Rosenstock, E., & Mathieson, I. (2023) · Nature Human Behaviour · doi:10.1038/s41562-023-01756-w · Cited by 17
“This may indicate uncorrected population stratification in the non-sibling GWAS 24,25 .”
InfluentialGenetic Correlates of Treatment-Resistant Depression
Xu, B., Forthman, K. L., Kuplicki, R., Ahern, J., Loughnan, R. J., Naber, F., Thompson, W. K., Nemeroff, C. B., Paulus, M. P., & Fan, C. C. (2025) · JAMA Psychiatry · doi:10.1001/jamapsychiatry.2024.4825 · Cited by 20
Family-based genome-wide association study designs for increased power and robustness
Guan, J., Tan, T., Nehzati, S. M., Bennett, M., Turley, P., Benjamin, D. J., & Young, A. I. (2025) · Nature Genetics · doi:10.1038/s41588-025-02118-0 · Cited by 15
“…13–16 ; (2) biased inferences from Mendelian randomization 17 ; (3) bias in polygenic indices (PGIs, also called polygenic scores) that may contribute to the drop in predictive accuracy when predicting across genetic ancestries 18 ; and (4) biased inferences of natural selection 9,16,19 .”
InfluentialSelf-citationDixon, P., Harrison, S., Hollingworth, W., Davies, N. M., & Smith, G. D. (2022) · Economics & Human Biology · doi:10.1016/j.ehb.2022.101154 · Cited by 13
Self-citation
Metadata
- Authors
- Howe, L. J., Nivard, M. G., Morris, T. T., Hansen, A. F., Rasheed, H., Cho, Y., Chittoor, G., Ahlskog, R., Lind, P. A., Palviainen, T., van der Zee, M. D., Cheesman, R., Mangino, M., Wang, Y., Li, S., Klaric, L., Ratliff, S. M., Bielak, L. F., Nygaard, M., Giannelis, A., Willoughby, E. A., Reynolds, C. A., Balbona, J. V., Andreassen, O. A., Ask, H., Baras, A., Bauer, C. R., Boomsma, D. I., Campbell, A., Campbell, H., Chen, Z., Christofidou, P., Corfield, E., Dahm, C. C., Dokuru, D. R., Evans, L. M., de Geus, E. J. C., Giddaluru, S., Gordon, S. D., Harden, K. P., Hill, W. D., Hughes, A., Kerr, S. M., Kim, Y., Kweon, H., Latvala, A., Lawlor, D. A., Li, L., Lin, K., Magnus, P., Magnusson, P. K. E., Mallard, T. T., Martikainen, P., Mills, M. C., Njølstad, P. R., Overton, J. D., Pedersen, N. L., Porteous, D. J., Reid, J., Silventoinen, K., Southey, M. C., Stoltenberg, C., Tucker-Drob, E. M., Wright, M. J., Social Science Genetic Association Consortium, Kweon, H., Koellinger, P. D., Benjamin, D. J., Turley, P., Within Family Consortium, Howe, L. J., Nivard, M. G., Morris, T. T., Hansen, A. F., Rasheed, H., Cho, Y., Chittoor, G., Ahlskog, R., Lind, P. A., Palviainen, T., van der Zee, M. D., Cheesman, R., Mangino, M., Wang, Y., Li, S., Klaric, L., Ratliff, S. M., Bielak, L. F., Nygaard, M., Giannelis, A., Willoughby, E. A., Reynolds, C. A., Balbona, J. V., Andreassen, O. A., Ask, H., Boomsma, D. I., Campbell, A., Campbell, H., Chen, Z., Christofidou, P., Corfield, E., Dahm, C. C., Dokuru, D. R., Evans, L. M., de Geus, E. J. C., Giddaluru, S., Gordon, S. D., Harden, K. P., Hill, W. D., Hughes, A., Kerr, S. M., Kim, Y., Latvala, A., Lawlor, D. A., Li, L., Lin, K., Magnus, P., Magnusson, P. K. E., Mallard, T. T., Martikainen, P., Mills, M. C., Njølstad, P. R., Pedersen, N. L., Porteous, D. J., Silventoinen, K., Southey, M. C., Stoltenberg, C., Tucker-Drob, E. M., Wright, M. J., Hewitt, J. K., Keller, M. C., Stallings, M. C., Lee, J. J., Christensen, K., Kardia, S. L. R., Peyser, P. A., Smith, J. A., Wilson, J. F., Hopper, J. L., Hägg, S., Spector, T. D., Pingault, J.-B., Plomin, R., Havdahl, A., Bartels, M., Martin, N. G., Oskarsson, S., Justice, A. E., Millwood, I. Y., Hveem, K., Naess, Ø., Willer, C. J., Åsvold, B. O., Kaprio, J., Medland, S. E., Walters, R. G., Evans, D. M., Smith, G. D., Hayward, C., Brumpton, B., Hemani, G., Davies, N. M., Hewitt, J. K., Keller, M. C., Stallings, M. C., Lee, J. J., Christensen, K., Kardia, S. L. R., Peyser, P. A., Smith, J. A., Wilson, J. F., Hopper, J. L., Hägg, S., Spector, T. D., Pingault, J.-B., Plomin, R., Havdahl, A., Bartels, M., Martin, N. G., Oskarsson, S., Justice, A. E., Millwood, I. Y., Hveem, K., Naess, Ø., Willer, C. J., Åsvold, B. O., Koellinger, P. D., Kaprio, J., Medland, S. E., Walters, R. G., Benjamin, D. J., Turley, P., Evans, D. M., Davey Smith, G., Hayward, C., Brumpton, B., Hemani, G., & Davies, N. M.
- Affiliations
- Regeneron (United States) (US)
- Geisinger Health System (US)
- Venue
- Nature Genetics
- Published
- 2022-05
- Volume
- 54
- Issue
- 5
- Pages
- 581-592
- ISSN
- 1061-4036 (ISSN-L)
- 1546-1718
- PMC
- PMC9110300
- OpenAlex
- W4229455035
- Semantic Scholar
- fd882733399892e67d8bbc69a36844797ffc0aec
- Cited by
- 377
- References
- 59
- Citations by year
- 2026: 69 · 2025: 88 · 2024: 102 · 2023: 81 · 2022: 34
- FWCI
- 46.80
- Type
- journal article
- Language
- en
- Open access
- hybrid
- doi.org
- Locations
- Nature Genetics (publishedVersion, cc-by)
- PubMed Central (publishedVersion, cc-by)
- PubMed (publishedVersion)
- Explore Bristol Research (publishedVersion, cc-by)
- VU Research Portal (publishedVersion, other-oa)
- Edinburgh Research Explorer (University of Edinburgh) (submittedVersion, cc-by)
- KTH Publication Database DiVA (KTH Royal Institute of Technology) (submittedVersion, other-oa)
- NORA - Norwegian Open Research Archives (submittedVersion, other-oa)
- UCL Discovery (University College London) (submittedVersion)
- eScholarship (California Digital Library) (submittedVersion, cc-by)
- Työväentutkimus Vuosikirja (submittedVersion)
- Minerva Access (University of Melbourne) (submittedVersion, cc-by)
- Research Portal (King's College London) (submittedVersion, other-oa)
- Bristol Research (University of Bristol) (submittedVersion, cc-by)
- University of Southern Denmark Research Portal (University of Southern Denmark) (submittedVersion, cc-by)
- NORA - Norwegian Open Research Archives (submittedVersion, cc-by)
- Apollo (University of Cambridge) (submittedVersion, cc-by)
- Data Archiving and Networked Services (DANS) (submittedVersion, other-oa)
- Apollo
- Apollo (cc-by)
- Funders
- RCUK | Medical Research Council (MC_UU_00011)
- Jacobs Foundation
- RCUK | MRC | Medical Research Foundation (MC_UU_00011)
- Topics
- Life Sciences › Biochemistry, Genetics and Molecular Biology › Genetics › Genetic Associations and Epidemiology
- Life Sciences › Biochemistry, Genetics and Molecular Biology › Genetics › Genetic and phenotypic traits in livestock
- Life Sciences › Biochemistry, Genetics and Molecular Biology › Genetics › Genetic Mapping and Diversity in Plants and Animals
- Keywords
- direct genetic effects, indirect genetic effects, population stratification, assortative mating, heritability, genetic correlation, polygenic adaptation, height, educational attainment, age at first birth, number of children, cognitive ability, depressive symptoms, smoking, body mass index, LDL cholesterol, Mendelian randomization
- MeSH terms
- Humans, Phenotype, Multifactorial Inheritance, Polymorphism, Single Nucleotide, Genome-Wide Association Study, Mendelian Randomization Analysis
About these checks
Registry, retraction, Cites and statistics results are computed, not judged, with one exception: a printed reference that no index lists is read once by a model before it counts as a citation error. Claims are extracted by a model and kept only when their quote appears verbatim in the text; each cited source is then checked, with a model’s help, for whether it says what the claim relies on. Those verdicts can be wrong — read the claim’s quote and the cited source before relying on one.
A language model drew the claims from the paper on 2026-10-29, under version 3 of the claim definition (model deepseek-v4.1-flash, prompt extract-v3).
A second model labelled each claim on 2026-10-29 (model jev-1.13-20260917, definition revision gold-guideline-v0.2).
Cited sources are checked with a language model’s help (gpt-6-sol).
Statistics and arithmetic are recomputed, not judged.
Confidence bands are shown only for fields calibrated on our annotated test set. None is calibrated yet, so no band is shown.
What counts as a claim ›How we measure confidence ›How we check this ›
Are you an author, or do you see a problem with this page? Request a review
