

The DOI matches its Crossref record; 69 of the 69 references it cites were found in a registry or an index.
Cross talk between microRNA and epigenetic regulation in adult neurogenesis
Open accessAbstract
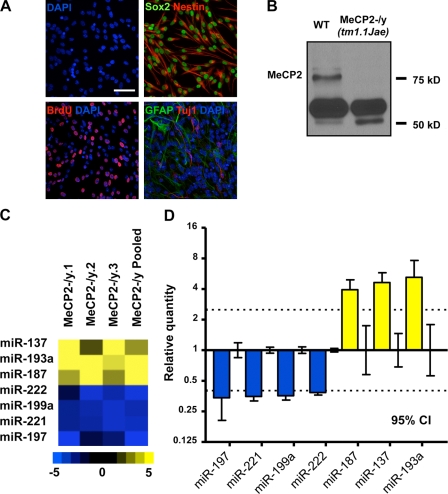
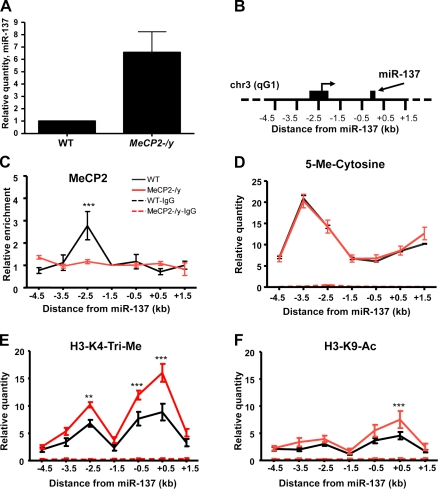
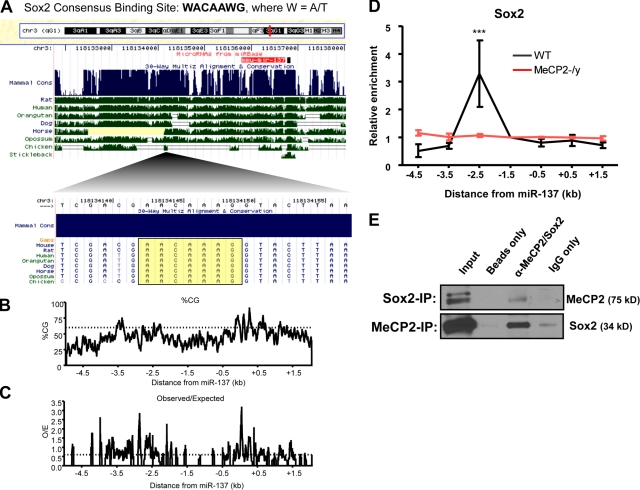
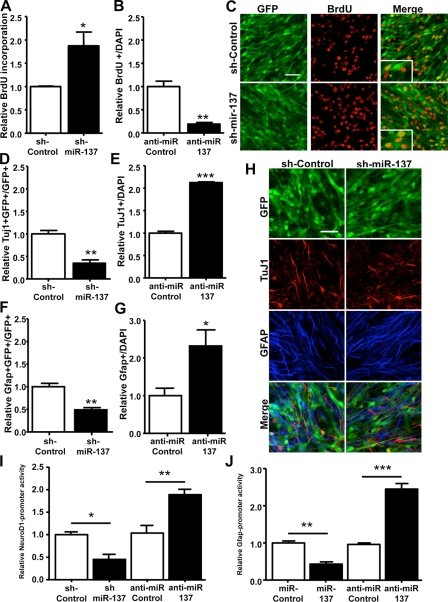
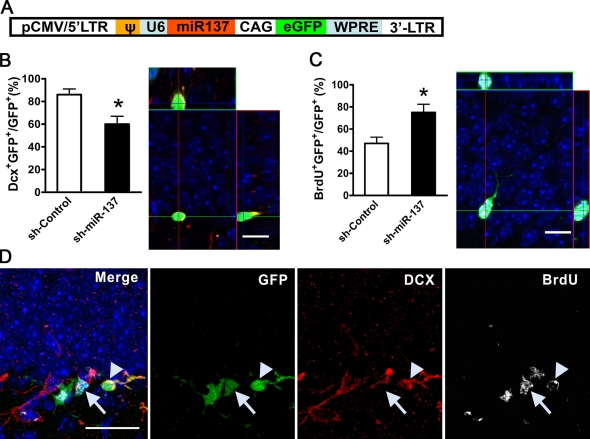
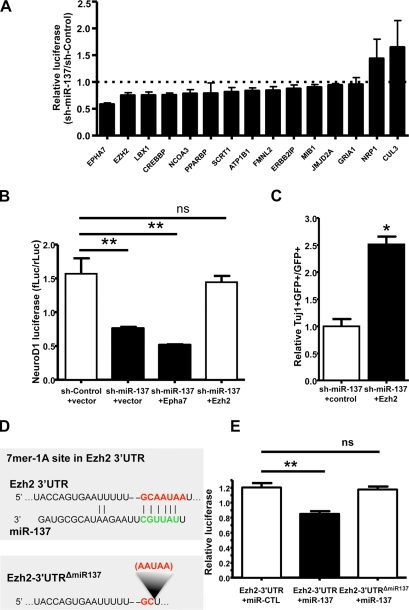
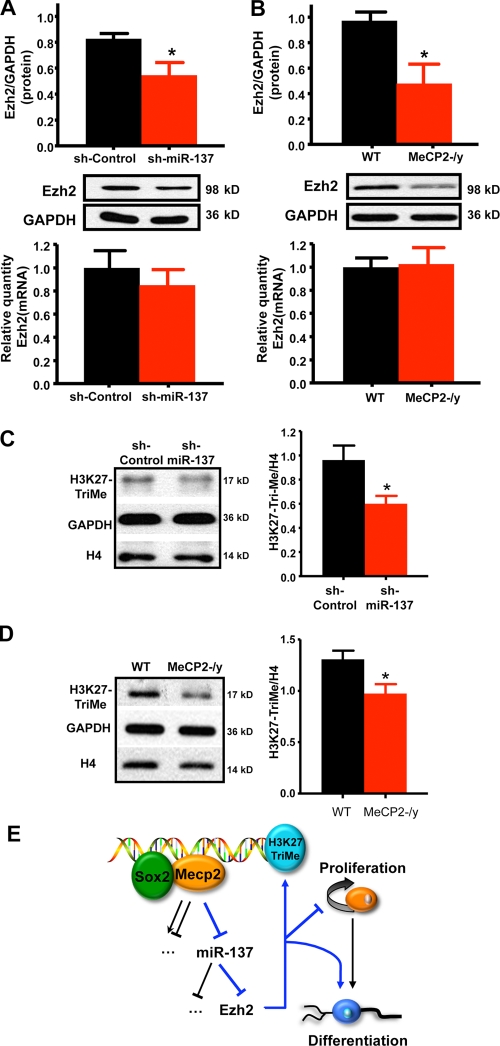
Both microRNAs (miRNAs) and epigenetic regulation have important functions in stem cell biology, although the interactions between these two pathways are not well understood. Here, we show that MeCP2, a DNA methyl-CpG–binding protein, can epigenetically regulate specific miRNAs in adult neural stem cells (aNSCs). MeCP2-mediated epigenetic regulation of one such miRNA, miR-137, involves coregulation by Sox2, a core transcription factor in stem cells. miR-137 modulates the proliferation and differentiation of aNSCs in vitro and in vivo. Overexpression of miR-137 promotes the proliferation of aNSCs, whereas a reduction of miR-137 enhances aNSC differentiation. We further show that miR-137 post-transcriptionally represses the expression of Ezh2, a histone methyltransferase and Polycomb group (PcG) protein. The miR-137–mediated repression of Ezh2 feeds back to chromatin, resulting in a global decrease in histone H3 trimethyl lysine 27. Coexpression of Ezh2 can rescue phenotypes associated with miR-137 overexpression. These results demonstrate that cross talk between miRNA and epigenetic regulation contributes to the modulation of adult neurogenesis.
Overview
The claims and statistics of this paper haven’t been checked yet.
Run the check — free, no account needed. It reads the open-access text and checks the sources it cites.
Integrity signals
Registry
Cites
Statistics
Figures
Verification
Claims the paper makes
The claims and statistics of this paper haven’t been checked yet.
Run the check — free, no account needed. It reads the open-access text and checks the sources it cites.
Claims other papers make about this one
Each is checked against this paper’s own text: does it say what the citing paper says it does?
In the citing paper
“miR-137 is a key regulator of neuronal development with roles in neurogenesis and maturation 64,65 and is highly expressed at synapses in the cortex and hippocampus. 66”
From Genetic architectures of psychiatric disorders: the emerging picture and its implications (2012) · cites this paper as [65]
Self-check
Percentages, sums and reported differences re-computed from the paper’s own numbers.
The self-check needs the paper’s full text.
Citations
Cites
Analysis of Relative Gene Expression Data Using Real-Time Quantitative PCR and the 2−ΔΔCT Method
Livak, K. J., & Schmittgen, T. D. (2001) · Methods · doi:10.1006/meth.2001.1262 · Cited by 180,860
Bartel (2004) · doi:10.1016/s0092-8674(04)00045-5 · Cited by 34,714
DNA methylation patterns and epigenetic memory
Bird, A. (2002) · Genes & Development · doi:10.1101/gad.947102 · Cited by 7,124
Prediction of Mammalian MicroRNA Targets
Lewis, B. P., Shih, I.-H., Jones-Rhoades, M. W., Bartel, D. P., & Burge, C. B. (2003) · Cell · doi:10.1016/s0092-8674(03)01018-3 · Cited by 5,199
Rett syndrome is caused by mutations in X-linked MECP2, encoding methyl-CpG-binding protein 2
Amir, R. E., Van den Veyver, I. B., Wan, M., Tran, C. Q., Francke, U., & Zoghbi, H. Y. (1999) · Nature Genetics · doi:10.1038/13810 · Cited by 4,990
Combinatorial microRNA target predictions
Krek, A., Grün, D., Poy, M. N., Wolf, R., Rosenberg, L., Epstein, E. J., MacMenamin, P., da Piedade, I., Gunsalus, K. C., Stoffel, M., et al. (2005) · Nature Genetics · doi:10.1038/ng1536 · Cited by 4,603
Core Transcriptional Regulatory Circuitry in Human Embryonic Stem Cells
Boyer, L. A., Lee, T. I., Cole, M. F., Johnstone, S. E., Levine, S. S., Zucker, J. P., Guenther, M. G., Kumar, R. M., Murray, H. L., Jenner, R. G., et al. (2005) · Cell · doi:10.1016/j.cell.2005.08.020 · Cited by 4,505
John, B., Enright, A. J., Aravin, A., Tuschl, T., Sander, C., & Marks, D. S. (2004) · PLoS Biology · doi:10.1371/journal.pbio.0020363 · Cited by 3,796
The Transcriptional Landscape of the Mammalian Genome
Carninci, P., Kasukawa, T., Katayama, S., Gough, J., Frith, M. C., Maeda, N., Oyama, R., Ravasi, T., Lenhard, B., Wells, C. A., et al. (2005) · Science · doi:10.1126/science.1112014 · Cited by 3,492
Mechanisms and Functional Implications of Adult Neurogenesis
Zhao, C., Deng, W., & Gage, F. H. (2008) · Cell · doi:10.1016/j.cell.2008.01.033 · Cited by 3,007
Cited by
Sorted by citations
Genome-wide association study identifies five new schizophrenia loci
The Schizophrenia Psychiatric Genome-Wide Association Study (GWAS) Consortium (2011) · Nature Genetics · doi:10.1038/ng.940 · Cited by 1,919
Genome-wide association analysis identifies 13 new risk loci for schizophrenia
Multicenter Genetic Studies of Schizophrenia Consortium, Ripke, S., Psychosis Endophenotypes International Consortium, Wellcome Trust Case Control Consortium 2, O'Dushlaine, C., Chambert, K., Moran, J. L., Kähler, A. K., Akterin, S., Bergen, S. E., et al. (2013) · Nature Genetics · doi:10.1038/ng.2742 · Cited by 1,496
Genetic architectures of psychiatric disorders: the emerging picture and its implications
Sullivan, P. F., Daly, M. J., & O'Donovan, M. (2012) · Nature Reviews Genetics · doi:10.1038/nrg3240 · Cited by 1,177
Selective chemical labeling reveals the genome-wide distribution of 5-hydroxymethylcytosine
Song, C., Szulwach, K. E., Fu, Y., Dai, Q., Yi, C., Li, X., Li, Y., Chen, C.-H., Zhang, W., Jian, X., et al. (2010) · Nature Biotechnology · doi:10.1038/nbt.1732 · Cited by 1,094
Self-citation5-hmC–mediated epigenetic dynamics during postnatal neurodevelopment and aging
Szulwach, K. E., Li, X., Li, Y., Song, C., Wu, H., Dai, Q., Irier, H. A., Upadhyay, A. K., Gearing, M., Levey, A. I., et al. (2011) · Nature Neuroscience · doi:10.1038/nn.2959 · Cited by 843
Self-citationAdult Mammalian Neural Stem Cells and Neurogenesis: Five Decades Later
Bond, A. M., Ming, G.-L., & Song, H. (2015) · Cell Stem Cell · doi:10.1016/j.stem.2015.09.003 · Cited by 791
“In addition, the blood-brain barrier is leaky near clusters of proliferating NSCs, which would allow these cells to more easily access factors in the blood (Tavazoie et al., 2008).”
BackgroundThe role of adult hippocampal neurogenesis in brain health and disease
Toda, T., Parylak, S. L., Linker, S. B., & Gage, F. H. (2019) · Molecular Psychiatry · doi:10.1038/s41380-018-0036-2 · Cited by 719
Aberrant Epigenetic Landscape in Cancer: How Cellular Identity Goes Awry
Berdasco, M., & Esteller, M. (2010) · Developmental Cell · doi:10.1016/j.devcel.2010.10.005 · Cited by 651
Brites, D., & Fernandes, A. (2015) · Frontiers in Cellular Neuroscience · doi:10.3389/fncel.2015.00476 · Cited by 599
“However, there are controversial data on IL-1β alterations in periphery and CSF between depressed animals and patients.”
BackgroundThe Adult Ventricular–Subventricular Zone (V-SVZ) and Olfactory Bulb (OB) Neurogenesis
Lim, D. A., & Alvarez-Buylla, A. (2016) · Cold Spring Harbor Perspectives in Biology · doi:10.1101/cshperspect.a018820 · Cited by 571
MicroRNAs in neuronal function and dysfunction
Im, H.-I., & Kenny, P. J. (2012) · Trends in Neurosciences · doi:10.1016/j.tins.2012.01.004 · Cited by 399
MicroRNA miR-137 Regulates Neuronal Maturation by Targeting Ubiquitin Ligase Mind Bomb-1
Smrt, R. D., Szulwach, K. E., Pfeiffer, R. L., Li, X., Guo, W., Pathania, M., Teng, Z.-Q., Luo, Y., Peng, J., Bordey, A., et al. (2010) · Stem Cells · doi:10.1002/stem.431 · Cited by 404
Self-citationThe epigenetics of aging and neurodegeneration
Lardenoije, R., Iatrou, A., Kenis, G., Kompotis, K., Steinbusch, H. W. M., Mastroeni, D., Coleman, P., Lemere, C. A., Hof, P. R., van den Hove, D. L. A., et al. (2015) · Progress in Neurobiology · doi:10.1016/j.pneurobio.2015.05.002 · Cited by 381
Palma-Gudiel, H., Córdova-Palomera, A., Leza, J. C., & Fañanás, L. (2015) · Neuroscience & Biobehavioral Reviews · doi:10.1016/j.neubiorev.2015.05.016 · Cited by 347
Adult-specific functions of animal microRNAs
Sun, K., & Lai, E. C. (2013) · Nature Reviews Genetics · doi:10.1038/nrg3471 · Cited by 335
Signaling mechanisms regulating adult neural stem cells and neurogenesis
Faigle, R., & Song, H. (2012) · Biochimica et Biophysica Acta (BBA) - General Subjects · doi:10.1016/j.bbagen.2012.09.002 · Cited by 356
Epigenetic choreographers of neurogenesis in the adult mammalian brain
Ma, D. K., Marchetto, M. C., Guo, J. U., Ming, G., Gage, F. H., & Song, H. (2010) · Nature Neuroscience · doi:10.1038/nn.2672 · Cited by 340
The role of DNA methylation in stress-related psychiatric disorders
Klengel, T., Pape, J., Binder, E. B., & Mehta, D. (2014) · Neuropharmacology · doi:10.1016/j.neuropharm.2014.01.013 · Cited by 309
Miller, B. H., Zeier, Z., Xi, L., Lanz, T. A., Deng, S., Strathmann, J., Willoughby, D., Kenny, P. J., Elsworth, J. D., Lawrence, M. S., et al. (2012) · Proceedings of the National Academy of Sciences · doi:10.1073/pnas.1113793109 · Cited by 309
miR-137 forms a regulatory loop with nuclear receptor TLX and LSD1 in neural stem cells
Sun, G., Ye, P., Murai, K., Lang, M., Li, S., Zhang, H., Li, W., Fu, C., Yin, J., Wang, A., et al. (2011) · Nature Communications · doi:10.1038/ncomms1532 · Cited by 318
Self-citationBlood serum miRNA: Non-invasive biomarkers for Alzheimer's disease
Geekiyanage, H., Jicha, G. A., Nelson, P. T., & Chan, C. (2011) · Experimental Neurology · doi:10.1016/j.expneurol.2011.11.026 · Cited by 299
Determining the role of microRNAs in psychiatric disorders
Issler, O., & Chen, A. (2015) · Nature Reviews Neuroscience · doi:10.1038/nrn3879 · Cited by 309
Mellios, N., Feldman, D., Sheridan, S. D., Ip, J. P. K., Kwok, S., Amoah, S. K., Rosen, B. P., Rodriguez, B. A., Crawford, B., Swaminathan, R., et al. (2017) · Molecular Psychiatry · doi:10.1038/mp.2017.86 · Cited by 291
Self-citationMicroRNAs shape the neuronal landscape
McNeill, E., & Van Vactor, D. (2012) · Neuron · doi:10.1016/j.neuron.2012.07.005 · Cited by 274
DNA methylation and microRNA dysregulation in cancer
Suzuki, H., Maruyama, R., Yamamoto, E., & Kai, M. (2012) · Molecular Oncology · doi:10.1016/j.molonc.2012.07.007 · Cited by 280
Review: adult neurogenesis contributes to hippocampal plasticity
Toda, T., & Gage, F. H. (2017) · Cell and Tissue Research · doi:10.1007/s00441-017-2735-4 · Cited by 279
Cheng, T.-L., Wang, Z., Liao, Q., Zhu, Y., Zhou, W.-H., Xu, W., & Qiu, Z. (2014) · Developmental Cell · doi:10.1016/j.devcel.2014.01.032 · Cited by 270
Prefrontal cortical control of a brainstem social behavior circuit
Franklin, T. B., Silva, B. A., Perova, Z., Marrone, L., Masferrer, M. E., Zhan, Y., Kaplan, A., Greetham, L., Verrechia, V., Halman, A., et al. (2017) · Nature Neuroscience · doi:10.1038/nn.4470 · Cited by 231
Geekiyanage, H., & Chan, C. (2011) · The Journal of Neuroscience · doi:10.1523/jneurosci.3883-11.2011 · Cited by 254
Rett syndrome: insights into genetic, molecular and circuit mechanisms
Ip, J. P. K., Mellios, N., & Sur, M. (2018) · Nature reviews. Neuroscience · doi:10.1038/s41583-018-0006-3 · Cited by 256
An epigenetic framework for neurodevelopmental disorders: From pathogenesis to potential therapy
Millan, M. J. (2013) · Neuropharmacology · doi:10.1016/j.neuropharm.2012.11.015 · Cited by 229
The schizophrenia risk gene product miR-137 alters presynaptic plasticity
Siegert, S., Seo, J., Kwon, E. J., Rudenko, A., Cho, S., Wang, W., Flood, Z., Martorell, A. J., Ericsson, M., Mungenast, A. E., et al. (2015) · Nature Neuroscience · doi:10.1038/nn.4023 · Cited by 221
MicroRNA networks direct neuronal development and plasticity
Loohuis, N. F. M. O., Kos, A., Martens, G. J. M., van Bokhoven, H., Kasri, N. N., & Aschrafi, A. (2011) · Cellular and Molecular Life Sciences · doi:10.1007/s00018-011-0788-1 · Cited by 231
SOX2–LIN28/let-7 pathway regulates proliferation and neurogenesis in neural precursors
Cimadamore, F., Amador‐Arjona, A., Chen, C., Huang, C., & Terskikh, A. V. (2013) · Proceedings of the National Academy of Sciences · doi:10.1073/pnas.1220176110 · Cited by 216
Brett, J. O., Renault, V. M., Rafalski, V. A., Webb, A. E., & Brunet, A. (2011) · Aging · doi:10.18632/aging.100285 · Cited by 207
MicroRNA dysregulation in schizophrenia
Beveridge, N. J., & Cairns, M. J. (2011) · Neurobiology of Disease · doi:10.1016/j.nbd.2011.12.029 · Cited by 209
Cao, D., Li, L., & Chan, W. (2016) · International Journal of Molecular Sciences · doi:10.3390/ijms17060842 · Cited by 211
Willemsen, M. H., Vallès, A., Kirkels, L. A. M. H., Mastebroek, M., Olde Loohuis, N., Kos, A., Wissink-Lindhout, W. M., de Brouwer, A. P. M., Nillesen, W. M., Pfundt, R., et al. (2011) · Journal of Medical Genetics · doi:10.1136/jmedgenet-2011-100294 · Cited by 202
MicroRNAs in learning, memory, and neurological diseases: Figure 1.Preprint
Wang, W., Kwon, E. J., & Tsai, L. (2012) · Learning & Memory · doi:10.1101/lm.026492.112 · Cited by 210
Validation of schizophrenia-associated genes CSMD1, C10orf26, CACNA1C and TCF4 as miR-137 targets
Kwon, E., Wang, W., & Tsai, L.-H. (2013) · Molecular Psychiatry · doi:10.1038/mp.2011.170 · Cited by 200
m 6 A Regulates Neurogenesis and Neuronal Development by Modulating Histone Methyltransferase Ezh2
Chen, J., Zhang, Y.-C., Huang, C.-M., Shen, H., Sun, B., Cheng, X., Zhang, Y., Yang, Y., Shu, Q., Yang, Y., et al. (2019) · Genomics Proteomics & Bioinformatics · doi:10.1016/j.gpb.2018.12.007 · Cited by 199
Self-citationMiR-137: an important player in neural development and neoplastic transformation
Mahmoudi, E., & Cairns, M. J. (2017) · Molecular Psychiatry · doi:10.1038/mp.2016.150 · Cited by 198
MicroRNA Regulation of Neural Stem Cells and Neurogenesis: Figure 1.
Shi, Y., Zhao, X., Hsieh, J., Wichterle, H., Impey, S., Banerjee, S., Neveu, P. A., & Kosik, K. S. (2010) · Journal of Neuroscience · doi:10.1523/jneurosci.4280-10.2010 · Cited by 203
Self-citationEarly-life stress mediated modulation of adult neurogenesis and behavior
Korosi, A., Naninck, E. F. G., Oomen, C. A., Schouten, M., Krugers, H., Fitzsimons, C., & Lucassen, P. J. (2012) · Behavioural Brain Research · doi:10.1016/j.bbr.2011.07.037 · Cited by 194
Vieira, M. S., Santos, A. K., Vasconcellos, R., Goulart, V. A. M., Parreira, R. C., Kihara, A. H., Ulrich, H., & Resende, R. R. (2018) · Biotechnology Advances · doi:10.1016/j.biotechadv.2018.08.002 · Cited by 192
NeurimmiRs: microRNAs in the neuroimmune interface
Soreq, H., & Wolf, Y. (2011) · Trends in Molecular Medicine · doi:10.1016/j.molmed.2011.06.009 · Cited by 162
Wu, H., Tao, J., Chen, P. J., Shahab, A., Ge, W., Hart, R. P., Ruan, X., Ruan, Y., & Sun, Y. E. (2010) · Proceedings of the National Academy of Sciences · doi:10.1073/pnas.1005595107 · Cited by 184
MicroRNAs: Small molecules with big roles in neurodevelopment and diseases
Sun, E., & Shi, Y. (2014) · Experimental Neurology · doi:10.1016/j.expneurol.2014.08.005 · Cited by 183
MicroRNAs: regulators of neuronal fate
Sun, A. X., Crabtree, G. R., & Yoo, A. S. J. (2013) · Current Opinion in Cell Biology · doi:10.1016/j.ceb.2012.12.007 · Cited by 179
Modeling Neurological Diseases With Human Brain Organoids
Wang, H. (2018) · Frontiers in Synaptic Neuroscience · doi:10.3389/fnsyn.2018.00015 · Cited by 181
The Molecular Basis of MeCP2 Function in the Brain
Tillotson, R., & Bird, A. P. (2019) · Journal of Molecular Biology · doi:10.1016/j.jmb.2019.10.004 · Cited by 181
Liyanage, V. R. B., & Rastegar, M. (2014) · NeuroMolecular Medicine · doi:10.1007/s12017-014-8295-9 · Cited by 182
MicroRNA in Glioblastoma: An Overview
Banelli, B., Forlani, A., Allemanni, G., Morabito, A., Pistillo, M. P., & Romani, M. (2017) · International Journal of Genomics · doi:10.1155/2017/7639084 · Cited by 171
Wiklund, E. D., Gao, S., Hulf, T., Sibbritt, T., Nair, S. S., Costea, D. E., Villadsen, S. B., Bakholdt, V. T., Bramsen, J. B., Sørensen, J. A., et al. (2011) · PLoS ONE · doi:10.1371/journal.pone.0027840 · Cited by 167
Emerging role of microRNAs in major depressive disorder: diagnosis and therapeutic implications
Dwivedi, Y. (2014) · Dialogues in Clinical Neuroscience · doi:10.31887/dcns.2014.16.1/ydwivedi · Cited by 169
Identification of Epigenetically Altered Genes in Sporadic Amyotrophic Lateral Sclerosis
Figueroa‐Romero, C., Hur, J., Bender, D. E., Delaney, C. E., Cataldo, M. D., Smith, A. L., Yung, R. L., Ruden, D. M., Callaghan, B. C., & Feldman, E. L. (2012) · PLoS ONE · doi:10.1371/journal.pone.0052672 · Cited by 166
Functions of Noncoding RNAs in Neural Development and Neurological Diseases
Bian, S., & Sun, T. (2011) · Molecular Neurobiology · doi:10.1007/s12035-011-8211-3 · Cited by 155
Brenes, J. C., Lackinger, M., Höglinger, G. U., Schratt, G., Schwarting, R. K. W., & Wöhr, M. (2016) · Journal of Comparative Neurology · doi:10.1002/cne.23842 · Cited by 155
Luo, C., Tetteh, P. W., Merz, P., Dickes, E., Abukiwan, A., Hotz‐Wagenblatt, A., Holland-Cunz, S. G., Sinnberg, T. W., Schittek, B., Schadendorf, D., et al. (2012) · Journal of Investigative Dermatology · doi:10.1038/jid.2012.357 · Cited by 147
Cheng, Y., Wang, Z., Tan, W., Wang, X., Li, Y., Bai, B., Li, Y., Zhang, S.-F., Yan, H., Chen, Z.-L., et al. (2018) · Nature Neuroscience · doi:10.1038/s41593-018-0261-7 · Cited by 139
Self-citationLiu, X., Chopp, M., Wang, X. L., Zhang, L., Hozeska‐Solgot, A., Tang, T., Kassis, H., Zhang, R. L., Chen, C., Xu, J. W., et al. (2013) · Journal of Biological Chemistry · doi:10.1074/jbc.m112.449025 · Cited by 138
Epigenetic Regulations in Neuropsychiatric Disorders
Kuehner, J. N., Bruggeman, E. C., Wen, Z., & Yao, B. (2019) · Frontiers in Genetics · doi:10.3389/fgene.2019.00268 · Cited by 144
O’Connor, R. M., Dinan, T. G., & Cryan, J. F. (2011) · Molecular Psychiatry · doi:10.1038/mp.2011.162 · Cited by 135
Perugorria, M. J., Wilson, C. L., Zeybel, M., Walsh, M. J., Amin, S., Robinson, S. M., White, S. A., Burt, A. D., Oakley, F., Tsukamoto, H., et al. (2012) · Hepatology · doi:10.1002/hep.25754 · Cited by 134
Analysis of miR-137 expression and rs1625579 in dorsolateral prefrontal cortex
Guella, I., Sequeira, A., Rollins, B. L., Morgan, L., Torri, F., van Erp, T. G. M., Myers, R., Barchas, J. D., Schatzberg, A. F., Watson, S. J., et al. (2013) · Journal of Psychiatric Research · doi:10.1016/j.jpsychires.2013.05.021 · Cited by 132
Transcriptional and epigenetic regulation of human microRNAs
Wang, Z., Yao, H., Lin, S., Zhu, X., Shen, Z., Lü, G., Poon, W. S., Xie, D., Lin, M. C.-M., & Kung, H. (2012) · Cancer Letters · doi:10.1016/j.canlet.2012.12.006 · Cited by 138
Yang, M. D., Chiang, Y., Higashiyama, R., Asahina, K., Mann, D. A., Mann, J., Wang, C. C. C., & Tsukamoto, H. (2011) · Hepatology · doi:10.1002/hep.24792 · Cited by 131
Notch: an interactive player in neurogenesis and disease
Zhang, R., Engler, A., & Taylor, V. (2017) · Cell and Tissue Research · doi:10.1007/s00441-017-2641-9 · Cited by 137
Fan, H., Sun, X., Guo, W., Zhong, A., Niu, W., Zhao, L., Dai, Y.-H., Guo, Z.-M., Zhang, L.-Y., & Lu, J. Z. (2014) · Journal of Psychiatric Research · doi:10.1016/j.jpsychires.2014.08.007 · Cited by 129
MicroRNAs in brain development and function: a matter of flexibility and stability
Follert, P., Cremer, H., & Béclin, C. (2014) · Frontiers in Molecular Neuroscience · doi:10.3389/fnmol.2014.00005 · Cited by 126
Causes and Consequences of MicroRNA Dysregulation in Neurodegenerative Diseases
Tan, L., Yu, J.-T., & Tan, L. (2014) · Molecular Neurobiology · doi:10.1007/s12035-014-8803-9 · Cited by 128
Crosstalk among Epigenetic Pathways Regulates Neurogenesis
Jobe, E. M., McQuate, A. L., & Zhao, X. (2012) · Frontiers in Neuroscience · doi:10.3389/fnins.2012.00059 · Cited by 126
Self-citationPotential Impact of miR-137 and Its Targets in Schizophrenia
Wright, C., Turner, J. A., Calhoun, V. D., & Perrone‐Bizzozero, N. I. (2013) · Frontiers in Genetics · doi:10.3389/fgene.2013.00058 · Cited by 127
The emerging role of microRNAs in schizophrenia and autism spectrum disorders
Mellios, N., & Sur, M. (2012) · Frontiers in Psychiatry · doi:10.3389/fpsyt.2012.00039 · Cited by 120
Toda, T., Hsu, J. Y., Linker, S. B., Hu, L., Schafer, S. T., Mertens, J., Jacinto, F. V., Hetzer, M. W., & Gage, F. H. (2017) · Cell stem cell · doi:10.1016/j.stem.2017.08.012 · Cited by 122
Lett, T. A. P., Chakavarty, M. M., Felsky, D., Brandl, E. J., Tiwari, A. K., Gonçalves, V. F., Rajji, T. K., Daskalakis, Z. J., Meltzer, H. Y., Lieberman, J. A., et al. (2013) · Molecular Psychiatry · doi:10.1038/mp.2013.17 · Cited by 121
Epigenetically regulated microRNAs in Alzheimer's disease
van den Hove, D., Kompotis, K., Lardenoije, R., Kenis, G., Mill, J. S., Steinbusch, H. W. M., Lesch, K., Fitzsimons, C. P., Strooper, B. D., & Rutten, B. P. F. (2013) · Neurobiology of Aging · doi:10.1016/j.neurobiolaging.2013.10.082 · Cited by 121
Stražišar, M., Cammaerts, S., van der Ven, K., Forero, D. A., Lenaerts, A.-S., Nordin, A., Almeida-Souza, L., Genovese, G., Timmerman, V., Liekens, A. M. L., et al. (2014) · Molecular Psychiatry · doi:10.1038/mp.2014.53 · Cited by 119
Unravelling the genetic basis of schizophrenia and bipolar disorder with GWAS: A systematic review
Prata, D. P., Costa-Neves, B., Cosme, G., & Vassos, E. (2019) · Journal of Psychiatric Research · doi:10.1016/j.jpsychires.2019.04.007 · Cited by 123
Cheng, L., Quek, C. Y. J., Sun, X., Bellingham, S. A., & Hill, A. F. (2013) · Frontiers in Genetics · doi:10.3389/fgene.2013.00150 · Cited by 113
miR-199a Links MeCP2 with mTOR Signaling and Its Dysregulation Leads to Rett Syndrome Phenotypes
Tsujimura, K., Irie, K., Nakashima, H., Egashira, Y., Fukao, Y., Fujiwara, M., Itoh, M., Uesaka, M., Imamura, T., Nakahata, Y., et al. (2015) · Cell Reports · doi:10.1016/j.celrep.2015.08.028 · Cited by 118
Wang, Y., Plane, J. M., Jiang, P., Zhou, C. J., & Deng, W. (2011) · Stem Cells · doi:10.1002/stem.644 · Cited by 113
Langevin, S. M., Stone, R. A., Bunker, C. H., Lyons‐Weiler, M. A., LaFramboise, W. A., Kelly, L. A., Seethala, R. R., Grandis, J. R., Sobol, R. W., & Taioli, E. (2010) · Cancer · doi:10.1002/cncr.25689 · Cited by 109
Evidence demonstrating role of microRNAs in the etiopathology of major depression
Dwivedi, Y. (2011) · Journal of Chemical Neuroanatomy · doi:10.1016/j.jchemneu.2011.04.002 · Cited by 109
Ten-eleven translocation 2 interacts with forkhead box O3 and regulates adult neurogenesis
Li, X., Yao, B., Chen, L., Kang, Y., Li, Y., Cheng, Y., Li, L., Li, L., Wang, Z., Wang, M., et al. (2017) · Nature Communications · doi:10.1038/ncomms15903 · Cited by 105
Self-citationSalvatori, B., Iosue, I., Damas, N. D., Mangiavacchi, A., Chiaretti, S., Messina, M., Padula, F., Guarini, A. R., Bozzoni, I., Fazi, F., et al. (2011) · Genes & Cancer · doi:10.1177/1947601911416357 · Cited by 108
Li, N., Pan, X., Zhang, J., Ma, A., Yang, S., Ma, J., & Xie, A. (2017) · Neurological Sciences · doi:10.1007/s10072-017-2841-9 · Cited by 97
Neurogenomic mechanisms of social plasticity
Cardoso, S. D., Teles, M. C., & Oliveira, R. F. (2015) · Journal of Experimental Biology · doi:10.1242/jeb.106997 · Cited by 106
Epigenetic regulation in neurodevelopment and neurodegenerative diseases
Gapp, K., Woldemichael, B. T., Bohacek, J., & Mansuy, I. M. (2012) · Neuroscience · doi:10.1016/j.neuroscience.2012.11.040 · Cited by 110
MicroRNA biogenesis, gene silencing mechanisms and role in breast, ovarian and prostate cancer
Khan, S., Ayub, H., Khan, T., & Wahid, F. (2019) · Biochimie · doi:10.1016/j.biochi.2019.09.001 · Cited by 108
MicroRNA-137 Controls AMPA-Receptor-Mediated Transmission and mGluR-Dependent LTD
Olde Loohuis, N. F. M., Ba, W., Stoerchel, P. H., Kos, A., Jager, A., Schratt, G., Martens, G. J. M., van Bokhoven, H., Nadif Kasri, N., & Aschrafi, A. (2015) · Cell Reports · doi:10.1016/j.celrep.2015.05.040 · Cited by 99
Duan, J., Shi, J., Fiorentino, A., Leites, C., Chen, X., Moy, W., Chen, J., Alexandrov, B. S., Usheva, A., S, D. H. B., et al. (2014) · The American Journal of Human Genetics · doi:10.1016/j.ajhg.2014.11.001 · Cited by 107
microRNAs: key triggers of neuronal cell fate
Meza‐Sosa, K. F., Pedraza‐Alva, G., & Pérez-MartÃnez, L. (2014) · Frontiers in Cellular Neuroscience · doi:10.3389/fncel.2014.00175 · Cited by 109
Epigenetic mechanisms in schizophrenia
Shorter, K. R., & Miller, B. H. (2015) · Progress in Biophysics and Molecular Biology · doi:10.1016/j.pbiomolbio.2015.04.008 · Cited by 107
Epigenetic regulation of neurogenesis in the adult mammalian brain
Sun, J., Sun, J., Ming, G., & Song, H. (2011) · European Journal of Neuroscience · doi:10.1111/j.1460-9568.2011.07607.x · Cited by 105
MicroRNA signatures differentiate melanoma subtypes
Chan, E., Patel, R., Nallur, S. V., Ratner, E., Bacchiocchi, A., Hoyt, K., Szpakowski, S., Godshalk, S. E., Ariyan, S., Sznol, M., et al. (2011) · Cell Cycle · doi:10.4161/cc.10.11.15777 · Cited by 100
Aschrafi, A., Kar, A. N., Natera-Naranjo, O., MacGibeny, M. A., Gioio, A. E., & Kaplan, B. B. (2012) · Cellular and Molecular Life Sciences · doi:10.1007/s00018-012-1064-8 · Cited by 99
miR-137: A New Player in Schizophrenia
Yin, J., Lin, J., Luo, X., Chen, Y., Li, Z., Ma, G., & Li, K. (2014) · International Journal of Molecular Sciences · doi:10.3390/ijms15023262 · Cited by 98
Progress in the treatment of drug-induced liver injury with natural products
Sun, Y., Zhang, Y., Xie, L., Rong, F., Zhu, X.-Y., Xie, J., Zhou, H., & Xu, T. (2022) · Pharmacological Research · doi:10.1016/j.phrs.2022.106361 · Cited by 105
Neural Stem Cell Niches in Health and Diseases
Decimo, I., Bifari, F., Krampera, M., & Fumagalli, G. F. (2012) · Current Pharmaceutical Design · doi:10.2174/138161212799859611 · Cited by 102
Metadata
- Authors
- Szulwach, K. E., Li, X., Smrt, R. D., Li, Y., Luo, Y., Lin, L., Santistevan, N. J., Li, W., Zhao, X., & Jin, P.
- Affiliations
- Emory University (US)
- University of New Mexico (US)
- Department of Human Genetics 1 and 2
- Corresponding author
- Zhao, Xinyu
- Jin, Peng
- Venue
- Journal of Cell Biology
- Publisher
- Rockefeller University Press
- Published
- 2010-04-05
- Volume
- 189
- Issue
- 1
- Pages
- 127-141
- ISSN
- 0021-9525 (ISSN-L)
- 1540-8140
- PMC
- PMC2854370
- OpenAlex
- W2146997290
- Cited by
- 493
- References
- 69
- Citations by year
- 2026: 5 · 2025: 12 · 2024: 28 · 2023: 13 · 2022: 22 · 2021: 31 · 2020: 13 · 2019: 28 · 2018: 22 · 2017: 34 · 2016: 43 · 2015: 45 · 2014: 55 · 2013: 43 · 2012: 48
- FWCI
- 14.26
- Type
- journal article
- Language
- en
- Open access
- hybrid
- doi.org
- Licence
- cc-by-nc-sa
- Locations
- The Journal of Cell Biology (publishedVersion, cc-by-nc-sa)
- PubMed Central (publishedVersion, cc-by-nc-sa)
- PubMed (publishedVersion)
- Funders
- Autism Speaks
- International Rett Syndrome Foundation
- National Institutes of Health
- National Institute on Aging (P50AG025688)
- National Institute of Mental Health (R01MH078972, MH078972, R56MH076090, MH080434, R01MH076090, MH076090, R01MH080434)
- National Institute of General Medical Sciences (T34GM008751)
- National Institute of Neurological Disorders and Stroke (NS051630, R01NS051630)
- Topics
- Life Sciences › Neuroscience › Developmental Neuroscience › Neurogenesis and neuroplasticity mechanisms
- Life Sciences › Biochemistry, Genetics and Molecular Biology › Cancer Research › MicroRNA in disease regulation
- Life Sciences › Biochemistry, Genetics and Molecular Biology › Molecular Biology › Epigenetics and DNA Methylation
- Keywords
- microRNA, epigenetic regulation, adult neurogenesis, adult neural stem cells, MeCP2, miR-137, SOX2, EZH2, Polycomb group proteins, H3K27me3, DNA methylation, stem cell proliferation, stem cell differentiation, post-transcriptional regulation
- MeSH terms
- Enhancer of Zeste Homolog 2 Protein, Animals, Chromatin, Mice, Transgenic, Histone-Lysine N-Methyltransferase, Repressor Proteins, Stem Cells, MicroRNAs, Epigenesis, Genetic, Mice, Methyl-CpG-Binding Protein 2, Neurogenesis, Polycomb-Group Proteins, Polycomb Repressive Complex 2
About these checks
Registry, retraction, Cites and statistics results are computed, not judged, with one exception: a printed reference that no index lists is read once by a model before it counts as a citation error. Claims are extracted by a model and kept only when their quote appears verbatim in the text; each cited source is then checked, with a model’s help, for whether it says what the claim relies on. Those verdicts can be wrong — read the claim’s quote and the cited source before relying on one.
Statistics and arithmetic are recomputed, not judged.
Confidence bands are shown only for fields calibrated on our annotated test set. None is calibrated yet, so no band is shown.
What counts as a claim ›How we measure confidence ›How we check this ›
Are you an author, or do you see a problem with this page? Request a review
