

The DOI matches its Crossref record; 56 of the 56 references it cites were found in a registry or an index.
Nucleoside-modified mRNA vaccines induce potent T follicular helper and germinal center B cell responses
Open accessAbstract
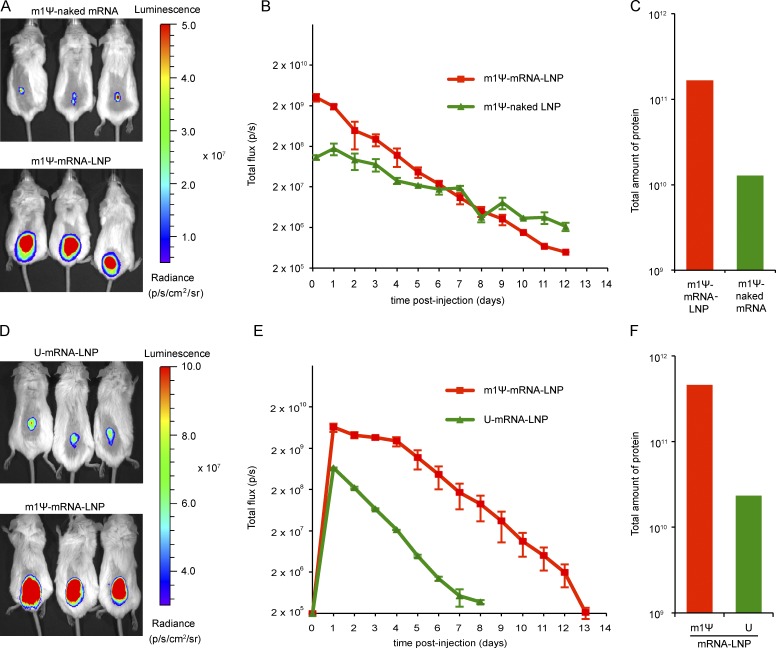
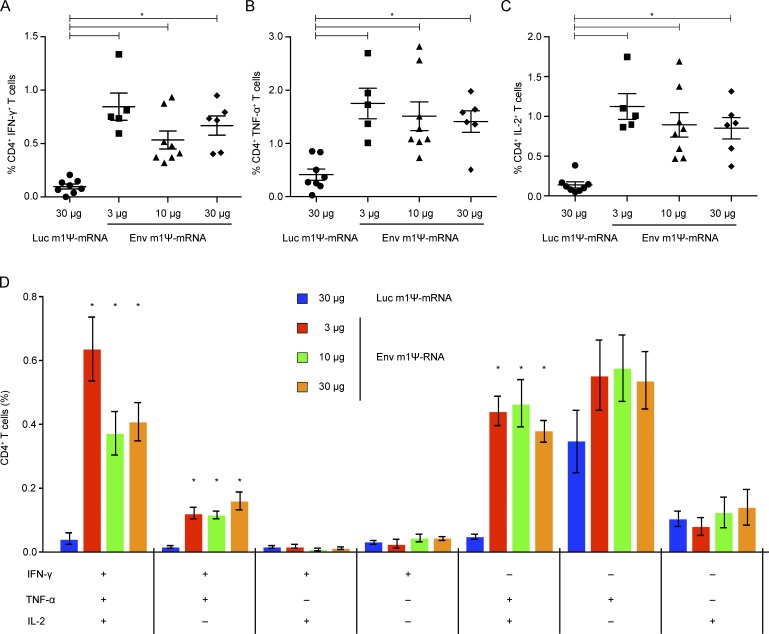
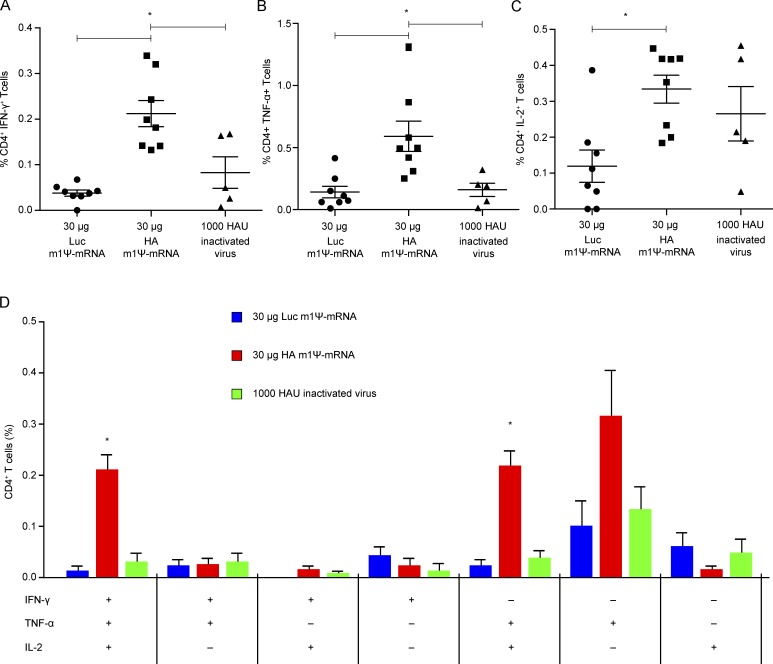
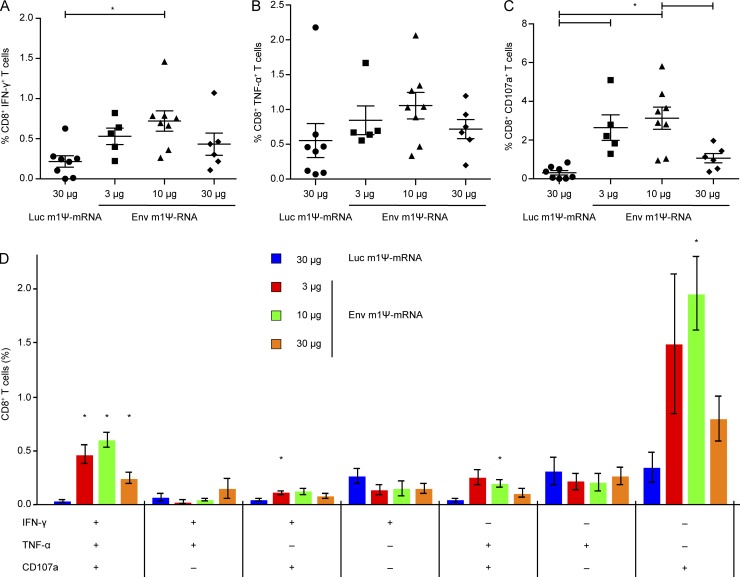
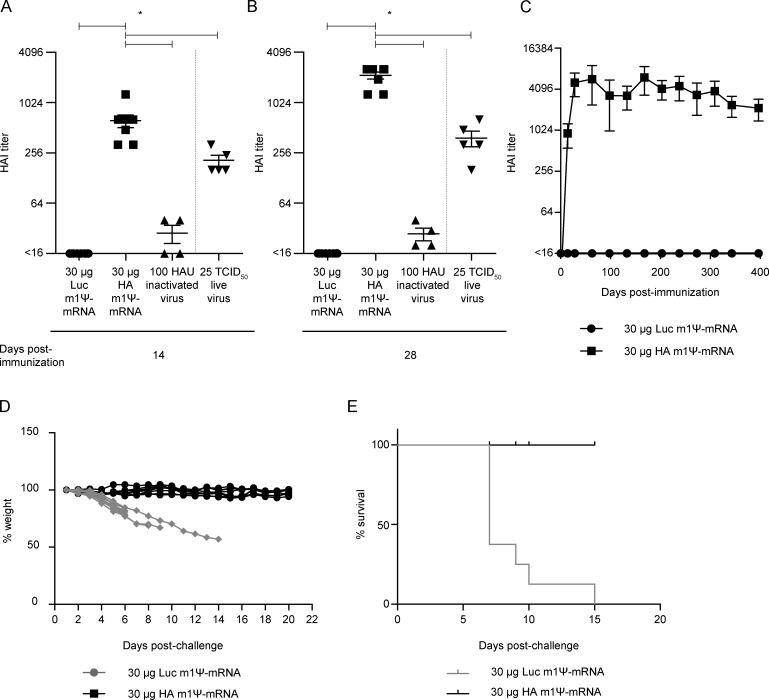
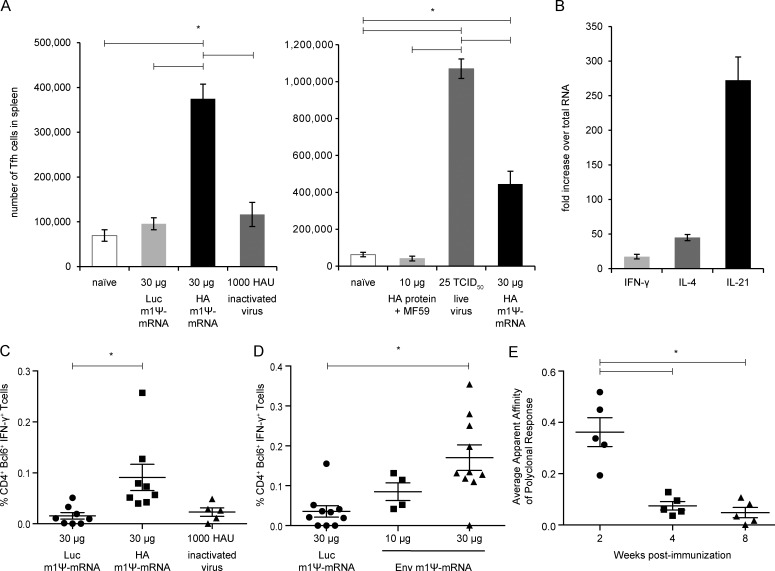
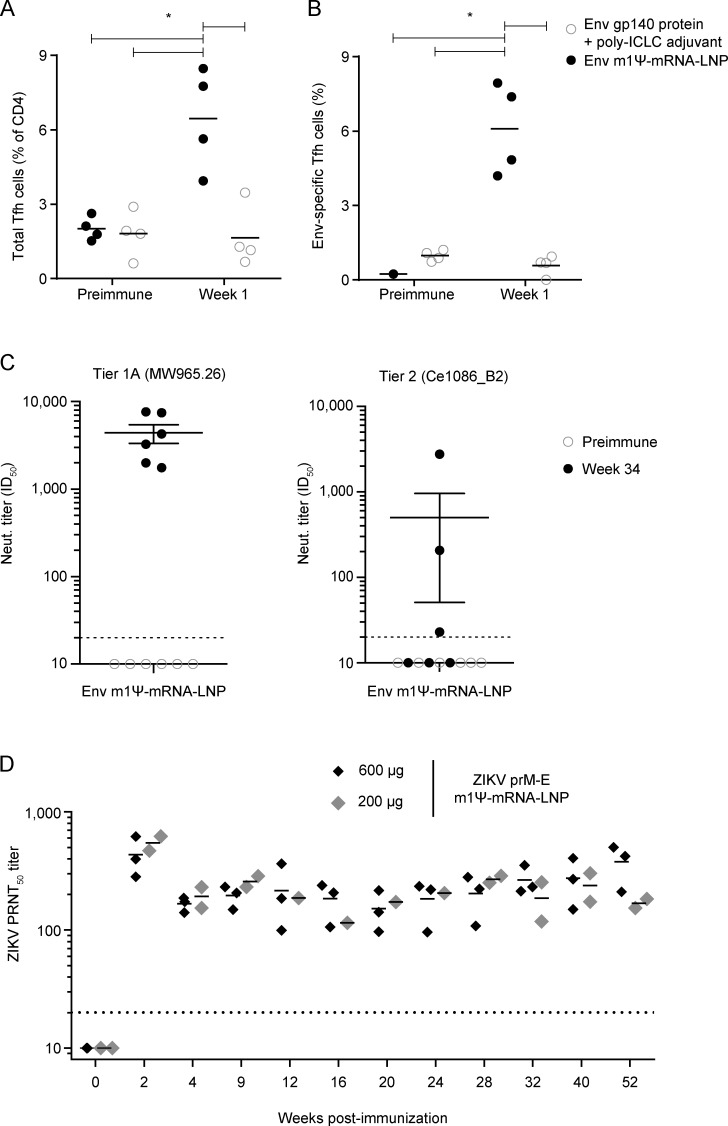
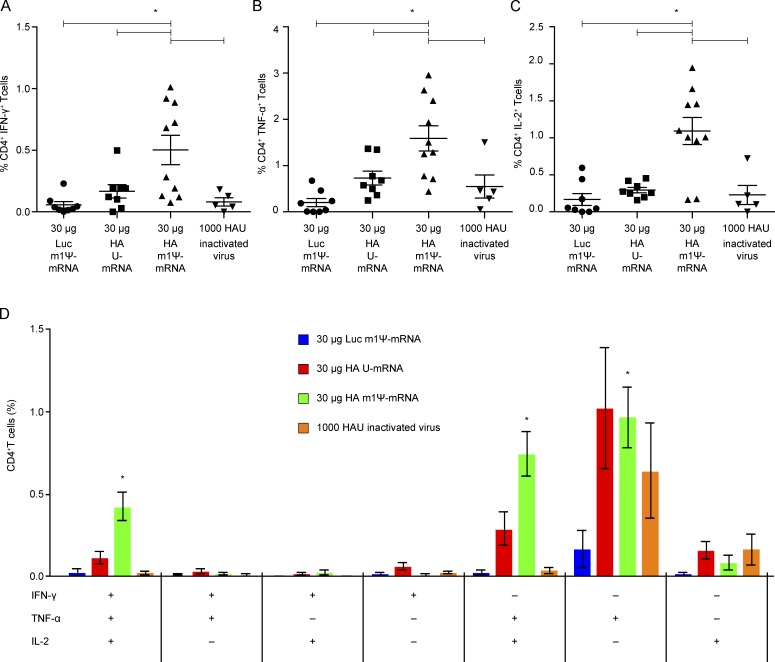
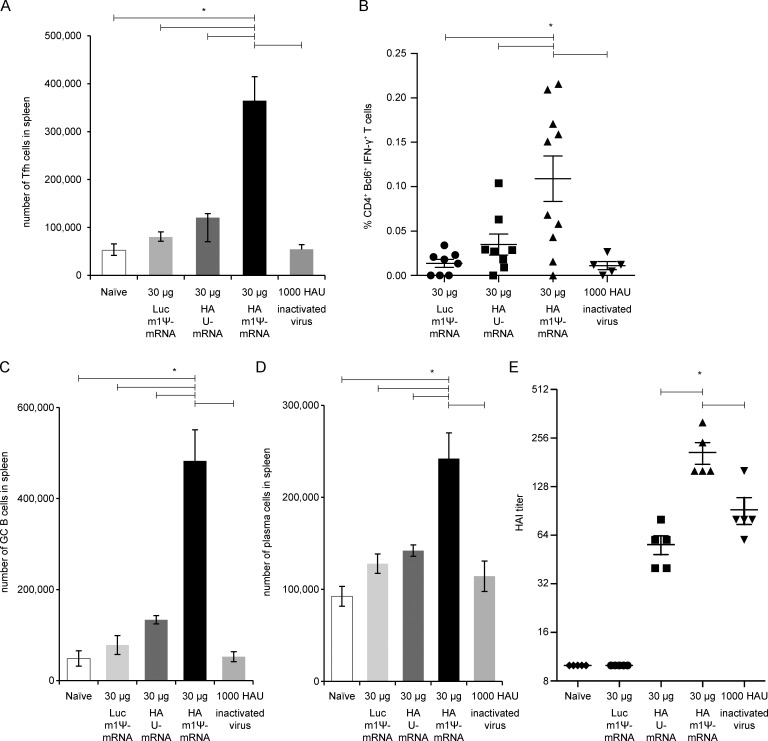
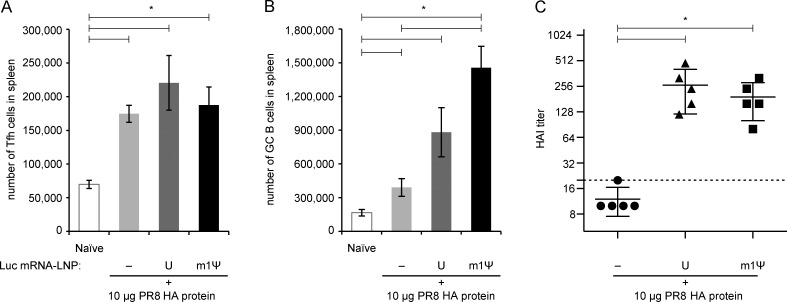
T follicular helper (Tfh) cells are required to develop germinal center (GC) responses and drive immunoglobulin class switch, affinity maturation, and long-term B cell memory. In this study, we characterize a recently developed vaccine platform, nucleoside-modified, purified mRNA encapsulated in lipid nanoparticles (mRNA-LNPs), that induces high levels of Tfh and GC B cells. Intradermal vaccination with nucleoside-modified mRNA-LNPs encoding various viral surface antigens elicited polyfunctional, antigen-specific, CD4+ T cell responses and potent neutralizing antibody responses in mice and nonhuman primates. Importantly, the strong antigen-specific Tfh cell response and high numbers of GC B cells and plasma cells were associated with long-lived and high-affinity neutralizing antibodies and durable protection. Comparative studies demonstrated that nucleoside-modified mRNA-LNP vaccines outperformed adjuvanted protein and inactivated virus vaccines and pathogen infection. The incorporation of noninflammatory, modified nucleosides in the mRNA is required for the production of large amounts of antigen and for robust immune responses.
Overview
The claims and statistics of this paper haven’t been checked yet.
Run the check — free, no account needed. It reads the open-access text and checks the sources it cites.
Integrity signals
Registry
Cites
Statistics
Figures
Verification
Claims the paper makes
The claims and statistics of this paper haven’t been checked yet.
Run the check — free, no account needed. It reads the open-access text and checks the sources it cites.
Claims other papers make about this one
Each is checked against this paper’s own text: does it say what the citing paper says it does?
The source backs part of the claim, not all of it — or backs it for a different population, condition or comparison.
In the citing paper
“BNT162b2 is based on lipid-nanoparticle-formulated mRNA vaccine technology, which delivers precise genetic information of the immunogen to antigen-presenting cells and elicits potent immune responses 7 .”
From BNT162b2 vaccine induces neutralizing antibodies and poly-specific T cells in humans (2021) · cites this paper as [7]
Experimental — accuracy not yet measuredThe source backs part of the claim, not all of it — or backs it for a different population, condition or comparison.
In the citing paper
“The rapid and robust immunogenicity profile of the mRNA-1273 vaccine most likely results from an innovative structure-based vaccine antigen design,23 coupled with a potent lipid-nanoparticle delivery system, and the use of modified nucleotides that avoid early intracellular activation of interferon-associated genes.”
From An mRNA Vaccine against SARS-CoV-2 — Preliminary Report (2020) · cites this paper as [24]
Experimental — accuracy not yet measuredThe cited source says what the claim attributes to it.
In the citing paper
“These features of the mRNA composition and formulation have been associated with prolonged protein expression, induction of antigen-specific T-follicular helper cells, and activation of germinal center B cells.24”
From An mRNA Vaccine against SARS-CoV-2 — Preliminary Report (2020) · cites this paper as [24]
In the citing paper
“Thus, in agreement with previous results (13, 25, 26), mRNA-1273 vaccination induces TH1- and TFH-skewed CD4 T cell responses.”
From Immune correlates of protection by mRNA-1273 vaccine against SARS-CoV-2 in nonhuman primates (2021) · cites this paper as [26]
In the citing paper
“In contrast, Pardi and colleagues reported that protein levels after intradermal injection of m1ψ-modified mRNA in mice were 20 times higher compared to sequence-optimized but unmodified mRNA.184”
From Advances in COVID-19 mRNA vaccine development (2022) · cites this paper as [184]
In the citing paper
“The germinal center B cell response and its regulation by CD4+ T follicular helper (Tfh) cells are of key importance for high-affinity neutralization antibody titers and long-lasting B cell responses.53,54”
From COVID-19 mRNA vaccines: Platforms and current developments (2022) · cites this paper as [54]
In the citing paper
“One study in mice showed that LNPs encapsulating nucleoside-modified mRNA circulated for longer and induced stronger TFH cell and germinal centre B cell responses than LNPs carrying unmodified mRNA200.”
From mRNA vaccines for infectious diseases: principles, delivery and clinical translation (2021) · cites this paper as [200]
In the citing paper
“several studies have shown that i.m. delivery of 1mΨ-modified mRNA vaccines results in the rapid and potent induction of follicular T helper cells (Tfh) [71,72].”
From The dawn of mRNA vaccines: the COVID-19 case (2021) · cites this paper as [72]
In the citing paper
“Lipid nanoparticle–mRNA vaccines are also being investigated as influenza vaccines29,41,156,157,159,184,189–191, with some formulations in clinical trials (Table 1).”
From Lipid nanoparticles for mRNA delivery (2021) · cites this paper as [190]
In the citing paper
“Lipid nanoparticle–mRNA formulations are further being explored for Zika virus vaccines38,190,192–194.”
From Lipid nanoparticles for mRNA delivery (2021) · cites this paper as [190]
In the citing paper
“Furthermore, lipid nanoparticle–mRNA vaccines have been tested against other viruses in animal models, including human immunodeficiency virus28,144,181,190, Powassan virus195, Venezuelan equine encephalitis virus196, dengue virus73 and Ebola virus197.”
From Lipid nanoparticles for mRNA delivery (2021) · cites this paper as [190]
In the citing paper
“Additionally, the robust and sustained antigen expression of nucleoside-modified mRNA was associated with more optimal antibody responses compared to unmodified mRNA [12,13].”
From Three decades of messenger RNA vaccine development (2019) · cites this paper as [12]
Self-check
Percentages, sums and reported differences re-computed from the paper’s own numbers.
The self-check needs the paper’s full text.
Citations
Cites
mRNA vaccines — a new era in vaccinology
Pardi, N., Hogan, M. J., Porter, F. W., & Weissman, D. (2018) · Nature Reviews Drug Discovery · doi:10.1038/nrd.2017.243 · Cited by 4,667
Self-citationKarikó, K., Muramatsu, H., Welsh, F. A., Ludwig, J., Kato, H., Akira, S., & Weissman, D. (2008) · Molecular Therapy · doi:10.1038/mt.2008.200 · Cited by 1,930
Self-citationVictora, G. D., & Nussenzweig, M. C. (2012) · Annual Review of Immunology · doi:10.1146/annurev-immunol-020711-075032 · Cited by 1,878
T follicular helper cell differentiation, function, and roles in disease
Crotty, S. (2014) · Immunity · doi:10.1016/j.immuni.2014.10.004 · Cited by 1,847
Maximizing the potency of siRNA lipid nanoparticles for hepatic gene silencing in vivo
Jayaraman, M., Ansell, S. M., Mui, B. L., Tam, Y. K., Chen, J., Du, X., Butler, D., Eltepu, L., Matsuda, S., Narayanannair, J. K., et al. (2012) · Angewandte Chemie International Edition · doi:10.1002/anie.201203263 · Cited by 1,267
Self-citationPotent and persistent in vivo anti-HBV activity of chemically modified siRNAs
Morrissey, D. V., Lockridge, J. A., Shaw, L., Blanchard, K. S., Jensen, K., Breen, W., Hartsough, K. C., Machemer, L., Radka, S. F., Jadhav, V., et al. (2005) · Nature Biotechnology · doi:10.1038/nbt1122 · Cited by 1,175
Pardi, N., Tuyishime, S., Muramatsu, H., Kariko, K., Mui, B. L., Tam, Y. K., Madden, T. D., Hope, M. J., & Weissman, D. (2015) · Journal of Controlled Release · doi:10.1016/j.jconrel.2015.08.007 · Cited by 1,014
Self-citationModified mRNA vaccines protect against zika virus infection
Richner, J. M., Himansu, S., Dowd, K. A., Butler, S. L., Salazar, V., Fox, J. M., Julander, J. G., Tang, W. W., Shresta, S., Pierson, T. C., et al. (2017) · Cell · doi:10.1016/j.cell.2017.02.017 · Cited by 909
Karikó, K., Muramatsu, H., Ludwig, J., & Weissman, D. (2011) · Nucleic Acids Research · doi:10.1093/nar/gkr695 · Cited by 898
Self-citationZika virus protection by a single low-dose nucleoside-modified mRNA vaccination
Pardi, N., Hogan, M. J., Pelc, R. S., Muramatsu, H., Andersen, H., DeMaso, C. R., Dowd, K. A., Sutherland, L. L., Scearce, R. M., Parks, R., et al. (2017) · Nature · doi:10.1038/nature21428 · Cited by 884
Self-citation
Cited by
Sorted by citations
Lipid nanoparticles for mRNA delivery
Hou, X., Zaks, T., Langer, R., & Dong, Y. (2021) · Nature Reviews Materials · doi:10.1038/s41578-021-00358-0 · Cited by 4,076
An mRNA Vaccine against SARS-CoV-2 — Preliminary Report
Jackson, L. A., Anderson, E. J., Rouphael, N. G., Roberts, P. C., Makhene, M., Coler, R. N., McCullough, M. P., Chappell, J. D., Denison, M. R., Stevens, L. J., et al. (2020) · New England Journal of Medicine · doi:10.1056/nejmoa2022483 · Cited by 3,237
COVID-19 vaccine BNT162b1 elicits human antibody and TH1 T cell responses
Sahin, U., Muik, A., Derhovanessian, E., Vogler, I., Kranz, L. M., Vormehr, M., Baum, A., Pascal, K., Quandt, J., Maurus, D., et al. (2020) · Nature · doi:10.1038/s41586-020-2814-7 · Cited by 1,977
Self-citationmRNA vaccines for infectious diseases: principles, delivery and clinical translation
Chaudhary, N., Weissman, D., & Whitehead, K. A. (2021) · Nature Reviews Drug Discovery · doi:10.1038/s41573-021-00283-5 · Cited by 1,555
Self-citationDrug delivery systems for RNA therapeutics
Paunovska, K., Loughrey, D., & Dahlman, J. E. (2022) · Nature Reviews Genetics · doi:10.1038/s41576-021-00439-4 · Cited by 1,349
Evaluation of the mRNA-1273 Vaccine against SARS-CoV-2 in Nonhuman Primates
Corbett, K. S., Flynn, B., Foulds, K. E., Francica, J. R., Boyoglu-Barnum, S., Werner, A. P., Flach, B., O’Connell, S., Bock, K. W., Minai, M., et al. (2020) · New England Journal of Medicine · doi:10.1056/nejmoa2024671 · Cited by 1,066
Self-citationBNT162b2 vaccine induces neutralizing antibodies and poly-specific T cells in humans
Sahin, U., Muik, A., Vogler, I., Derhovanessian, E., Kranz, L. M., Vormehr, M., Quandt, J., Bidmon, N., Ulges, A., Baum, A., et al. (2021) · Nature · doi:10.1038/s41586-021-03653-6 · Cited by 919
Self-citationAlameh, M.-G., Tombácz, I., Bettini, E., Lederer, K., Ndeupen, S., Sittplangkoon, C., Wilmore, J. R., Gaudette, B. T., Soliman, O. Y., Pine, M., et al. (2021) · Immunity · doi:10.1016/j.immuni.2021.11.001 · Cited by 775
Self-citationAdvances in mRNA Vaccines for Infectious Diseases
Zhang, C., Maruggi, G., Shan, H., & Li, J. (2019) · Frontiers in Immunology · doi:10.3389/fimmu.2019.00594 · Cited by 696
Ndeupen, S., Qin, Z., Jacobsen, S., Bouteau, A., Estanbouli, H., & Igyártó, B. Z. (2021) · iScience · doi:10.1016/j.isci.2021.103479 · Cited by 678
Advances in COVID-19 mRNA vaccine development
Fang, E., Liu, X., Li, M., Zhang, Z., Song, L., Zhu, B., Wu, X., Liu, J., Zhao, D., & Li, Y. (2022) · Signal Transduction and Targeted Therapy · doi:10.1038/s41392-022-00950-y · Cited by 601
Nanomaterial Delivery Systems for mRNA Vaccines
Buschmann, M. D., Carrasco, M. J., Alishetty, S., Paige, M., Alameh, M. G., & Weissman, D. (2021) · Vaccines · doi:10.3390/vaccines9010065 · Cited by 582
Self-citationGenetic programming of macrophages to perform anti-tumor functions using targeted mRNA nanocarriers
Zhang, F., Parayath, N. N., Ene, C., Stephan, S. B., Koehne, A. L., Coon, M. E., Holland, E. C., & Stephan, M. T. (2019) · Nature Communications · doi:10.1038/s41467-019-11911-5 · Cited by 527
mRNA as a Transformative Technology for Vaccine Development to Control Infectious Diseases
Maruggi, G., Zhang, C., Li, J., Ulmer, J. B., & Yu, D. (2019) · Molecular Therapy · doi:10.1016/j.ymthe.2019.01.020 · Cited by 507
Kim, J., Eygeris, Y., Gupta, M., & Sahay, G. (2021) · Advanced Drug Delivery Reviews · doi:10.1016/j.addr.2020.12.014 · Cited by 514
Innate immune mechanisms of mRNA vaccines
Verbeke, R., Hogan, M. J., Loré, K., & Pardi, N. (2022) · Immunity · doi:10.1016/j.immuni.2022.10.014 · Cited by 535
Self-citationRecent advances in mRNA vaccine technology
Pardi, N., Hogan, M. J., & Weissman, D. (2020) · Current Opinion in Immunology · doi:10.1016/j.coi.2020.01.008 · Cited by 512
Self-citationThe dawn of mRNA vaccines: the COVID-19 case
Verbeke, R., Lentacker, I., De Smedt, S. C., & Dewitte, H. (2021) · Journal of Controlled Release · doi:10.1016/j.jconrel.2021.03.043 · Cited by 504
The landscape of mRNA nanomedicine
Huang, X., Kong, N., Zhang, X., Cao, Y., Langer, R., & Tao, W. (2022) · Nature Medicine · doi:10.1038/s41591-022-02061-1 · Cited by 511
Mechanisms of innate and adaptive immunity to the Pfizer-BioNTech BNT162b2 vaccine
Li, C., Lee, A., Grigoryan, L., Arunachalam, P. S., Scott, M. K. D., Trisal, M., Wimmers, F., Sanyal, M., Weidenbacher, P. A., Feng, Y., et al. (2022) · Nature Immunology · doi:10.1038/s41590-022-01163-9 · Cited by 505
Self-citationThe promise of mRNA vaccines: a biotech and industrial perspective
Jackson, N. A. C., Kester, K. E., Casimiro, D., Gurunathan, S., & DeRosa, F. (2020) · npj Vaccines · doi:10.1038/s41541-020-0159-8 · Cited by 498
“[24] [25] [26] It has been demonstrated that successful protein production, minimal undesired inflammatory responses, and systemic adaptive immune responses could be achieved preclinically by using unmodified mRNA 27 through a combination of optimizing the coding sequence and removal of any unwanted inflammatory impur…”
BackgroundSelf-amplifying RNA vaccines for infectious diseases
Bloom, K., van den Berg, F., & Arbuthnot, P. (2021) · Gene Therapy · doi:10.1038/s41434-020-00204-y · Cited by 487
Röltgen, K., Nielsen, S. C. A., Silva, O., Younes, S. F., Zaslavsky, M., Costales, C., Yang, F., Wirz, O. F., Solis, D., Hoh, R. A., et al. (2022) · Cell · doi:10.1016/j.cell.2022.01.018 · Cited by 474
Self-citationA Comprehensive Review of mRNA Vaccines
Gote, V., Bolla, P. K., Kommineni, N., Butreddy, A., Nukala, P. K., Palakurthi, S. S., & Khan, W. (2023) · International Journal of Molecular Sciences · doi:10.3390/ijms24032700 · Cited by 457
Carrasco, M. J., Alishetty, S., Alameh, M., Said, H., Wright, L., Paige, M. A., Soliman, O. Y., Weissman, D., Cleveland, T. E., Grishaev, A., et al. (2021) · Communications Biology · doi:10.1038/s42003-021-02441-2 · Cited by 460
Self-citationLederer, K., Castaño, D., Gómez Atria, D., Oguin, T. H., Wang, S., Manzoni, T. B., Muramatsu, H., Hogan, M. J., Amanat, F., Cherubin, P., et al. (2020) · Immunity · doi:10.1016/j.immuni.2020.11.009 · Cited by 383
Self-citationLipid nanoparticle technology for therapeutic gene regulation in the liver
Witzigmann, D., Kulkarni, J. A., Leung, J., Chen, S., Cullis, P. R., & van der Meel, R. (2020) · Advanced Drug Delivery Reviews · doi:10.1016/j.addr.2020.06.026 · Cited by 376
Tailoring mRNA Vaccine to Balance Innate/Adaptive Immune Response
Linares-Fernández, S., Lacroix, C., Exposito, J.-Y., & Verrier, B. (2020) · Trends in Molecular Medicine · doi:10.1016/j.molmed.2019.10.002 · Cited by 376
mRNA therapeutics in cancer immunotherapy
Beck, J. D., Reidenbach, D., Salomon, N., Sahin, U., Türeci, Ö., Vormehr, M., & Kranz, L. M. (2021) · Molecular Cancer · doi:10.1186/s12943-021-01348-0 · Cited by 385
Laczko, D. I., Hogan, M. J., Toulmin, S. A., Hicks, P. D., Lederer, K., Gaudette, B. T., Castaño, D., Amanat, F., Muramatsu, H., Oguin, T. H., et al. (2020) · Immunity · doi:10.1016/j.immuni.2020.07.019 · Cited by 355
Self-citationA multivalent nucleoside-modified mRNA vaccine against all known influenza virus subtypes
Arevalo, C. P., Bolton, M. J., Sage, V. L., Ye, N., Furey, C., Muramatsu, H., Alameh, M., Pardi, N., Drapeau, E. M., Parkhouse, K., et al. (2022) · Science · doi:10.1126/science.abm0271 · Cited by 359
Self-citationD614G Spike Mutation Increases SARS CoV-2 Susceptibility to Neutralization
Weissman, D., Alameh, M.-G., de Silva, T., Collini, P., Hornsby, H., Brown, R., LaBranche, C. C., Edwards, R. J., Sutherland, L., Santra, S., et al. (2021) · Cell Host & Microbe · doi:10.1016/j.chom.2020.11.012 · Cited by 324
Self-citationStrategies for HIV-1 vaccines that induce broadly neutralizing antibodies
Haynes, B. F., Wiehe, K. J., Borrow, P., Saunders, K. O., Korber, B., Wagh, K., McMichael, A. J., Kelsoe, G. H., Hahn, B. H., Alt, F. W., et al. (2022) · Nature reviews. Immunology · doi:10.1038/s41577-022-00753-w · Cited by 375
Self-citationThree decades of messenger RNA vaccine development
Verbeke, R., Lentacker, I., De Smedt, S. C., & Dewitte, H. (2019) · Nano Today · doi:10.1016/j.nantod.2019.100766 · Cited by 342
COVID-19 mRNA vaccines: Platforms and current developments
Szabó, G. T., Mahiny, A. J., & Vlatkovic, I. (2022) · Molecular Therapy · doi:10.1016/j.ymthe.2022.02.016 · Cited by 308
Freyn, A. W., Ramos da Silva, J., Rosado, V. C., Bliss, C. M., Pine, M., Mui, B. L., Tam, Y. K., Madden, T. D., de Souza Ferreira, L. C., Weissman, D., et al. (2020) · Molecular Therapy · doi:10.1016/j.ymthe.2020.04.018 · Cited by 299
Self-citationCorrelates of protection against SARS ‐ CoV ‐2 infection and COVID‐19 disease
Goldblatt, D., Alter, G., Crotty, S., & Plotkin, S. A. (2022) · Immunological Reviews · doi:10.1111/imr.13091 · Cited by 301
Immune correlates of protection by mRNA-1273 vaccine against SARS-CoV-2 in nonhuman primates
Corbett, K. S., Nason, M. C., Flach, B., Gagne, M., O’Connell, S., Johnston, T. S., Shah, S. N., Edara, V. V., Floyd, K., Lai, L., et al. (2021) · Science · doi:10.1126/science.abj0299 · Cited by 286
Self-citationSARS-CoV-2 mRNA Vaccines: Immunological Mechanism and Beyond
Bettini, E., & Locci, M. (2021) · Vaccines · doi:10.3390/vaccines9020147 · Cited by 292
COVID-19: A review of therapeutic strategies and vaccine candidates
Izda, V., Jeffries, M. A., & Sawalha, A. H. (2020) · Clinical Immunology · doi:10.1016/j.clim.2020.108634 · Cited by 292
The Critical Contribution of Pseudouridine to mRNA COVID-19 Vaccines
Morais, P., Adachi, H., & Yu, Y. (2021) · Frontiers in Cell and Developmental Biology · doi:10.3389/fcell.2021.789427 · Cited by 281
mRNA Vaccines in the COVID-19 Pandemic and Beyond
Hogan, M. J., & Pardi, N. (2021) · Annual Review of Medicine · doi:10.1146/annurev-med-042420-112725 · Cited by 260
Self-citationRecent advances in mRNA-LNP therapeutics: immunological and pharmacological aspects
Kiaie, S. H., Zolbanin, N. M., Ahmadi, A., Bagherifar, R., Valizadeh, H., Kashanchi, F., & Jafari, R. (2022) · Journal of Nanobiotechnology · doi:10.1186/s12951-022-01478-7 · Cited by 269
Lipid Nanoparticles as Delivery Systems for RNA-Based Vaccines
Aldosari, B. N., Alfagih, I. M., & Almurshedi, A. S. (2021) · Pharmaceutics · doi:10.3390/pharmaceutics13020206 · Cited by 248
mRNA vaccines for infectious diseases — advances, challenges and opportunities
Pardi, N., & Krammer, F. (2024) · Nature Reviews Drug Discovery · doi:10.1038/s41573-024-01042-y · Cited by 252
Self-citationStrategies to reduce the risks of mRNA drug and vaccine toxicity
Bitounis, D., Jacquinet, E., Rogers, M. A., & Amiji, M. M. (2024) · Nature Reviews Drug Discovery · doi:10.1038/s41573-023-00859-3 · Cited by 242
A comprehensive review of SARS-CoV-2 vaccines: Pfizer, Moderna & Johnson & Johnson
Patel, R. S., Kaki, M., Potluri, V., Kahar, P., & Khanna, D. (2022) · Human Vaccines & Immunotherapeutics · doi:10.1080/21645515.2021.2002083 · Cited by 252
Roberti, M. P., Yonekura, S., Duong, C. P. M., Picard, M., Ferrere, G., Tidjani Alou, M., Rauber, C., Iebba, V., Lehmann, C. H. K., Amon, L., et al. (2020) · Nature Medicine · doi:10.1038/s41591-020-0882-8 · Cited by 208
Comparison of DNA and mRNA vaccines against cancer
Jahanafrooz, Z., Baradaran, B., Mosafer, J., Hashemzaei, M., Rezaei, T., Mokhtarzadeh, A., & Hamblin, M. R. (2019) · Drug Discovery Today · doi:10.1016/j.drudis.2019.12.003 · Cited by 202
Clinical and immunological effects of mRNA vaccines in malignant diseases
Heine, A., Juranek, S., & Brossart, P. (2021) · Molecular Cancer · doi:10.1186/s12943-021-01339-1 · Cited by 186
Germinal center responses to SARS-CoV-2 mRNA vaccines in healthy and immunocompromised individuals
(2022) · doi:10.1016/j.cell.2022.01.027 · Cited by 179
Self-citationWhitley, J., Zwolinski, C., Denis, C., Maughan, M., Hayles, L., Clarke, D., Snare, M., Liao, H., Chiou, S., Marmura, T., et al. (2021) · Translational research · doi:10.1016/j.trsl.2021.11.009 · Cited by 188
Self-citationRecent Advances in Lipid Nanoparticles for Delivery of mRNA
Yang, L., Gong, L., Wang, P., Zhao, X., Zhao, F. H., Zhang, Z., Li, Y., & Huang, W. (2022) · Pharmaceutics · doi:10.3390/pharmaceutics14122682 · Cited by 190
Prediction of lipid nanoparticles for mRNA vaccines by the machine learning algorithm
Wang, W., Feng, S., Ye, Z., Gao, H., Lin, J., & Ouyang, D. (2021) · Acta Pharmaceutica Sinica B · doi:10.1016/j.apsb.2021.11.021 · Cited by 173
The known unknowns of T cell immunity to COVID-19
Karlsson, A. C., Humbert, M., & Buggert, M. (2020) · Science Immunology · doi:10.1126/sciimmunol.abe8063 · Cited by 165
Zhang, P., Narayanan, E., Liu, Q., Tsybovsky, Y., Boswell, K. L., Ding, S., Hu, Z., Follmann, D. A., Lin, Y., Miao, H., et al. (2021) · Nature Medicine · doi:10.1038/s41591-021-01574-5 · Cited by 164
Short‐term outcome of pregnant women vaccinated with BNT162b2 mRNA COVID ‐19 vaccine
Bookstein-Peretz, S., Regev, N., Novick, L., Nachshol, M., Goffer, E., Ben‐David, A., Asraf, K., Doolman, R., Levin, E. G., Regev‐Yochay, G., et al. (2021) · Ultrasound in Obstetrics and Gynecology · doi:10.1002/uog.23729 · Cited by 164
Fix, O. K., Blumberg, E. A., Chang, K., Chu, J., Chung, R. T., Goacher, E. K., Hameed, B., Kaul, D. R., Kulik, L., Kwok, R. M., et al. (2021) · Hepatology · doi:10.1002/hep.31751 · Cited by 157
Immune Responses Induced by mRNA Vaccination in Mice, Monkeys and Humans
Cagigi, A., & Loré, K. (2021) · Vaccines · doi:10.3390/vaccines9010061 · Cited by 153
Immunological basis for enhanced immunity of nanoparticle vaccines
Kelly, H. G., Kent, S. J., & Wheatley, A. K. (2019) · Expert Review of Vaccines · doi:10.1080/14760584.2019.1578216 · Cited by 146
da Silva, J. R., Rodrigues, K. B., Pelegrin, G. F., Sales, N. S., Muramatsu, H., Silva, M. D. O., Porchia, B. F. M. M., Moreno, A. C. R., Aps, L. R. M. M., Venceslau-Carvalho, A. A., et al. (2023) · Science Translational Medicine · doi:10.1126/scitranslmed.abn3464 · Cited by 150
Self-citationNanotechnology-based strategies against SARS-CoV-2 variants
Huang, X., Kon, E., Han, X., Zhang, X., Kong, N., Mitchell, M. J., Peer, D., & Tao, W. (2022) · Nature Nanotechnology · doi:10.1038/s41565-022-01174-5 · Cited by 146
mRNA vaccination induces tick resistance and prevents transmission of the Lyme disease agent
Sajid, A., Matias, J., Arora, G., Kurokawa, C., DePonte, K., Tang, X., Lynn, G. E., Wu, M.-J., Pal, U., Strank, N. O., et al. (2021) · Science Translational Medicine · doi:10.1126/scitranslmed.abj9827 · Cited by 140
Self-citationKnife’s edge: Balancing immunogenicity and reactogenicity in mRNA vaccines
Lee, J., Woodruff, M. C., Kim, E. H., & Nam, J. (2023) · Experimental & Molecular Medicine · doi:10.1038/s12276-023-00999-x · Cited by 141
Li, J., Hui, A., Zhang, X., Yang, Y., Tang, R., Ye, H., Ji, R., Lin, M., Zhu, Z., Türeci, Ö., et al. (2021) · Nature Medicine · doi:10.1038/s41591-021-01330-9 · Cited by 133
Physiological Barriers and Strategies of Lipid‐Based Nanoparticles for Nucleic Acid Drug Delivery
Hu, M., Li, X., You, Z., Cai, R., & Chen, C. (2023) · Advanced Materials · doi:10.1002/adma.202303266 · Cited by 142
The immunostimulatory nature of mRNA lipid nanoparticles
Sharma, P., Hoorn, D., Aitha, A., Breier, D., & Peer, D. (2024) · Advanced Drug Delivery Reviews · doi:10.1016/j.addr.2023.115175 · Cited by 132
mRNA as novel technology for passive immunotherapy
Schlake, T., Theß, A., Thran, M., & Jordan, I. (2018) · Cellular and Molecular Life Sciences · doi:10.1007/s00018-018-2935-4 · Cited by 135
Lipid carriers for mRNA delivery
Zhang, W., Jiang, Y., He, Y., Boucetta, H., Wu, J., Chen, Z., & He, W. (2022) · Acta Pharmaceutica Sinica B · doi:10.1016/j.apsb.2022.11.026 · Cited by 133
Development and Delivery Systems of mRNA Vaccines
Liang, Y., Huang, L., & Liu, T. (2021) · Frontiers in Bioengineering and Biotechnology · doi:10.3389/fbioe.2021.718753 · Cited by 130
An mRNA Vaccine Protects Mice against Multiple Tick-Transmitted Flavivirus Infections
VanBlargan, L. A., Himansu, S., Foreman, B. M., Ebel, G. D., Pierson, T. C., & Diamond, M. S. (2018) · Cell Reports · doi:10.1016/j.celrep.2018.11.082 · Cited by 123
SARS-CoV-2 (Covid-19) vaccines structure, mechanisms and effectiveness: A review
Fathizadeh, H., Afshar, S., Masoudi, M. R., Gholizadeh, P., Asgharzadeh, M., Ganbarov, K., Köse, Ş., Yousefi, M., & Kafil, H. S. (2021) · International Journal of Biological Macromolecules · doi:10.1016/j.ijbiomac.2021.08.076 · Cited by 125
mRNA Vaccines: The Dawn of a New Era of Cancer Immunotherapy
Deng, Z., Tian, Y., Song, J., An, G., & Yang, P. (2022) · Frontiers in Immunology · doi:10.3389/fimmu.2022.887125 · Cited by 130
Pro-inflammatory concerns with lipid nanoparticles
Moghimi, S. M., & Simberg, D. (2022) · Molecular Therapy · doi:10.1016/j.ymthe.2022.04.011 · Cited by 124
Awasthi, S., Hook, L. M., Pardi, N., Wang, F., Myles, A., Cancro, M. P., Cohen, G. H., Weissman, D., & Friedman, H. M. (2019) · Science Immunology · doi:10.1126/sciimmunol.aaw7083 · Cited by 117
Self-citationConcerns about SARS-CoV-2 evolution should not hold back efforts to expand vaccination
Cobey, S. E., Larremore, D. B., Grad, Y. H., & Lipsitch, M. (2021) · Nature reviews. Immunology · doi:10.1038/s41577-021-00544-9 · Cited by 119
Kelly, H. G., Tan, H., Juno, J. A., Esterbauer, R., Ju, Y., Jiang, W., Wimmer, V. C., Duckworth, B. C., Groom, J. R., Caruso, F., et al. (2020) · JCI Insight · doi:10.1172/jci.insight.136653 · Cited by 116
A Dengue Virus Serotype 1 mRNA-LNP Vaccine Elicits Protective Immune Responses
Wollner, C. J., Richner, M., Hassert, M., Pinto, A. K., Brien, J. D., & Richner, J. M. (2021) · Journal of Virology · doi:10.1128/jvi.02482-20 · Cited by 120
Nanotechnology-empowered vaccine delivery for enhancing CD8+ T cells-mediated cellular immunity
Liu, G., Zhu, M., Zhao, X., & Nie, G. (2021) · Advanced Drug Delivery Reviews · doi:10.1016/j.addr.2021.113889 · Cited by 114
mRNA delivery systems for cancer immunotherapy: Lipid nanoparticles and beyond
Sentí, M. E., del Valle, L. G., & Schiffelers, R. M. (2024) · Advanced Drug Delivery Reviews · doi:10.1016/j.addr.2024.115190 · Cited by 118
Wu, L., Li, X., Qian, X., Wang, S., Liu, J., & Yan, J. (2024) · Vaccines · doi:10.3390/vaccines12020186 · Cited by 126
Engineering of the current nucleoside-modified mRNA-LNP vaccines against SARS-CoV-2
Granados-Riveron, J. T., & Aquino‐Jarquín, G. (2021) · Biomedicine & Pharmacotherapy · doi:10.1016/j.biopha.2021.111953 · Cited by 115
Future considerations for the mRNA-lipid nanoparticle vaccine platform
Igyártó, B. Z., Jacobsen, S., & Ndeupen, S. (2021) · Current Opinion in Virology · doi:10.1016/j.coviro.2021.03.008 · Cited by 108
Negrea, L. A., & Rovin, B. H. (2021) · Kidney International · doi:10.1016/j.kint.2021.03.002 · Cited by 105
Characterization of HIV-1 Nucleoside-Modified mRNA Vaccines in Rabbits and Rhesus Macaques
Pardi, N., LaBranche, C. C., Ferrari, G., Cain, D. W., Tombácz, I., Parks, R. J., Muramatsu, H., Mui, B. L., Tam, Y. K., Karikó, K., et al. (2019) · Molecular Therapy - Nucleic Acids · doi:10.1016/j.omtn.2019.03.003 · Cited by 103
Self-citationOmo‐Lamai, S., Wang, Y., Patel, M. N., Milosavljevic, A., Zuschlag, D. W., Poddar, S., Wu, J., Wang, L., Dong, F., Espy, C. L., et al. (2025) · Nature Nanotechnology · doi:10.1038/s41565-025-01974-5 · Cited by 170
Protection against SARS-CoV-2 Beta variant in mRNA-1273 vaccine–boosted nonhuman primates
Corbett, K. S., Gagné, M., Wagner, D. A., Connell, S. O., Narpala, S., Flebbe, D. R., Andrew, S. F., Davis, R. L., Flynn, B. J., Johnston, T. S., et al. (2021) · Science · doi:10.1126/science.abl8912 · Cited by 98
Self-citationApproved and marketed nanoparticles for disease targeting and applications in COVID-19
Abdellatif, A. A. H., & Alsowinea, A. F. (2021) · Nanotechnology Reviews · doi:10.1515/ntrev-2021-0115 · Cited by 105
DiPiazza, A. T., Leist, S. R., Abiona, O. M., Moliva, J. I., Werner, A. P., Minai, M., Nagata, B. M., Bock, K. W., Phung, E., Schäfer, A., et al. (2021) · Immunity · doi:10.1016/j.immuni.2021.06.018 · Cited by 92
Single-cell profiling of T and B cell repertoires following SARS-CoV-2 mRNA vaccine
Sureshchandra, S., Lewis, S. A., Doratt, B. M., Jankeel, A., Coimbra Ibraim, I., & Messaoudi, I. (2021) · JCI Insight · doi:10.1172/jci.insight.153201 · Cited by 91
The advances of adjuvants in mRNA vaccines
Xie, C., Yao, R., & Xia, X. (2023) · npj Vaccines · doi:10.1038/s41541-023-00760-5 · Cited by 102
Anti-PfGARP activates programmed cell death of parasites and reduces severe malaria
Raj, D. K., Das Mohapatra, A., Jnawali, A., Zuromski, J., Jha, A., Cham-Kpu, G., Sherman, B., Rudlaff, R. M., Nixon, C. E., Hilton, N., et al. (2020) · Nature · doi:10.1038/s41586-020-2220-1 · Cited by 93
Self-citationEnlisting the mRNA Vaccine Platform to Combat Parasitic Infections
Versteeg, L., Almutairi, M. M., Hotez, P. J., & Pollet, J. B. K. (2019) · Vaccines · doi:10.3390/vaccines7040122 · Cited by 94
Saunders, K. O., Pardi, N., Parks, R., Santra, S., Mu, Z., Sutherland, L. L., Scearce, R. M., Barr, M., Eaton, A., Hernandez, G. E., et al. (2021) · npj Vaccines · doi:10.1038/s41541-021-00307-6 · Cited by 91
Self-citationWang, X., Liu, C., Rcheulishvili, N., Papukashvili, D., Xie, F., Zhao, J., Hu, X., Yu, K., Yang, N., Pan, X., et al. (2023) · npj Vaccines · doi:10.1038/s41541-023-00672-4 · Cited by 94
Current approaches to HIV vaccine development: a narrative review
Kim, J., Vasan, S., Kim, J. H., & Ake, J. A. (2021) · Journal of the International AIDS Society · doi:10.1002/jia2.25793 · Cited by 88
Melo, M., Porter, E., Zhang, Y., Silva, M., Li, N., Dobosh, B., Liguori, A., Skog, P., Landais, E., Menis, S., et al. (2019) · Molecular Therapy · doi:10.1016/j.ymthe.2019.08.007 · Cited by 88
Huang, Q., Zeng, J., & Yan, J. (2021) · Journal of genetics and genomics/Journal of Genetics and Genomics · doi:10.1016/j.jgg.2021.02.006 · Cited by 91
Pardi, N., Carreño, J. M., O’Dell, G., Tan, J., Bajusz, C., Muramatsu, H., Rijnink, W. F., Strohmeier, S., Loganathan, M., Bielak, D. A., et al. (2022) · Nature Communications · doi:10.1038/s41467-022-32149-8 · Cited by 87
Self-citationmRNA Vaccine Development for Emerging Animal and Zoonotic Diseases
Le, T., Sun, C., Chang, J., Zhang, G., & Yin, X. (2022) · Viruses · doi:10.3390/v14020401 · Cited by 99
Metadata
- Authors
- Pardi, N., Hogan, M. J., Naradikian, M. S., Parkhouse, K., Cain, D. W., Jones, L., Moody, M. A., Verkerke, H. P., Myles, A., Willis, E., LaBranche, C. C., Montefiori, D. C., Lobby, J. L., Saunders, K. O., Liao, H.-X., Korber, B. T., Sutherland, L. L., Scearce, R. M., Hraber, P. T., Tombácz, I., Muramatsu, H., Ni, H., Balikov, D. A., Li, C., Mui, B. L., Tam, Y. K., Krammer, F., Karikó, K., Polacino, P., Eisenlohr, L. C., Madden, T. D., Hope, M. J., Lewis, M. G., Lee, K. K., Hu, S.-L., Hensley, S. E., Cancro, M. P., Haynes, B. F., & Weissman, D.
- Affiliations
- University of Pennsylvania (US)
- Duke University (US)
- University of Washington (US)
- Duke Medical Center (US)
- Children's Hospital of Philadelphia (US)
- Los Alamos National Laboratory (US)
- Department of Medicine, University of Pennsylvania, Philadelphia, PA 1
- Acuitas Therapeutics (Canada) (CA)
- Icahn School of Medicine at Mount Sinai (US)
- BioNTech (Germany) (DE)
- Bioqual (US)
- Corresponding author
- Weissman, Drew
- ORCID
- Pardi, Norbert
- Hogan, Michael J.
- Naradikian, Martin S.
- Parkhouse, Kaela
- Cain, Derek W.
- Jones, Letitia
- Moody, M. Anthony
- Verkerke, Hans P.
- Willis, Elinor
- LaBranche, Celia C.
- Montefiori, David C.
- Lobby, Jenna L.
- Saunders, Kevin O.
- Liao, Hua-Xin
- Korber, Bette T.
- Sutherland, Laura L.
- Scearce, Richard M.
- Hraber, Peter T.
- Tombácz, István
- Muramatsu, Hiromi
- Ni, Houping
- Balikov, Daniel A.
- Mui, Barbara L.
- Tam, Ying K.
- Krammer, Florian
- Karikó, Katalin
- Eisenlohr, Laurence C.
- Lewis, Mark G.
- Lee, Kelly K.
- Hu, Shiu-Lok
- Hensley, Scott E.
- Cancro, Michael P.
- Haynes, Barton F.
- Weissman, Drew
- Venue
- Journal of Experimental Medicine
- Publisher
- Rockefeller University Press
- Published
- 2018-05-08
- Volume
- 215
- Issue
- 6
- Pages
- 1571-1588
- ISSN
- 0022-1007 (ISSN-L)
- 1540-9538
- PMC
- PMC5987916
- OpenAlex
- W2802953285
- Cited by
- 530
- References
- 56
- Citations by year
- 2026: 58 · 2025: 51 · 2024: 77 · 2023: 65 · 2022: 93 · 2021: 118 · 2020: 40 · 2019: 22 · 2018: 6
- FWCI
- 19.84
- Type
- journal article
- Language
- en
- Open access
- hybrid
- doi.org
- Licence
- Locations
- The Journal of Experimental Medicine (publishedVersion, cc-by-nc-sa)
- Europe PMC (PubMed Central) (publishedVersion, cc-by-nc-sa)
- PubMed Central (publishedVersion, cc-by-nc-sa)
- PubMed (publishedVersion)
- OSTI OAI (U.S. Department of Energy Office of Scientific and Technical Information) (submittedVersion)
- Funders
- National Institutes of Health (5T32AI055428-12, U19 AI109946-01, 5R01GM099989-04)
- U.S. Department of Defense (PR130769)
- National Institute of Allergy and Infectious Diseases (R01-AI050484, R01-AI124429, R01-AI084860, HHSN27201100016C)
- Gates Foundation (CAVD 0PP1033102, CAVD OPP1033102)
- Takeda Pharmaceuticals U.S.A
- Center for Global Health (OPP1126258)
- Topics
- Life Sciences › Immunology and Microbiology › Immunology › Immunotherapy and Immune Responses
- Life Sciences › Biochemistry, Genetics and Molecular Biology › Molecular Biology › RNA Interference and Gene Delivery
- Health Sciences › Medicine › Infectious Diseases › SARS-CoV-2 and COVID-19 Research
- Keywords
- nucleoside-modified mRNA, mRNA vaccines, lipid nanoparticles, T follicular helper cells, germinal center B cells, intradermal vaccination, neutralizing antibodies, affinity maturation, memory B cells, viral surface antigens, non-human primates, vaccine adjuvants
- MeSH terms
- Adjuvants, Immunologic, Animals, Antibody Formation, Antigens, B-Lymphocytes, T-Lymphocytes, Helper-Inducer, Lipids, Macaca mulatta, Nucleosides, RNA, Messenger, Time Factors, Vaccination, Germinal Center, Protein Subunits, Vaccines, Subunit, Nanoparticles, Antibodies, Neutralizing
About these checks
Registry, retraction, Cites and statistics results are computed, not judged, with one exception: a printed reference that no index lists is read once by a model before it counts as a citation error. Claims are extracted by a model and kept only when their quote appears verbatim in the text; each cited source is then checked, with a model’s help, for whether it says what the claim relies on. Those verdicts can be wrong — read the claim’s quote and the cited source before relying on one.
Statistics and arithmetic are recomputed, not judged.
Confidence bands are shown only for fields calibrated on our annotated test set. None is calibrated yet, so no band is shown.
What counts as a claim ›How we measure confidence ›How we check this ›
Are you an author, or do you see a problem with this page? Request a review
