

The DOI matches its Crossref record; 60 of the 63 references it cites were found in a registry or an index.
Scater: pre-processing, quality control, normalization and visualization of single-cell RNA-seq data in R
Open accessPublished version of a preprint
Abstract
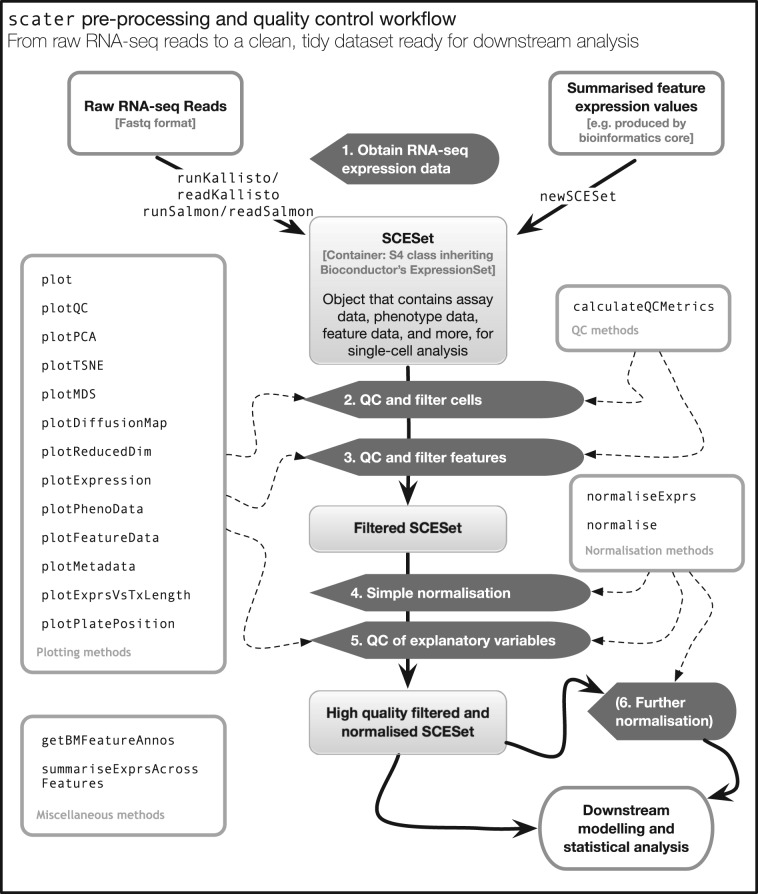
Motivation: Single-cell RNA sequencing (scRNA-seq) is increasingly used to study gene expression at the level of individual cells. However, preparing raw sequence data for further analysis is not a straightforward process. Biases, artifacts and other sources of unwanted variation are present in the data, requiring substantial time and effort to be spent on pre-processing, quality control (QC) and normalization. Results: We have developed the R/Bioconductor package scater to facilitate rigorous pre-processing, quality control, normalization and visualization of scRNA-seq data. The package provides a convenient, flexible workflow to process raw sequencing reads into a high-quality expression dataset ready for downstream analysis. scater provides a rich suite of plotting tools for single-cell data and a flexible data structure that is compatible with existing tools and can be used as infrastructure for future software development. Availability and Implementation: The open-source code, along with installation instructions, vignettes and case studies, is available through Bioconductor at http://bioconductor.org/packages/scater. Supplementary information: Supplementary data are available at Bioinformatics online.
Overview
The claims and statistics of this paper haven’t been checked yet.
Run the check — free, no account needed. It reads the open-access text and checks the sources it cites.
Integrity signals
Registry
Cites
Statistics
Figures
Verification
Claims the paper makes
The claims and statistics of this paper haven’t been checked yet.
Run the check — free, no account needed. It reads the open-access text and checks the sources it cites.
Claims other papers make about this one
Each is checked against this paper’s own text: does it say what the citing paper says it does?
In the citing paper
“Cell level quality control and cell filtering was performed in scater (112).”
From Non-neuronal expression of SARS-CoV-2 entry genes in the olfactory system suggests mechanisms underlying COVID-19-associated anosmia (2020) · cites this paper as [112]
In the citing paper
“Inspection of all datasets for batch effects was performed using the scater package (version 1.10.1) (112).”
From Non-neuronal expression of SARS-CoV-2 entry genes in the olfactory system suggests mechanisms underlying COVID-19-associated anosmia (2020) · cites this paper as [112]
In the citing paper
“Popular platforms such as Seurat (Butler et al, 2018), Scater (McCarthy et al, 2017), or Scanpy (Wolf et al, 2018) provide integrated environments to develop pipelines and contain large analysis toolboxes. However, out of necessity these platforms limit themselves to tools developed in their respective programming languages.”
From Current best practices in single-cell RNA-seq analysis: a tutorial (2019) · cites this paper as McCarthy et al, 2017
In the citing paper
“Among command line platforms, Scater (McCarthy et al, 2017) and Seurat (Butler et al, 2018) easily interface with the large variety of analysis tools available via the R Bioconductor project (Huber et al, 2015).”
From Current best practices in single-cell RNA-seq analysis: a tutorial (2019) · cites this paper as McCarthy et al, 2017
In the citing paper
“Currently available platforms exist on the command line in R (McCarthy et al, 2017; Butler et al, 2018) or Python (Wolf et al, 2018), and as local applications (Patel, 2018; preprint: Scholz et al, 2018) or Web servers (Gardeux et al, 2017; Zhu et al, 2017) with graphical user interfaces (GUIs).”
From Current best practices in single-cell RNA-seq analysis: a tutorial (2019) · cites this paper as McCarthy et al, 2017
Self-check
Percentages, sums and reported differences re-computed from the paper’s own numbers.
The self-check needs the paper’s full text.
Citations
Cites
Fast gapped-read alignment with Bowtie 2
Langmead, B., & Salzberg, S. L. (2012) · Nature Methods · doi:10.1038/nmeth.1923 · Cited by 56,400
Robinson, M. D., McCarthy, D. J., & Smyth, G. K. (2010) · Bioinformatics · doi:10.1093/bioinformatics/btp616 · Cited by 41,364
Self-citationlimma powers differential expression analyses for RNA-sequencing and microarray studies
Ritchie, M. E., Phipson, B., Wu, D., Hu, Y., Law, C. W., Shi, W., & Smyth, G. K. (2015) · Nucleic Acids Research · doi:10.1093/nar/gkv007 · Cited by 40,458
Wickham, H. (2016) · Use R! · doi:10.1007/978-3-319-24277-4 · Cited by 34,873
(2008) · Journal of Machine Learning Research · Cited by 33,051
featureCounts: an efficient general purpose program for assigning sequence reads to genomic features
Liao, Y., Smyth, G. K., & Shi, W. (2014) · Bioinformatics · doi:10.1093/bioinformatics/btt656 · Cited by 27,219
HTSeq—a Python framework to work with high-throughput sequencing data
Anders, S., Pyl, P. T., & Huber, W. (2015) · Bioinformatics · doi:10.1093/bioinformatics/btu638 · Cited by 21,464
Differential expression analysis for sequence count data
Anders, S., & Huber, W. (2010) · Genome Biology · doi:10.1186/gb-2010-11-10-r106 · Cited by 15,581
Salmon provides fast and bias-aware quantification of transcript expression
Patro, R., Duggal, G., Love, M. I., Irizarry, R. A., & Kingsford, C. (2017) · Nature Methods · doi:10.1038/nmeth.4197 · Cited by 12,700
Kim, D., Pertea, G., Trapnell, C., Pimentel, H., Kelley, R., & Salzberg, S. L. (2013) · Genome Biology · doi:10.1186/gb-2013-14-4-r36 · Cited by 12,668
Research works printed but not linked: 2
- Campbell, 2016, Ouija: Incorporating prior knowledge in single-cell trajectory learning using Bayesian nonlinear factor analysis, bioRxiv, 060442
- Hicks, 2015, On the widespread and critical impact of systematic bias and batch effects in single-cell RNA-Seq data, bioRxiv, 025528
Cited by
Sorted by citations
SCANPY: large-scale single-cell gene expression data analysis
Wolf, F. A., Angerer, P., & Theis, F. J. (2018) · Genome Biology · doi:10.1186/s13059-017-1382-0 · Cited by 8,881
Scenic: single-cell regulatory network inference and clustering.
Aibar, S., González-Blas, C. B., Moerman, T., Huynh-Thu, V. A., Imrichova, H., Hulselmans, G., Rambow, F., Marine, J.-C., Geurts, P., Aerts, J., et al. (2017) · Nature Methods · doi:10.1038/nmeth.4463 · Cited by 6,520
Dictionary learning for integrative, multimodal and scalable single-cell analysis
Hao, Y., Stuart, T., Kowalski, M. H., Choudhary, S., Hoffman, P., Hartman, A., Srivastava, A., Molla, G., Madad, S., Fernandez-Granda, C., et al. (2024) · Nature Biotechnology · doi:10.1038/s41587-023-01767-y · Cited by 5,631
Current best practices in single-cell RNA-seq analysis: a tutorial
Luecken, M. D., & Theis, F. J. (2019) · Molecular Systems Biology · doi:10.15252/msb.20188746 · Cited by 2,231
Resolving the fibrotic niche of human liver cirrhosis at single-cell level
Ramachandran, P., Dobie, R., Wilson-Kanamori, J. R., Dora, E. F., Henderson, B. E. P., Luu, N. T., Portman, J. R., Matchett, K. P., Brice, M., Marwick, J. A., et al. (2019) · Nature · doi:10.1038/s41586-019-1631-3 · Cited by 1,784
cGAS surveillance of micronuclei links genome instability to innate immunity
Mackenzie, K. J., Carroll, P., Martin, C.-A., Murina, O., Fluteau, A., Simpson, D. J., Olova, N., Sutcliffe, H., Rainger, J. K., Leitch, A., et al. (2017) · Nature · doi:10.1038/nature23449 · Cited by 1,752
Landscape and Dynamics of Single Immune Cells in Hepatocellular Carcinoma
Zhang, Q., He, Y., Luo, N., Patel, S. J., Han, Y., Gao, R., Modak, M., Carotta, S., Haslinger, C., Kind, D., et al. (2019) · Cell · doi:10.1016/j.cell.2019.10.003 · Cited by 1,624
A step-by-step workflow for low-level analysis of single-cell RNA-seq data
Lun, A. T. L., McCarthy, D. J., & Marioni, J. C. (2016) · F1000Research · doi:10.12688/f1000research.9501.1 · Cited by 1,551
Self-citationSC3: consensus clustering of single-cell RNA-seq data
Kiselev, V. Y., Kirschner, K., Schaub, M. T., Andrews, T., Yiu, A., Chandra, T., Natarajan, K. N., Reik, W., Barahona, M., Green, A. R., et al. (2017) · Nature Methods · doi:10.1038/nmeth.4236 · Cited by 1,500
Using clusterProfiler to characterize multiomics data
Xu, S., Hu, E., Cai, Y., Xie, Z., Luo, X. M., Zhan, L., Tang, W., Wang, Q., Liu, B., Wang, R., et al. (2024) · Nature Protocols · doi:10.1038/s41596-024-01020-z · Cited by 1,528
Benchmarking atlas-level data integration in single-cell genomics
Luecken, M. D., Büttner, M., Chaichoompu, K., Danese, A., Interlandi, M., Mueller, M. F., Strobl, D. C., Zappia, L., Dugas, M., Colomé-Tatché, M., et al. (2022) · Nature Methods · doi:10.1038/s41592-021-01336-8 · Cited by 1,438
Transcriptome-scale spatial gene expression in the human dorsolateral prefrontal cortex
Maynard, K. R., Collado-Torres, L., Weber, L. M., Uytingco, C., Barry, B. K., Williams, S. R., Catallini, J. L., Tran, M. N., Besich, Z., Tippani, M., et al. (2021) · Nature Neuroscience · doi:10.1038/s41593-020-00787-0 · Cited by 1,222
Brann, D. H., Tsukahara, T., Weinreb, C., Lipovsek, M., Van den Berge, K., Gong, B., Chance, R., Macaulay, I. C., Chou, H.-J., Fletcher, R. B., et al. (2020) · Science Advances · doi:10.1126/sciadv.abc5801 · Cited by 1,198
A practical guide to single-cell RNA-sequencing for biomedical research and clinical applications
Haque, A., Engel, J., Teichmann, S. A., & Lönnberg, T. (2017) · Genome Medicine · doi:10.1186/s13073-017-0467-4 · Cited by 1,071
Lun, A. T. L., Riesenfeld, S. J., Andrews, T. S., Dao, T. P., Gomes, T., Jamboree, P. I. T. 1. H. C. A., & Marioni, J. C. (2019) · Genome biology · doi:10.1186/s13059-019-1662-y · Cited by 1,072
Self-citationSpatial transcriptomics at subspot resolution with BayesSpace
Zhao, E. J., Stone, M. R., Ren, X., Guenthoer, J., Smythe, K. S., Pulliam, T., Williams, S. R., Uytingco, C. R., Taylor, S. E. B., Nghiem, P., et al. (2021) · Nature Biotechnology · doi:10.1038/s41587-021-00935-2 · Cited by 1,032
Spatial proteogenomics reveals distinct and evolutionarily conserved hepatic macrophage niches
Guilliams, M., Bonnardel, J., Haest, B., Vanderborght, B., Wagner, C., Remmerie, A., Bujko, A., Martens, L., Thoné, T., Browaeys, R., et al. (2022) · Cell · doi:10.1016/j.cell.2021.12.018 · Cited by 985
Comprehensive functional genomic resource and integrative model for the human brain
Wang, D., Liu, S., Warrell, J., Won, H., Shi, X., Navarro, F. C. P., Clarke, D., Gu, M., Emani, P., Yang, Y. T., et al. (2018) · Science · doi:10.1126/science.aat8464 · Cited by 965
Orchestrating single-cell analysis with Bioconductor
Amezquita, R. A., Lun, A. T. L., Becht, E., Carey, V. J., Carpp, L. N., Geistlinger, L., Marini, F., Rue-Albrecht, K., Risso, D., Soneson, C., et al. (2020) · Nature Methods · doi:10.1038/s41592-019-0654-x · Cited by 945
Self-citationSingle-Cell RNA-Seq Technologies and Related Computational Data Analysis
Chen, G., Ning, B., & Shi, T. (2019) · Frontiers in Genetics · doi:10.3389/fgene.2019.00317 · Cited by 966
Splatter: simulation of single-cell RNA sequencing data
Zappia, L., Phipson, B., & Oshlack, A. (2017) · Genome Biology · doi:10.1186/s13059-017-1305-0 · Cited by 905
Chen, Y., Chen, L., Lun, A. T. L., Baldoni, P. L., & Smyth, G. K. (2025) · Nucleic Acids Research · doi:10.1093/nar/gkaf018 · Cited by 951
Self-citationSelf-Renewing Resident Cardiac Macrophages Limit Adverse Remodeling Following Myocardial Infarction
Dick, S. A., Macklin, J. A., Nejat, S., Momen, A., Clemente-Casares, X., Althagafi, M. G., Chen, J., Kantores, C., Hosseinzadeh, S., Aronoff, L., et al. (2019) · Nature Immunology · doi:10.1038/s41590-018-0272-2 · Cited by 883
A Single-Cell Transcriptome Atlas of the Aging Drosophila Brain
Davie, K., Janssens, J., Koldere, D., De Waegeneer, M., Pech, U., Kreft, Ł., Aibar, S., Makhzami, S., Christiaens, V., Bravo González-Blas, C., et al. (2018) · Cell · doi:10.1016/j.cell.2018.05.057 · Cited by 840
A Python library for probabilistic analysis of single-cell omics data
Gayoso, A., Lopez, R., Xing, G., Boyeau, P., Valiollah Pour Amiri, V., Hong, J., Wu, K., Jayasuriya, M., Mehlman, E., Langevin, M., et al. (2022) · Nature Biotechnology · doi:10.1038/s41587-021-01206-w · Cited by 789
Toward Minimal Residual Disease-Directed Therapy in Melanoma
Rambow, F., Rogiers, A., Marin-Bejar, O., Aibar, S., Femel, J., Dewaele, M., Karras, P., Brown, D., Chang, Y. H., Debiec-Rychter, M., et al. (2018) · Cell · doi:10.1016/j.cell.2018.06.025 · Cited by 771
Bias, robustness and scalability in single-cell differential expression analysis
Soneson, C., & Robinson, M. D. (2018) · Nature Methods · doi:10.1038/nmeth.4612 · Cited by 770
Structural Remodeling of the Human Colonic Mesenchyme in Inflammatory Bowel Disease
Kinchen, J., Chen, H. H., Parikh, K., Antanaviciute, A., Jagielowicz, M., Fawkner-Corbett, D., Ashley, N., Cubitt, L., Mellado-Gomez, E., Attar, M., et al. (2018) · Cell · doi:10.1016/j.cell.2018.08.067 · Cited by 745
Self-citationTREM2 regulates microglial cholesterol metabolism upon chronic phagocytic challenge
Nugent, A. A., Lin, K., van Lengerich, B., Lianoglou, S., Przybyla, L., Davis, S. S., Llapashtica, C., Wang, J., Kim, D. J., Xia, D., et al. (2020) · Neuron · doi:10.1016/j.neuron.2019.12.007 · Cited by 745
scmap: projection of single-cell RNA-seq data across data sets
(2018) · doi:10.1038/nmeth.4644 · Cited by 735
A general and flexible method for signal extraction from single-cell RNA-seq data
Risso, D., Perraudeau, F., Gribkova, S., Dudoit, S., & Vert, J.-P. (2018) · Nature Communications · doi:10.1038/s41467-017-02554-5 · Cited by 718
Denisenko, E., Guo, B. B., Jones, M., Hou, R., de Kock, L., Lassmann, T., Poppe, D., Clément, O., Simmons, R. K., Lister, R., et al. (2020) · Genome Biology · doi:10.1186/s13059-020-02048-6 · Cited by 686
Functional characterization of the dural sinuses as a neuroimmune interface
Rustenhoven, J., Drieu, A., Mamuladze, T., de Lima, K. A., Dykstra, T., Wall, M., Papadopoulos, Z., Kanamori, M., Salvador, A. F., Baker, W., et al. (2021) · Cell · doi:10.1016/j.cell.2020.12.040 · Cited by 685
Molecular topography of an entire nervous system
Taylor, S. R., Santpere, G., Weinreb, A., Barrett, A., Reilly, M. B., Xu, C., Varol, E., Oikonomou, P., Glenwinkel, L., McWhirter, R. D., et al. (2021) · Cell · doi:10.1016/j.cell.2021.06.023 · Cited by 696
Comparison and evaluation of statistical error models for scRNA-seq
Choudhary, S., & Satija, R. (2022) · Genome Biology · doi:10.1186/s13059-021-02584-9 · Cited by 634
Dysregulation of brain and choroid plexus cell types in severe COVID-19
Yang, A. C., Kern, F., Losada, P. M., Agam, M. R., Maat, C. A., Schmartz, G. P., Fehlmann, T., Stein, J. A., Schaum, N., Lee, D. P., et al. (2021) · Nature · doi:10.1038/s41586-021-03710-0 · Cited by 620
Bressan, D., Battistoni, G., & Hannon, G. J. (2023) · Science · doi:10.1126/science.abq4964 · Cited by 622
Single-cell transcriptomes of the regenerating intestine reveal a revival stem cell
Ayyaz, A., Kumar, S., Sangiorgi, B., Ghoshal, B., Gosio, J., Ouladan, S., Fink, M., Barutcu, S., Trcka, D., Shen, J., et al. (2019) · Nature · doi:10.1038/s41586-019-1154-y · Cited by 593
Self-organization and symmetry breaking in intestinal organoid development
Serra, D., Mayr, U., Boni, A., Lukonin, I., Rempfler, M., Challet Meylan, L., Stadler, M. B., Strnad, P., Papasaikas, P., Vischi, D., et al. (2019) · Nature · doi:10.1038/s41586-019-1146-y · Cited by 561
Rapid non-uniform adaptation to conformation-specific KRAS(G12C) inhibition
Xue, J. Y., Zhao, Y., Aronowitz, J., Mai, T. T., Vides, A., Qeriqi, B., Kim, D., Li, C., de Stanchina, E., Mazutis, L., et al. (2020) · Nature · doi:10.1038/s41586-019-1884-x · Cited by 543
CRISPR Interference-Based Platform for Multimodal Genetic Screens in Human iPSC-Derived Neurons
Tian, R., Gachechiladze, M. A., Ludwig, C. H., Laurie, M. T., Hong, J. Y., Nathaniel, D., Prabhu, A. V., Fernandopulle, M. S., Patel, R., Abshari, M., et al. (2019) · Neuron · doi:10.1016/j.neuron.2019.07.014 · Cited by 543
Crowell, H. L., Soneson, C., Germain, P.-L., Calini, D., Collin, L., Raposo, C., Malhotra, D., & Robinson, M. D. (2020) · Nature Communications · doi:10.1038/s41467-020-19894-4 · Cited by 515
A test metric for assessing single-cell RNA-seq batch correction
Büttner, M., Miao, Z., Wolf, F. A., Teichmann, S. A., & Theis, F. J. (2019) · Nature Methods · doi:10.1038/s41592-018-0254-1 · Cited by 511
The Galaxy platform for accessible, reproducible and collaborative biomedical analyses: 2020 update
Jalili, V., Afgan, E., Gu, Q., Clements, D., Blankenberg, D. J., Goecks, J., Taylor, J., & Nekrutenko, A. (2020) · Nucleic Acids Research · doi:10.1093/nar/gkaa434 · Cited by 528
Ireland, A. S., Micinski, A. M., Kastner, D. W., Guo, B., Wait, S. J., Spainhower, K. B., Conley, C. C., Chen, O. S., Guthrie, M. R., Soltero, D., et al. (2020) · Cancer Cell · doi:10.1016/j.ccell.2020.05.001 · Cited by 515
Progressive immune dysfunction with advancing disease stage in renal cell carcinoma
Braun, D. A., Street, K., Burke, K. P., Cookmeyer, D. L., Denize, T., Pedersen, C. B., Gohil, S. H., Schindler, N. R., Pomerance, L., Hirsch, L., et al. (2021) · Cancer Cell · doi:10.1016/j.ccell.2021.02.013 · Cited by 524
Molecular characterization of selectively vulnerable neurons in Alzheimer’s disease
Leng, K., Li, E., Eser, R., Piergies, A., Sit, R., Tan, M., Neff, N., Li, S. H., Rodriguez, R. D., Suemoto, C. K., et al. (2021) · Nature Neuroscience · doi:10.1038/s41593-020-00764-7 · Cited by 485
Feature selection and dimension reduction for single-cell RNA-Seq based on a multinomial model
Townes, F. W., Hicks, S. C., Aryee, M. J., & Irizarry, R. A. (2019) · Genome Biology · doi:10.1186/s13059-019-1861-6 · Cited by 471
High-throughput single-cell ChIP-seq identifies heterogeneity of chromatin states in breast cancer
Grosselin, K., Durand, A., Marsolier, J., Poitou, A., Marangoni, E., Nemati, F., Dahmani, A., Lameiras, S., Reyal, F., Frenoy, O., et al. (2019) · Nature Genetics · doi:10.1038/s41588-019-0424-9 · Cited by 466
Li, B., Zhang, W., Guo, C., Xu, H., Li, L., Fang, M., Hu, Y., Zhang, X., Yao, X., Tang, M., et al. (2022) · Nature Methods · doi:10.1038/s41592-022-01480-9 · Cited by 459
Benchmarking of cell type deconvolution pipelines for transcriptomics data
Avila Cobos, F., Alquicira-Hernandez, J., Powell, J. E., Mestdagh, P., & De Preter, K. (2020) · Nature Communications · doi:10.1038/s41467-020-19015-1 · Cited by 446
Meningeal lymphatics affect microglia responses and anti-Aβ immunotherapy
Da Mesquita, S., Papadopoulos, Z., Dykstra, T., Brase, L., Farias, F. G., Wall, M., Jiang, H., Kodira, C. D., de Lima, K. A., Herz, J., et al. (2021) · Nature · doi:10.1038/s41586-021-03489-0 · Cited by 431
Jacob, F., Pather, S. R., Huang, W., Zhang, F., Wong, S. Z. H., Zhou, H., Cubitt, B., Fan, W., Chen, C. Z., Xu, M., et al. (2020) · Cell stem cell · doi:10.1016/j.stem.2020.09.016 · Cited by 443
Single-cell transcriptomics uncovers zonation of function in the mesenchyme during liver fibrosis
Dobie, R., Wilson-Kanamori, J. R., Henderson, B. E. P., Smith, J. R., Matchett, K. P., Portman, J. R., Wallenborg, K., Picelli, S., Zagorska, A., Pendem, S. V., et al. (2019) · Cell Reports · doi:10.1016/j.celrep.2019.10.024 · Cited by 420
Meningeal γδ T cells regulate anxiety-like behavior via IL-17a signaling in neurons
Alves de Lima, K., Rustenhoven, J., Da Mesquita, S., Wall, M., Salvador, A. F., Smirnov, I., Martelossi Cebinelli, G., Mamuladze, T., Baker, W., Papadopoulos, Z., et al. (2020) · Nature Immunology · doi:10.1038/s41590-020-0776-4 · Cited by 416
Spatiotemporal immune zonation of the human kidney
Stewart, B. J., Ferdinand, J. R., Young, M. D., Mitchell, T. J., Loudon, K. W., Riding, A., Richoz, N., Frazer, G. L., Staniforth, J., Braga, F. A. V., et al. (2019) · Science · doi:10.1126/science.aat5031 · Cited by 424
ReactomeGSA - Efficient Multi-Omics Comparative Pathway Analysis
Griss, J., Viteri, G., Sidiropoulos, K., Nguyen, V., Fabregat, A., & Hermjakob, H. (2020) · Molecular & Cellular Proteomics · doi:10.1074/mcp.tir120.002155 · Cited by 418
Cholangiocyte organoids can repair bile ducts after transplantation in the human liver
Sampaziotis, F., Muraro, D., Tysoe, O. C., Sawiak, S., Beach, T. E., Godfrey, E. M., Upponi, S. S., Brevini, T., Wesley, B. T., Garcia-Bernardo, J., et al. (2021) · Science · doi:10.1126/science.aaz6964 · Cited by 394
Distinct contributions of partial and full EMT to breast cancer malignancy
Lüönd, F., Sugiyama, N., Bill, R., Bornes, L., Hager, C., Tang, F., Santacroce, N., Beisel, C., Ivánek, R., Bürglin, T. R., et al. (2021) · Developmental Cell · doi:10.1016/j.devcel.2021.11.006 · Cited by 405
Single-cell mapping of lineage and identity in direct reprogramming
Biddy, B. A., Kong, W., Kamimoto, K., Guo, C., Waye, S. E., Sun, T., & Morris, S. A. (2018) · Nature · doi:10.1038/s41586-018-0744-4 · Cited by 390
Sárvári, A. K., Hauwaert, E. L. V., Markussen, L. K., Gammelmark, E., Marcher, A.-B., Ebbesen, M. F., Nielsen, R., Brewer, J. R., Madsen, J. G. S., & Mandrup, S. (2020) · Cell Metabolism · doi:10.1016/j.cmet.2020.12.004 · Cited by 377
Enterococcus peptidoglycan remodeling promotes checkpoint inhibitor cancer immunotherapy
Griffin, M. E., Espinosa, J., Becker, J. L., Luo, J.-D., Carroll, T. S., Jha, J. K., Fanger, G. R., & Hang, H. C. (2021) · Science · doi:10.1126/science.abc9113 · Cited by 366
Transcriptional signature in microglia associated with Aβ plaque phagocytosis
Grubman, A., Choo, X. Y., Chew, G., Ouyang, J. F., Sun, G., Croft, N. P., Rossello, F. J., Simmons, R., Buckberry, S., Landin, D. V., et al. (2021) · Nature Communications · doi:10.1038/s41467-021-23111-1 · Cited by 357
Garrido-Trigo, A., Corraliza, A. M., Veny, M., Dotti, I., Melón-Ardanaz, E., Rill, A., Crowell, H. L., Corbí, A. L., Gudiño, V., Esteller, M., et al. (2023) · Nature Communications · doi:10.1038/s41467-023-40156-6 · Cited by 365
Fairfax, B. P., Taylor, C. A., Watson, R. A., Nassiri, I., Danielli, S., Fang, H., Mahé, E. A., Cooper, R. A., Woodcock, V. K., Traill, Z. C., et al. (2020) · Nature Medicine · doi:10.1038/s41591-019-0734-6 · Cited by 345
Cuomo, A. S. E., Seaton, D. D., McCarthy, D. J., Martinez, I., Bonder, M. J., Garcia-Bernardo, J., Amatya, S., Madrigal, P., Isaacson, A., Buettner, F., et al. (2020) · Nature Communications · doi:10.1038/s41467-020-14457-z · Cited by 331
Self-citationA blood atlas of COVID-19 defines hallmarks of disease severity and specificity
Ahern, D. J., Ai, Z., Ainsworth, M., Allan, C., Allcock, A., Angus, B., Ansari, M. A., Arancibia-Cárcamo, C. V., Aschenbrenner, D., Attar, M., et al. (2022) · Cell · doi:10.1016/j.cell.2022.01.012 · Cited by 328
Parenchymal border macrophages regulate the flow dynamics of the cerebrospinal fluid
Drieu, A., Du, S., Storck, S. E., Rustenhoven, J., Papadopoulos, Z., Dykstra, T., Zhong, F., Kim, K., Blackburn, S., Mamuladze, T., et al. (2022) · Nature · doi:10.1038/s41586-022-05397-3 · Cited by 325
GABA-Receptive Microglia Selectively Sculpt Developing Inhibitory Circuits
Favuzzi, E., Huang, S., Saldi, G.-A., Binan, L., Ibrahim, L. A., Fernández-Otero, M., Cao, Y., Zeine, A., Sefah, A., Zheng, K., et al. (2020) · Cell · doi:10.1016/j.cell.2021.06.018 · Cited by 327
Single-cell and spatial transcriptomics: deciphering brain complexity in health and disease
Piwecka, M., Rajewsky, N., & Rybak-Wolf, A. (2023) · Nature Reviews Neurology · doi:10.1038/s41582-023-00809-y · Cited by 320
Veglia, F., Hashimoto, A., Dweep, H., Sanseviero, E., Leo, A. D., Tcyganov, E. N., Kossenkov, A. V., Mulligan, C. G., Nam, B. T., Masters, G. A., et al. (2021) · The Journal of Experimental Medicine · doi:10.1084/jem.20201803 · Cited by 321
Single-cell RNA sequencing in cardiovascular development, disease and medicine
Paik, D. T., Cho, S., Tian, L., Chang, H. Y., & Wu, J. C. (2020) · Nature Reviews Cardiology · doi:10.1038/s41569-020-0359-y · Cited by 314
Tutorial: guidelines for the computational analysis of single-cell RNA sequencing data
Andrews, T. S., Kiselev, V. Y., McCarthy, D. J., & Hemberg, M. (2020) · Nature Protocols · doi:10.1038/s41596-020-00409-w · Cited by 323
Self-citationExploring the single-cell RNA-seq analysis landscape with the scRNA-tools database
Zappia, L., Phipson, B., & Oshlack, A. (2018) · PLoS Computational Biology · doi:10.1371/journal.pcbi.1006245 · Cited by 319
The Malaria Cell Atlas: Single parasite transcriptomes across the complete Plasmodium life cycle
Howick, V. M., Russell, A. J. C., Andrews, T. S., Heaton, H., Reid, A. J., Natarajan, K. N., Butungi, H., Metcalf, T., Verzier, L. H., Rayner, J. C., et al. (2019) · Science · doi:10.1126/science.aaw2619 · Cited by 318
Ruiz García, S., Deprez, M., Lebrigand, K., Cavard, A., Paquet, A., Arguel, M.-J., Magnone, V., Truchi, M., Caballero, I., Leroy, S., et al. (2019) · Development · doi:10.1242/dev.177428 · Cited by 297
A systematic performance evaluation of clustering methods for single-cell RNA-seq data
Duò, A., Robinson, M. D., & Soneson, C. (2018) · F1000Research · doi:10.12688/f1000research.15666.2 · Cited by 296
Brann, D. H., Tsukahara, T., Weinreb, C., Lipovsek, M., den Berge, K. V., Gong, B., Chance, R., Macaulay, I. C., Chou, H.-J., Fletcher, R., et al. (2020) · bioRxiv (Cold Spring Harbor Laboratory) · doi:10.1101/2020.03.25.009084 · Cited by 306
Joint analysis of heterogeneous single-cell RNA-seq dataset collections
Barkas, N., Petukhov, V., Nikolaeva, D., Lozinsky, Y., Demharter, S., Khodosevich, K., & Kharchenko, P. V. (2019) · Nature Methods · doi:10.1038/s41592-019-0466-z · Cited by 292
Andrews, L. P., Butler, S. C., Cui, J., Cillo, A. R., Cardello, C., Liu, C., Brunazzi, E. A., Baessler, A., Xie, B., Kunning, S. R., et al. (2024) · Cell · doi:10.1016/j.cell.2024.07.016 · Cited by 302
An end-to-end workflow for multiplexed image processing and analysis
Windhager, J., Zanotelli, V. R., Schulz, D., Meyer, L., Daniel, M., Bodenmiller, B., & Eling, N. (2023) · Nature Protocols · doi:10.1038/s41596-023-00881-0 · Cited by 301
Brain endothelial GSDMD activation mediates inflammatory BBB breakdown
Wei, C., Jiang, W., Wang, R., Zhong, H., He, H., Gao, X., Zhong, S., Yu, F., Guo, Q., Zhang, L., et al. (2024) · Nature · doi:10.1038/s41586-024-07314-2 · Cited by 296
Single-cell analysis of the cellular heterogeneity and interactions in the injured mouse spinal cord
Milich, L. M., Choi, J. S., Ryan, C. B., Cerqueira, S. R., Benavides, S., Yahn, S. L., Tsoulfas, P., & Lee, J. K. (2021) · The Journal of Experimental Medicine · doi:10.1084/jem.20210040 · Cited by 289
CHETAH: a selective, hierarchical cell type identification method for single-cell RNA sequencing
de Kanter, J. K., Lijnzaad, P., Candelli, T., Margaritis, T., & Holstege, F. C. P. (2019) · Nucleic Acids Research · doi:10.1093/nar/gkz543 · Cited by 283
Identification of direct connections between the dura and the brain
Smyth, L. C. D., Xu, D., Okar, S. V., Dykstra, T., Rustenhoven, J., Papadopoulos, Z., Bhasiin, K., Kim, M. W., Drieu, A., Mamuladze, T., et al. (2024) · Nature · doi:10.1038/s41586-023-06993-7 · Cited by 264
Single-nucleus RNA-seq identifies Huntington disease astrocyte states
Al-Dalahmah, O., Sosunov, A. A., Shaik, A., Ofori, K., Liu, Y., Vonsattel, J. P., Adorjan, I., Menon, V., & Goldman, J. E. (2020) · Acta Neuropathologica Communications · doi:10.1186/s40478-020-0880-6 · Cited by 264
Xu, X., Crow, M., Rice, B. R., Li, F., Harris, B. D., Liu, L., Demesa-Arévalo, E., Lu, Z., Wang, L., Fox, N., et al. (2021) · Developmental Cell · doi:10.1016/j.devcel.2020.12.015 · Cited by 261
An autoimmune stem-like CD8 T cell population drives type 1 diabetes
Gearty, S. V., Dündar, F., Zumbo, P., Espinosa-Carrasco, G., Shakiba, M., Sanchez-Rivera, F. J., Socci, N. D., Trivedi, P., Lowe, S. W., Lauer, P., et al. (2022) · Nature · doi:10.1038/s41586-021-04248-x · Cited by 257
Single-cell technologies in hepatology: new insights into liver biology and disease pathogenesis
Ramachandran, P., Matchett, K. P., Dobie, R., Wilson-Kanamori, J. R., & Henderson, N. C. (2020) · Nature Reviews Gastroenterology & Hepatology · doi:10.1038/s41575-020-0304-x · Cited by 253
Single-cell RNAseq reveals seven classes of colonic sensory neuron
Hockley, J. R. F., Taylor, T. S., Callejo, G., Wilbrey, A. L., Gutteridge, A., Bach, K., Winchester, W. J., Bulmer, D. C., McMurray, G., & Smith, E. S. J. (2018) · Gut · doi:10.1136/gutjnl-2017-315631 · Cited by 261
Differential IRF8 Requirement Defines Two Pathways of Dendritic Cell Development in Humans
Cytlak, U., Resteu, A., Pagan, S., Green, K., Milne, P., Maisuria, S., McDonald, D., Hulme, G., Filby, A. J., Carpenter, B., et al. (2019) · Immunity · doi:10.1016/j.immuni.2020.07.003 · Cited by 257
Hoch, T., Schulz, D., Eling, N., Gómez, J. M. M., Levesque, M. P., & Bodenmiller, B. (2022) · Science Immunology · doi:10.1126/sciimmunol.abk1692 · Cited by 253
ShinyCell: simple and sharable visualization of single-cell gene expression data
Ouyang, J. F., Kamaraj, U. S., Cao, E. Y., & Rackham, O. J. L. (2021) · Bioinformatics · doi:10.1093/bioinformatics/btab209 · Cited by 245
Spatially aware dimension reduction for spatial transcriptomics
Shang, L., & Zhou, X. (2022) · Nature Communications · doi:10.1038/s41467-022-34879-1 · Cited by 256
The neuropeptide VIP confers anticipatory mucosal immunity by regulating ILC3 activity
Seillet, C., Luong, K., Tellier, J., Jacquelot, N., Shen, R. D., Hickey, P. F., Wimmer, V. C., Whitehead, L. W., Rogers, K. L., Smyth, G. K., et al. (2019) · Nature Immunology · doi:10.1038/s41590-019-0567-y · Cited by 242
Macrophages provide a transient muscle stem cell niche via NAMPT secretion
Ratnayake, D., Nguyen, P. D., Rossello, F. J., Wimmer, V. C., Tan, J. L., Galvis, L. A., Julier, Z., Wood, A. J., Boudier, T., Isiaku, A. I., et al. (2021) · Nature · doi:10.1038/s41586-021-03199-7 · Cited by 239
Single-cell analysis reveals congruence between kidney organoids and human fetal kidney
Combes, A. N., Phipson, B., Zappia, L., Lawlor, K. T., Er, P. X., Oshlack, A., & Little, M. H. (2019) · Genome Medicine · doi:10.1186/s13073-019-0615-0 · Cited by 235
Tietscher, S., Wagner, J., Anzeneder, T., Langwieder, C., Rees, M., Sobottka, B., de Souza, N., & Bodenmiller, B. (2023) · Nature Communications · doi:10.1038/s41467-022-35238-w · Cited by 233
Comparison of clustering tools in R for medium-sized 10x Genomics single-cell RNA-sequencing data
Freytag, S., Tian, L., Lönnstedt, I., Ng, M., & Bahlo, M. (2018) · F1000Research · doi:10.12688/f1000research.15809.1 · Cited by 220
Tran, M. N., Maynard, K. R., Spangler, A., Huuki, L. A., Montgomery, K. D., Sadashivaiah, V., Tippani, M., Barry, B. K., Hancock, D. B., Hicks, S. C., et al. (2021) · Neuron · doi:10.1016/j.neuron.2021.09.001 · Cited by 219
Metadata
- Authors
- McCarthy, D. J., Campbell, K. R., Lun, A. T. L., & Wills, Q. F.
- Affiliations
- European Bioinformatics Institute (GB)
- Centre for Human Genetics (GB)
- University of Cambridge (GB)
- Corresponding author
- McCarthy, Davis J
- Venue
- Bioinformatics
- Publisher
- Oxford University Press (OUP)
- Published
- 2017-01-14
- Volume
- 33
- Issue
- 8
- Pages
- 1179-1186
- ISSN
- 1367-4803 (ISSN-L)
- 1367-4811
- PMC
- PMC5408845
- OpenAlex
- W2951158909
- Cited by
- 1,852
- References
- 63
- Citations by year
- 2026: 188 · 2025: 247 · 2024: 261 · 2023: 275 · 2022: 248 · 2021: 213 · 2020: 163 · 2019: 142 · 2018: 88 · 2017: 22
- FWCI
- 44.02
- Type
- journal article
- Language
- en
- Open access
- hybrid
- doi.org
- Licence
- Locations
- Bioinformatics (publishedVersion, cc-by)
- bioRxiv (Cold Spring Harbor Laboratory) (acceptedVersion, cc-by)
- PubMed Central (publishedVersion, cc-by)
- PubMed (publishedVersion)
- Minerva Access (University of Melbourne) (submittedVersion, cc-by)
- Apollo (University of Cambridge) (submittedVersion, cc-by)
- Apollo (cc-by)
- Funders
- National Health and Medical Research Council (APP1112, 681 to D.J.M.)
- European Molecular Biology Laboratory (D.J.M.)
- Cancer Research UK (A1719, 7 to A.T.L.L.)
- United Kingdom Medical Research Council (K.R.C.)
- Oxford Single Cell Biology Consortium (Q.F.W.)
- Topics
- Life Sciences › Biochemistry, Genetics and Molecular Biology › Molecular Biology › Single-cell and spatial transcriptomics
- Life Sciences › Biochemistry, Genetics and Molecular Biology › Molecular Biology › Genomics and Phylogenetic Studies
- Life Sciences › Biochemistry, Genetics and Molecular Biology › Molecular Biology › Gene expression and cancer classification
- Keywords
- single-cell RNA sequencing, R/Bioconductor package, data preprocessing, quality control, normalization, data visualization, gene expression data, sequencing artifacts
- MeSH terms
- Cell Line, Humans, Programming Languages, Quality Control, RNA, Software, Statistics as Topic, Sequence Analysis, RNA, Principal Component Analysis, Single-Cell Analysis
About these checks
Registry, retraction, Cites and statistics results are computed, not judged, with one exception: a printed reference that no index lists is read once by a model before it counts as a citation error. Claims are extracted by a model and kept only when their quote appears verbatim in the text; each cited source is then checked, with a model’s help, for whether it says what the claim relies on. Those verdicts can be wrong — read the claim’s quote and the cited source before relying on one.
Statistics and arithmetic are recomputed, not judged.
Confidence bands are shown only for fields calibrated on our annotated test set. None is calibrated yet, so no band is shown.
What counts as a claim ›How we measure confidence ›How we check this ›
Are you an author, or do you see a problem with this page? Request a review
