

The DOI matches its Crossref record; 76 of the 76 references it cites were found in a registry or an index.
Individual Differences in Premotor Brain Systems Underlie Behavioral Apathy
Open accessAbstract
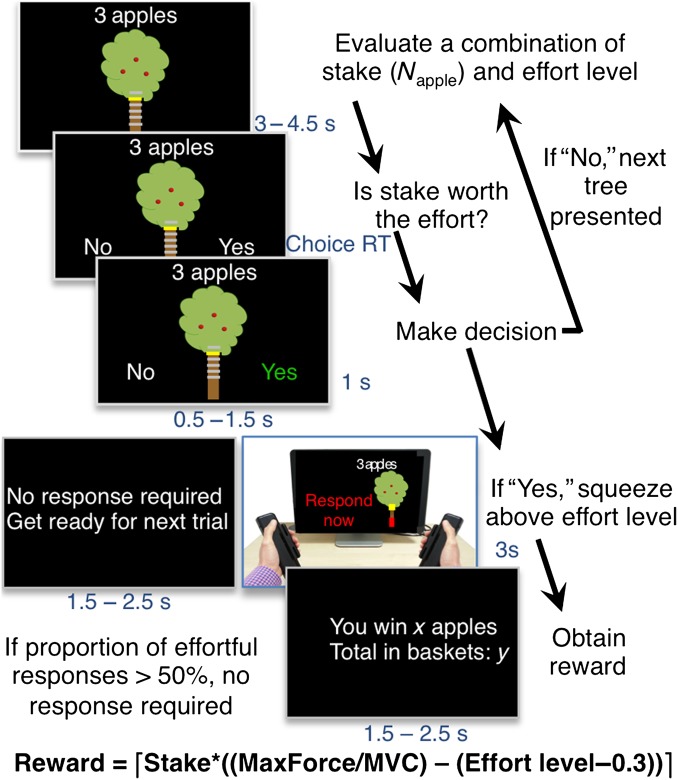
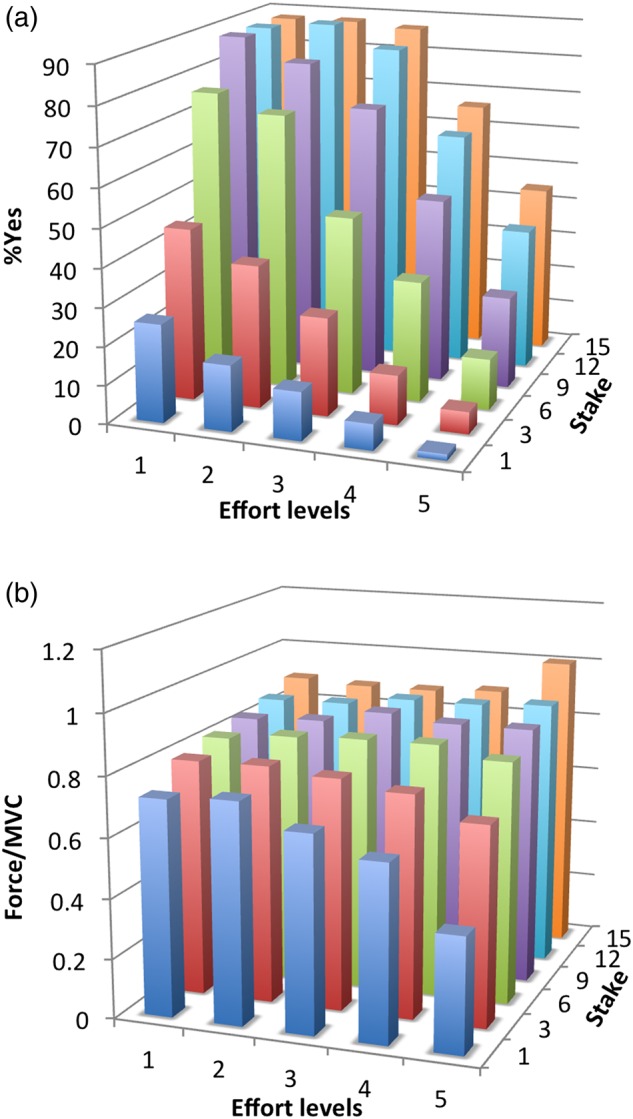
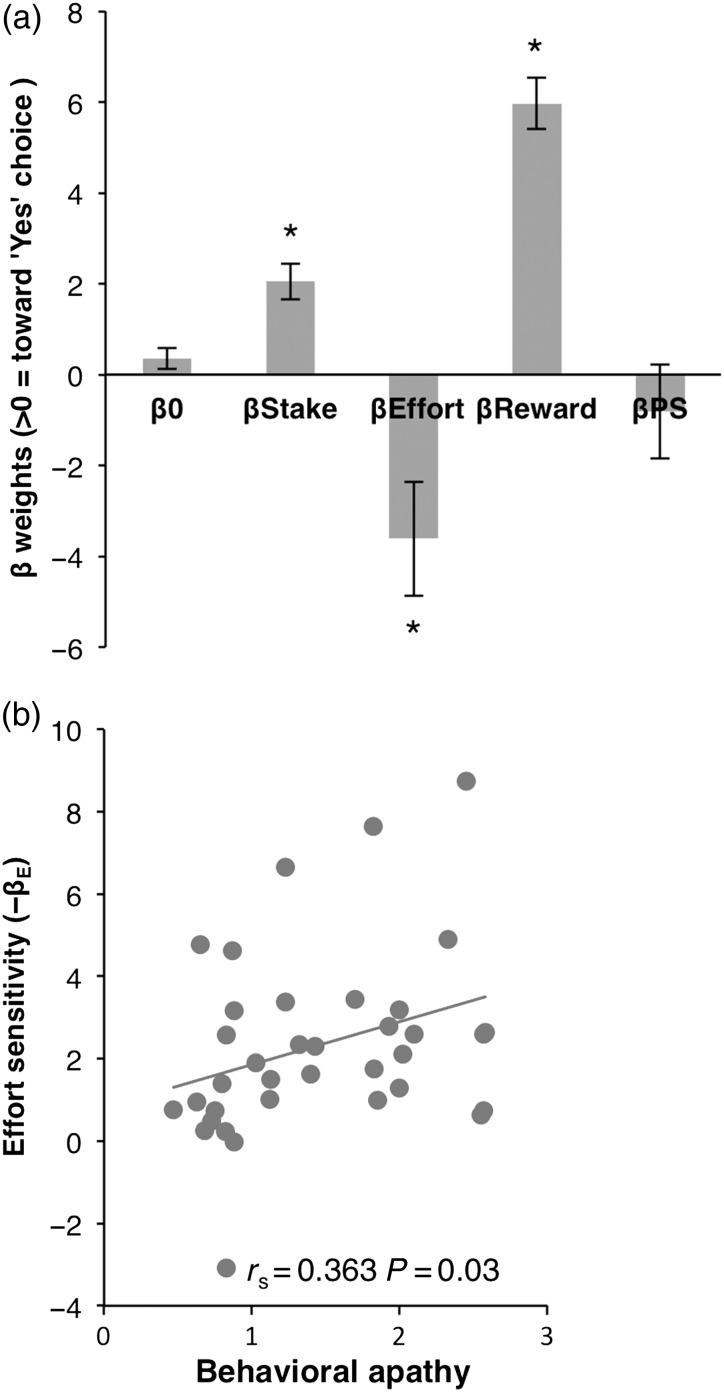
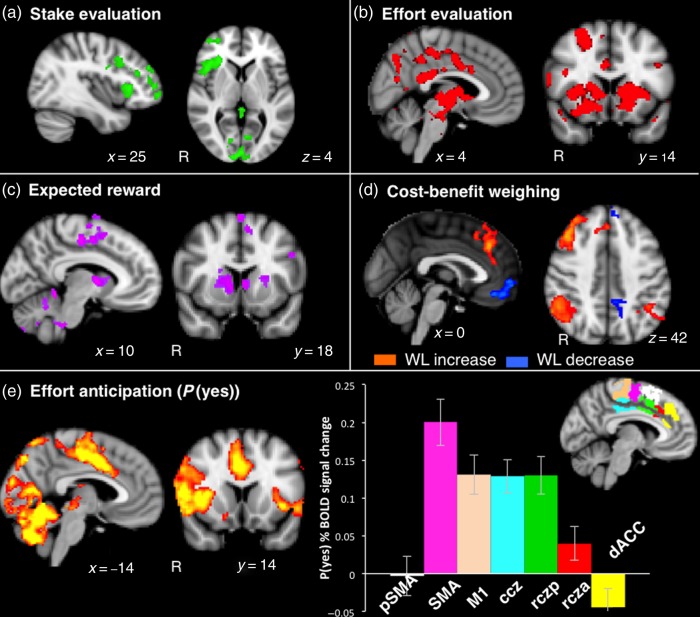
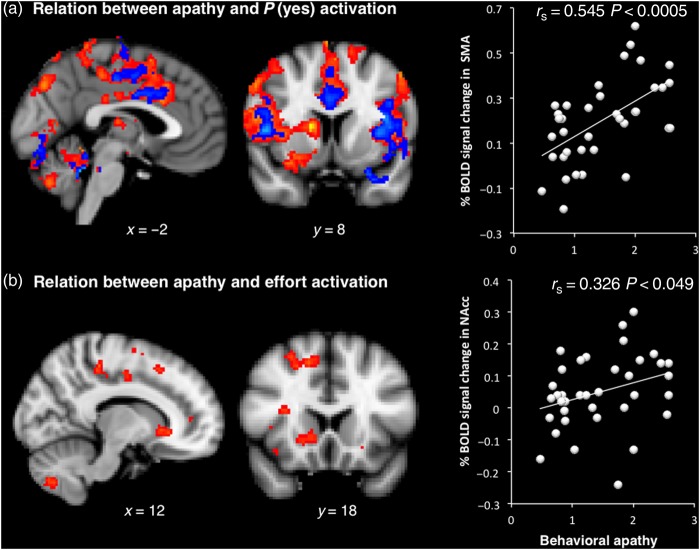
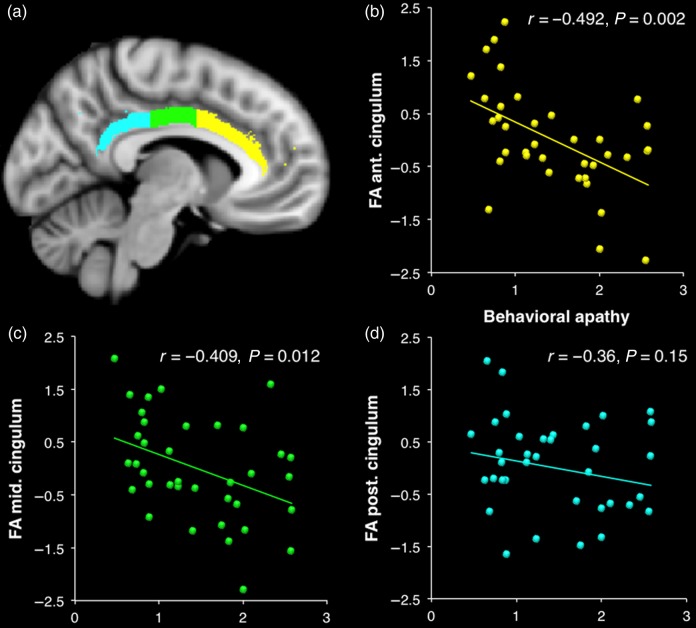
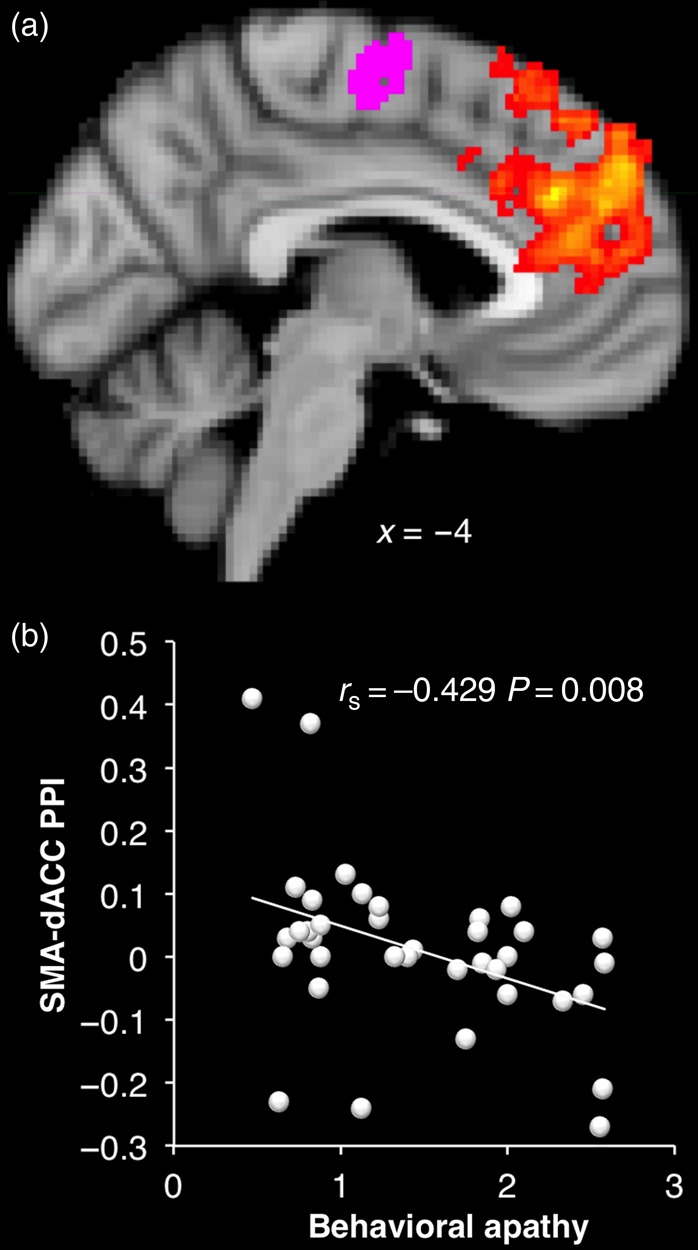
Lack of physical engagement, productivity, and initiative-so-called "behavioral apathy"--is a common problem with significant impact, both personal and economic. Here, we investigate whether there might be a biological basis to such lack of motivation using a new effort and reward-based decision-making paradigm, combined with functional and diffusion-weighted imaging. We hypothesized that behavioral apathy in otherwise healthy people might be associated with differences in brain systems underlying either motivation to act (specifically in effort and reward-based decision-making) or in action processing (transformation of an intention into action). The results demonstrate that behavioral apathy is associated with increased effort sensitivity as well as greater recruitment of neural systems involved in action anticipation: supplementary motor area (SMA) and cingulate motor zones. In addition, decreased structural and functional connectivity between anterior cingulate cortex (ACC) and SMA were associated with increased behavioral apathy. These findings reveal that effort sensitivity and translation of intentions into actions might make a critical contribution to behavioral apathy. We propose a mechanism whereby inefficient communication between ACC and SMA might lead to increased physiological cost--and greater effort sensitivity--for action initiation in more apathetic people.
Overview
The claims and statistics of this paper haven’t been checked yet.
Run the check — free, no account needed. It reads the open-access text and checks the sources it cites.
Integrity signals
Registry
Cites
Statistics
Figures
Verification
Claims the paper makes
The claims and statistics of this paper haven’t been checked yet.
Run the check — free, no account needed. It reads the open-access text and checks the sources it cites.
Self-check
Percentages, sums and reported differences re-computed from the paper’s own numbers.
The self-check needs the paper’s full text.
Citations
Cites
Lovibond, P. F., & Lovibond, S. H. (1995) · Behaviour Research and Therapy · doi:10.1016/0005-7967(94)00075-u · Cited by 14,523
Control of goal-directed and stimulus-driven attention in the brain
Corbetta, M., & Shulman, G. L. (2002) · Nature Reviews Neuroscience · doi:10.1038/nrn755 · Cited by 12,881
Jenkinson, M., Bannister, P., Brady, M., & Smith, S. (2002) · NeuroImage · doi:10.1006/nimg.2002.1132 · Cited by 11,888
Conflict monitoring and cognitive control
Botvinick, M. M., Braver, T. S., Barch, D. M., Carter, C. S., & Cohen, J. D. (2001) · Psychological Review · doi:10.1037/0033-295x.108.3.624 · Cited by 7,351
Contributions of anterior cingulate cortex to behaviour
Devinsky, O., Morrell, M. J., & Vogt, B. A. (1995) · Brain · doi:10.1093/brain/118.1.279 · Cited by 3,377
Characterization and propagation of uncertainty in diffusion-weighted MR imaging
Behrens, T. E. J., Woolrich, M. W., Jenkinson, M., Johansen‐Berg, H., Nunes, R. G., Clare, S., Matthews, P. M., Brady, J. M., & Smith, S. M. (2003) · Magnetic Resonance in Medicine · doi:10.1002/mrm.10609 · Cited by 3,038
Self-citationAnterior Cingulate Conflict Monitoring and Adjustments in Control
Kerns, J. G., Cohen, J. D., MacDonald, A. W., Cho, R. Y., Stenger, V. A., & Carter, C. S. (2004) · Science · doi:10.1126/science.1089910 · Cited by 2,891
Probabilistic Independent Component Analysis for Functional Magnetic Resonance Imaging
Beckmann, C. F., & Smith, S. M. (2004) · IEEE Transactions on Medical Imaging · doi:10.1109/tmi.2003.822821 · Cited by 2,707
Non-invasive mapping of connections between human thalamus and cortex using diffusion imaging
Behrens, T. E. J., Johansen-Berg, H., Woolrich, M. W., Smith, S. M., Wheeler-Kingshott, C. A. M., Boulby, P. A., Barker, G. J., Sillery, E. L., Sheehan, K., Ciccarelli, O., et al. (2003) · Nature Neuroscience · doi:10.1038/nn1075 · Cited by 2,330
Self-citationThe expected value of control: an integrative theory of anterior cingulate cortex function
Shenhav, A., Botvinick, M. M., & Cohen, J. D. (2013) · Neuron · doi:10.1016/j.neuron.2013.07.007 · Cited by 2,321
A three-dimensional statistical analysis for CBF activation studies in human brain
Worsley, K. J., Evans, A. C., Marrett, S., & Neelin, P. (1992) · Journal of Cerebral Blood Flow & Metabolism · doi:10.1038/jcbfm.1992.127 · Cited by 2,036
Functional role of the supplementary and pre-supplementary motor areas
Nachev, P., Kennard, C., & Husain, M. (2008) · Nature Reviews Neuroscience · doi:10.1038/nrn2478 · Cited by 1,928
A scale for the assessment of hedonic tone the Snaith-Hamilton pleasure scale
Snaith, R. P., Hamilton, M., Morley, S., Humayan, A., Hargreaves, D., & Trigwell, P. (1995) · British Journal of Psychiatry · doi:10.1192/bjp.167.1.99 · Cited by 1,778
Primate anterior cingulate cortex: Where motor control, drive and cognition interface
Paus, T. (2001) · Nature Reviews Neuroscience · doi:10.1038/35077500 · Cited by 1,722 · cited 2×
“The cingulate cortex has been proposed to play a crucial role in motivation by “energizing” action or task engagement (Stuss and Alexander 2007) and has been associated with allocation and adjustment of control based on task demands (Paus 2001).”
BackgroundReconsidering anhedonia in depression: Lessons from translational neuroscience
Treadway, M. T., & Zald, D. H. (2011) · Neuroscience & Biobehavioral Reviews · doi:10.1016/j.neubiorev.2010.06.006 · Cited by 1,579
Vogt, B. A., Finch, D. M., & Olson, C. R. (1992) · Cerebral Cortex · doi:10.1093/cercor/2.6.435-a · Cited by 1,315
Apathy and the Functional Anatomy of the Prefrontal Cortex–Basal Ganglia Circuits
Levy, R., & Dubois, B. (2006) · Cerebral Cortex · doi:10.1093/cercor/bhj043 · Cited by 1,285
Frontal cortex and reward-guided learning and decision-making
Rushworth, M. F. S., Noonan, M. P., Boorman, E. D., Walton, M. E., & Behrens, T. E. (2011) · Neuron · doi:10.1016/j.neuron.2011.05.014 · Cited by 1,111
Self-citationFunctional connectivity of human striatum: a resting state FMRI study
Di Martino, A., Scheres, A., Margulies, D. S., Kelly, A. M. C., Uddin, L. Q., Shehzad, Z., Biswal, B., Walters, J. R., Castellanos, F. X., & Milham, M. P. (2008) · Cerebral Cortex · doi:10.1093/cercor/bhn041 · Cited by 1,090
Neuroeconomics: decision making and the brain
(2014) · Choice Reviews Online · doi:10.5860/choice.51-5702 · Cited by 1,020
Effort-related functions of nucleus accumbens dopamine and associated forebrain circuits
Salamone, J. D., Correa, M., Farrar, A., & Mingote, S. M. (2007) · Psychopharmacology · doi:10.1007/s00213-006-0668-9 · Cited by 1,000
(2010) · Springer-Lehrbuch · doi:10.1007/978-3-642-12693-2 · Cited by 977
The Neurobiology of Decision: Consensus and Controversy
Kable, J. W., & Glimcher, P. W. (2009) · Neuron · doi:10.1016/j.neuron.2009.09.003 · Cited by 928
Heckhausen, J., & Heckhausen, H. (2008) · Cited by 923
Choice, uncertainty and value in prefrontal and cingulate cortex
Rushworth, M. F. S., & Behrens, T. E. J. (2008) · Nature Neuroscience · doi:10.1038/nn2066 · Cited by 866
Self-citationBeckmann, M., Johansen-Berg, H., & Rushworth, M. F. S. (2009) · The Journal of Neuroscience · doi:10.1523/jneurosci.3328-08.2009 · Cited by 789
Tools of the trade: psychophysiological interactions and functional connectivity
O’Reilly, J. X., Woolrich, M. W., Behrens, T. E. J., Smith, S. M., & Johansen-Berg, H. (2012) · Social Cognitive and Affective Neuroscience · doi:10.1093/scan/nss055 · Cited by 765
Self-citationRole for Cingulate Motor Area Cells in Voluntary Movement Selection Based on Reward
Shima, K., & Tanji, J. (1998) · Science · doi:10.1126/science.282.5392.1335 · Cited by 645
Motivation of extended behaviors by anterior cingulate cortex
Holroyd, C. B., & Yeung, N. (2012) · Trends in Cognitive Sciences · doi:10.1016/j.tics.2011.12.008 · Cited by 618
Proposed diagnostic criteria for apathy in Alzheimer’s disease and other neuropsychiatric disorders
Robert, P. H., Onyike, C. U., Leentjens, A. F. G., Dujardin, K., Aalten, P., STARKSTEIN, S. E., Verhey, F. R. J., Yessavage, J., Clément, J., Drapier, D., et al. (2009) · European Psychiatry · doi:10.1016/j.eurpsy.2008.09.001 · Cited by 618
Salience network integrity predicts default mode network function after traumatic brain injury
Bonnelle, V., Ham, T. E., Leech, R., Kinnunen, K. M., Mehta, M. A., Greenwood, R. J., & Sharp, D. J. (2012) · Proceedings of the National Academy of Sciences · doi:10.1073/pnas.1113455109 · Cited by 606
Self-citationEffort-Based Cost–Benefit Valuation and the Human Brain
Croxson, P. L., Walton, M. E., O'Reilly, J. X., Behrens, T. E. J., & Rushworth, M. F. S. (2009) · The Journal of Neuroscience · doi:10.1523/jneurosci.4515-08.2009 · Cited by 560
Self-citationIs there a dysexecutive syndrome?
Stuss, D. T., & Alexander, M. P. (2007) · Philosophical Transactions of the Royal Society B: Biological Sciences · doi:10.1098/rstb.2007.2096 · Cited by 557
Neural computations associated with goal-directed choice
Rangel, A., & Hare, T. (2010) · Current Opinion in Neurobiology · doi:10.1016/j.conb.2010.03.001 · Cited by 532
Sockeel, P. (2006) · Journal of Neurology Neurosurgery & Psychiatry · doi:10.1136/jnnp.2005.075929 · Cited by 512
Walton, M. E., Bannerman, D. M., Alterescu, K., & Rushworth, M. F. S. (2003) · Journal of Neuroscience · doi:10.1523/jneurosci.23-16-06475.2003 · Cited by 512
Separate Valuation Subsystems for Delay and Effort Decision Costs
Prévost, C., Pessiglione, M., Météreau, E., Cléry-Melin, M.-L., & Dreher, J.-C. (2010) · The Journal of Neuroscience · doi:10.1523/jneurosci.2752-10.2010 · Cited by 499
Transformation of stimulus value signals into motor commands during simple choice
Hare, T. A., Schultz, W., Camerer, C. F., O’Doherty, J. P., & Rangel, A. (2011) · Proceedings of the National Academy of Sciences · doi:10.1073/pnas.1109322108 · Cited by 388
Effort discounting in human nucleus accumbens
Botvinick, M., Huffstetler, S., & McGuire, J. T. (2009) · Cognitive Affective & Behavioral Neuroscience · doi:10.3758/cabn.9.1.16 · Cited by 364
HUMAN FUNCTIONAL ANATOMY OF VISUALLY GUIDED FINGER MOVEMENTS
Grafton, S. T., Mazziotta, J. C., Woods, R., & Phelps, M. E. (1992) · Brain · doi:10.1093/brain/115.2.565 · Cited by 339
Volition and Conflict in Human Medial Frontal Cortex
Nachev, P., Rees, G. E., Parton, A. D., Kennard, C., & Husain, M. (2005) · Current Biology · doi:10.1016/j.cub.2005.01.006 · Cited by 331
Lehéricy, S. (2004) · Cerebral Cortex · doi:10.1093/cercor/bhh091 · Cited by 311
Weighing up the benefits of work: Behavioral and neural analyses of effort-related decision making
Walton, M. E., Kennerley, S. W., Bannerman, D. M., Phillips, P. E. M., & Rushworth, M. F. S. (2006) · Neural Networks · doi:10.1016/j.neunet.2006.03.005 · Cited by 305
Role of primate basal ganglia and frontal cortex in the internal generation of movements
Romo, R., & Schultz, W. (1992) · Experimental Brain Research · doi:10.1007/bf00227836 · Cited by 271
Detection of time-varying signals in event-related fMRI designs
Grinband, J., Wager, T. D., Lindquist, M. A., Ferrera, V. P., & Hirsch, J. (2008) · NeuroImage · doi:10.1016/j.neuroimage.2008.07.065 · Cited by 271
Vansteenkiste, V., Lens, W., Witte, H. D., & Feather, N. T. (2005) · British Journal of Social Psychology · doi:10.1348/014466604x17641 · Cited by 243
Primate spinal interneurons show pre-movement instructed delay activity
Prut, Y., & Fetz, E. E. (1999) · Nature · doi:10.1038/44145 · Cited by 242
Stuss, D. T. (2011) · Current Opinion in Neurology · doi:10.1097/wco.0b013e32834c7eb9 · Cited by 234
Winstein, C. J., Grafton, S. T., & Pohl, P. S. (1997) · Journal of Neurophysiology · doi:10.1152/jn.1997.77.3.1581 · Cited by 234
Jones, D. K., Catani, M., Pierpaoli, C. M., Reeves, S., Shergill, S. S., O'Sullivan, M. J., Golesworthy, P., McGuire, P. K., Horsfield, M. A., Simmons, A., et al. (2005) · Human Brain Mapping · doi:10.1002/hbm.20179 · Cited by 233
Developing a new apathy measurement scale: Dimensional Apathy Scale
Radaković, R., & Abrahams, S. (2014) · Psychiatry Research · doi:10.1016/j.psychres.2014.06.010 · Cited by 226
Choosing to make an effort: The role of striatum in signaling physical effort of a chosen action
Kurniawan, I. T., Seymour, B., Talmi, D., Yoshida, W., Chater, N., & Dolan, R. J. (2010) · Journal of Neurophysiology · doi:10.1152/jn.00027.2010 · Cited by 225
Disconnecting force from money: effects of basal ganglia damage on incentive motivation
Schmidt, L., d’Arc, B. F., Lafargue, G., Galanaud, D., Czernecki, V., Grabli, D., Schüpbach, M. W. M., Hartmann, A., Lévy, R., Dubois, B., et al. (2008) · Brain · doi:10.1093/brain/awn045 · Cited by 197
Structural correlates of apathy in Alzheimer's disease
Apostolova, L. G., Akopyan, G. G., Partiali, N., Steiner, C. A., Dutton, R. A., Hayashi, K. M., Dinov, I. D., Toga, A. W., Cummings, J. L., & Thompson, P. M. (2007) · Dementia and Geriatric Cognitive Disorders · doi:10.1159/000103914 · Cited by 190
Effort and Valuation in the Brain: The Effects of Anticipation and Execution
Kurniawan, I. T., Guitart‐Masip, M., Dayan, P., & Dolan, R. J. (2013) · Journal of Neuroscience · doi:10.1523/jneurosci.4777-12.2013 · Cited by 188
White matter connections of the supplementary motor area in humans
Vergani, F., Lacerda, L., Martino, J., Attems, J., Morris, C., Mitchell, P., de Schotten, M. T., & Dell'Acqua, F. (2014) · Journal of Neurology, Neurosurgery & Psychiatry · doi:10.1136/jnnp-2013-307492 · Cited by 183
Disrupting the Supplementary Motor Area Makes Physical Effort Appear Less Effortful
Zénon, A., Sidibe, M., & Olivier, E. (2015) · Journal of Neuroscience · doi:10.1523/jneurosci.3789-14.2015 · Cited by 181
Parabolic discounting of monetary rewards by physical effort
Hartmann, M. N., Hager, O. M., Tobler, P. N., & Kaiser, S. (2013) · Behavioural Processes · doi:10.1016/j.beproc.2013.09.014 · Cited by 169
On the functional anatomy of the urge-for-action
Jackson, S. R., Parkinson, A., Kim, S. Y., Schüermann, M., & Eickhoff, S. B. (2011) · Cognitive Neuroscience · doi:10.1080/17588928.2011.604717 · Cited by 158
Characterization of reward and effort mechanisms in apathy
Bonnelle, V., Veromann, K., Heyes, S. B., Sterzo, E. L., Manohar, S., & Husain, M. (2014) · Journal of Physiology-Paris · doi:10.1016/j.jphysparis.2014.04.002 · Cited by 153
Self-citationIncreased GABA Contributes to Enhanced Control over Motor Excitability in Tourette Syndrome
Draper, A., Stephenson, M. C., Jackson, G. M., Pépés, S. E., Morgan, P. S., Morris, P. G., & Jackson, S. R. (2014) · Current Biology · doi:10.1016/j.cub.2014.08.038 · Cited by 150
Single-Neuron Mechanisms Underlying Cost-Benefit Analysis in Frontal Cortex
Hosokawa, T., Kennerley, S. W., Sloan, J., & Wallis, J. D. (2013) · Journal of Neuroscience · doi:10.1523/jneurosci.2221-13.2013 · Cited by 141
A Model of Reward- and Effort-Based Optimal Decision Making and Motor Control
Rigoux, L., & Guigon, E. (2012) · PLoS Computational Biology · doi:10.1371/journal.pcbi.1002716 · Cited by 139
Cowen, S. L., Davis, G. A., & Nitz, D. A. (2012) · Journal of Neurophysiology · doi:10.1152/jn.01012.2011 · Cited by 112
The Anterior Cingulate Gyrus Signals the Net Value of Others' Rewards
Apps, M. A. J., & Ramnani, N. (2014) · The Journal of Neuroscience · doi:10.1523/jneurosci.2701-13.2014 · Cited by 109
Dopamine reverses reward insensitivity in apathy following globus pallidus lesions
Adam, R. J., Leff, A. P., Sinha, N., Turner, C., Bays, P. M., Draganski, B., & Husain, M. (2012) · Cortex · doi:10.1016/j.cortex.2012.04.013 · Cited by 108
Nguyen, V. T., Breakspear, M. J., & Cunnington, R. (2014) · Journal of Neuroscience · doi:10.1523/jneurosci.2571-14.2014 · Cited by 94
Stanton, B. R., Leigh, P. N., Howard, R. J., Barker, G. J., & Brown, R. G. (2013) · Journal of Neurology · doi:10.1007/s00415-013-6989-9 · Cited by 92
Tighe, S. K., Oishi, K., Mori, S., Smith, G. S., Albert, M., Lyketsos, C. G., & Mielke, M. M. (2012) · The Journal of Neuropsychiatry and Clinical Neurosciences · doi:10.1176/appi.neuropsych.11120375 · Cited by 77
Hahn, C., Lim, H.-K., Won, W. Y., Ahn, K. J., Jung, W.-S., & Lee, C. U. (2013) · PLoS ONE · doi:10.1371/journal.pone.0053493 · Cited by 76
Kostić, V., & Filippi, M. (2011) · Journal of the Neurological Sciences · doi:10.1016/j.jns.2011.05.036 · Cited by 74
Relationship between apathy and diffusion tensor imaging metrics of the brain in Alzheimer's disease
Ota, M., Sato, N., Nakata, Y., Arima, K., & Uno, M. (2012) · International Journal of Geriatric Psychiatry · doi:10.1002/gps.2779 · Cited by 58
Introduction to the Special Issue
Vogt, B. A. (1992) · Cerebral Cortex · doi:10.1093/cercor/2.6.435 · Cited by 56
White Matter Microstructure and Apathy Level in Amnestic Mild Cognitive Impairment
Cacciari, C., Moraschi, M., Paola, M. D., Cherubini, A., Orfei, M. D., Giove, F., Maraviglia, B., Caltagirone, C., & Spalletta, G. (2010) · Journal of Alzheimer s Disease · doi:10.3233/jad-2010-1384 · Cited by 40
Salamone, J. D. (2011) · European Journal of Neuroscience · doi:10.1111/j.1460-9568.2010.07566.x · Cited by 4
Xiong (1999) · doi:10.1002/(sici)1097-0193(1999)8:2/3
Research works printed but not linked: 1
- 10.1016/S1053-8119(02)91132-8 · DOI · Paper page
Cited by
Sorted by citations
Scale for the Assessment of Negative Symptoms
Andreasen, N. C. (1982) · PsycTESTS Dataset · doi:10.1037/t12696-000 · Cited by 1,888
Toward a rational and mechanistic account of mental effort
Shenhav, A., Musslick, S., Lieder, F., Kool, W., Griffiths, T. L., Cohen, J. D., & Botvinick, M. M. (2017) · Annual Review of Neuroscience · doi:10.1146/annurev-neuro-072116-031526 · Cited by 1,077
The Effort Paradox: Effort Is Both Costly and Valued
Inzlicht, M., Shenhav, A., & Olivola, C. Y. (2018) · Trends in Cognitive Sciences · doi:10.1016/j.tics.2018.01.007 · Cited by 977
Neuroscience of apathy and anhedonia: a transdiagnostic approach
Husain, M., & Roiser, J. P. (2018) · Nature reviews. Neuroscience · doi:10.1038/s41583-018-0029-9 · Cited by 682
Neurocomputational mechanisms underlying subjective valuation of effort costs
Chong, T. T.-J., Apps, M., Giehl, K., Sillence, A., Grima, L. L., & Husain, M. (2017) · PLOS Biology · doi:10.1371/journal.pbio.1002598 · Cited by 415
Self-citation
Metadata
- Authors
- Bonnelle, V., Manohar, S., Behrens, T., & Husain, M.
- Affiliations
- University of Oxford (GB)
- ORCID
- Manohar, Sanjay
- Venue
- Cerebral Cortex
- Publisher
- Oxford University Press (OUP)
- Published
- 2015-11-12
- Volume
- 26
- Issue
- 2
- Pages
- bhv247
- ISSN
- 1047-3211 (ISSN-L)
- 1460-2199
- PMC
- PMC4712805
- OpenAlex
- W2179264811
- Cited by
- 163
- References
- 76
- Citations by year
- 2026: 6 · 2025: 14 · 2024: 14 · 2023: 13 · 2022: 17 · 2021: 25 · 2020: 14 · 2019: 14 · 2018: 17 · 2017: 16 · 2016: 13
- FWCI
- 9.22
- Type
- journal article
- Language
- en
- Open access
- hybrid
- doi.org
- Licence
- cc-by
- Locations
- Cerebral Cortex (publishedVersion, cc-by)
- PubMed Central (publishedVersion, cc-by)
- PubMed (publishedVersion)
- HighWire Press Open Archive (submittedVersion)
- Funders
- Wellcome Trust
- Topics
- Life Sciences › Neuroscience › Cognitive Neuroscience › Neural and Behavioral Psychology Studies
- Life Sciences › Neuroscience › Cellular and Molecular Neuroscience › Neurotransmitter Receptor Influence on Behavior
- Social Sciences › Arts and Humanities › Philosophy › Free Will and Agency
- Keywords
- reward-based decision-making, effort-based decision making, supplementary motor area, anterior cingulate cortex, action prediction, structural connectivity, functional connectivity, motivation
- MeSH terms
- Adult, Brain Mapping, Cues, Decision Making, Female, Humans, Image Processing, Computer-Assisted, Individuality, Magnetic Resonance Imaging, Male, Motor Cortex, Neural Pathways, Photic Stimulation, Psychophysics, Reward, Young Adult, Feedback, Sensory, Apathy, Self Report, White Matter
About these checks
Registry, retraction, Cites and statistics results are computed, not judged, with one exception: a printed reference that no index lists is read once by a model before it counts as a citation error. Claims are extracted by a model and kept only when their quote appears verbatim in the text; each cited source is then checked, with a model’s help, for whether it says what the claim relies on. Those verdicts can be wrong — read the claim’s quote and the cited source before relying on one.
Statistics and arithmetic are recomputed, not judged.
Confidence bands are shown only for fields calibrated on our annotated test set. None is calibrated yet, so no band is shown.
What counts as a claim ›How we measure confidence ›How we check this ›
Are you an author, or do you see a problem with this page? Request a review
