

The DOI matches its Crossref record; 119 of the 121 references it cites were found in a registry or an index.
American Gut: an Open Platform for Citizen-Science Microbiome Research
Open accessPreprint — published as 10.1128/msystems.00031-18 · Paper page
Abstract
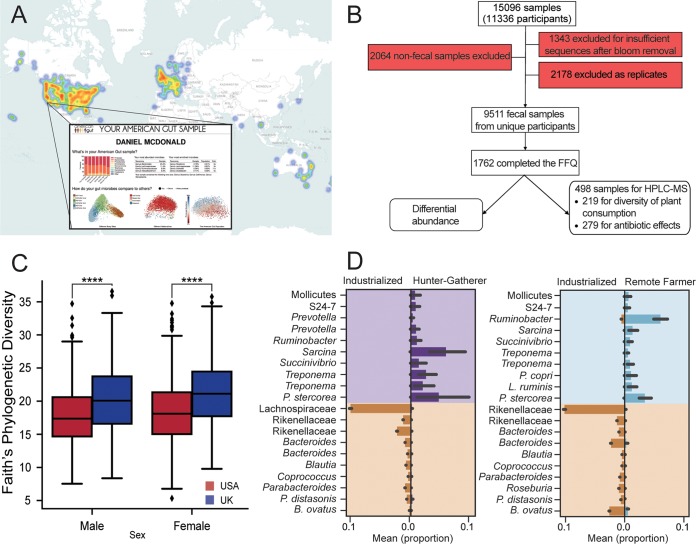
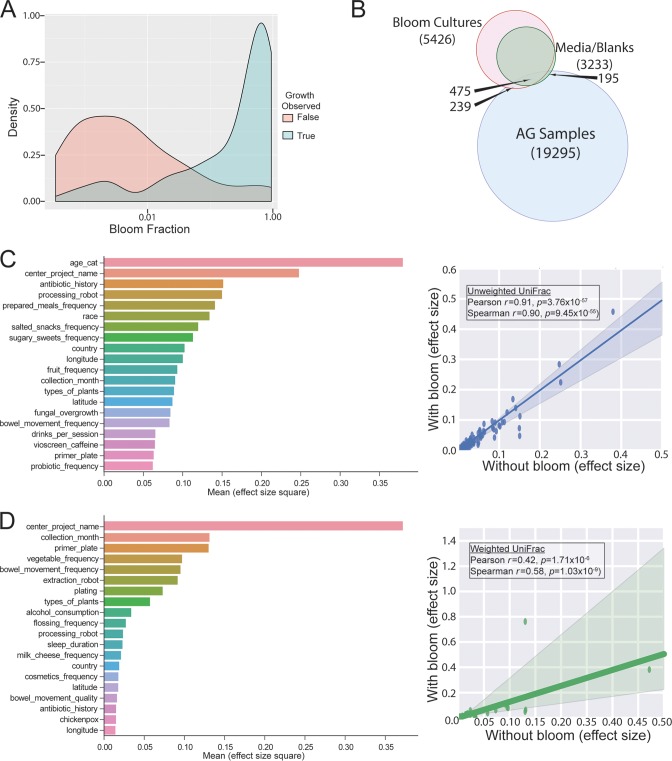
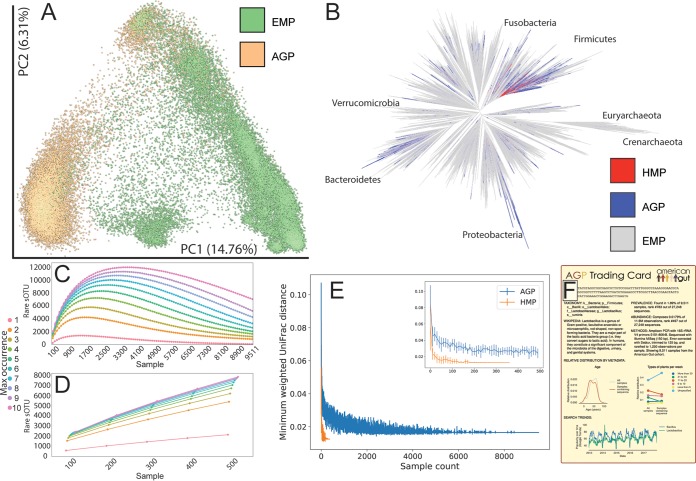
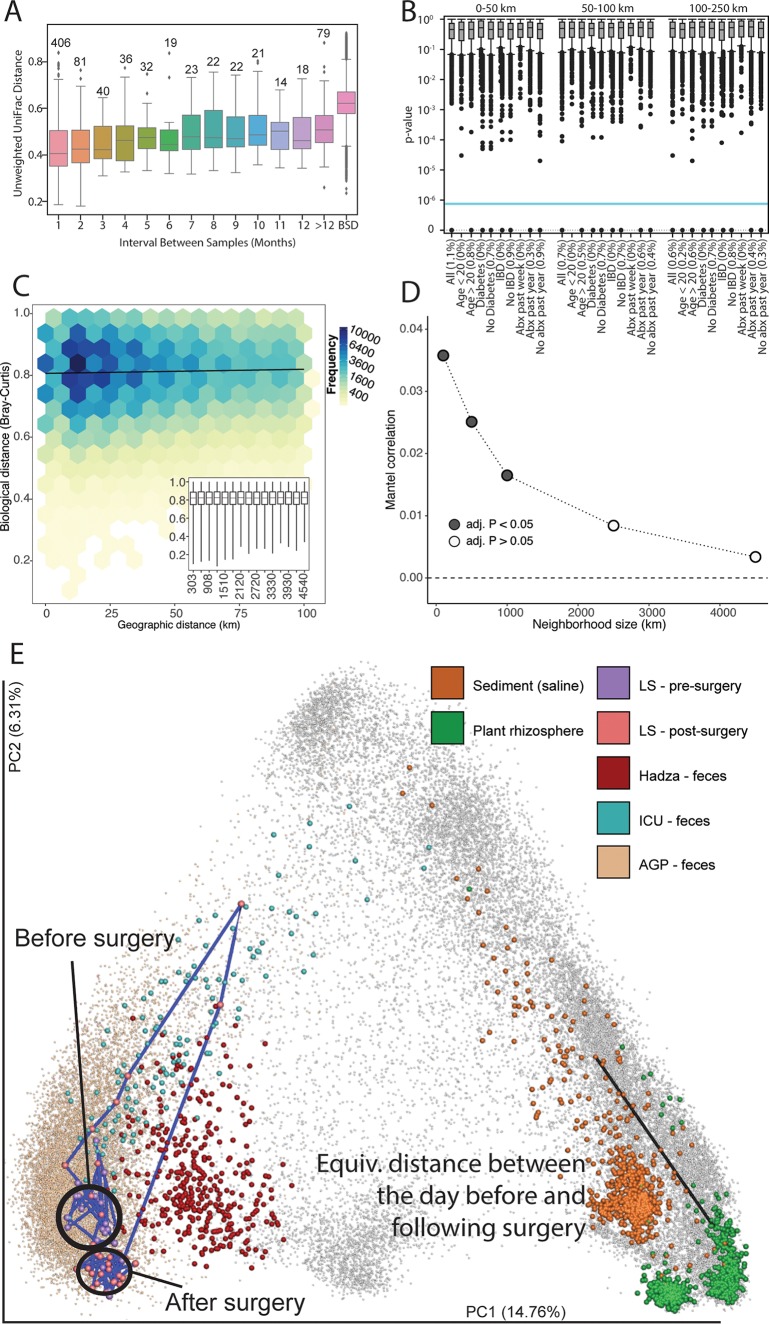
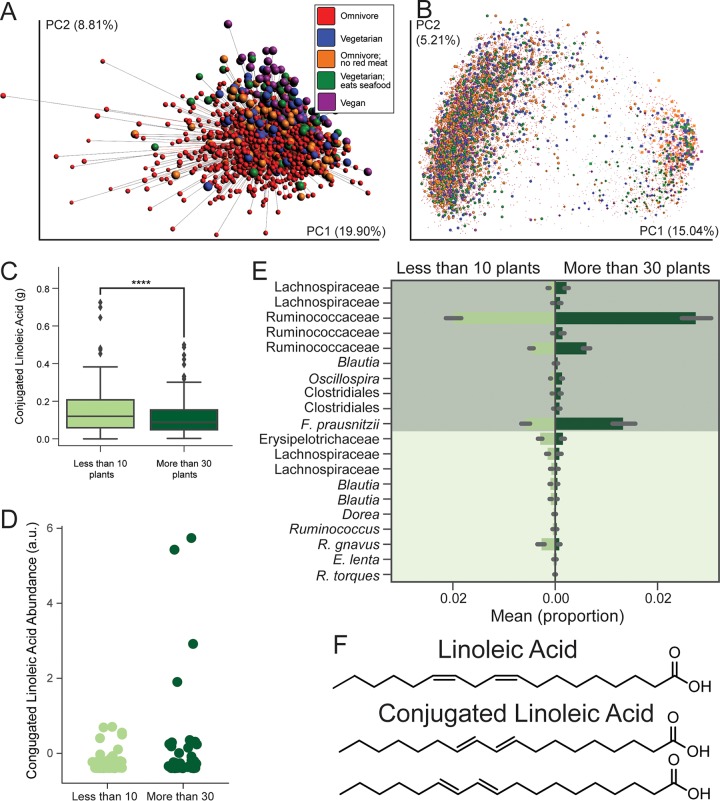
Although much work has linked the human microbiome to specific phenotypes and lifestyle variables, data from different projects have been challenging to integrate and the extent of microbial and molecular diversity in human stool remains unknown. Using standardized protocols from the Earth Microbiome Project and sample contributions from over 10,000 citizen-scientists, together with an open research network, we compare human microbiome specimens primarily from the USA, UK, and Australia to one another and to environmental samples. Our results show an unexpected range of beta-diversity in human stool microbiomes as compared to environmental samples, demonstrate the utility of procedures for removing the effects of overgrowth during room-temperature shipping for revealing phenotype correlations, uncover new molecules and kinds of molecular communities in the human stool metabolome, and examine emergent associations among the microbiome, metabolome, and the diversity of plants that are consumed (rather than relying on reductive categorical variables such as veganism, which have little or no explanatory power). We also demonstrate the utility of the living data resource and cross-cohort comparison to confirm existing associations between the microbiome and psychiatric illness, and to reveal the extent of microbiome change within one individual during surgery, providing a paradigm for open microbiome research and education. Importance: We show that a citizen-science, self-selected cohort shipping samples through the mail at room temperature recaptures many known microbiome results from clinically collected cohorts and reveals new ones. Of particular interest is integrating n=1 study data with the population data, showing that the extent of microbiome change after events such as surgery can exceed differences between distinct environmental biomes, and the effect of diverse plants in the diet which we confirm with untargeted metabolomics on hundreds of samples.
Overview
The claims and statistics of this paper haven’t been checked yet.
Run the check — free, no account needed. It reads the open-access text and checks the sources it cites.
Integrity signals
Registry
Cites
Statistics
Figures
Verification
Claims the paper makes
The claims and statistics of this paper haven’t been checked yet.
Run the check — free, no account needed. It reads the open-access text and checks the sources it cites.
Claims other papers make about this one
Each is checked against this paper’s own text: does it say what the citing paper says it does?
The source backs part of the claim, not all of it — or backs it for a different population, condition or comparison.
In the citing paper
“These participants also complete surveys about general health status, disease history, lifestyle data and food frequency.”
From Multimodal biomedical AI (2022) · cites this paper as [94]
Experimental — accuracy not yet measuredThe source backs part of the claim, not all of it — or backs it for a different population, condition or comparison.
In the citing paper
“The data featured in this article come from a set of 953,000 rRNA fragments sequenced from stool samples submitted by participants in the AGP25, powered by TMI (https://microsetta.ucsd.edu/).”
From Improving microbial phylogeny with citizen science within a mass-market video game (2025) · cites this paper as [25]
Experimental — accuracy not yet measuredThe cited source says what the claim attributes to it.
In the citing paper
“As another example, the American Gut Project collects microbiome data from self-selected participants across several countries 94 .”
From Multimodal biomedical AI (2022) · cites this paper as [94]
The cited source says what the claim attributes to it.
In the citing paper
“BLS is designed to improve a reference multiple alignment of 1 million 16S ribosomal RNA (rRNA) sequences from The Microsetta Initiative’s (TMI) American Gut Project (AGP)25, a citizen science initiative collecting gut microbial genomic data.”
From Improving microbial phylogeny with citizen science within a mass-market video game (2025) · cites this paper as [25]
The cited source says what the claim attributes to it.
In the citing paper
“We observed that BLS outperforms SEPP on many variables, including several that have been linked to gut microbe diversity and human health25,39–42.”
From Improving microbial phylogeny with citizen science within a mass-market video game (2025) · cites this paper as [25]
In the citing paper
“The human gut microbiome is itself shaped by a wide variety of environmental exposures, including diet (8, 9) and medication use (10–13)”
From Dietary fiber and probiotics influence the gut microbiome and melanoma immunotherapy response (2021) · cites this paper as [9]
In the citing paper
“A diverse diet, and in particular, the number of different types of plant foods consumed [35,78], has been associated with greater microbial alpha-diversity thought to provide an increased variety of substrates for numerous taxa proliferation [78,84].”
From Effect of Diet on the Gut Microbiota: Rethinking Intervention Duration (2019) · cites this paper as [78]
In the citing paper
“Species Facealibacterium prausnitzii and genus Oscillospira, typically known to be SCFA fermenters, were increased in individuals who consumed more than 30 plant types a week in comparison to those who consumed less than 10 plant types [78].”
From Effect of Diet on the Gut Microbiota: Rethinking Intervention Duration (2019) · cites this paper as [78]
In the citing paper
“The American Gut Project, a large citizen science open platform study, collected self-report dietary data (FFQs) and faecal samples amongst other measures from over 10,000 individuals, predominantly UK, USA, and Australian residents, confirmed these observations.”
From Effect of Diet on the Gut Microbiota: Rethinking Intervention Duration (2019) · cites this paper as [78]
In the citing paper
“Consistent with this hypothesis are reported findings from the American Gut Project showing that individuals who reported a mental disorder such as depression, schizophrenia, post-traumatic stress disorder (PTSD) or bipolar disorder had more in common with other people with mental disorders, in terms of the bacteria makeup of their gut microbiomes, than they did with their mentally healthy pairs.”
From Role of diet and its effects on the gut microbiome in the pathophysiology of mental disorders (2022) · cites this paper as [133]
Self-check
Percentages, sums and reported differences re-computed from the paper’s own numbers.
The self-check needs the paper’s full text.
Citations
Cites
Breiman, L. (2001) · Machine Learning · doi:10.1023/a:1010933404324 · Cited by 133,538
Controlling the False Discovery Rate: A Practical and Powerful Approach to Multiple Testing
Benjamini, Y., & Hochberg, Y. (1995) · Journal of the Royal Statistical Society Series B: Statistical Methodology · doi:10.1111/j.2517-6161.1995.tb02031.x · Cited by 109,482
Fitting Linear Mixed-Effects Models Using lme4
Bates, D., Mächler, M., Bolker, B., & Walker, S. (2015) · Journal of Statistical Software · doi:10.18637/jss.v067.i01 · Cited by 86,835
Fast gapped-read alignment with Bowtie 2
Langmead, B., & Salzberg, S. L. (2012) · Nature Methods · doi:10.1038/nmeth.1923 · Cited by 56,400
Cytoscape: A software Environment for integrated models of biomolecular interaction networks
Shannon, P., Markiel, A., Ozier, O., Baliga, N. S., Wang, J. T., Ramage, D., Amin, N., Schwikowski, B., & Ideker, T. (2003) · Genome Research · doi:10.1101/gr.1239303 · Cited by 51,888
QIIME allows analysis of high-throughput community sequencing data
Caporaso, J. G., Kuczynski, J., Stombaugh, J., Bittinger, K., Bushman, F. D., Costello, E. K., Fierer, N., Peña, A. G., Goodrich, J. K., Gordon, J. I., et al. (2010) · Nature Methods · doi:10.1038/nmeth.f.303 · Cited by 34,887
Self-citationSPAdes: A New Genome Assembly Algorithm and Its Applications to Single-Cell Sequencing
Bankevich, A., Nurk, S., Antipov, D., Gurevich, A. A., Dvorkin, M. V., Kulikov, A. S., Lesin, V. M., Nikolenko, S., Pham, S., Prjibelski, A. D., et al. (2012) · Journal of Computational Biology · doi:10.1089/cmb.2012.0021 · Cited by 26,206
Self-citationNaive Bayesian Classifier for Rapid Assignment of rRNA Sequences into the New Bacterial Taxonomy
Wang, Q., Garrity, G. M., Tiedje, J. M., & Cole, J. R. (2007) · Applied and Environmental Microbiology · doi:10.1128/aem.00062-07 · Cited by 20,145
Prokka: rapid prokaryotic genome annotation
Seemann, T. (2014) · Bioinformatics · doi:10.1093/bioinformatics/btu153 · Cited by 18,937
A new method for non-parametric multivariate analysis of variance
Anderson, M. J. (2001) · Austral Ecology · doi:10.1111/j.1442-9993.2001.01070.pp.x · Cited by 13,828
An Ordination of the Upland Forest Communities of Southern Wisconsin
Bray, J. R., & Curtis, J. T. (1957) · Ecological Monographs · doi:10.2307/1942268 · Cited by 11,736
Structure, function and diversity of the healthy human microbiome
The Human Microbiome Project Consortium (2012) · Nature · doi:10.1038/nature11234 · Cited by 11,726
A human gut microbial gene catalogue established by metagenomic sequencing
MetaHIT Consortium, Qin, J., Li, R., Raes, J., Arumugam, M., Burgdorf, K. S., Manichanh, C., Nielsen, T., Pons, N., Levenez, F., et al. (2010) · Nature · doi:10.1038/nature08821 · Cited by 11,624
Diet rapidly and reproducibly alters the human gut microbiome
David, L. A., Maurice, C. F., Carmody, R. N., Gootenberg, D. B., Button, J. E., Wolfe, B. E., Ling, A. V., Devlin, A. S., Varma, Y., Fischbach, M. A., et al. (2014) · Nature · doi:10.1038/nature12820 · Cited by 10,100
PLS-regression: a basic tool of chemometrics
Wold, S., Sjöström, M., & Eriksson, L. (2001) · Chemometrics and Intelligent Laboratory Systems · doi:10.1016/s0169-7439(01)00155-1 · Cited by 10,084
Global patterns of 16S rRNA diversity at a depth of millions of sequences per sample
Caporaso, J. G., Lauber, C. L., Walters, W. A., Berg-Lyons, D., Lozupone, C., Turnbaugh, P. J., Fierer, N., & Knight, R. D. (2010) · Proceedings of the National Academy of Sciences · doi:10.1073/pnas.1000080107 · Cited by 9,910
Self-citationUltra-high-throughput microbial community analysis on the Illumina HiSeq and MiSeq platforms
Caporaso, J. G., Lauber, C. L., Walters, W. A., Berg-Lyons, D., Huntley, J., Fierer, N., Owens, S. M., Betley, J., Fraser, L., Bauer, M., et al. (2012) · The ISME Journal · doi:10.1038/ismej.2012.8 · Cited by 8,839
Self-citationCohen, J. (1992) · Psychological Bulletin · doi:10.1037//0033-2909.112.1.155 · Cited by 8,771
NOTES ON CONTINUOUS STOCHASTIC PHENOMENA
MORAN, P. A. P. (1950) · Biometrika · doi:10.1093/biomet/37.1-2.17 · Cited by 8,622
UniFrac: a New Phylogenetic Method for Comparing Microbial Communities
Lozupone, C., & Knight, R. (2005) · Applied and Environmental Microbiology · doi:10.1128/aem.71.12.8228-8235.2005 · Cited by 8,227
Self-citationHuman gut microbiome viewed across age and geography
Yatsunenko, T., Rey, F. E., Manary, M. J., Trehan, I., Dominguez-Bello, M. G., Contreras, M., Magris, M., Hidalgo, G., Baldassano, R. N., Anokhin, A. P., et al. (2012) · Nature · doi:10.1038/nature11053 · Cited by 7,815
Self-citationAccelerated Profile HMM Searches
Eddy, S. R. (2011) · PLoS Computational Biology · doi:10.1371/journal.pcbi.1002195 · Cited by 6,975
The carbohydrate-active enzymes database (CAZy) in 2013
Lombard, V., Ramulu, H. G., Drula, É., Coutinho, P. M., & Henrissat, B. (2013) · Nucleic Acids Research · doi:10.1093/nar/gkt1178 · Cited by 6,452
HMMER web server: interactive sequence similarity searching
Finn, R. D., Clements, J., & Eddy, S. R. (2011) · Nucleic Acids Research · doi:10.1093/nar/gkr367 · Cited by 5,952
Conservation evaluation and phylogenetic diversity
Faith, D. (1992) · Biological Conservation · doi:10.1016/0006-3207(92)91201-3 · Cited by 5,495
Sumner, L. W., Amberg, A., Barrett, D., Beale, M. H., Beger, R., Daykin, C. A., Fan, T. W.-M., Fiehn, O., Goodacre, R., Griffin, J. L., et al. (2007) · Metabolomics · doi:10.1007/s11306-007-0082-2 · Cited by 5,368
McDonald, D. T., Price, M. N., Goodrich, J. K., Nawrocki, E. P., DeSantis, T. Z., Probst, A. J., Andersen, G. L., Knight, R. D., & Hugenholtz, P. (2011) · The ISME Journal · doi:10.1038/ismej.2011.139 · Cited by 5,133
Self-citationWang, M., Carver, J. J., Phelan, V. V., Sanchez, L. M., Garg, N., Peng, Y., Nguyen, D. D., Watrous, J., Kapono, C. A., Luzzatto-Knaan, T., et al. (2016) · Nature Biotechnology · doi:10.1038/nbt.3597 · Cited by 4,629
Self-citationKraken: ultrafast metagenomic sequence classification using exact alignments
Wood, D. E., & Salzberg, S. L. (2014) · Genome Biology · doi:10.1186/gb-2014-15-3-r46 · Cited by 4,521
metaSPAdes: a new versatile metagenomic assembler
Nurk, S., Meleshko, D., Korobeynikov, A., & Pevzner, P. A. (2017) · Genome Research · doi:10.1101/gr.213959.116 · Cited by 4,496
Self-citationTHE GENERALIZATION OF ‘STUDENT'S’ PROBLEM WHEN SEVERAL DIFFERENT POPULATION VARLANCES ARE INVOLVED
WELCH, B. L. (1947) · Biometrika · doi:10.1093/biomet/34.1-2.28 · Cited by 4,135
Pluskal, T., Castillo, S., Villar‐Briones, A., & Orešič, M. (2010) · BMC Bioinformatics · doi:10.1186/1471-2105-11-395 · Cited by 3,852
Current Cigarette Smoking Among Adults — United States, 2016
Jamal, A., Phillips, E., Gentzke, A. S., Homa, D. M., Babb, S. D., King, B. A., & Neff, L. J. (2018) · MMWR Morbidity and Mortality Weekly Report · doi:10.15585/mmwr.mm6702a1 · Cited by 3,079
UniFrac: an effective distance metric for microbial community comparison
Lozupone, C., Lladser, M. E., Knights, D., Stombaugh, J., & Knight, R. (2011) · The ISME Journal · doi:10.1038/ismej.2010.133 · Cited by 2,825
Self-citationMaxBin 2.0: an automated binning algorithm to recover genomes from multiple metagenomic datasets
Wu, Y., Simmons, B. A., & Singer, S. W. (2015) · Bioinformatics · doi:10.1093/bioinformatics/btv638 · Cited by 2,764
Lozupone, C., Hamady, M., Kelley, S. T., & Knight, R. D. (2007) · Applied and Environmental Microbiology · doi:10.1128/aem.01996-06 · Cited by 2,717
Self-citationApprill, A., McNally, S., Parsons, R., & Weber, L. (2015) · Aquatic Microbial Ecology · doi:10.3354/ame01753 · Cited by 2,707
Trends in GPCR drug discovery: new agents, targets and indications
Hauser, A. S., Attwood, M. M., Rask‐Andersen, M., Schiöth, H. B., & Gloriam, D. E. I. (2017) · Nature Reviews Drug Discovery · doi:10.1038/nrd.2017.178 · Cited by 2,691
A communal catalogue reveals Earth's multiscale microbial diversity
Thompson, L. R., Sanders, J. G., McDonald, D., Amir, A., Ladau, J., Locey, K. J., Prill, R. J., Tripathi, A., Gibbons, S. M., Ackermann, G., et al. (2017) · Nature · doi:10.1038/nature24621 · Cited by 2,684
Self-citationSuccession of microbial consortia in the developing infant gut microbiome
Koenig, J. E., Spor, A., Scalfone, N., Fricker, A. D., Stombaugh, J., Knight, R., Angenent, L. T., & Ley, R. E. (2011) · Proceedings of the National Academy of Sciences · doi:10.1073/pnas.1000081107 · Cited by 2,540
Self-citationPopulation-level analysis of gut microbiome variation
Falony, G., Joossens, M., Vieira-Silva, S., Wang, J., Darzi, Y., Faust, K., Kurilshikov, A., Bonder, M. J., Valles-Colomer, M., Vandeputte, D., et al. (2016) · Science · doi:10.1126/science.aad3503 · Cited by 2,400
Prevalence of and Trends in Diabetes Among Adults in the United States, 1988-2012
Menke, A., Casagrande, S., Geiss, L., & Cowie, C. C. (2015) · JAMA · doi:10.1001/jama.2015.10029 · Cited by 2,362
Bracken: estimating species abundance in metagenomics data
(2016) · doi:10.7717/peerj-cs.104 · Cited by 2,333
Altered fecal microbiota composition in patients with major depressive disorder
Jiang, H., Ling, Z., Zhang, Y., Mao, H., Ma, Z., Yin, Y., Wang, W., Tang, W., Tan, Z., Shi, J., et al. (2015) · Brain, Behavior, and Immunity · doi:10.1016/j.bbi.2015.03.016 · Cited by 2,275
Normalization and microbial differential abundance strategies depend upon data characteristics
Weiss, S. J., Xu, Z. Z., Peddada, S. D., Amir, A., Bittinger, K. L., González, A., Lozupone, C., Zaneveld, J., Vázquez‐Baeza, Y., Birmingham, A., et al. (2017) · Microbiome · doi:10.1186/s40168-017-0237-y · Cited by 2,231
Self-citationZheng, P., Zeng, B., Zhou, C., Liu, M., Fang, Z., Xu, X., Zeng, L., Chen, J., Fan, S., Du, X., et al. (2016) · Molecular Psychiatry · doi:10.1038/mp.2016.44 · Cited by 2,023
Population-based metagenomics analysis reveals markers for gut microbiome composition and diversity
Zhernakova, A., Kurilshikov, A., Bonder, M. J., Tigchelaar, E. F., Schirmer, M., Vatanen, T., Mujagic, Z., Vila, A. V., Falony, G., Vieira-Silva, S., et al. (2016) · Science · doi:10.1126/science.aad3369 · Cited by 1,914
Self-citationDeblur Rapidly Resolves Single-Nucleotide Community Sequence Patterns
Amir, A., McDonald, D., Navas-Molina, J. A., Kopylova, E., Morton, J. T., Zech Xu, Z., Kightley, E. P., Thompson, L. R., Hyde, E. R., Gonzalez, A., et al. (2017) · mSystems · doi:10.1128/msystems.00191-16 · Cited by 1,881
Self-citationWorlds within worlds: evolution of the vertebrate gut microbiota
Ley, R. E., Lozupone, C., Hamady, M., Knight, R. D., & Gordon, J. I. (2008) · Nature Reviews Microbiology · doi:10.1038/nrmicro1978 · Cited by 1,692
Self-citationThe abundance and variety of carbohydrate-active enzymes in the human gut microbiota
Kaoutari, A. E., Armougom, F., Gordon, J. I., Raoult, D., & Henrissat, B. (2013) · Nature Reviews Microbiology · doi:10.1038/nrmicro3050 · Cited by 1,683
Henderson, G., Cox, F., Ganesh, S., Jonker, A., Young, W., Collaborators, G. R. C., Abecia, L., Angarita, E., Aravena, P., Nora Arenas, G., et al. (2015) · Scientific Reports · doi:10.1038/srep14567 · Cited by 1,682
Using MetaboAnalyst 3.0 for Comprehensive Metabolomics Data Analysis
Xia, J., & Wishart, D. S. (2016) · Current Protocols in Bioinformatics · doi:10.1002/cpbi.11 · Cited by 1,560
The control and consequences of bacterial fermentation in the human colon
Cummings, J. H., & Macfarlane, G. T. (1991) · Journal of Applied Bacteriology · doi:10.1111/j.1365-2672.1991.tb02739.x · Cited by 1,499
Mathematical Methods of Statistics (PMS-9)
Cramér, H. (1946) · Princeton University Press eBooks · doi:10.1515/9781400883868 · Cited by 1,345
EMPeror: a tool for visualizing high-throughput microbial community data
Vázquez‐Baeza, Y., Pirrung, M., Gonzalez, A., & Knight, R. D. (2013) · GigaScience · doi:10.1186/2047-217x-2-16 · Cited by 1,292
Self-citationStrains, functions and dynamics in the expanded Human Microbiome Project
Lloyd-Price, J., Mahurkar, A., Rahnavard, G., Crabtree, J., Orvis, J., Hall, A. B., Brady, A., Creasy, H. H., McCracken, C., Giglio, M. G., et al. (2017) · Nature · doi:10.1038/nature23889 · Cited by 1,267
Self-citationDynamics of the human gut microbiome in inflammatory bowel disease
Halfvarson, J., Brislawn, C. J., Lamendella, R., Vázquez-Baeza, Y., Walters, W. A., Bramer, L. M., D'Amato, M., Bonfiglio, F., McDonald, D., Gonzalez, A., et al. (2017) · Nature Microbiology · doi:10.1038/nmicrobiol.2017.4 · Cited by 1,204
Self-citationMinireview: Gut microbiota: The neglected endocrine organ
Clarke, G., Stilling, R. M., Kennedy, P. J., Stanton, C., Cryan, J. F., & Dinan, T. G. (2014) · Molecular Endocrinology · doi:10.1210/me.2014-1108 · Cited by 1,192
Searching molecular structure databases with tandem mass spectra using CSI:FingerID
Dührkop, K., Shen, H., Meusel, M., Rousu, J., & Böcker, S. (2015) · Proceedings of the National Academy of Sciences · doi:10.1073/pnas.1509788112 · Cited by 1,190
Escherichia coli Induces DNA Double-Strand Breaks in Eukaryotic Cells
Nougayrède, J.-P., Homburg, S., Taieb, F., Boury, M., Brzuszkiewicz, E., Gottschalk, G., Buchrieser, C., Hacker, J., Dobrindt, U., & Oswald, E. (2006) · Science · doi:10.1126/science.1127059 · Cited by 1,188
Cohabiting family members share microbiota with one another and with their dogs
Song, S. J., Lauber, C. L., Costello, E. K., Lozupone, C., Humphrey, G., Berg-Lyons, D., Caporaso, J. G., Knights, D., Clemente, J. C., Nakielny, S., et al. (2013) · eLife · doi:10.7554/elife.00458 · Cited by 1,116
Self-citationMass spectral molecular networking of living microbial colonies
Watrous, J. D., Roach, P. J., Alexandrov, T., Heath, B. S., Yang, J. Y., Kersten, R. D., van der Voort, M., Pogliano, K., Gross, H., Raaijmakers, J. M., et al. (2012) · Proceedings of the National Academy of Sciences · doi:10.1073/pnas.1203689109 · Cited by 974
Self-citationSeasonal cycling in the gut microbiome of the Hadza hunter-gatherers of Tanzania
Smits, S. A., Leach, J., Sonnenburg, E. D., Gonzalez, C. G., Lichtman, J. S., Reid, G., Knight, R., Manjurano, A., Changalucha, J., Elias, J. E., et al. (2017) · Science · doi:10.1126/science.aan4834 · Cited by 886
Self-citationNeue Begründung der Theorie quadratischer Formen von unendlichvielen Veränderlichen.
Hellinger, E. D. (1909) · Journal für die reine und angewandte Mathematik (Crelles Journal) · doi:10.1515/crll.1909.136.210 · Cited by 876
FragGeneScan: predicting genes in short and error-prone reads
Rho, M., Tang, H., & Ye, Y. (2010) · Nucleic Acids Research · doi:10.1093/nar/gkq747 · Cited by 865
The microbiome of uncontacted Amerindians
Clemente, J. C., Pehrsson, E. C., Blaser, M. J., Sandhu, K., Gao, Z., Wang, B., Magris, M., Hidalgo, G., Contreras, M., Noya-Alarcón, Ó., et al. (2015) · Science Advances · doi:10.1126/sciadv.1500183 · Cited by 851
Self-citationOpenMS: a flexible open-source software platform for mass spectrometry data analysis
Röst, H. L., Sachsenberg, T. T., Aiche, S., Bielow, C., Weisser, H., Aicheler, F., Andreotti, S., Ehrlich, H., Gutenbrunner, P., Kenar, E., et al. (2016) · Nature Methods · doi:10.1038/nmeth.3959 · Cited by 707
How Many Adults Identify as Transgender in the United States
Flores, A. R., Herman, J. L., Gates, G. J., & Brown, T. N. T. (2016) · eScholarship (California Digital Library) · Cited by 688
Gibson, M. K., Forsberg, K. J., & Dantas, G. A. (2014) · The ISME Journal · doi:10.1038/ismej.2014.106 · Cited by 670
Molecular Networking as a Dereplication Strategy
Yang, J. Y., Sanchez, L. M., Rath, C. M. B., Liu, X., Boudreau, P. D., Bruns, N., Glukhov, E., Wodtke, A., de Felício, R., Fenner, A. M., et al. (2013) · Journal of Natural Products · doi:10.1021/np400413s · Cited by 646
Self-citationSubsistence strategies in traditional societies distinguish gut microbiomes
Obregon-Tito, A. J., Tito, R. Y., Metcalf, J., Sankaranarayanan, K., Clemente, J. C., Ursell, L. K., Zech Xu, Z., Van Treuren, W., Knight, R., Gaffney, P. M., et al. (2015) · Nature Communications · doi:10.1038/ncomms7505 · Cited by 587
Self-citationRapid and Accurate Large-Scale Coestimation of Sequence Alignments and Phylogenetic Trees
Liu, K., Raghavan, S., Nelesen, S. M., Linder, C. R., & Warnow, T. J. (2009) · Science · doi:10.1126/science.1171243 · Cited by 509
Commensal bacteria make GPCR ligands that mimic human signalling molecules
Cohen, L. J., Esterhazy, D., Kim, S.-H., Lemetre, C., Aguilar, R. R., Gordon, E. A., Pickard, A. J., Cross, J. R., Emiliano, A. B., Han, S. M., et al. (2017) · Nature · doi:10.1038/nature23874 · Cited by 500 · cited 3×
“322, has been annotated as N-3-OH-palmitoyl ornithine based on the exact mass and previous annotation (39) as well as analysis of fragmentation patterns to confirm structural moieties of fragments (Fig.”
InfluentialPreservation Methods Differ in Fecal Microbiome Stability, Affecting Suitability for Field Studies
Song, S. J., Amir, A., Metcalf, J. L., Amato, K. R., Xu, Z. Z., Humphrey, G. C., & Knight, R. D. (2016) · mSystems · doi:10.1128/msystems.00021-16 · Cited by 495
Self-citationTemporal variability is a personalized feature of the human microbiome
Flores, G. E., Caporaso, J. G., Henley, J. B., Rideout, J. R., Domogala, D., Chase, J., Leff, J. W., Vázquez-Baeza, Y., Gonzalez, A., Knight, R., et al. (2014) · Genome Biology · doi:10.1186/s13059-014-0531-y · Cited by 446
Self-citationExtreme Dysbiosis of the Microbiome in Critical Illness
McDonald, D., Ackermann, G., Khailova, L., Baird, C., Heyland, D., Kozar, R., Lemieux, M., Derenski, K., King, J., Vis-Kampen, C., et al. (2016) · mSphere · doi:10.1128/msphere.00199-16 · Cited by 426
Self-citationOscillospira and related bacteria – From metagenomic species to metabolic features
Gophna, U., Konikoff, T., & Nielsen, H. B. (2017) · Environmental Microbiology · doi:10.1111/1462-2920.13658 · Cited by 409
Marked seasonal variation in the wild mouse gut microbiota
Maurice, C. F., Knowles, S. C. L., Ladau, J., Pollard, K. S., Fenton, A., Pedersen, A. B., & Turnbaugh, P. J. (2015) · The ISME Journal · doi:10.1038/ismej.2015.53 · Cited by 404
Self-citationPolyunsaturated fatty acid saturation by gut lactic acid bacteria affecting host lipid composition
Kishino, S., Takeuchi, M., Park, S.-B., Hirata, A., Kitamura, N., Kunisawa, J., Kiyono, H., Iwamoto, R., Isobe, Y., Arita, M., et al. (2013) · Proceedings of the National Academy of Sciences · doi:10.1073/pnas.1312937110 · Cited by 395
How gut microbes talk to organs: The role of endocrine and nervous routes
Cani, P. D., & Knauf, C. (2016) · Molecular Metabolism · doi:10.1016/j.molmet.2016.05.011 · Cited by 339
Putze, J., Hennequin, C., Nougayrède, J., Zhang, W., Homburg, S., Karch, H., Bringer, M.-A., Fayolle, C., Carniel, É., Rabsch, W., et al. (2009) · Infection and Immunity · doi:10.1128/iai.00522-09 · Cited by 319
Lin, P., Ding, B., Feng, C., Yin, S., Zhang, T., Qi, X., Lv, H., Guo, X., Dong, K., Zhu, Y., et al. (2017) · Journal of Affective Disorders · doi:10.1016/j.jad.2016.09.051 · Cited by 311
Conjugated linoleic acid biosynthesis by human-derived Bifidobacterium species
Coakley, M., Ross, R. P., Nordgren, M., Fitzgerald, G., Devery, R., & Stanton, C. (2003) · Journal of Applied Microbiology · doi:10.1046/j.1365-2672.2003.01814.x · Cited by 299
The ecology of microscopic life in household dust
Barberán, A., Dunn, R. R., Reich, B. J., Pacifici, K., Laber, E. B., Menninger, H., Morton, J. M., Henley, J. B., Leff, J. W., Miller, S. L., et al. (2015) · Proceedings of the Royal Society B Biological Sciences · doi:10.1098/rspb.2015.1139 · Cited by 293
Self-citationFiltering for increased power for microarray data analysis
Hackstadt, A. J., & Hess, A. M. (2009) · BMC Bioinformatics · doi:10.1186/1471-2105-10-11 · Cited by 291
Atropos: specific, sensitive, and speedy trimming of sequencing reads
Didion, J. P., Martin, M., & Collins, F. S. (2017) · PeerJ · doi:10.7717/peerj.3720 · Cited by 260
Balance Trees Reveal Microbial Niche Differentiation
Morton, J. T., Sanders, J., Quinn, R. A., McDonald, D., Gonzalez, A., Vázquez-Baeza, Y., Navas-Molina, J. A., Song, S. J., Metcalf, J. L., Hyde, E. R., et al. (2017) · mSystems · doi:10.1128/msystems.00162-16 · Cited by 254
Self-citationSEPP: SATé-Enabled Phylogenetic Placement
MIRARAB, S., NGUYEN, N., & WARNOW, T. (2011) · Biocomputing 2012 · doi:10.1142/9789814366496_0024 · Cited by 251
Weingarden, A. R., González, A., Vázquez‐Baeza, Y., Weiss, S. J., Humphry, G., Berg-Lyons, D., Knights, D., Unno, T., Bobr, A., Kang, J., et al. (2015) · Microbiome · doi:10.1186/s40168-015-0070-0 · Cited by 250
Self-citationGlobal marine bacterial diversity peaks at high latitudes in winter
Ladau, J., Sharpton, T. J., Finucane, M. M., Jospin, G., Kembel, S. W., O’Dwyer, J. P., Koeppel, A. F., Green, J. L., & Pollard, K. S. (2013) · The ISME Journal · doi:10.1038/ismej.2013.37 · Cited by 219
Self-citationCohen, L. J., Kang, H., Chu, J., Huang, Y.-H., Gordon, E. A., Reddy, B. V. B., Ternei, M. A., Craig, J. W., & Brady, S. F. (2015) · Proceedings of the National Academy of Sciences · doi:10.1073/pnas.1508737112 · Cited by 207
Educational Attainment in the United States: 2003. Population Characteristics.
Stoops, N. (2004) · Cited by 200
Sécher, T., Samba‐Louaka, A., Oswald, É., & Nougayrède, J. (2013) · PLoS ONE · doi:10.1371/journal.pone.0077157 · Cited by 146
Nguyen, D. D., Melnik, A. V., Koyama, N., Lu, X., Schorn, M., Fang, J., Aguinaldo, K., Lincecum, T. L., Ghequire, M. G. K., Carrión, V. J., et al. (2016) · Nature Microbiology · doi:10.1038/nmicrobiol.2016.197 · Cited by 135
Self-citationBracken: Estimating species abundance in metagenomics dataPreprint
Lu, J., Breitwieser, F. P., Thielen, P., et al. (2016) · bioRxiv (Cold Spring Harbor Laboratory) · doi:10.1101/051813 · Cited by 129
the Millennium Cohort Study Team, Smith, B., Chu, L. K., Smith, T. C., Amoroso, P. J., Boyko, E. J., Hooper, T. I., Gackstetter, G. D., & Ryan, M. A. K. (2008) · BMC Medical Research Methodology · doi:10.1186/1471-2288-8-37 · Cited by 121
Ejigu, B. A., Valkenborg, D., Baggerman, G., Vanaerschot, M., Witters, E., Dujardin, J., Burzykowski, T., & Berg, M. (2013) · OMICS A Journal of Integrative Biology · doi:10.1089/omi.2013.0010 · Cited by 118
Donnell, M. M. O., Harris, H. M. B., Ross, R. P., & O’Toole, P. W. (2017) · MicrobiologyOpen · doi:10.1002/mbo3.509 · Cited by 118
The WHO World Health Report 2001 on mental health
Saraceno, B. (2002) · Epidemiologia e Psichiatria Sociale · doi:10.1017/s1121189x00005546 · Cited by 104
Gurevich, A. A., Mikheenko, A., Shlemov, A., Korobeynikov, A., Mohimani, H., & Pevzner, P. A. (2018) · Nature Microbiology · doi:10.1038/s41564-017-0094-2 · Cited by 99
Self-citationBringing the Dynamic Microbiome to Life with Animations
Vázquez‐Baeza, Y., Gonzalez, A., Smarr, L. L., McDonald, D. T., Morton, J. T., Navas-Molina, J. A., & Knight, R. D. (2017) · Cell Host & Microbe · doi:10.1016/j.chom.2016.12.009 · Cited by 98
Self-citationCorrecting for Microbial Blooms in Fecal Samples during Room-Temperature Shipping
Amir, A., McDonald, D. T., Navas-Molina, J. A., Debelius, J. W., Morton, J. T., Hyde, E. R., Robbins‐Pianka, A., & Knight, R. D. (2017) · mSystems · doi:10.1128/msystems.00199-16 · Cited by 98
Self-citationDiscrete False-Discovery Rate Improves Identification of Differentially Abundant Microbes
Jiang, L., Amir, A., Morton, J. T., Heller, R., Ery Arias-castro, A., & Knight, R. D. (2017) · mSystems · doi:10.1128/msystems.00092-17 · Cited by 94
Self-citationKohl, K. D., Brun, A., Magallanes, M. E., Brinkerhoff, J., Laspiur, A., Acosta, J. C., Bordenstein, S. R., & Caviedes‐Vidal, E. (2016) · Journal of Experimental Biology · doi:10.1242/jeb.138370 · Cited by 67
Guo, W., Sarkar, S. K., & Peddada, S. D. (2009) · Biometrics · doi:10.1111/j.1541-0420.2009.01292.x · Cited by 55
Self-citationFunctional Metagenomics to Study Antibiotic Resistance
Boolchandani, M., Patel, S., & Dantas, G. A. (2016) · Methods in molecular biology · doi:10.1007/978-1-4939-6634-9_19 · Cited by 49
Educational Attainment in the United States: Population Characteristics. Current Population Reports.
Newburger, E. C., & Curry, A. (1999) · Cited by 44
Colicin E2 Production and Release by Escherichia coli K12 and Other Enterobacteriaceae
Pugsley, A. P., GOLDZAHL, N., & Barker, R. M. (1985) · Microbiology · doi:10.1099/00221287-131-10-2673 · Cited by 16
Prevalence of and trends in diabetes among adults in the United States, 1988-2012.
Gao, H. X., Regier, E. E., & Close, K. L. (2016) · PubMed · Cited by 15
Dalapicolla, J., do Prado, J. R., Percequillo, A. R., & Knowles, L. L. (2021) · Journal of Biogeography · doi:10.1111/jbi.14281 · Cited by 13
American Gut Project fecal sOTU counts table
McDonald, D. T., McDonald, D. T., Robbins‐Pianka, A., Mann, A. E., Vrbanac, A. F., Amir, A., Frazier, A., Antonio, G., Tripathi, A., Fahimipour, A. K., et al. (2018) · Figshare · doi:10.6084/m9.figshare.6137192 · Cited by 5
Self-citationFull American Gut Project mapping file
McDonald, D. T., McDonald, D. T., Robbins‐Pianka, A., Mann, A. E., Vrbanac, A. F., Amir, A., Frazier, A., Gonzalez, A., Tripathi, A., Fahimipour, A. K., et al. (2018) · Figshare · doi:10.6084/m9.figshare.6137315 · Cited by 5
Self-citationAmerican Gut collated alpha diversities
McDonald, D., McDonald, D., Robbins‐Pianka, A., Mann, A. E., Vrbanac, A. F., Amir, A., Frazier, A., Gonzalez, A., Tripathi, A., Fahimipour, A. K., et al. (2018) · Figshare · doi:10.6084/m9.figshare.6137312 · Cited by 1
Self-citationAmerican Gut Project fecal sOTU relative abundance table
McDonald, D. T., McDonald, D. T., Robbins‐Pianka, A., Mann, A. E., Vrbanac, A. F., Amir, A., Frazier, A., Antonio, G., Tripathi, A., Fahimipour, A. K., et al. (2018) · Figshare · doi:10.6084/m9.figshare.6137198 · Cited by 1
Self-citationMcDonald, D. T., McDonald, D. T., Robbins‐Pianka, A., Mann, A. E., Vrbanac, A. F., Amir, A., Frazier, A., Gonzalez, A., Tripathi, A., Fahimipour, A. K., et al. (2018) · Figshare · doi:10.6084/m9.figshare.6131024 · Cited by 1
Self-citationWeighted normalized UniFrac distances
McDonald, D. T., McDonald, D. T., Robbins‐Pianka, A., Mann, A. E., Vrbanac, A. F., Amir, A., Frazier, A., Gonzalez, A., Tripathi, A., Fahimipour, A. K., et al. (2018) · Figshare · doi:10.6084/m9.figshare.6133121 · Cited by 1
Self-citationMcDonald, D. T., McDonald, D. T., Robbins‐Pianka, A., Mann, A. E., Vrbanac, A. F., Amir, A., Frazier, A., Gonzalez, A., Tripathi, A., Fahimipour, A. K., et al. (2018) · Figshare · doi:10.6084/m9.figshare.6137270 · Cited by 1
Self-citationMcDonald, D., Robbins‐Pianka, A., Mann, A. E., Vrbanac, A. F., Amir, A., Frazier, A., Gonzalez, A., Tripathi, A., Fahimipour, A. K., Brennen, C., et al. (2018) · Figshare · doi:10.6084/m9.figshare.5936479 · Cited by 1
Self-citationMcDonald, D., Robbins‐Pianka, A., Mann, A. E., Vrbanac, A. F., Amir, A., Frazier, A., Antonio, G., Tripathi, A., Fahimipour, A. K., Brennen, C., et al. (2018) · Figshare · doi:10.6084/m9.figshare.5936482 · Cited by 1
Self-citation
Research works printed but not linked: 24
- 10.1126/science.aad3503 · DOI · Paper page
- 10.1126/science.aad3369 · DOI · Paper page
- Amir A , McDonald D , Navas-Molina JA , Kopylova E , Morton JT , Zech Xu Z , Kightley EP , Thompson LR , Hyde ER , Gonzalez A , Knight R. 2017. Deblur Rapidly Resolves Single-Nucleotide Community Sequence Patterns. mSystems 2. · DOI · Paper page
- 10.1038/ismej.2011.139 · DOI
- 10.1128/AEM.71.12.8228-8235.2005 · DOI · Paper page
- Morton JT , Sanders J , Quinn RA , McDonald D , Gonzalez A , Vázquez-Baeza Y , Navas-Molina JA , Song SJ , Metcalf JL , Hyde ER , Lladser M , Dorrestein PC , Knight R. 2017. Balance Trees Reveal Microbial Niche Differentiation. mSystems 2. · DOI · Paper page
- 10.1038/nature11053 · DOI · Paper page
- Clemente JC , Pehrsson EC , Blaser MJ , Sandhu K , Gao Z , Wang B , Magris M , Hidalgo G , Contreras M , Noya-Alarcón Ó , Lander O , McDonald J , Cox M , Walter J , Oh PL , Ruiz JF , Rodriguez S , Shen N , Song SJ , Metcalf J , Knight R , Dantas G , Dominguez-Bello MG. 2015. The microbiome of uncontacted Amerindians. Sci Adv 1. · DOI · Paper page
- 10.1038/ncomms7505 · DOI · Paper page
- 1967, The detection of disease clustering and a generalized regression approach, Cancer Res, 27, 209
- 10.1037/0033-2909.112.1.155 · DOI · Paper page
- 10.1126/science.aad3369 · DOI · Paper page
- 2001, A new method for non-parametric multivariate analysis of variance: NON-PARAMETRIC MANOVA FOR ECOLOGY. Austral Ecol, 26, 32
- 2011, Succession of microbial consortia in the developing infant gut microbiome, Proc Natl Acad Sci U S A 108 Suppl, 1, 4578
- 10.1186/s40168-015-0070-0 · DOI
- McDonald D , Ackermann G , Khailova L , Baird C , Heyland D , Kozar R , Lemieux M , Derenski K , King J , Vis-Kampen C , Knight R , Wischmeyer PE. 2016. Extreme Dysbiosis of the Microbiome in Critical Illness. mSphere 1. · DOI · Paper page
- 10.1038/nature24621 · DOI · Paper page
- 10.1126/science.aan4834 · DOI · Paper page
- Amir A , McDonald D , Navas-Molina JA , Debelius J , Morton JT , Hyde E , Robbins-Pianka A , Knight R. 2017. Correcting for Microbial Blooms in Fecal Samples during Room-Temperature Shipping. mSystems 2. · DOI
- 10.1038/nature12820 · DOI · Paper page
- 10.1038/nature11234 · DOI · Paper page
- 10.1038/nbt.3597 · DOI · Paper page
- 10.1073/pnas.1203689109 · DOI
- 10.1007/s11306-007-0082-2 · DOI · Paper page
Cited by
Sorted by citations
Cryan, J. F., O'Riordan, K. J., Cowan, C. S. M., Sandhu, K. V., Bastiaanssen, T. F. S., Boehme, M., Codagnone, M. G., Cussotto, S., Fulling, C., Golubeva, A. V., et al. (2019) · Physiological Reviews · doi:10.1152/physrev.00018.2018 · Cited by 5,286
The neuroactive potential of the human gut microbiota in quality of life and depression
Valles-Colomer, M., Falony, G., Darzi, Y., Tigchelaar, E. F., Wang, J., Tito, R. Y., Schiweck, C., Kurilshikov, A., Joossens, M., Wijmenga, C., et al. (2019) · Nature Microbiology · doi:10.1038/s41564-018-0337-x · Cited by 1,963
You are what you eat: Diet, health and the gut microbiota
Zmora, N., Suez, J., & Elinav, E. (2019) · Nature Reviews Gastroenterology & Hepatology · doi:10.1038/s41575-018-0061-2 · Cited by 1,792
Feature-based molecular networking in the GNPS analysis environment
Nothias-Scaglia, L.-F., Petras, D., Schmid, R., Dührkop, K., Rainer, J., Sarvepalli, A., Protsyuk, I., Ernst, M., Tsugawa, H., Fleischauer, M., et al. (2020) · Nature Methods · doi:10.1038/s41592-020-0933-6 · Cited by 1,689
Self-citationChiu, C. Y., & Miller, S. A. (2019) · Nature Reviews Genetics · doi:10.1038/s41576-019-0113-7 · Cited by 1,620
Metadata
- Authors
- McDonalda, D., Hyde, E., Debelius, J. W., Morton, J. T., Gonzalez, A., Ackermann, G., Aksenov, A. A., Behsaz, B., Brennan, C., Chen, Y., Goldasich, L. D., Dorrestein, P. C., Dunn, R. R., Fahimipour, A. K., Gaffney, J., Gilbert, J. A., Gogul, G., Green, J. L., Hugenholtz, P., Humphrey, G., Huttenhower, C., Jackson, M. A., Janssen, S., Jeste, D. V., Jiang, L., Kelley, S. T., Knights, D., Kosciolek, T., Ladau, J., Leach, J., Marotz, C., Meleshko, D., Melnik, A. V., Metcalf, J. L., Mohimani, H., Montassier, E., Navas-Molina, J., Nguyen, T. T., Peddada, S., Pevzner, P., Pollard, K. S., Rahnavard, G., Robbins-Pianka, A., Sangwan, N., Shorenstein, J., Smarr, L., Song, S. J., Spector, T., Swafford, A. D., Thackray, V. G., Thompson, L. R., Tripathi, A., Vazquez-Baeza, Y., Vrbanac, A., Wischmeyer, P., Wolfe, E., Zhu, Q., The American Gut Consortium, & Knight, R.
- Affiliations
- University of California San Diego (US)
- San Diego State University (US)
- North Carolina State University (US)
- University of Oregon (US)
- Argonne National Laboratory (US)
- The University of Queensland (AU)
- Broad Institute (US)
- King's College London (GB)
- University of Minnesota (US)
- Gladstone Institutes (US)
- St Petersburg University (RU)
- Colorado State University (US)
- Carnegie Mellon University (US)
- University of Pittsburgh (US)
- National Oceanic and Atmospheric Administration (US)
- Duke University (US)
- Corresponding author
- Knight, Rob
- ORCID
- McDonalda, Daniel
- Debelius, Justine W.
- Morton, James T.
- Ackermann, Gail
- Aksenov, Alexander A.
- Brennan, Caitriona
- Chen, Yingfeng
- Goldasich, Lindsay DeRight
- Dorrestein, Pieter C.
- Dunn, Robert R.
- Fahimipour, Ashkaan K.
- Gaffney, James
- Gilbert, Jack A
- Gogul, Grant
- Hugenholtz, Philip
- Huttenhower, Curtis
- Jackson, Matthew A.
- Janssen, Stefan
- Jeste, Dilip V.
- Jiang, Lingjing
- Kelley, Scott T.
- Knights, Dan
- Ladau, Joshua
- Leach, Jeff
- Marotz, Clarisse
- Meleshko, Dmitry
- Melnik, Alexey V.
- Metcalf, Jessica L.
- Mohimani, Hosein
- Montassier, Emmanuel
- Navas-Molina, Jose
- Nguyen, Tanya T.
- Peddada, Shyamal
- Pevzner, Pavel
- Pollard, Katherine S.
- Sangwan, Naseer
- Shorenstein, Joshua
- Smarr, Larry
- Song, Se Jin
- Swafford, Austin D.
- Thackray, Varykina G.
- Thompson, Luke R.
- Tripathi, Anupriya
- Vrbanac, Alison
- Wischmeyer, Paul
- Wolfe, Elaine
- Zhu, Qiyun
- Knight, Rob
- Venue
- mSystems
- Publisher
- openRxiv
- Published
- 2018-03-07
- Volume
- 3
- Issue
- 3
- ISSN
- 2379-5077 (ISSN-L)
- PMC
- PMC5954204
- OpenAlex
- W2794407684
- Cited by
- 878
- References
- 121
- Citations by year
- 2026: 59 · 2025: 114 · 2024: 106 · 2023: 100 · 2022: 137 · 2021: 132 · 2020: 108 · 2019: 90 · 2018: 30
- FWCI
- 32.11
- Type
- journal article
- Language
- en
- Open access
- gold
- doi.org
- Licence
- public-domain
- Locations
- mSystems (publishedVersion, public-domain)
- bioRxiv (Cold Spring Harbor Laboratory) (acceptedVersion, cc-by)
- Europe PMC (PubMed Central) (publishedVersion, cc-by)
- PubMed Central (publishedVersion, cc-by)
- PubMed (publishedVersion)
- Ghent University Academic Bibliography (Ghent University) (publishedVersion, other-oa)
- Ghent University Academic Bibliography (Ghent University) (submittedVersion, cc-by)
- eScholarship (California Digital Library) (submittedVersion, public-domain)
- NOAA Institutional Repository (submittedVersion, cc-by)
- OSTI OAI (U.S. Department of Energy Office of Scientific and Technical Information) (submittedVersion, public-domain)
- Digital Access to Libraries (submittedVersion, other-oa)
- DOAJ (DOAJ: Directory of Open Access Journals) (submittedVersion, cc-by-sa)
- DOAJ (DOAJ: Directory of Open Access Journals) (submittedVersion)
- eScholarship (California Digital Library) (submittedVersion)
- Research Portal (King's College London) (submittedVersion, cc-by)
- OSTI OAI (U.S. Department of Energy Office of Scientific and Technical Information) (submittedVersion)
- PUB – Publications at Bielefeld University (Bielefeld University) (submittedVersion)
- Publikationen an der Universität Bielefeld (Universität Bielefeld) (submittedVersion, cc-by)
- MPG.PuRe (Max Planck Society) (submittedVersion)
- Funders
- National Science Foundation (1144807, DE-AC02–06CH11357, 1053575)
- U.S. Department of Energy (DE‐ AC02‐06CH11357, ACI-1053575, AC02‐06CH11357, 06CH11357, DE-AC02-)
- Alfred P. Sloan Foundation
- Wellcome Trust
- San Diego Supercomputer Center
- National Institute for Health and Care Research (NF-SI-0507-10228, NF-SI-0514-10027)
- King's College London
- Russian Science Foundation (14‐50‐00069, 14-50-)
- Société Nationale Française de Gastro-Entérologie
- Walloon excellence in life sciences and biotechnology
- University of Colorado Boulder (DE-AC02-06CH11357)
- University of California, San Diego (DE-AC02-06CH11357)
- Hansjörg Wyss Institute for Biologically Inspired Engineering, Harvard University
- Medical Research Council (MR/N030125/1, MR/N01183X/1)
- National Institute of General Medical Sciences (T32GM007752)
- National Institute of Diabetes and Digestive and Kidney Diseases (P30DK042086, P30DK043351)
- Topics
- Life Sciences › Biochemistry, Genetics and Molecular Biology › Molecular Biology › Gut microbiota and health
- Physical Sciences › Computer Science › Information Systems › Research Data Management Practices
- Physical Sciences › Environmental Science › Ecology › Microbial Community Ecology and Physiology
- Keywords
- citizen science, microbiome research, untargeted metabolomics, gut microbiota
About these checks
Registry, retraction, Cites and statistics results are computed, not judged, with one exception: a printed reference that no index lists is read once by a model before it counts as a citation error. Claims are extracted by a model and kept only when their quote appears verbatim in the text; each cited source is then checked, with a model’s help, for whether it says what the claim relies on. Those verdicts can be wrong — read the claim’s quote and the cited source before relying on one.
Statistics and arithmetic are recomputed, not judged.
Confidence bands are shown only for fields calibrated on our annotated test set. None is calibrated yet, so no band is shown.
What counts as a claim ›How we measure confidence ›How we check this ›
Are you an author, or do you see a problem with this page? Request a review
