PreprintCited by 133MicroRNA in disease regulationRNA Research and SplicingRNA Interference and Gene Delivery

The DOI matches its Crossref record; 1 of the 1 references it cites were found in a registry or an index.

Global analyses of the dynamics of mammalian microRNA metabolism

Open access
Kingston, Elena R., Bartel, David P.·2019·Genome Research

Preprint — published as 10.1101/gr.251421.119 · Paper page

Abstract

Rates of production and degradation together specify microRNA (miRNA) abundance and dynamics. Here, we used approach-to-equilibrium metabolic labeling to assess these rates for 176 miRNAs in contact-inhibited mouse embryonic fibroblasts (MEFs), 182 miRNAs in dividing MEFs, and 136 miRNAs in mouse embryonic stem cells (mESCs). MicroRNA duplexes, each comprising a mature miRNA and its passenger strand, are produced at rates as fast as 114 ± 49 copies/cell per min, which exceeds rates reported for any mRNAs. These duplexes are rapidly loaded into Argonaute, with <10 min typically required for duplex loading and silencing-complex maturation. Within Argonaute, guide strands have stabilities that vary by 100-fold. Half-lives also vary globally between cell lines, with median values ranging from 6.3 to 34 h in mESCs and contact-inhibited MEFs, respectively. Moreover, relative half-lives for individual miRNAs vary between cell types, implying the influence of cell-specific factors in dictating turnover rate. The apparent influence of miRNA regions most important for targeting, together with the effect of one target on miR-7a-5p accumulation, suggest that targets fulfill this role. Analysis of the tailing and trimming of miRNA 3′ termini showed that the flux was typically greatest through the isoform tailed with a single uridine, although changes in this flux did not correspond to changes in stability, which suggested that the processes of tailing and trimming might be independent from that of decay. Together these results establish a framework for describing the dynamics and regulation of miRNAs throughout their lifecycle.

Overview

The claims and statistics of this paper haven’t been checked yet.

Run the check — free, no account needed. It reads the open-access text and checks the sources it cites.

A few free checks a day · papers already verified open instantly · results are public

Integrity signals

Registry

Crossref · 10.1101/607150

Cites

1 of 1 references verified0 citation errors · 0 not checkable

Statistics

Figures

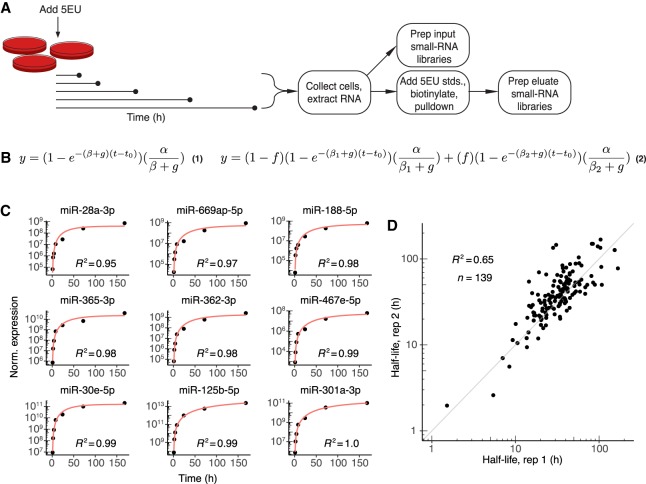
Figure 1. Labeling with 5EU generates reproducible miRNA half-life values. (A) Schematic of the experimental setup. 5EU is added at time zero, and samples are collected at subsequent time intervals. RNA is extracted from each sample, and a small fraction of this extracted RNA is used to generate small-RNA sequencing libraries. The remainder of the RNA is mixed with quantitative standards (stds.), and molecules with one or more 5EU nucleotides are biotinylated and captured using streptavidin beads. RNA eluted from the beads is prepared for small-RNA sequencing. (B) Equations used for fitting approach-to-steady-state data. Equation 1 represents the single-exponential model used to fit a single decay rate for guide strands. Equation 2 represents the biexponential model used to fit two decay rates for both passenger and guide strands when assessing passenger-strand half-lives. Fits returned estimates for α (production rate), βn (degradation rate, with n distinguishing the two rates of Equation 2), f (fraction of molecules exhibiting the corresponding degradation rate), and t0 (time offset). The variable g describes the rate of cell doubling and was set manually based on experimental observations. Fits were carried out for each miRNA guide or passenger strand that satisfied an expression cut-off of 60 reads per million miRNA-mapping reads (i.e., 60 RPM) at each time point. (C) Representative fits to data from contact-inhibited MEFs. Data are plotted with black points, and single-exponential fits with a red line. Time courses representing the 10th through 90th deciles in goodness-of-fit are shown in order of increasing goodness-of-fit (from top left to bottom right). (D) Reproducibility of half-life measurements for guide strands. Shown is the relationship between values determined independently from each of the two biological replicates from contact-inhibited MEFs.
Figure 1. Labeling with 5EU generates reproducible miRNA half-life values. (A) Schematic of the experimental setup. 5EU is added at time zero, and samples are collected at subsequent time intervals. RNA is extracted from each sample, and a small fraction of this extracted RNA is used to generate small-RNA sequencing libraries. The remainder of the RNA is mixed with quantitative standards (stds.), and molecules with one or more 5EU nucleotides are biotinylated and captured using streptavidin beads. RNA eluted from the beads is prepared for small-RNA sequencing. (B) Equations used for fitting approach-to-steady-state data. Equation 1 represents the single-exponential model used to fit a single decay rate for guide strands. Equation 2 represents the biexponential model used to fit two decay rates for both passenger and guide strands when assessing passenger-strand half-lives. Fits returned estimates for α (production rate), βn (degradation rate, with n distinguishing the two rates of Equation 2), f (fraction of molecules exhibiting the corresponding degradation rate), and t0 (time offset). The variable g describes the rate of cell doubling and was set manually based on experimental observations. Fits were carried out for each miRNA guide or passenger strand that satisfied an expression cut-off of 60 reads per million miRNA-mapping reads (i.e., 60 RPM) at each time point. (C) Representative fits to data from contact-inhibited MEFs. Data are plotted with black points, and single-exponential fits with a red line. Time courses representing the 10th through 90th deciles in goodness-of-fit are shown in order of increasing goodness-of-fit (from top left to bottom right). (D) Reproducibility of half-life measurements for guide strands. Shown is the relationship between values determined independently from each of the two biological replicates from contact-inhibited MEFs.CC BY-NC · PubMed Central
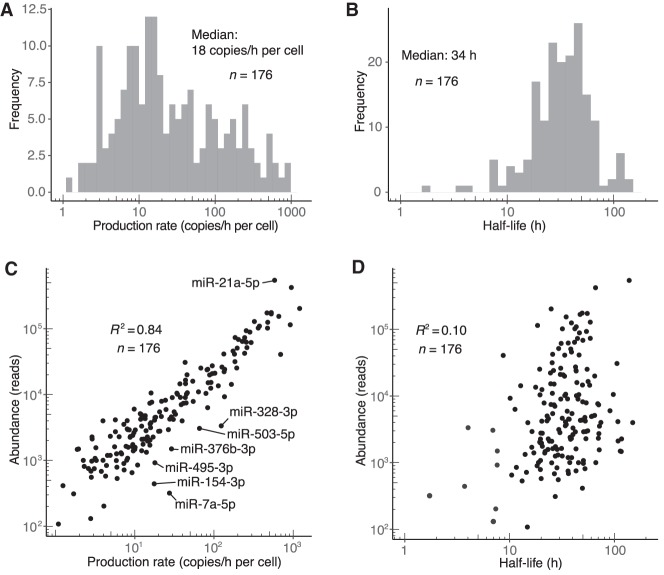
Figure 2. Dynamics of miRNA guide strands in contact-inhibited MEFs. (A) Distribution of production rates for guide strands in contact-inhibited MEFs. (B) Distribution of half-life values for guide strands in contact-inhibited MEFs. (C) Relationship between steady-state abundance (reads in the 1-wk input sample) and production rate of guide strands in contact-inhibited MEFs. Outliers that passed an expression threshold (production rate >5 copies/h/cell) and differed significantly from the best linear fit (|z-score| > 2) are labeled. (D) Relationship between steady-state abundance (reads in the 1-wk input sample) and half-life of guide strands in contact-inhibited MEFs. The eight most rapidly turned over miRNAs, in order from least to most stable, were miR-7a-5p, miR-154-3p, miR-328-3p, miR-503-5p, miR-450b-5p, miR-329-5p, miR-495-3p, and miR-376b-3p.
Figure 2. Dynamics of miRNA guide strands in contact-inhibited MEFs. (A) Distribution of production rates for guide strands in contact-inhibited MEFs. (B) Distribution of half-life values for guide strands in contact-inhibited MEFs. (C) Relationship between steady-state abundance (reads in the 1-wk input sample) and production rate of guide strands in contact-inhibited MEFs. Outliers that passed an expression threshold (production rate >5 copies/h/cell) and differed significantly from the best linear fit (|z-score| > 2) are labeled. (D) Relationship between steady-state abundance (reads in the 1-wk input sample) and half-life of guide strands in contact-inhibited MEFs. The eight most rapidly turned over miRNAs, in order from least to most stable, were miR-7a-5p, miR-154-3p, miR-328-3p, miR-503-5p, miR-450b-5p, miR-329-5p, miR-495-3p, and miR-376b-3p.CC BY-NC · PubMed Central
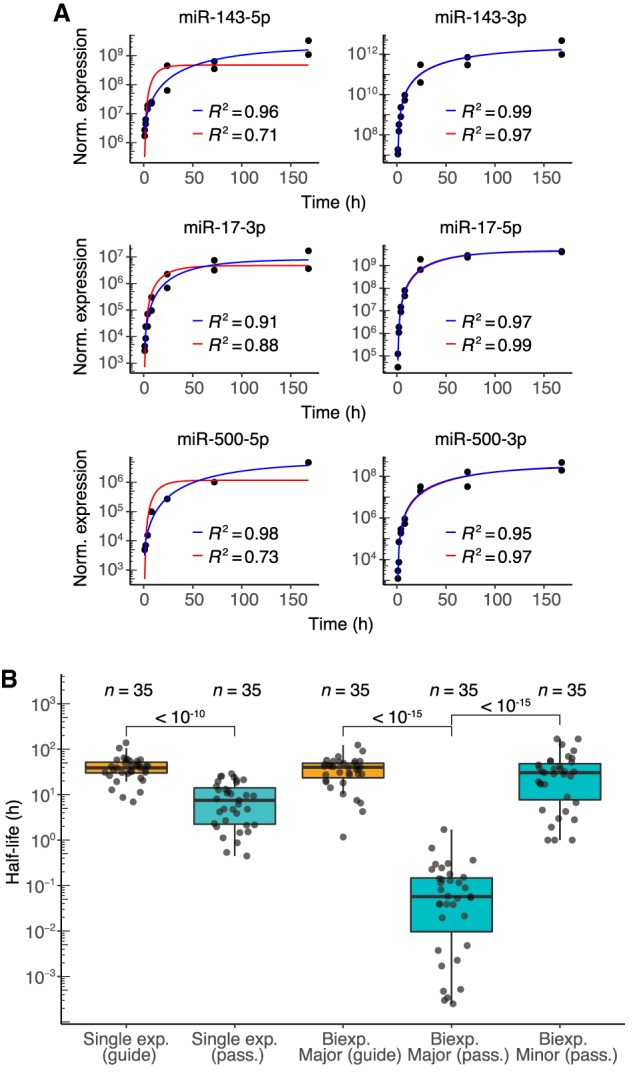
Figure 3. Dynamics of passenger strands in contact-inhibited MEFs. (A) Examples of fits for passenger strands and corresponding guide strands (left and right, respectively). Single- and biexponential fits are indicated (red and blue lines, respectively) with corresponding R2 values. (B) Half-life distributions for guide and passenger strands (orange and teal, respectively) obtained using either the single-exponential (single exp.) or biexponential (biexp.) fitting methods (box, quartiles; whiskers, at most 1.5 times the inter-quartile range). The major half-life was the one that corresponded to the majority of the specified strand (i.e., for the passenger strand, the molecules not incorporated into the mature silencing complex, and for the guide strand, the molecules incorporated into the mature complex), whereas the minor half-life was the one that corresponded to the minority of the specified strand. P values (two-sample t-test) are shown for the indicated comparisons.
Figure 3. Dynamics of passenger strands in contact-inhibited MEFs. (A) Examples of fits for passenger strands and corresponding guide strands (left and right, respectively). Single- and biexponential fits are indicated (red and blue lines, respectively) with corresponding R2 values. (B) Half-life distributions for guide and passenger strands (orange and teal, respectively) obtained using either the single-exponential (single exp.) or biexponential (biexp.) fitting methods (box, quartiles; whiskers, at most 1.5 times the inter-quartile range). The major half-life was the one that corresponded to the majority of the specified strand (i.e., for the passenger strand, the molecules not incorporated into the mature silencing complex, and for the guide strand, the molecules incorporated into the mature complex), whereas the minor half-life was the one that corresponded to the minority of the specified strand. P values (two-sample t-test) are shown for the indicated comparisons.CC BY-NC · PubMed Central
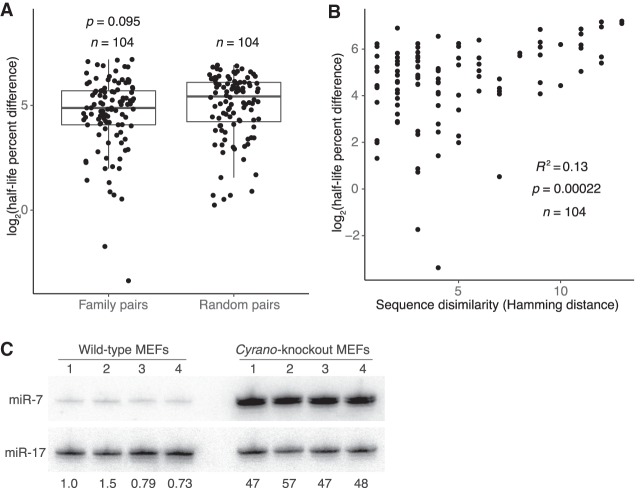
Figure 4. Features associated with rapid miRNA turnover. (A) Differences in half-life for pairs of family members or randomly paired guides. For each pair-wise comparison of all members within each miRNA family, half-life percent differences were computed as the absolute value of the difference between half-lives, divided by the mean of the two half-lives, with this fraction then multiplied by 100. The log2-transformed percent-difference values of all such comparisons in contact-inhibited MEFs are plotted (box, quartiles; whiskers, at most 1.5 times the inter-quartile range). Twenty-five equally sized cohorts of randomly paired guides were analyzed in the same way, with the cohort shown for comparison being the one with the median value of significance (P value, two-sample t-test). (B) Relationship between half-life difference and the number of nonidentical nucleotides (Hamming distance) when comparing pairs of family members. Only nucleotides 3′ of the seed region were considered for the Hamming-distance measurement. Greater Hamming distances represent more dissimilar sequences. Significance of the correlation was determined by a t-test. (C) The effect of Cyrano on steady-state miR-7 levels in contact-inhibited MEFs. Shown is a scan of a northern blot analyzing RNA from wild-type and Cyrano-knockout contact-inhibited MEFs. For each cell line, four biological replicates were analyzed, sequentially probing for miR-17, which served as a loading control, and then for miR-7. The fold-difference in miR-7 relative to the average miR-7 level in wild-type MEFs is shown below each lane.
Figure 4. Features associated with rapid miRNA turnover. (A) Differences in half-life for pairs of family members or randomly paired guides. For each pair-wise comparison of all members within each miRNA family, half-life percent differences were computed as the absolute value of the difference between half-lives, divided by the mean of the two half-lives, with this fraction then multiplied by 100. The log2-transformed percent-difference values of all such comparisons in contact-inhibited MEFs are plotted (box, quartiles; whiskers, at most 1.5 times the inter-quartile range). Twenty-five equally sized cohorts of randomly paired guides were analyzed in the same way, with the cohort shown for comparison being the one with the median value of significance (P value, two-sample t-test). (B) Relationship between half-life difference and the number of nonidentical nucleotides (Hamming distance) when comparing pairs of family members. Only nucleotides 3′ of the seed region were considered for the Hamming-distance measurement. Greater Hamming distances represent more dissimilar sequences. Significance of the correlation was determined by a t-test. (C) The effect of Cyrano on steady-state miR-7 levels in contact-inhibited MEFs. Shown is a scan of a northern blot analyzing RNA from wild-type and Cyrano-knockout contact-inhibited MEFs. For each cell line, four biological replicates were analyzed, sequentially probing for miR-17, which served as a loading control, and then for miR-7. The fold-difference in miR-7 relative to the average miR-7 level in wild-type MEFs is shown below each lane.CC BY-NC · PubMed Central
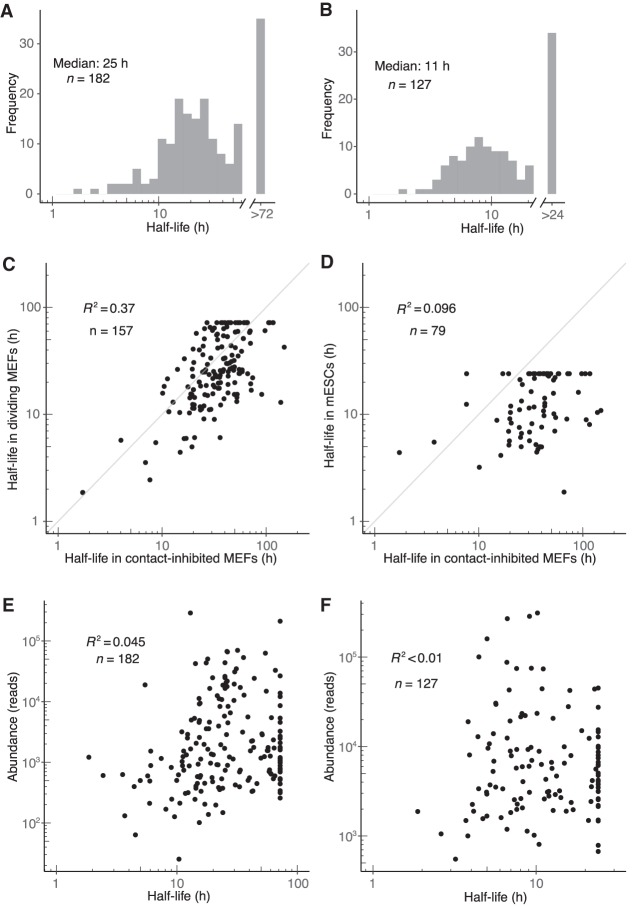
Figure 5. Dynamics of miRNA guide strands in dividing MEFs and mESCs. (A,B) Half-life distributions for guide strands in dividing MEFs (A) and mESCs (B). Half-lives were capped at the duration of the longest time interval (72 h and 24 h in dividing MEFs and mESCs, respectively), as modeling indicated that longer half-lives would be fit less accurately. (C,D) Guide-strand half-lives in dividing MEFs (C) and mESCs (D) as a function of those half-lives in contact-inhibited MEFs. (E,F) Relationship between steady-state abundance and half-life in dividing MEFs (E) and mESCs (F). Steady-state abundance is measured as reads in the 72- and 24-h input sample, respectively.
Figure 5. Dynamics of miRNA guide strands in dividing MEFs and mESCs. (A,B) Half-life distributions for guide strands in dividing MEFs (A) and mESCs (B). Half-lives were capped at the duration of the longest time interval (72 h and 24 h in dividing MEFs and mESCs, respectively), as modeling indicated that longer half-lives would be fit less accurately. (C,D) Guide-strand half-lives in dividing MEFs (C) and mESCs (D) as a function of those half-lives in contact-inhibited MEFs. (E,F) Relationship between steady-state abundance and half-life in dividing MEFs (E) and mESCs (F). Steady-state abundance is measured as reads in the 72- and 24-h input sample, respectively.CC BY-NC · PubMed Central
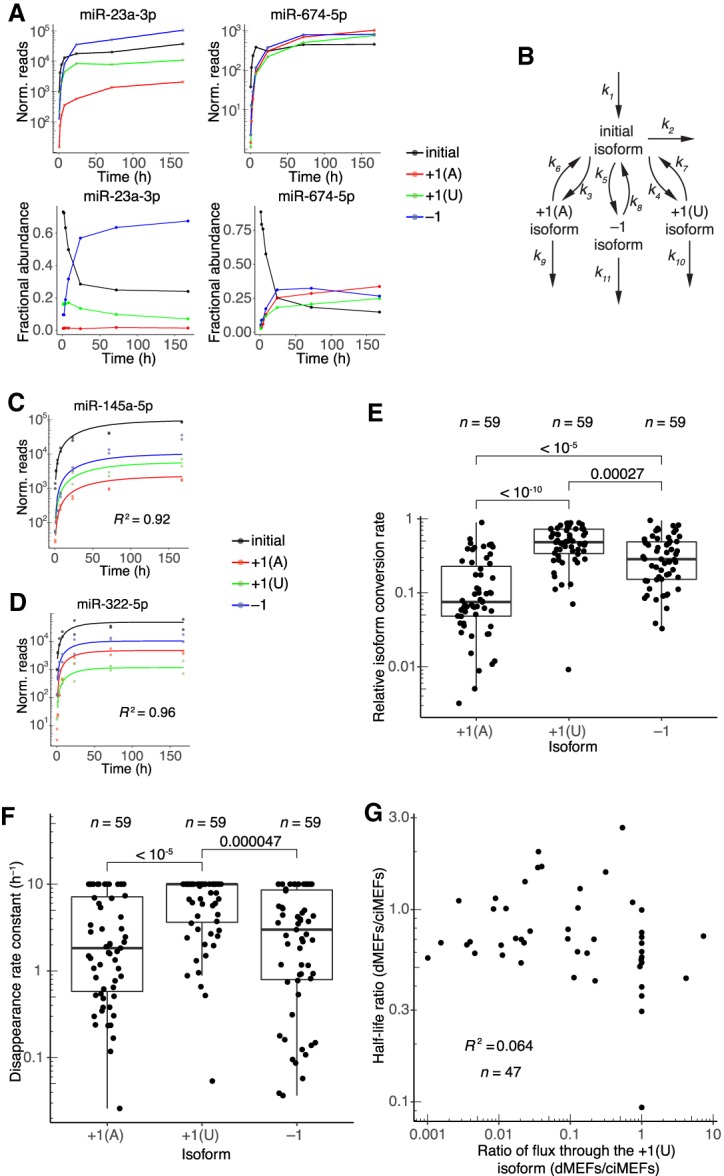
Figure 6. Dynamics of 3′-end isoforms. (A) Isoform accumulation for miR-23a-3p and miR-674-5p, two guide RNAs for which accumulation of derivatives of the initial isoform overtook that of the initial isoform. (Top) Absolute accumulation of the initial isoform (black) and its major derivatives, in which it is either trimmed by 1 nt (−1, blue) or tailed with either a single A (+1[A], red) or a single U (+1[U], green). Lines connect the mean values for each time point and do not represent fits to the data. (Bottom) Fractional abundance of the initial isoform and its major derivatives. (B) Schematic depicting the isoform-conversion model that was fit to the data and used for simulations. Arrows represent processes catalyzed by the cellular milieu of nucleotidyl transferases, phosphodiesterases, and other enzymes; the model is agnostic to the particular enzyme that carries out each reaction. Rate constants extracted from the fit are labeled (kn). Isoform nomenclature is as in A. (C,D) Representative examples of fits to isoform dynamics for miRNAs in contact-inhibited MEFs. Shown is the plot from the middle of the lowest quartile (miR-145a-5p, R2 = 0.92) and the plot from the middle of the highest quartile (miR-322-5p, R2 = 0.96) of goodness-of-fit (R2), when fitting data from both replicates. (E) Relative rates of conversion to the +1(A), +1(U), and −1 isoforms in contact-inhibited MEFs. Rate constants of conversion to each isoform (k3, k4, and k5 for +1(A), +1(U), and −1, respectively) were normalized to the summed conversion rate constant (k3 + k4 + k5) to generate the relative rates of conversion. Simulations indicated that conversion rate constants >1 h−1 could not be accurately fit, and thus conversion rate constants were capped at this value. Significance was evaluated with a Mann–Whitney U test, and P values are shown. (F) Rate constants for disappearance (k6 + k9, k7 + k10, or k8 + k11) of the +1(A), +1(U), and −1 isoforms, respectively, in contact-inhibited MEFs. Simulations indicated that disappearance rate constants >10 h−1 could not be accurately fit, and thus disappearance rate constants were capped at this value. Significance was evaluated with a Mann–Whitney U test, and all significant comparisons are indicated together with their P values. (G) Correlation between half-life ratios (dividing values from dividing MEFs by those from contact-inhibited MEFs) and ratios of the flux through the +1(U) isoform (again dividing values from dividing MEFs by those from contact-inhibited MEFs). Dividing MEFs are denoted as dMEFs; contact-inhibited MEFs are denoted as ciMEFs.
Figure 6. Dynamics of 3′-end isoforms. (A) Isoform accumulation for miR-23a-3p and miR-674-5p, two guide RNAs for which accumulation of derivatives of the initial isoform overtook that of the initial isoform. (Top) Absolute accumulation of the initial isoform (black) and its major derivatives, in which it is either trimmed by 1 nt (−1, blue) or tailed with either a single A (+1[A], red) or a single U (+1[U], green). Lines connect the mean values for each time point and do not represent fits to the data. (Bottom) Fractional abundance of the initial isoform and its major derivatives. (B) Schematic depicting the isoform-conversion model that was fit to the data and used for simulations. Arrows represent processes catalyzed by the cellular milieu of nucleotidyl transferases, phosphodiesterases, and other enzymes; the model is agnostic to the particular enzyme that carries out each reaction. Rate constants extracted from the fit are labeled (kn). Isoform nomenclature is as in A. (C,D) Representative examples of fits to isoform dynamics for miRNAs in contact-inhibited MEFs. Shown is the plot from the middle of the lowest quartile (miR-145a-5p, R2 = 0.92) and the plot from the middle of the highest quartile (miR-322-5p, R2 = 0.96) of goodness-of-fit (R2), when fitting data from both replicates. (E) Relative rates of conversion to the +1(A), +1(U), and −1 isoforms in contact-inhibited MEFs. Rate constants of conversion to each isoform (k3, k4, and k5 for +1(A), +1(U), and −1, respectively) were normalized to the summed conversion rate constant (k3 + k4 + k5) to generate the relative rates of conversion. Simulations indicated that conversion rate constants >1 h−1 could not be accurately fit, and thus conversion rate constants were capped at this value. Significance was evaluated with a Mann–Whitney U test, and P values are shown. (F) Rate constants for disappearance (k6 + k9, k7 + k10, or k8 + k11) of the +1(A), +1(U), and −1 isoforms, respectively, in contact-inhibited MEFs. Simulations indicated that disappearance rate constants >10 h−1 could not be accurately fit, and thus disappearance rate constants were capped at this value. Significance was evaluated with a Mann–Whitney U test, and all significant comparisons are indicated together with their P values. (G) Correlation between half-life ratios (dividing values from dividing MEFs by those from contact-inhibited MEFs) and ratios of the flux through the +1(U) isoform (again dividing values from dividing MEFs by those from contact-inhibited MEFs). Dividing MEFs are denoted as dMEFs; contact-inhibited MEFs are denoted as ciMEFs.CC BY-NC · PubMed Central

Verification

Claims the paper makes

The claims and statistics of this paper haven’t been checked yet.

Run the check — free, no account needed. It reads the open-access text and checks the sources it cites.

A few free checks a day · papers already verified open instantly · results are public

Self-check

Percentages, sums and reported differences re-computed from the paper’s own numbers.

The self-check needs the paper’s full text.

Citations

Cites

Research works printed but not linked: 74

  1. 10.1126/science.1187058 · DOI · Paper page
  2. 10.1038/nrm3611 · DOI · Paper page
  3. 10.1093/bioinformatics/btu638 · DOI · Paper page
  4. 10.1261/rna.1851510 · DOI
  5. 10.1016/j.cell.2009.01.002 · DOI · Paper page
  6. 10.1016/j.cell.2018.03.006 · DOI · Paper page
  7. 10.1261/rna.7240905 · DOI · Paper page
  8. 10.4161/trns.2.3.16172 · DOI · Paper page
  9. 2018, MicroRNA degradation by a conserved target RNA regulates animal behavior, Nature structural & molecular biology, 25, 244, 10.1038/s41594-018-0032-x · DOI
  10. 10.1101/gr.106054.110 · DOI
  11. 10.1126/science.1187197 · DOI · Paper page
  12. Chan, S. H. , Y. Tang , L. Miao , H. Darwich-Codore , C. E. Vejnar , J. Beaudoin , D. Musaev , J. P. Fernandez , et al. 2018. Brd4 and P300 regulate zygotic genome activation through histone acetylation. · DOI
  13. 10.1101/gr.193607.115 · DOI · Paper page
  14. 10.1016/j.devcel.2011.02.008 · DOI · Paper page
  15. 2015, General hallmarks of microRNAs in brain evolution and development, RNA biology, 12, 701, 10.1080/15476286.2015.1048954 · DOI
  16. 10.1016/0092-8674(91)90144-N · DOI
  17. 2007, In vivo dynamics of RNA polymerase II transcription, Nature structural & molecular biology, 14, 796, 10.1038/nsmb1280 · DOI · Paper page
  18. 10.15252/embr.201540078 · DOI · Paper page
  19. 10.1016/j.molcel.2016.09.027 · DOI · Paper page
  20. 10.1016/j.cell.2007.10.032 · DOI
  21. 10.1261/rna.1136108 · DOI
  22. 10.1016/j.molcel.2015.07.023 · DOI
  23. 10.1101/gr.082701.108 · DOI · Paper page
  24. 10.1093/nar/gkr148 · DOI
  25. 2018, Endogenous transcripts control miRNA levels and activity in mammalian cells by target-directed miRNA degradation, Nature communications, 9, 3119, 10.1038/s41467-018-05182-9 · DOI
  26. 10.1126/science.1109020 · DOI · Paper page
  27. 10.1016/j.molcel.2007.06.017 · DOI · Paper page
  28. 10.1093/nar/gkv057 · DOI
  29. 10.1038/nrm3838 · DOI · Paper page
  30. 1991, The E7 gene of human papillomavirus type 16 is sufficient for immortalization of human epithelial cells, Journal of virology, 65, 473, 10.1128/JVI.65.1.473-478.1991 · DOI
  31. 2007, DNA methylation regulates MicroRNA expression, Cancer biology & therapy, 6, 1290, 10.4161/cbt.6.8.4486 · DOI
  32. 10.1073/pnas.1506116112 · DOI
  33. 10.1016/j.molcel.2008.09.014 · DOI
  34. 10.1016/S1534-5807(03)00227-2 · DOI
  35. 10.1073/pnas.0808480105 · DOI
  36. 10.1038/ncb1931 · DOI
  37. 10.1038/emboj.2010.233 · DOI
  38. 2012, Differential impact of the HEN1 homolog HENN-1 on 21U and 26G RNAs in the germline of Caenorhabditis elegans, PLoS genetics, 8, e1002702, 10.1371/journal.pgen.1002702 · DOI
  39. 10.1101/gad.1761509 · DOI
  40. 10.1016/j.tibs.2010.03.009 · DOI · Paper page
  41. 10.1016/S0092-8674(03)00801-8 · DOI · Paper page
  42. 2018, A network of noncoding regulatory RNAs acts in the mammalian brain, Cell, 174, 350, 10.1016/j.cell.2018.05.022 · DOI
  43. 10.1016/j.molcel.2017.06.027 · DOI · Paper page
  44. 10.1016/j.cell.2010.03.039 · DOI · Paper page
  45. Kwasnieski, J. C. , T. L. Orr-Weaver and D. P. Bartel . 2019. Early genome activation in Drosophila is extensive with an initial tendency for aborted transcripts and retained introns. bioRxiv: 375204. · DOI
  46. 10.1002/ijc.22394 · DOI
  47. 10.1093/emboj/cdf476 · DOI
  48. 10.1016/j.cub.2005.07.029 · DOI
  49. 2015, HENMT1 and piRNA stability are required for adult male germ cell transposon repression and to define the spermatogenic program in the mouse, PLoS genetics, 11, e1005620, 10.1371/journal.pgen.1005620 · DOI
  50. 2018, Determining mRNA half-lives on a transcriptome-wide scale, Methods, 137, 90, 10.1016/j.ymeth.2017.12.006 · DOI
  51. 10.1038/ncb2024 · DOI
  52. 10.1261/rna.056937.116 · DOI
  53. 10.1371/journal.ppat.1002510 · DOI
  54. 10.14806/ej.17.1.20 · DOI
  55. 10.1101/gr.198788.115 · DOI
  56. 10.1261/rna.045104.114 · DOI
  57. 2006, A practical recipe for stable isotope labeling by amino acids in cell culture (SILAC), Nature protocols, 1, 2650, 10.1038/nprot.2006.427 · DOI
  58. 10.1038/nbt.1861 · DOI · Paper page
  59. 10.1093/nar/21.1.113 · DOI
  60. 10.1016/j.molcel.2011.08.021 · DOI
  61. 1995, mRNA stability in mammalian cells, Microbiol. Mol. Biol. Rev., 59, 423
  62. 10.1038/ncb1759 · DOI
  63. 10.1016/S0092-8674(03)00759-1 · DOI · Paper page
  64. 10.1101/gr.130161.111 · DOI
  65. 2015, Small-RNA asymmetry is directly driven by mammalian Argonautes, Nature structural & molecular biology, 22, 512, 10.1038/nsmb.3050 · DOI · Paper page
  66. 10.1016/j.tcb.2012.06.001 · DOI
  67. 10.1038/nature08025 · DOI · Paper page
  68. 2015, Cotranscriptional events in eukaryotic ribosome synthesis, Wiley Interdisciplinary Reviews: RNA, 6, 129, 10.1002/wrna.1263 · DOI
  69. 10.1126/science.1139089 · DOI
  70. 10.1126/science.1154040 · DOI
  71. 10.1261/rna.029090.111 · DOI
  72. 10.1126/science.1114519 · DOI · Paper page
  73. 10.1038/nbt.3298 · DOI · Paper page
  74. 2017, Widespread influence of 3′-end structures on mammalian mRNA processing and stability, Cell, 169, 905, 10.1016/j.cell.2017.04.036 · DOI

Metadata

Authors
Kingston, E. R., & Bartel, D. P.
Affiliations
Howard Hughes Medical Institute (US)
Corresponding author
Bartel, David P.
Venue
Genome Research
Publisher
openRxiv
Published
2019-04-12
Volume
29
Issue
11
Pages
1777-1790
ISSN
1088-9051 (ISSN-L)
OpenAlex
W2972836719
Cited by
133
References
1
Citations by year
2026: 19 · 2025: 15 · 2024: 21 · 2023: 27 · 2022: 19 · 2021: 18 · 2020: 10 · 2019: 4
Type
posted content
Language
en
Open access
Locations
  • Genome Research (publishedVersion)
  • bioRxiv (Cold Spring Harbor Laboratory) (acceptedVersion, cc-by-nd)
  • PubMed Central (publishedVersion, cc-by-nc)
  • PubMed (publishedVersion)
  • DSpace@MIT (Massachusetts Institute of Technology) (submittedVersion, cc-by-nc)
  • HighWire Press Open Archive (submittedVersion)
Funders
  • National Science Foundation
  • Howard Hughes Medical Institute
  • National Institutes of Health
  • National Institute of General Medical Sciences (R35GM118135)
Topics
  • Life Sciences › Biochemistry, Genetics and Molecular Biology › Cancer Research › MicroRNA in disease regulation
  • Life Sciences › Biochemistry, Genetics and Molecular Biology › Molecular Biology › RNA Research and Splicing
  • Life Sciences › Biochemistry, Genetics and Molecular Biology › Molecular Biology › RNA Interference and Gene Delivery
Keywords
microRNA biogenesis, miRNA stability, Argonaute proteins, microRNA target regulation, miR-7, mouse embryonic fibroblasts, mouse embryonic stem cells, cell cycle
MeSH terms
Animals, Cells, Cultured, MicroRNAs, Mice, High-Throughput Screening Assays

About these checks

Registry, retraction, Cites and statistics results are computed, not judged, with one exception: a printed reference that no index lists is read once by a model before it counts as a citation error. Claims are extracted by a model and kept only when their quote appears verbatim in the text; each cited source is then checked, with a model’s help, for whether it says what the claim relies on. Those verdicts can be wrong — read the claim’s quote and the cited source before relying on one.

Statistics and arithmetic are recomputed, not judged.

Confidence bands are shown only for fields calibrated on our annotated test set. None is calibrated yet, so no band is shown.

What counts as a claim ›How we measure confidence ›How we check this ›

Are you an author, or do you see a problem with this page? Request a review