

The DOI matches its Crossref record; 115 of the 115 references it cites were found in a registry or an index.
A Role for Thrombospondin-1 Deficits in Astrocyte-Mediated Spine and Synaptic Pathology in Down's Syndrome
Open accessAbstract
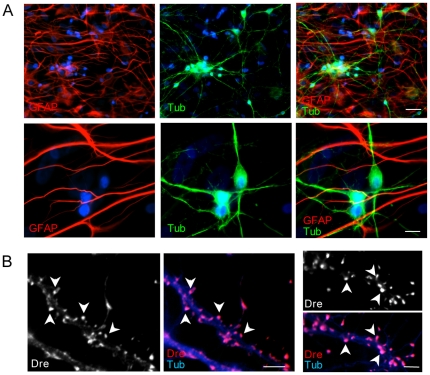
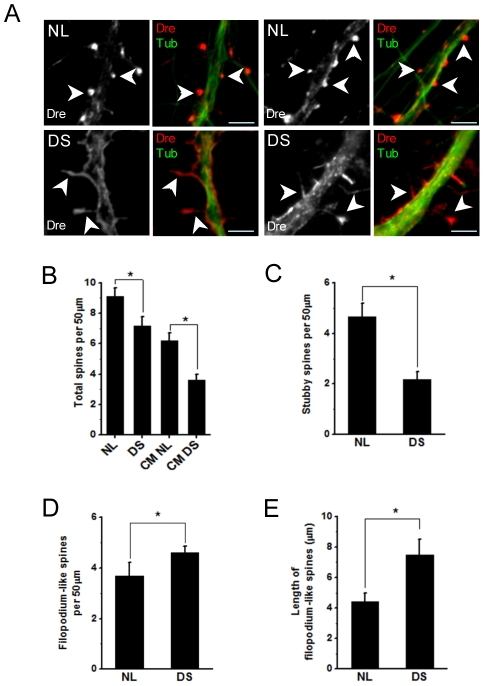
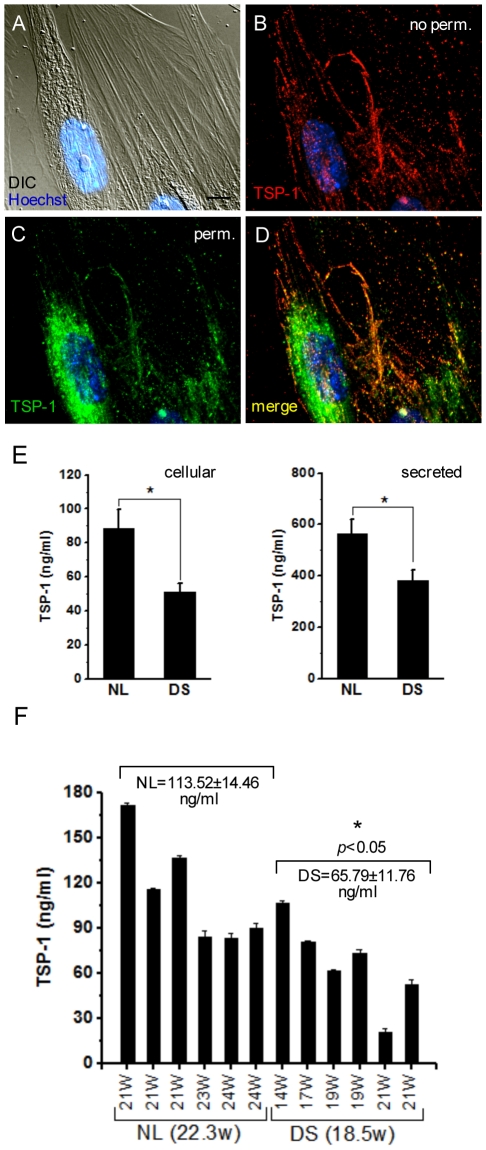
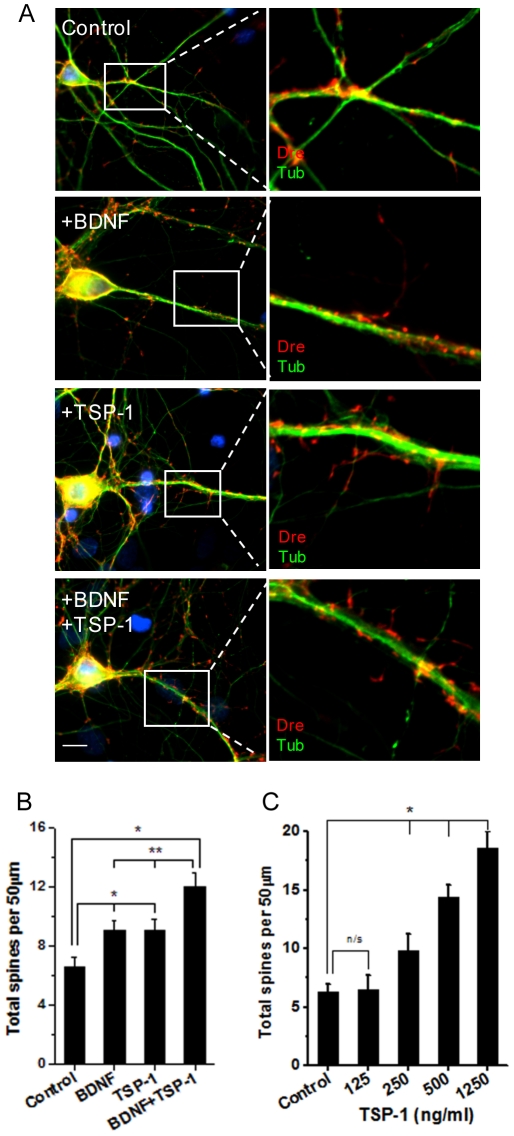
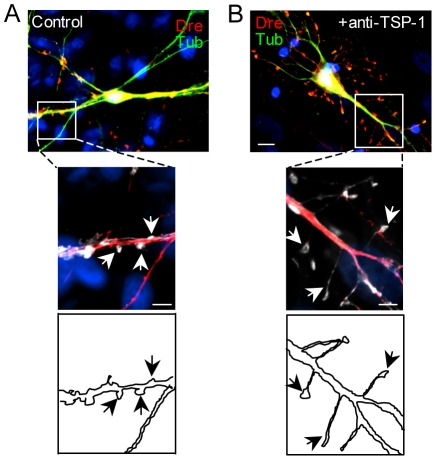
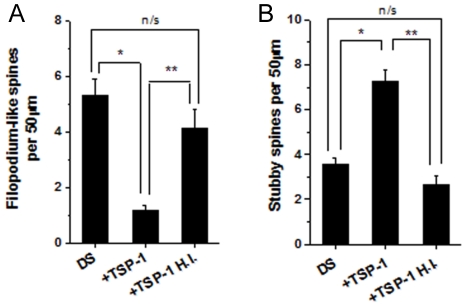
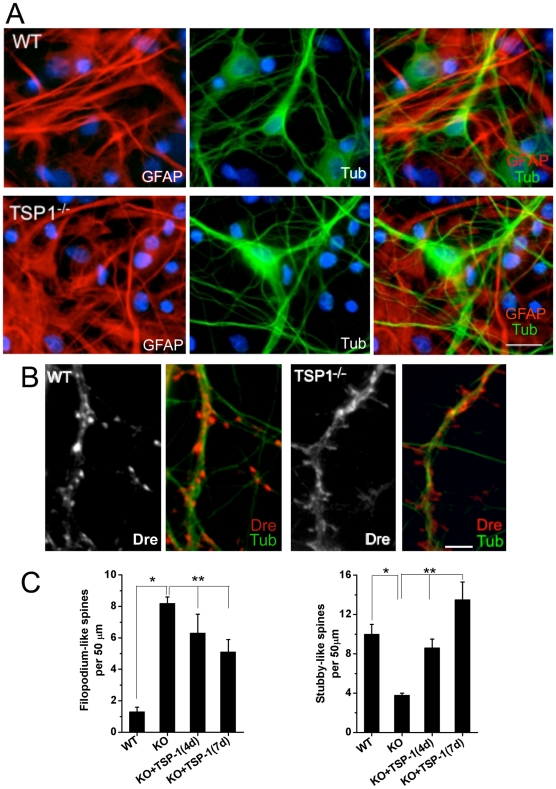
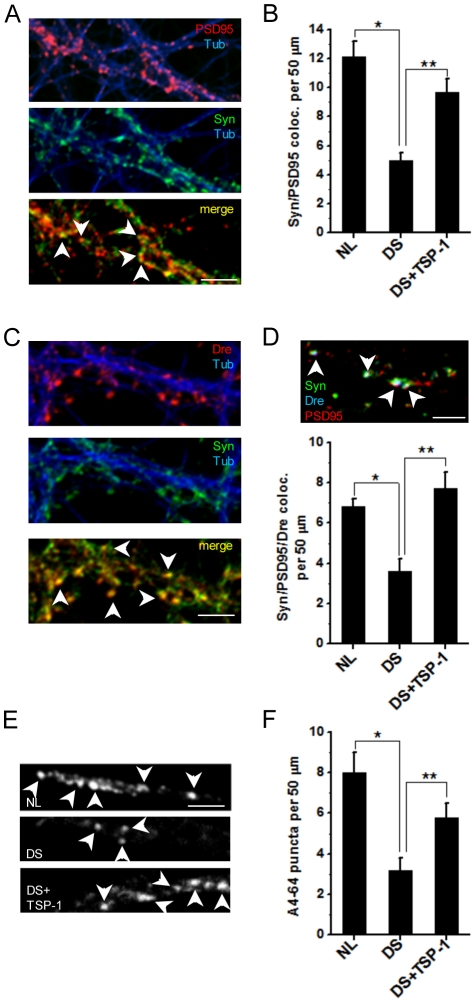
BACKGROUND: Down's syndrome (DS) is the most common genetic cause of mental retardation. Reduced number and aberrant architecture of dendritic spines are common features of DS neuropathology. However, the mechanisms involved in DS spine alterations are not known. In addition to a relevant role in synapse formation and maintenance, astrocytes can regulate spine dynamics by releasing soluble factors or by physical contact with neurons. We have previously shown impaired mitochondrial function in DS astrocytes leading to metabolic alterations in protein processing and secretion. In this study, we investigated whether deficits in astrocyte function contribute to DS spine pathology. METHODOLOGY/PRINCIPAL FINDINGS: Using a human astrocyte/rat hippocampal neuron coculture, we found that DS astrocytes are directly involved in the development of spine malformations and reduced synaptic density. We also show that thrombospondin 1 (TSP-1), an astrocyte-secreted protein, possesses a potent modulatory effect on spine number and morphology, and that both DS brains and DS astrocytes exhibit marked deficits in TSP-1 protein expression. Depletion of TSP-1 from normal astrocytes resulted in dramatic changes in spine morphology, while restoration of TSP-1 levels prevented DS astrocyte-mediated spine and synaptic alterations. Astrocyte cultures derived from TSP-1 KO mice exhibited similar deficits to support spine formation and structure than DS astrocytes. CONCLUSIONS/SIGNIFICANCE: These results indicate that human astrocytes promote spine and synapse formation, identify astrocyte dysfunction as a significant factor of spine and synaptic pathology in the DS brain, and provide a mechanistic rationale for the exploration of TSP-1-based therapies to treat spine and synaptic pathology in DS and other neurological conditions.
Overview
The claims and statistics of this paper haven’t been checked yet.
Run the check — free, no account needed. It reads the open-access text and checks the sources it cites.
Integrity signals
Registry
Cites
Statistics
Figures
Verification
Claims the paper makes
The claims and statistics of this paper haven’t been checked yet.
Run the check — free, no account needed. It reads the open-access text and checks the sources it cites.
Claims other papers make about this one
Each is checked against this paper’s own text: does it say what the citing paper says it does?
The source backs part of the claim, not all of it — or backs it for a different population, condition or comparison.
In the citing paper
“Evidence suggests that gene dysregulation and disrupted calcium signalling in glial cells also contribute to the synaptic deficits131,134.”
From Consequences of trisomy 21 for brain development in Down syndrome (2024) · cites this paper as [134]
Experimental — accuracy not yet measuredThe source backs part of the claim, not all of it — or backs it for a different population, condition or comparison.
In the citing paper
“Although the tools used to ensure accurate proportions of interneuron subtypes in a culture system have only recently been developed132, simple neuron–glia co-cultures have already provided evidence that astrocytes and microglia do have a role in the DS synaptic phenotype131,134,135.”
From Consequences of trisomy 21 for brain development in Down syndrome (2024) · cites this paper as [134]
Experimental — accuracy not yet measuredThe cited source says what the claim attributes to it.
In the citing paper
“Astrocytes isolated from DS fetal brain tissue produce less THBS1 than control astrocytes, and rodent neurons cultured with these astrocytes have fewer synapses and abnormal spine morphology than neurons cultured with control astrocytes134.”
From Consequences of trisomy 21 for brain development in Down syndrome (2024) · cites this paper as [134]
The cited source says what the claim attributes to it.
In the citing paper
“Astrocytes isolated from DS fetal brain tissue produce less THBS1 than control astrocytes, and rodent neurons cultured with these astrocytes have fewer synapses and abnormal spine morphology than neurons cultured with control astrocytes134.”
From Consequences of trisomy 21 for brain development in Down syndrome (2024) · cites this paper as [134]
The cited source says what the claim attributes to it.
In the citing paper
“The introduction of exogenous THBS1 into these cultures rescues synaptic and spine deficits, even when neurons are co-cultured with astrocytes from individuals with DS134.”
From Consequences of trisomy 21 for brain development in Down syndrome (2024) · cites this paper as [134]
Self-check
Percentages, sums and reported differences re-computed from the paper’s own numbers.
The self-check needs the paper’s full text.
Citations
Cites
Astrocytes, from brain glue to communication elements: the revolution continues
Volterra, A., & Meldolesi, J. (2005) · Nature reviews. Neuroscience · doi:10.1038/nrn1722 · Cited by 1,837
Brain interleukin 1 and S-100 immunoreactivity are elevated in Down syndrome and Alzheimer disease.
Griffin, W. S., Stanley, L. C., Ling, C., White, L., MacLeod, V, Perrot, L. J., White, C. L., & Araoz, C. (1989) · Proceedings of the National Academy of Sciences · doi:10.1073/pnas.86.19.7611 · Cited by 1,777
Kaech, S., & Banker, G. A. (2006) · Nature Protocols · doi:10.1038/nprot.2006.356 · Cited by 1,766
CNS synaptogenesis promoted by glia-derived cholesterol
Mauch, D. H., Nägler, K., Schumacher, S., Göritz, C., Müller, E.-C., Otto, A., & Pfrieger, F. W. (2001) · Science · doi:10.1126/science.294.5545.1354 · Cited by 1,711
Thrombospondins are astrocyte-secreted proteins that promote CNS synaptogenesis
Christopherson, K. S., Ullian, E. M., Stokes, C. C. A., Mullowney, C. E., Hell, J. W., Agah, A., Lawler, J., Mosher, D. F., Bornstein, P., & Barres, B. A. (2005) · Cell · doi:10.1016/j.cell.2004.12.020 · Cited by 1,688
The DNA sequence of human chromosome 21
Hattori, M., Fujiyama, A., Taylor, T. D., Watanabe, H., Yada, T., Park, H.-S., Toyoda, A., Ishii, K., Totoki, Y., Choi, D., et al. (2000) · Nature · doi:10.1038/35012518 · Cited by 1,475
Glia: listening and talking to the synapse
Haydon, P. G. (2001) · Nature reviews. Neuroscience · doi:10.1038/35058528 · Cited by 1,454
Control of Synapse Number by Glia
Ullian, E. M., Sapperstein, S. K., Christopherson, K. S., & Barres, B. A. (2001) · Science · doi:10.1126/science.291.5504.657 · Cited by 1,380
Control of Synaptic Strength by Glial TNFα
Beattie, E. C., Stellwagen, D., Morishita, W., Bresnahan, J. C., Ha, B. K., Von Zastrow, M., Beattie, M. S., & Malenka, R. C. (2002) · Science · doi:10.1126/science.1067859 · Cited by 1,344
Astrocytes expressing ALS-linked mutated SOD1 release factors selectively toxic to motor neurons
Nagai, M., Re, D. B., Nagata, T., Chalazonitis, A., Jessell, T. M., Wichterle, H., & Przedborski, S. (2007) · Nature Neuroscience · doi:10.1038/nn1876 · Cited by 1,220
Culturing hippocampal neurons.
Tanaka, H. (2002) · Folia Pharmacologica Japonica · doi:10.1254/fpj.119.163 · Cited by 1,141
Astrocytes as determinants of disease progression in inherited amyotrophic lateral sclerosis
Yamanaka, K., Chun, S. J., Boillee, S., Fujimori-Tonou, N., Yamashita, H., Gutmann, D. H., Takahashi, R., Misawa, H., & Cleveland, D. W. (2008) · Nature Neuroscience · doi:10.1038/nn2047 · Cited by 1,140 · cited 1×
“Astrocyte alterations have been linked to diverse neurological conditions such as epilepsy [44–46], AD [47,48], ischemic injury [49], amyotrophic lateral sclerosis [50,51], and neurodevelopmental disorders such as Rett’s syndrome [52,53] and fragile X syndrome [54].”
BackgroundTransient and persistent dendritic spines in the neocortex in vivo
Holtmaat, A. J. G. D., Trachtenberg, J. T., Wilbrecht, L., Shepherd, G. M., Zhang, X., Knott, G. W., & Svoboda, K. (2005) · Neuron · doi:10.1016/j.neuron.2005.01.003 · Cited by 1,131
Signals leading to apoptosis-dependent inhibition of neovascularization by thrombospondin-1
Jiménez, B., Volpert, O. V., Crawford, S. E., Febbraio, M., Silverstein, R. L., & Bouck, N. (2000) · Nature Medicine · doi:10.1038/71517 · Cited by 1,014
Dentritic spines : structure, dynamics and regulation
Hering, H., & Sheng, M. (2001) · Nature Reviews Neuroscience · doi:10.1038/35104061 · Cited by 961
Three-Dimensional Relationships between Hippocampal Synapses and Astrocytes
Ventura, R. E., & Harris, K. M. (1999) · Journal of Neuroscience · doi:10.1523/jneurosci.19-16-06897.1999 · Cited by 907
Eroglu, Ç., Allen, N. J., Susman, M. W., O'Rourke, N. A., Park, C. Y., Özkan, E., Chakraborty, C., Mulinyawe, S. B., Annis, D. S., Huberman, A. D., et al. (2009) · Cell · doi:10.1016/j.cell.2009.09.025 · Cited by 893
Evidence for a Role of Dendritic Filopodia in Synaptogenesis and Spine Formation
Ziv, N. E., & Smith, S. J. (1996) · Neuron · doi:10.1016/s0896-6273(00)80283-4 · Cited by 882
Dendritic Spine Pathology: Cause or Consequence of Neurological Disorders?
Fiala, J. C., Spacek, J., & Harris, K. M. (2002) · Brain Research Reviews · doi:10.1016/s0165-0173(02)00158-3 · Cited by 811
An astrocytic basis of epilepsy
Tian, G.-F., Azmi, H., Takano, T., Xu, Q., Peng, W., Lin, J., Oberheim, N., Lou, N., Wang, X., Zielke, H. R., et al. (2005) · Nature Medicine · doi:10.1038/nm1277 · Cited by 806
Synaptic Efficacy Enhanced by Glial Cells in Vitro
Pfrieger, F. W., & Barres, B. A. (1997) · Science · doi:10.1126/science.277.5332.1684 · Cited by 793
Synaptic Islands Defined by the Territory of a Single Astrocyte
Halassa, M. M., Fellin, T., Takano, H., Dong, J.-H., & Haydon, P. G. (2007) · Journal of Neuroscience · doi:10.1523/jneurosci.1419-07.2007 · Cited by 767
Synaptogenesis Via Dendritic Filopodia in Developing Hippocampal Area CA1
Fiala, J. C., Feinberg, M., Popov, V., & Harris, K. M. (1998) · The Journal of Neuroscience · doi:10.1523/jneurosci.18-21-08900.1998 · Cited by 758
Dendritic Anomalies in Disorders Associated with Mental Retardation
Kaufmann, W. E. (2000) · Cerebral Cortex · doi:10.1093/cercor/10.10.981 · Cited by 746
Apoptosis and increased generation of reactive oxygen species in Down's syndrome neurons in vitro
Busciglio, J., & Yankner, B. A. (1995) · Nature · doi:10.1038/378776a0 · Cited by 741
Self-citationJones, F. S., & Jones, P. L. (2000) · Developmental Dynamics · doi:10.1002/(sici)1097-0177(200006)218:2 · Cited by 699
Development of long-term dendritic spine stability in diverse regions of cerebral cortex
Zuo, Y., Lin, A., Chang, P., & Gan, W.-B. (2005) · Neuron · doi:10.1016/j.neuron.2005.04.001 · Cited by 684
CD36 Mediates the In Vitro Inhibitory Effects of Thrombospondin-1 on Endothelial Cells
Dawson, D. W., Pearce, S. F. A., Zhong, R., Silverstein, R. L., Frazier, W. A., & Bouck, N. (1997) · The Journal of Cell Biology · doi:10.1083/jcb.138.3.707 · Cited by 676
The Dynamics of Dendritic Structure in Developing Hippocampal Slices
Dailey, M. E., & Smith, S. J. (1996) · The Journal of Neuroscience · doi:10.1523/jneurosci.16-09-02983.1996 · Cited by 611
Structure, development, and plasticity of dendritic spines
Harris, K. M. (1999) · Current Opinion in Neurobiology · doi:10.1016/s0959-4388(99)80050-6 · Cited by 523
Contribution of glial cells to the development of amyloid plaques in Alzheimer’s disease
Nagele, R. G., Węgiel, J., Venkataraman, V., Imaki, H., Wang, K.-C., & Wegiel, J. (2004) · Neurobiology of Aging · doi:10.1016/j.neurobiolaging.2004.01.007 · Cited by 522
Control of hippocampal dendritic spine morphology through ephrin-A3/EphA4 signaling
Murai, K. K., Nguyen, L. N., Irie, F., Yamaguchi, Y., & Pasquale, E. B. (2003) · Nature Neuroscience · doi:10.1038/nn994 · Cited by 516
Deshpande, A. M., Mina, E. W., Glabe, C. G., & Busciglio, J. A. (2006) · Journal of Neuroscience · doi:10.1523/jneurosci.1189-06.2006 · Cited by 508
Self-citationThe Transcriptome and Metabolic Gene Signature of Protoplasmic Astrocytes in the Adult Murine Cortex
Lovatt, D., Sonnewald, U., Waagepetersen, H. S., Schousboe, A., He, W., Lin, J. H.-C., Han, X., Takano, T., Wang, S., Sim, F. J., et al. (2007) · Journal of Neuroscience · doi:10.1523/jneurosci.3404-07.2007 · Cited by 505
Non–cell autonomous influence of MeCP2-deficient glia on neuronal dendritic morphology
Ballas, N., Lioy, D. T., Grunseich, C., & Mandel, G. (2009) · Nature Neuroscience · doi:10.1038/nn.2275 · Cited by 466
Lawler, J., Sunday, M. E., Thibert, V., Duquette, M. A., George, E. L., Rayburn, H., & Hynes, R. O. (1998) · Journal of Clinical Investigation · doi:10.1172/jci1684 · Cited by 456
The functions of thrombospondin-1 and-2
Lawler, J. (2000) · Current Opinion in Cell Biology · doi:10.1016/s0955-0674(00)00143-5 · Cited by 441
Cooperative Astrocyte and Dendritic Spine Dynamics at Hippocampal Excitatory Synapses
Haber, M., Zhou, L., & Murai, K. K. (2006) · Journal of Neuroscience · doi:10.1523/jneurosci.1302-06.2006 · Cited by 437
Astrocytes accumulate Aβ42 and give rise to astrocytic amyloid plaques in Alzheimer disease brains
Nagele, R. G., D’Andrea, M. R., Lee, H., Venkataraman, V., & Wang, H.-Y. (2003) · Brain Research · doi:10.1016/s0006-8993(03)02361-8 · Cited by 416
The cell biology of thrombospondin-1
Chen, H., Herndon, M. E., & Lawler, J. (2000) · Matrix Biology · doi:10.1016/s0945-053x(00)00107-4 · Cited by 393
Astrocytes in the Epileptic Brain
Wetherington, J. P., Serrano, G. E., & Dingledine, R. J. (2008) · Neuron · doi:10.1016/j.neuron.2008.04.002 · Cited by 391
Busciglio, J., Pelsman, A., Wong, C., Pigino, G., Yuan, M., Mori, H., & Yankner, B. A. (2002) · Neuron · doi:10.1016/s0896-6273(02)00604-9 · Cited by 387
Self-citationA Chromosome 21 Critical Region Does Not Cause Specific Down Syndrome Phenotypes
Olson, L. E., Richtsmeier, J. T., Leszl, J. M., & Reeves, R. H. (2004) · Science · doi:10.1126/science.1098992 · Cited by 331
Morphological analysis of dendritic spine development in primary cultures of hippocampal neurons
Papa, M., Bundman, M. C., Greenberger, V., & Segal, M. (1995) · Journal of Neuroscience · doi:10.1523/jneurosci.15-01-00001.1995 · Cited by 330
Rapid formation and remodeling of postsynaptic densities in developing dendrites
Marrs, G. S., Green, S. H., & Dailey, M. E. (2001) · Nature Neuroscience · doi:10.1038/nn717 · Cited by 311
Loss of astrocytic domain organization in the epileptic brain
Oberheim, N. A., Tian, G.-F., Han, X., Peng, W., Takano, T., Ransom, B., & Nedergaard, M. (2008) · The Journal of Neuroscience · doi:10.1523/jneurosci.4980-07.2008 · Cited by 303
Isenberg, J. S., Martin‐Manso, G., Maxhimer, J. B., & Roberts, D. D. (2009) · Nature reviews. Cancer · doi:10.1038/nrc2561 · Cited by 301
Hama, H., Hara, C., Yamaguchi, K., & Miyawaki, A. (2004) · Neuron · doi:10.1016/s0896-6273(04)00007-8 · Cited by 300
Synaptic structural abnormalities in the Ts65Dn mouse model of down syndrome
Belichenko, P. V., Masliah, E., Kleschevnikov, A. M., Villar, A. J., Epstein, C. J., Salehi, A., & Mobley, W. C. (2004) · Journal of Comparative Neurology · doi:10.1002/cne.20337 · Cited by 297
Structural abnormalities of the cerebral cortex in human chromosomal aberrations: a Golgi study
Marin-Padilla, M. (1972) · Brain Research · doi:10.1016/0006-8993(72)90324-1 · Cited by 290
Rett Syndrome Astrocytes Are Abnormal and Spread MeCP2 Deficiency through Gap Junctions
Maezawa, I., Swanberg, S. E., Harvey, D. J., LaSalle, J. M., & Jin, L. (2009) · Journal of Neuroscience · doi:10.1523/jneurosci.0324-09.2009 · Cited by 289
Pyramidal cell abnormalities in the motor cortex of a child with Down's syndrome. A Golgi study
Marin‐Padilla, M. (1976) · Journal of Comparative Neurology · doi:10.1002/cne.901670105 · Cited by 285
Astrocytes and ischemic injury
Takano, T., Oberheim, N., Cotrina, M., & Nedergaard, M. (2008) · Stroke · doi:10.1161/strokeaha.108.533166 · Cited by 280
Direct Astrocytic Contacts Regulate Local Maturation of Dendritic Spines
西田, 秀., & Okabe, S. (2007) · Journal of Neuroscience · doi:10.1523/jneurosci.4466-06.2007 · Cited by 268
Thrombospondins 1 and 2 are Necessary for Synaptic Plasticity and Functional Recovery after Stroke
Liauw, J. A., Hoang, S., Choi, M. Y., Eroğlu, Ç., Choi, M., Sun, G.-H., Percy, M., Wildman‐Tobriner, B., Bliss, T. M., Guzman, R. G., et al. (2008) · Journal of Cerebral Blood Flow & Metabolism · doi:10.1038/jcbfm.2008.65 · Cited by 263
Parallels of craniofacial maldevelopment in down syndrome and Ts65Dn mice
Richtsmeier, J. T., Baxter, L. L., & Reeves, R. H. (2000) · Developmental Dynamics · doi:10.1002/(sici)1097-0177(200002)217:2 · Cited by 260
Deshpande, A., Kawai, H., Metherate, R., Glabe, C. G., & Busciglio, J. (2009) · The Journal of Neuroscience · doi:10.1523/jneurosci.5980-08.2009 · Cited by 232
Self-citationMori, T., Buffo, A., & Götz, M. (2005) · Current topics in developmental biology/Current Topics in Developmental Biology · doi:10.1016/s0070-2153(05)69004-7 · Cited by 224
Microtubules in Dendritic Spine Development
Gu, J., Firestein, B. L., & Zheng, J. Q. (2008) · Journal of Neuroscience · doi:10.1523/jneurosci.2509-08.2008 · Cited by 220
Modulatory Role of Drebrin on the Cytoskeleton within Dendritic Spines in the Rat Cerebral Cortex
Hayashi, K., Ishikawa, R., Ye, L., He, X., Takata, K., Kohama, K., & Shirao, T. (1996) · Journal of Neuroscience · doi:10.1523/jneurosci.16-22-07161.1996 · Cited by 217
Belichenko, P. V., Kleschevnikov, A. M., Salehi, A., Epstein, C. J., & Mobley, W. C. (2007) · The Journal of Comparative Neurology · doi:10.1002/cne.21433 · Cited by 208
Thrombospondin 1 accelerates synaptogenesis in hippocampal neurons through neuroligin 1
Xu, J., Xiao, N., & Xia, J. (2009) · Nature Neuroscience · doi:10.1038/nn.2459 · Cited by 203
Down's dyndrome and Alzheimer's disease: dendritic spine counts in the hippocampus
Ferrer, I., & Gullotta, F. (1990) · Acta Neuropathologica · doi:10.1007/bf00294247 · Cited by 201
Dendritic pathology in mental retardation: from molecular genetics to neurobiology
Dierssen, M., & Ramakers, G. J. A. (2006) · Genes Brain & Behavior · doi:10.1111/j.1601-183x.2006.00224.x · Cited by 191
Suetsugu, M., & Mehraein, P. (1980) · Acta Neuropathologica · doi:10.1007/bf00688755 · Cited by 190
Astrocytes prevent abnormal neuronal development in the fragile X mouse.
Jacobs, S., & Doering, L. C. (2010) · The Journal of Neuroscience · doi:10.1523/jneurosci.5027-09.2010 · Cited by 170
Identification of integrin α3β1 as a neuronal thrombospondin receptor mediating neurite outgrowth
DeFreitas, M. F., Yoshida, C. K., Frazier, W. A., Mendrick, D. L., Kypta, R. M., & Reichard, L. F. (1995) · Neuron · doi:10.1016/0896-6273(95)90038-1 · Cited by 169
Hughes, E. G., Elmariah, S. B., & Balice‐Gordon, R. J. (2009) · Molecular and Cellular Neuroscience · doi:10.1016/j.mcn.2009.10.004 · Cited by 150
Human Chromosome 21 Dosage: Effect on the Expression of the Interferon Induced Antiviral State
Tan, Y., Schneider, E. L., Tischfield, J. A., Epstein, C. J., & Ruddle, F. H. (1974) · Science · doi:10.1126/science.186.4158.61 · Cited by 144
On dendrites in Down syndrome and DS murine models: a spiny way to learn
Benavides‐Piccione, R. (2004) · Progress in Neurobiology · doi:10.1016/j.pneurobio.2004.08.001 · Cited by 131
Ayberk Kurt, M., Ilker Kafa, M., Dierssen, M., & Ceri Davies, D. (2004) · Brain Research · doi:10.1016/j.brainres.2004.06.075 · Cited by 126
Dendritic and histochemical development and ageing in patients with Down's syndrome
TAKASHIMA, S., IIDA, K., MITO, T., & ARIMA, M. (1994) · Journal of Intellectual Disability Research · doi:10.1111/j.1365-2788.1994.tb00394.x · Cited by 126
Thrombospondin 1—a key astrocyte‐derived neurogenic factor
Lu, Z., & Kipnis, J. (2010) · The FASEB Journal · doi:10.1096/fj.09-150573 · Cited by 124
Rapid dendritic movements during synapse formation and rearrangement
Wong, W. T., & Wong, R. (2000) · Current Opinion in Neurobiology · doi:10.1016/s0959-4388(99)00059-8 · Cited by 121
Glia maintain follower neuron survival during Drosophila CNS development
Booth, G. E., Kinrade, E. F. V., & Hidalgo, A. (2000) · Development · doi:10.1242/dev.127.2.237 · Cited by 120
Mitochondrial dysfunction and tau hyperphosphorylation in Ts1Cje, a mouse model for Down syndrome
Ebrahim, A. S., Shimohata, A., Akagi, T., Yu, W., Yamaguchi, M., Murayama, M., Chui, D., Takeuchi, T., Amano, K., Subramhanya, K. H., et al. (2006) · Human Molecular Genetics · doi:10.1093/hmg/ddl211 · Cited by 119
Deposition and role of thrombospondin in the histogenesis of the cerebellar cortex.
O’Shea, K. S., Rheinheimer, J. S. T., & Dixit, V. M. (1990) · The Journal of Cell Biology · doi:10.1083/jcb.110.4.1275 · Cited by 117
O’Shea, K. S., Liu, L.-H. J., & Dixita, V. M. (1991) · Neuron · doi:10.1016/0896-6273(91)90261-w · Cited by 115
Increased Cortical Expression of Two Synaptogenic Thrombospondins in Human Brain Evolution
Cáceres, M., Suwyn, C. R., Maddox, M., Thomas, J. W., & Preuss, T. M. (2006) · Cerebral Cortex · doi:10.1093/cercor/bhl140 · Cited by 114
Human brain glial cells synthesize thrombospondin.
Asch, A. S., Leung, L. L. K., Shapiro, J. R., & Nachman, R. L. (1986) · Proceedings of the National Academy of Sciences · doi:10.1073/pnas.83.9.2904 · Cited by 112
Thrombospondin‐1 binds to ApoER2 and VLDL receptor and functions in postnatal neuronal migration
Blake, S. M., Strasser, V., Andrade, N., Duit, S., Hofbauer, R., Schneider, W. J., & Nimpf, J. (2008) · The EMBO Journal · doi:10.1038/emboj.2008.223 · Cited by 107
Dowell, J. A., Johnson, J. A., & Li, L. (2009) · Journal of Proteome Research · doi:10.1021/pr900248y · Cited by 106
Purinergic signaling induces thrombospondin-1 expression in astrocytes
Tran, M. D., & Neary, J. T. (2006) · Proceedings of the National Academy of Sciences · doi:10.1073/pnas.0603146103 · Cited by 100
Thrombospondin promotes process outgrowth in neurons from the peripheral and central nervous systems
Osterhout, D. J., Frazier, W. A., & Higgins, D. M. (1992) · Developmental Biology · doi:10.1016/0012-1606(92)90240-h · Cited by 99
Neuronal plasticity and astrocytic reaction in Down syndrome and Alzheimer disease
J�rgensen, O. S., Brooksbank, B. W. L., & Balázs, R. (1990) · Journal of the Neurological Sciences · doi:10.1016/0022-510x(90)90182-m · Cited by 98
Modulation of Neuritogenesis by Astrocyte Muscarinic Receptors
Guizzetti, M., Moore, N. H., Giordano, G., & Costa, L. G. (2008) · Journal of Biological Chemistry · doi:10.1074/jbc.m801316200 · Cited by 90
ets-2 Promotes the Activation of a Mitochondrial Death Pathway in Down's Syndrome Neurons
Helguera, P., Pelsman, A., Pigino, G., Wolvetang, E., Head, E., & Busciglio, J. (2005) · The Journal of Neuroscience · doi:10.1523/jneurosci.5107-04.2005 · Cited by 88
Self-citationMoore, N. H., Costa, L. G., Shaffer, S. A., Goodlett, D. R., & Guizzetti, M. (2008) · Journal of Neurochemistry · doi:10.1111/j.1471-4159.2008.05836.x · Cited by 77
Keene, S. D., Greco, T. M., Parastatidis, I., Lee, S. H., Hughes, E. G., Balice‐Gordon, R. J., Speicher, D. W., & Ischiropoulos, H. (2009) · PROTEOMICS · doi:10.1002/pmic.200800385 · Cited by 73
Interferon treatment inhibits glycosylation of a viral protein
Maheshwari, R. K., Banerjee, D. K., Waechter, C. J., Olden, K., & Friedman, R. M. (1980) · Nature · doi:10.1038/287454a0 · Cited by 72
Nitric Oxide and Its Gatekeeper Thrombospondin-1 in Tumor Angiogenesis
Roberts, D. D., Isenberg, J. S., Ridnour, L. A., & Wink, D. A. (2007) · Clinical Cancer Research · doi:10.1158/1078-0432.ccr-06-1758 · Cited by 69
Murphy, M., Friend, D., Pike-Nobile, L., & Epstein, L. B. (1992) · The Journal of Immunology · doi:10.4049/jimmunol.149.7.2506 · Cited by 67
GVS‐111 prevents oxidative damage and apoptosis in normal and Down's syndrome human cortical neurons
Pelsman, A., Hoyo‐Vadillo, C., Гудашева, Т. А., Середенин, С. Б., Ostrovskaya, R. U., & Busciglio, J. A. (2003) · International Journal of Developmental Neuroscience · doi:10.1016/s0736-5748(03)00031-5 · Cited by 65
Self-citationChromosome 21 and the cell growth inhibitory effect of human interferon preparations
Tan, Y. (1976) · Nature · doi:10.1038/260141a0 · Cited by 65
Chapleau, C. A., Carlo, M. E., Larimore, J. L., & Pozzo‐Miller, L. D. (2007) · Journal of Neuroscience Methods · doi:10.1016/j.jneumeth.2007.12.006 · Cited by 63
Greenwood, J. A., Pallero, M. A., Theibert, A. B., & Murphy-Ullrich, J. E. (1998) · Journal of Biological Chemistry · doi:10.1074/jbc.273.3.1755 · Cited by 62
T Lymphocyte Maturation Is Impaired in Healthy Young Individuals Carrying Trisomy 21 (Down Syndrome)
Guazzarotti, L., Trabattoni, D., Castelletti, E., Boldrighini, B., Piacentini, L., Duca, P., Beretta, S., Pacei, M., Caprio, C., Vigan�, A., et al. (2009) · American Journal on Intellectual and Developmental Disabilities · doi:10.1352/2009.114.100-109 · Cited by 48
Stress, Aging, and Neurodegenerative Disorders: Molecular Mechanismsa
Busciglio, J. A., Andersen, J. K., Schipper, H. M., Gilad, G. M., McCarty, R. C., Marzatico, F., & Toussaint, O. (1998) · Annals of the New York Academy of Sciences · doi:10.1111/j.1749-6632.1998.tb09021.x · Cited by 45
Self-citationDrebrin a content correlates with spine head size in the adult mouse cerebral cortex
Kobayashi, C., Aoki, C. J., Kojima, N., Yamazaki, H., & Shirao, T. (2007) · The Journal of Comparative Neurology · doi:10.1002/cne.21408 · Cited by 44
Yu, K., Ge, J., Summers, J. B., Li, F., Liu, X., Ma, P., Kaminski, J., & Zhuang, J. (2008) · PLoS ONE · doi:10.1371/journal.pone.0002470 · Cited by 44
Tau isoform expression and regulation in human cortical neurons
Deshpande, A. M., Win, K. M., & Busciglio, J. A. (2008) · The FASEB Journal · doi:10.1096/fj.07-096909 · Cited by 39
Self-citationNickoloff, B. J., Riser, B. L., Mitra, R. S., Dixit, V. M., & Varani, J. (1988) · Journal of Investigative Dermatology · doi:10.1111/1523-1747.ep12465005 · Cited by 33
Lymn, J., Rao, S. J., Clunn, G. F., Gallagher, K. L., O’Neil, C., Thompson, N. T., & Hughes, A. D. (1999) · Arteriosclerosis Thrombosis and Vascular Biology · doi:10.1161/01.atv.19.9.2133 · Cited by 31
Hallam, D. M., Capps, N. L., Travelstead, A. L., Brewer, G. J., & Maroun, L. E. (2000) · Journal of Neuroimmunology · doi:10.1016/s0165-5728(00)00289-7 · Cited by 28
Down's syndrome astrocytes have greater antioxidant capacity than euploid astrocytes
Sebastià, J., Cristòfol, R. M., Pertusa, M., Vı́lchez, D., Torán, N., Barambio, S., Rodrı́guez-Farré, E., & Sanfeliu, C. (2004) · European Journal of Neuroscience · doi:10.1111/j.1460-9568.2004.03686.x · Cited by 25
Interferon-γ- and interleukin-4-producing T cells in Down's syndrome
Franciotta, D. M., Verri, A., Zardini, E., Andreoni, L., AMICI, M. D., Moratti, R., & Nespoli, L. (2005) · Neuroscience Letters · doi:10.1016/j.neulet.2005.10.048 · Cited by 25
Nelson, P. G., Fitzgerald, S., Рапопорт, С. И., Neale, E. A., Galdzicki, Z., Dunlap, V., Bowers, L. M., & Ágoston, D. V. (1997) · Proceedings of the National Academy of Sciences · doi:10.1073/pnas.94.23.12644 · Cited by 24
Altered astrocyte calcium homeostasis and proliferation in theTs65Dn mouse, a model of Down syndrome
Bambrick, L. L., Yarowsky, P., & Krueger, B. K. (2003) · Journal of Neuroscience Research · doi:10.1002/jnr.10630 · Cited by 23
Iwamoto, T., Yamada, A., Yuasa, K., Fukumoto, E., Nakamura, T., Fujiwara, T., & Fukumoto, S. (2009) · Archives of Oral Biology · doi:10.1016/j.archoralbio.2009.07.009 · Cited by 23
Reduced Expression of Thrombospondins and Craniofacial Dysmorphism in Mice Overexpressing Fra1
Nishiwaki, T., Yamaguchi, T., Chen, Z., Amano, H., Hankenson, K. D., BORNSTEIN, P. K., Toyama, Y., & Matsuo, K. (2006) · Journal of Bone and Mineral Research · doi:10.1359/jbmr.051216 · Cited by 20
Interferon Action and Chromosome 21 Trisomy (Down Syndrome): 15 Years Later
Maroun, L. E. (1996) · Journal of Theoretical Biology · doi:10.1006/jtbi.1996.0113 · Cited by 20
The small GTPase Rac-1 is a regulator of mesangial cell morphology and thrombospondin-1 expression
Giehl, K., Graneß, A., & Goppelt‐Struebe, M. (2007) · American Journal of Physiology-Renal Physiology · doi:10.1152/ajprenal.00093.2007 · Cited by 19
Hallam, D. M., & Maroun, L. E. (1998) · Neuroscience Letters · doi:10.1016/s0304-3940(98)00541-2 · Cited by 17
Down's syndrome, interferon sensitivity and the development of leukaemia
Zihni, L. (1994) · Leukemia Research · doi:10.1016/0145-2126(94)90002-7 · Cited by 9
Cited by
Sorted by citations
Cell Biology of Astrocyte-Synapse Interactions
Allen, N. J., & Eroglu, C. (2017) · Neuron · doi:10.1016/j.neuron.2017.09.056 · Cited by 1,098
Emerging roles of astrocytes in neural circuit development
Clarke, L. E., & Barres, B. A. (2013) · Nature Reviews Neuroscience · doi:10.1038/nrn3484 · Cited by 975
Astrocytes Control Synapse Formation, Function, and Elimination
Chung, W.-S., Allen, N. J., & Eroglu, C. (2015) · Cold Spring Harbor Perspectives in Biology · doi:10.1101/cshperspect.a020370 · Cited by 839
Diniz, L. P., Almeida, J. C., Tortelli, V., Lopes, C. V., Setti-Perdigão, P., Stipursky, J., Kahn, S. A., Romão, L. F., Miranda, J. D., Alves‐Leon, S. V., et al. (2012) · Journal of Biological Chemistry · doi:10.1074/jbc.m112.380824 · Cited by 237
Role of astrocyte–synapse interactions in CNS disorders
Blanco‐Suárez, E., Caldwell, A. L. M., & Allen, N. J. (2016) · The Journal of Physiology · doi:10.1113/jp270988 · Cited by 234
Metadata
- Authors
- Garcia, O., Torres, M., Helguera, P., Coskun, P., & Busciglio, J.
- Affiliations
- University of California, Irvine (US)
- Corresponding author
- Busciglio, Jorge
- Venue
- PLoS ONE
- Publisher
- Public Library of Science (PLoS)
- Published
- 2010-12-02
- Volume
- 5
- Issue
- 12
- Pages
- e14200
- ISSN
- 1932-6203 (ISSN-L)
- PMC
- PMC2996288
- OpenAlex
- W2036755685
- Cited by
- 122
- References
- 115
- Citations by year
- 2026: 5 · 2025: 8 · 2024: 9 · 2023: 9 · 2022: 6 · 2021: 7 · 2020: 9 · 2019: 7 · 2018: 7 · 2017: 7 · 2016: 12 · 2015: 4 · 2014: 9 · 2013: 8 · 2012: 12
- FWCI
- 7.32
- Type
- journal article
- Language
- en
- Open access
- gold
- doi.org
- Locations
- PLoS ONE (publishedVersion, cc-by)
- PubMed Central (publishedVersion, cc-by)
- PubMed (publishedVersion)
- eScholarship (California Digital Library) (submittedVersion, cc-by)
- DOAJ (DOAJ: Directory of Open Access Journals) (submittedVersion, cc-by-sa)
- Figshare (submittedVersion, cc-by)
- Funders
- Larry L. Hillblom Foundation
- National Institutes of Health (AG16573)
- National Institute on Aging (AG 16573, P50AG016573)
- Eunice Kennedy Shriver National Institute of Child Health and Human Development (HD-38466, R01HD038466)
- Topics
- Health Sciences › Medicine › Public Health, Environmental and Occupational Health › Down syndrome and intellectual disability research
- Life Sciences › Neuroscience › Cellular and Molecular Neuroscience › Neuroscience and Neuropharmacology Research
- Life Sciences › Biochemistry, Genetics and Molecular Biology › Genetics › Genetics and Neurodevelopmental Disorders
- Keywords
- Down syndrome, thrombospondin-1, astrocytes, dendritic spines, synaptic pathology, dendritic spine morphology, synaptic density, astrocyte-neuron co-culture, hippocampal neurons, intellectual disability, astrocyte dysfunction
- MeSH terms
- Animals, Astrocytes, Brain, Down Syndrome, Humans, Microscopy, Fluorescence, Neurons, Synapses, Gene Expression Regulation, Developmental, Coculture Techniques, Thrombospondin 1, Animals, Genetically Modified, Dendritic Spines, Rats
About these checks
Registry, retraction, Cites and statistics results are computed, not judged, with one exception: a printed reference that no index lists is read once by a model before it counts as a citation error. Claims are extracted by a model and kept only when their quote appears verbatim in the text; each cited source is then checked, with a model’s help, for whether it says what the claim relies on. Those verdicts can be wrong — read the claim’s quote and the cited source before relying on one.
Statistics and arithmetic are recomputed, not judged.
Confidence bands are shown only for fields calibrated on our annotated test set. None is calibrated yet, so no band is shown.
What counts as a claim ›How we measure confidence ›How we check this ›
Are you an author, or do you see a problem with this page? Request a review
