

The DOI matches its Crossref record; 59 of the 59 references it cites were found in a registry or an index.
Structural and Functional Rich Club Organization of the Brain in Children and Adults
Open accessAbstract
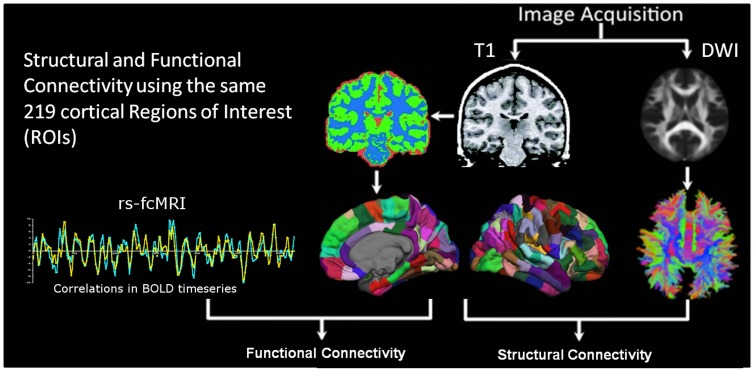
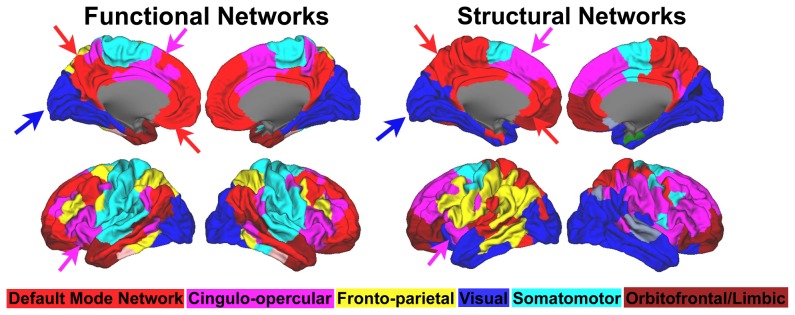
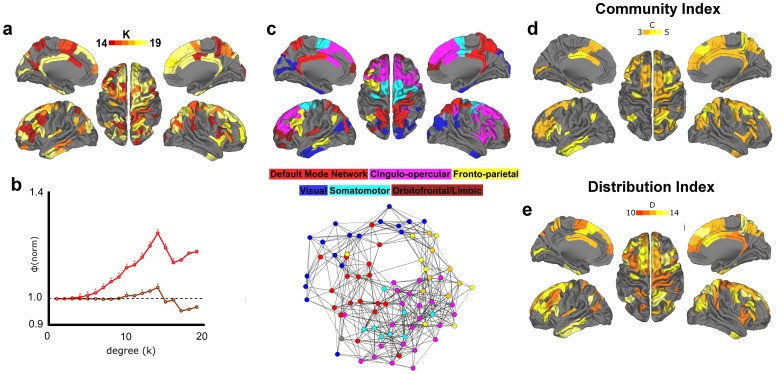
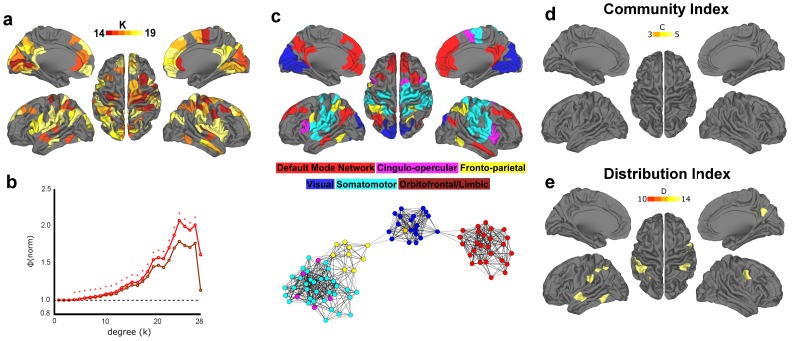
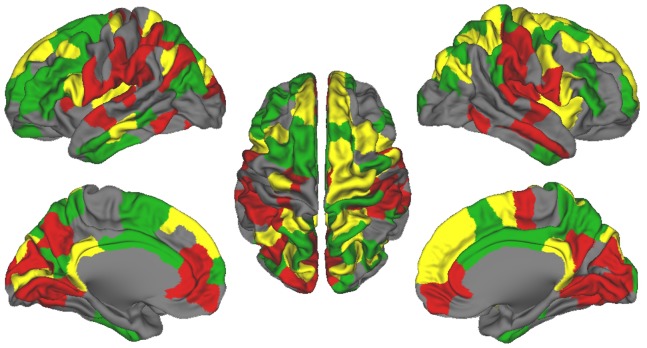
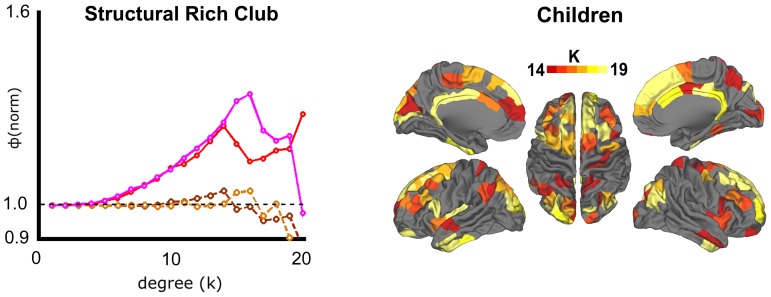
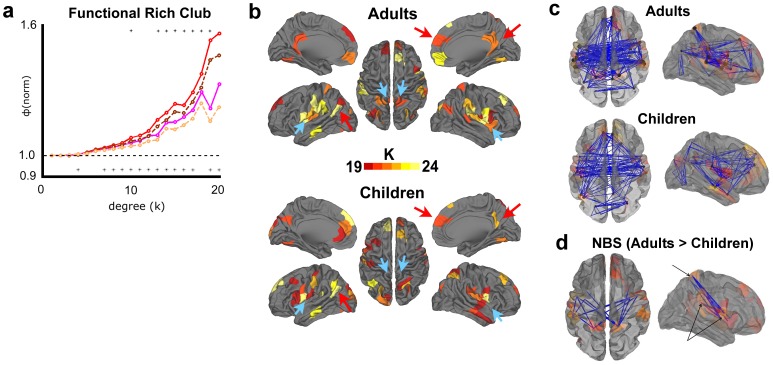
Recent studies using Magnetic Resonance Imaging (MRI) have proposed that the brain's white matter is organized as a rich club, whereby the most highly connected regions of the brain are also highly connected to each other. Here we use both functional and diffusion-weighted MRI in the human brain to investigate whether the rich club phenomena is present with functional connectivity, and how this organization relates to the structural phenomena. We also examine whether rich club regions serve to integrate information between distinct brain systems, and conclude with a brief investigation of the developmental trajectory of rich-club phenomena. In agreement with prior work, both adults and children showed robust structural rich club organization, comprising regions of the superior medial frontal/dACC, medial parietal/PCC, insula, and inferior temporal cortex. We also show that these regions were highly integrated across the brain's major networks. Functional brain networks were found to have rich club phenomena in a similar spatial layout, but a high level of segregation between systems. While no significant differences between adults and children were found structurally, adults showed significantly greater functional rich club organization. This difference appeared to be driven by a specific set of connections between superior parietal, insula, and supramarginal cortex. In sum, this work highlights the existence of both a structural and functional rich club in adult and child populations with some functional changes over development. It also offers a potential target in examining atypical network organization in common developmental brain disorders, such as ADHD and Autism.
Overview
The claims and statistics of this paper haven’t been checked yet.
Run the check — free, no account needed. It reads the open-access text and checks the sources it cites.
Integrity signals
Registry
Cites
Statistics
Figures
Verification
Claims the paper makes
The claims and statistics of this paper haven’t been checked yet.
Run the check — free, no account needed. It reads the open-access text and checks the sources it cites.
Claims other papers make about this one
Each is checked against this paper’s own text: does it say what the citing paper says it does?
In the citing paper
“high strength and betweenness hubs in adulthood are largely located within within the default mode, attentional, sensorimotor, and visual areas (Cao et al., 2014; Fransson et al., 2011; Grayson et al., 2014; Hwang et al., 2013)”
From Development of large-scale functional networks from birth to adulthood: A guide to the neuroimaging literature (2017) · cites this paper as Grayson et al., 2014
In the citing paper
“Among cortical areas, some have reported increasing hubness of frontal nodes (Cao et al., 2014; Wu et al., 2013) while in other lobes there have been mixed reports of increasing (Cao et al., 2014; Grayson et al., 2014) and decreasing (Wu et al., 2013; Zuo et al., 2012), or stable (Hwang et al., 2013) hubness.”
From Development of large-scale functional networks from birth to adulthood: A guide to the neuroimaging literature (2017) · cites this paper as Grayson et al., 2014
In the citing paper
“More detailed network analyses have revealed that specific connections to cortical hub regions increase during childhood and adolescence (Grayson et al., 2014; Hwang et al., 2013) resulting in increased rich club coefficients in adulthood (Cao et al., 2014; Grayson et al., 2014).”
From Development of large-scale functional networks from birth to adulthood: A guide to the neuroimaging literature (2017) · cites this paper as Grayson et al., 2014
In the citing paper
“Returning to the MRI literature, there is convergent evidence that the locations of high-strength and high-betweenness hub regions appear to be stable after 5 years of age (Cao et al., 2014; Grayson et al., 2014; Hwang et al., 2013; Wang et al., 2012; Wu et al., 2013; Zuo et al., 2012).”
From Development of large-scale functional networks from birth to adulthood: A guide to the neuroimaging literature (2017) · cites this paper as Grayson et al., 2014
Self-check
Percentages, sums and reported differences re-computed from the paper’s own numbers.
The self-check needs the paper’s full text.
Citations
Cites
Modularity and community structure in networks
Newman, M. E. J. (2006) · Proceedings of the National Academy of Sciences · doi:10.1073/pnas.0601602103 · Cited by 12,256
Complex brain networks: graph theoretical analysis of structural and functional systems
Bullmore, E., & Sporns, O. (2009) · Nature Reviews Neuroscience · doi:10.1038/nrn2575 · Cited by 11,820
Complex network measures of brain connectivity: Uses and interpretations
Rubinov, M., & Sporns, O. (2010) · NeuroImage · doi:10.1016/j.neuroimage.2009.10.003 · Cited by 11,522
Functional connectivity in the motor cortex of resting human brain using echo‐planar mri
Biswal, B., Zerrin Yetkin, F., Haughton, V. M., & Hyde, J. S. (1995) · Magnetic Resonance in Medicine · doi:10.1002/mrm.1910340409 · Cited by 9,812
The organization of the human cerebral cortex estimated by intrinsic functional connectivity
Thomas Yeo, B. T., Krienen, F. M., Sepulcre, J., Sabuncu, M. R., Lashkari, D., Hollinshead, M., Roffman, J. L., Smoller, J. W., Zöllei, L., Polimeni, J. R., et al. (2011) · Journal of Neurophysiology · doi:10.1152/jn.00338.2011 · Cited by 9,182
The human brain is intrinsically organized into dynamic, anticorrelated functional networks
Fox, M. D., Snyder, A. Z., Vincent, J. L., Corbetta, M., Van Essen, D. C., & Raichle, M. E. (2005) · Proceedings of the National Academy of Sciences · doi:10.1073/pnas.0504136102 · Cited by 8,553
Power, J. D., Barnes, K. A., Snyder, A. Z., Schlaggar, B. L., & Petersen, S. E. (2012) · NeuroImage · doi:10.1016/j.neuroimage.2011.10.018 · Cited by 7,429
The organization of the human cerebellum estimated by intrinsic functional connectivity
Buckner, R. L., Krienen, F. M., Castellanos, A., Diaz, J. C., & Yeo, B. T. T. (2011) · Journal of Neurophysiology · doi:10.1152/jn.00339.2011 · Cited by 7,304
Spontaneous fluctuations in brain activity observed with functional magnetic resonance imaging
Fox, M. D., & Raichle, M. E. (2007) · Nature Reviews Neuroscience · doi:10.1038/nrn2201 · Cited by 6,700
The brainweb: phase synchronization and large-scale integration
Varela, F., Lachaux, J.-P., Rodriguez, E., & Martinerie, J. (2001) · Nature Reviews Neuroscience · doi:10.1038/35067550 · Cited by 4,761
Mapping the structural core of human cerebral cortex
Hagmann, P., Cammoun, L., Gigandet, X., Meuli, R., Honey, C. J., Wedeen, V. J., & Sporns, O. (2008) · PLoS Biology · doi:10.1371/journal.pbio.0060159 · Cited by 4,173
Functional Network Organization of the Human Brain
Power, J. D., Cohen, A. L., Nelson, S. M., Wig, G. S., Barnes, K. A., Church, J. A., Vogel, A. C., Laumann, T. O., Miezin, F. M., Schlaggar, B. L., et al. (2011) · Neuron · doi:10.1016/j.neuron.2011.09.006 · Cited by 4,124
Predicting human resting-state functional connectivity from structural connectivity
Honey, C. J., Sporns, O., Cammoun, L., Gigandet, X., Thiran, J. P., Meuli, R., & Hagmann, P. (2009) · Proceedings of the National Academy of Sciences · doi:10.1073/pnas.0811168106 · Cited by 3,307
Network-based statistic: identifying differences in brain networks
Zalesky, A., Fornito, A., & Bullmore, E. T. (2010) · NeuroImage · doi:10.1016/j.neuroimage.2010.06.041 · Cited by 2,750
Homeostatic plasticity in the developing nervous system
Turrigiano, G. G., & Nelson, S. B. (2004) · Nature Reviews Neuroscience · doi:10.1038/nrn1327 · Cited by 2,485
Rich-club organization of the human connectome
van den Heuvel, M. P., & Sporns, O. (2011) · The Journal of Neuroscience · doi:10.1523/jneurosci.3539-11.2011 · Cited by 2,354
The role of the posterior cingulate cortex in cognition and disease
Leech, R., & Sharp, D. J. (2014) · Brain · doi:10.1093/brain/awt162 · Cited by 2,247
Resting-State Functional Connectivity Reflects Structural Connectivity in the Default Mode Network
Greicius, M. D., Supekar, K., Menon, V., & Dougherty, R. F. (2009) · Cerebral Cortex · doi:10.1093/cercor/bhn059 · Cited by 2,175
A dual-networks architecture of top-down control
Dosenbach, N. U. F., Fair, D. A., Cohen, A. L., Schlaggar, B. L., & Petersen, S. E. (2008) · Trends in Cognitive Sciences · doi:10.1016/j.tics.2008.01.001 · Cited by 1,931
Self-citationIntrinsic functional architecture in the anaesthetized monkey brain
Vincent, J. L., Patel, G. H., Fox, M. D., Snyder, A. Z., Baker, J. T., Van Essen, D. C., Zempel, J. M., Snyder, L. H., Corbetta, M., & Raichle, M. E. (2007) · Nature · doi:10.1038/nature05758 · Cited by 1,786
Sexual dimorphism of brain developmental trajectories during childhood and adolescence
Lenroot, R. K., Gogtay, N., Greenstein, D. K., Wells, E. M., Wallace, G. L., Clasen, L. S., Blumenthal, J. D., Lerch, J., Zijdenbos, A. P., Evans, A. C., et al. (2007) · NeuroImage · doi:10.1016/j.neuroimage.2007.03.053 · Cited by 1,309
Development of distinct control networks through segregation and integration
Fair, D. A., Dosenbach, N. U. F., Church, J. A., Cohen, A. L., Brahmbhatt, S., Miezin, F. M., Barch, D. M., Raichle, M. E., Petersen, S. E., & Schlaggar, B. L. (2007) · Proceedings of the National Academy of Sciences · doi:10.1073/pnas.0705843104 · Cited by 1,244
Self-citationWhole-brain anatomical networks: does the choice of nodes matter?
Zalesky, A., Fornito, A., Harding, I. H., Cocchi, L., Yücel, M., Pantelis, C., & Bullmore, E. T. (2010) · NeuroImage · doi:10.1016/j.neuroimage.2009.12.027 · Cited by 1,169
Detecting rich-club ordering in complex networks
Colizza, V., Flammini, A., Serrano, M. A., & Vespignani, A. (2006) · Nature Physics · doi:10.1038/nphys209 · Cited by 1,001
van den Heuvel, M. P., Mandl, R. C. W., Kahn, R. S., & Hulshoff Pol, H. E. (2009) · Human Brain Mapping · doi:10.1002/hbm.20737 · Cited by 987
Human brain networks in health and disease
Bassett, D. S., & Bullmore, E. T. (2009) · Current Opinion in Neurology · doi:10.1097/wco.0b013e32832d93dd · Cited by 922
High-cost, high-capacity backbone for global brain communication
van den Heuvel, M. P., Kahn, R. S., Goñi, J., & Sporns, O. (2012) · Proceedings of the National Academy of Sciences · doi:10.1073/pnas.1203593109 · Cited by 781
Hallquist, M. N., Hwang, K., & Luna, B. (2013) · NeuroImage · doi:10.1016/j.neuroimage.2013.05.116 · Cited by 753
Evidence for hubs in human functional brain networks
Power, J. D., Schlaggar, B. L., Lessov-Schlaggar, C. N., & Petersen, S. E. (2013) · Neuron · doi:10.1016/j.neuron.2013.07.035 · Cited by 716
Schizophrenia, neuroimaging and connectomics
Fornito, A., Zalesky, A., Pantelis, C., & Bullmore, E. T. (2012) · NeuroImage · doi:10.1016/j.neuroimage.2011.12.090 · Cited by 716
White matter maturation reshapes structural connectivity in the late developing human brain
Hagmann, P., Sporns, O., Madan, N., Cammoun, L., Pienaar, R., Wedeen, V. J., Meuli, R., Thiran, J.-P., & Grant, P. E. (2010) · Proceedings of the National Academy of Sciences · doi:10.1073/pnas.1009073107 · Cited by 700
Diffusion MRI of complex neural architecture.
Tuch, D. S., Reese, T. G., Wiegell, M. R., & Wedeen, V. J. (2003) · Neuron · doi:10.1016/s0896-6273(03)00758-x · Cited by 698
van den Heuvel, M. P., Mandl, R. C. W., Stam, C. J., Kahn, R. S., & Pol, H. E. H. (2010) · Journal of Neuroscience · doi:10.1523/jneurosci.2874-10.2010 · Cited by 677
Abnormal Rich Club Organization and Functional Brain Dynamics in Schizophrenia
van den Heuvel, M. P., Sporns, O., Collin, G., Scheewe, T. W., Mandl, R. C. W., Cahn, W., Goñi, J., Pol, H. E. H., & Kahn, R. S. (2013) · JAMA Psychiatry · doi:10.1001/jamapsychiatry.2013.1328 · Cited by 649
Can structure predict function in the human brain?
Honey, C. J., Thivierge, J.-P., & Sporns, O. (2010) · NeuroImage · doi:10.1016/j.neuroimage.2010.01.071 · Cited by 629
Functional connectivity in a baseline resting-state network in autism
Cherkassky, V. L., Kana, R. K., Keller, T. A., & Just, M. A. (2006) · NeuroReport · doi:10.1097/01.wnr.0000239956.45448.4c · Cited by 622
The Rich-Club Phenomenon in the Internet Topology
Zhou, S., & Mondragón, R. J. (2004) · IEEE Communications Letters · doi:10.1109/lcomm.2004.823426 · Cited by 618
Fair, D. A., Schlaggar, B. L., Cohen, A. L., Miezin, F. M., Dosenbach, N. U. F., Wenger, K. K., Fox, M., Snyder, A. Z., Raichle, M. E., & Petersen, S. E. (2007) · NeuroImage · doi:10.1016/j.neuroimage.2006.11.051 · Cited by 615
Self-citationUddin, L. Q., Supekar, K. S., Ryali, S., & Menon, V. (2011) · The Journal of Neuroscience · doi:10.1523/jneurosci.4465-11.2011 · Cited by 520
White matter development in adolescence: A DTI study
Asato, M. R., Terwilliger, R., Woo, J., & Luna, B. (2010) · Cerebral Cortex · doi:10.1093/cercor/bhp282 · Cited by 512
Fair, D. A., Nigg, J. T., Iyer, S., Bathula, D., Mills, K. L., Dosenbach, N. U. F., Schlaggar, B. L., Mennes, M., Gutman, D., Bangaru, S., et al. (2013) · Frontiers in Systems Neuroscience · doi:10.3389/fnsys.2012.00080 · Cited by 463
Self-citationDisrupted axonal fiber connectivity in schizophrenia
Zalesky, A., Fornito, A., Seal, M. L., Cocchi, L., Westin, C.-F., Bullmore, E. T., Egan, G. F., & Pantelis, C. (2011) · Biological Psychiatry · doi:10.1016/j.biopsych.2010.08.022 · Cited by 439
On the use of correlation as a measure of network connectivity
Zalesky, A., Fornito, A., & Bullmore, E. T. (2012) · NeuroImage · doi:10.1016/j.neuroimage.2012.02.001 · Cited by 430
Dynamic cooperation and competition between brain systems during cognitive control
Cocchi, L., Zalesky, A., Fornito, A., & Mattingley, J. B. (2013) · Trends in Cognitive Sciences · doi:10.1016/j.tics.2013.08.006 · Cited by 429
An anatomical substrate for integration among functional networks in human cortex
van den Heuvel, M. P., & Sporns, O. (2013) · The Journal of Neuroscience · doi:10.1523/jneurosci.2128-13.2013 · Cited by 404
Prominence and Control: The Weighted Rich-Club Effect
Opsahl, T., Colizza, V., Panzarasa, P., & Ramasco, J. J. (2008) · Physical Review Letters · doi:10.1103/physrevlett.101.168702 · Cited by 392
Atypical default network connectivity in youth with attention-deficit/hyperactivity disorder
Fair, D. A., Posner, J., Nagel, B. J., Bathula, D., Dias, T. G. C., Mills, K. L., Blythe, M. S., Giwa, A., Schmitt, C. F., & Nigg, J. T. (2010) · Biological Psychiatry · doi:10.1016/j.biopsych.2010.07.003 · Cited by 354
Self-citationFornito, A., Yoon, J. H., Zalesky, A., Bullmore, E. T., & Carter, C. S. (2011) · Biological Psychiatry · doi:10.1016/j.biopsych.2011.02.019 · Cited by 283
A Paradigm Shift in Functional Brain Imaging
Raichle, M. E. (2009) · Journal of Neuroscience · doi:10.1523/jneurosci.4366-09.2009 · Cited by 281
Collin, G., Sporns, O., Mandl, R. C. W., & van den Heuvel, M. P. (2013) · Cerebral Cortex · doi:10.1093/cercor/bht064 · Cited by 257
The development of hub architecture in the human functional brain network
Hwang, K., Hallquist, M. N., & Luna, B. (2013) · Cerebral Cortex · doi:10.1093/cercor/bhs227 · Cited by 226
Stevens, A. A., Tappon, S. C., Garg, A., & Fair, D. A. (2012) · PLoS ONE · doi:10.1371/journal.pone.0030468 · Cited by 212
Self-citationRich Club Organization and Intermodule Communication in the Cat Connectome
de Reus, M. A., & van den Heuvel, M. P. (2013) · Journal of Neuroscience · doi:10.1523/jneurosci.1448-13.2013 · Cited by 163
Cocchi, L., Bramati, I. E., Zalesky, A., Furukawa, E., Fontenelle, L. F., Moll, J., Tripp, G., & Mattos, P. (2012) · The Journal of Neuroscience · doi:10.1523/jneurosci.3272-12.2012 · Cited by 151
Echoes of the Brain within Default Mode, Association, and Heteromodal Cortices
Braga, R. M., Sharp, D. J., Leeson, C., Wise, R. G., & Leech, R. (2013) · Journal of Neuroscience · doi:10.1523/jneurosci.0570-13.2013 · Cited by 124
MR connectomics: a conceptual framework for studying the developing brain
Hagmann, P., Grant, P. E., & Fair, D. A. (2012) · Frontiers in Systems Neuroscience · doi:10.3389/fnsys.2012.00043 · Cited by 96
Self-citationYu, Q., Jing Sui (Beijing Normal University), my correct affiliation is beijing normal university, N. Q. U. O. S. A. T., Liu, J., Plis, S., Kiehl, K. A., Pearlson, G. D., & Calhoun, V. D. (2012) · Schizophrenia Research · doi:10.1016/j.schres.2012.11.001 · Cited by 81
Pinsk, M. A., & Kästner, S. (2007) · Nature · doi:10.1038/447046a · Cited by 62
Opsahl, T., Vittoria Colizza, A., Panzarasa, P., & Ramasco, J. J. (2008) · Physical Review Letters · doi:10.1103/physrevlett.101.189903 · Cited by 37
Cited by
Sorted by citations
An Integrative Model of the Maturation of Cognitive Control
Luna, B., Marek, S., Larsen, B., Tervo-Clemmens, B., & Chahal, R. (2015) · Annual Review of Neuroscience · doi:10.1146/annurev-neuro-071714-034054 · Cited by 550
Grayson, D. S., & Fair, D. A. (2017) · NeuroImage · doi:10.1016/j.neuroimage.2017.01.079 · Cited by 411
“Returning to the MRI literature, there is convergent evidence that the locations of high-strength and high-betweenness hub regions appear to be stable after 5 years of age (Cao et al., 2014; Grayson et al., 2014; Hwang et al., 2013; Wang et al., 2012; Wu et al., 2013; Zuo et al., 2012).”
BackgroundInfluentialSelf-citationUnraveling the Miswired Connectome: A Developmental Perspective
Martino, A. D., Fair, D. A., Kelly, C. A. M., Satterthwaite, T. D., Castellanos, F. X., Thomason, M. E., Craddock, R. C., Luna, B., LEVENTHAL, B. L., Zuo, X., et al. (2014) · Neuron · doi:10.1016/j.neuron.2014.08.050 · Cited by 357
Self-citationvan den Heuvel, M. P., Bullmore, E. T., & Sporns, O. (2016) · Trends in Cognitive Sciences · doi:10.1016/j.tics.2016.03.001 · Cited by 328
An update on the comorbidity of ADHD and ASD: a focus on clinical management
Antshel, K. M., Zhang‐James, Y., Wagner, K. E., Ledesma, A., & Faraone, S. V. (2016) · Expert Review of Neurotherapeutics · doi:10.1586/14737175.2016.1146591 · Cited by 276
Metadata
- Authors
- Grayson, D. S., Ray, S., Carpenter, S., Iyer, S., Dias, T. G. C., Stevens, C., Nigg, J. T., & Fair, D. A.
- Affiliations
- Oregon Health & Science University (US)
- Corresponding author
- Grayson, David S.
- Fair, Damien A.
- Venue
- PLoS ONE
- Publisher
- Public Library of Science (PLoS)
- Published
- 2014-02-05
- Volume
- 9
- Issue
- 2
- Pages
- e88297
- ISSN
- 1932-6203 (ISSN-L)
- PMC
- PMC3915050
- OpenAlex
- W2063751901
- Cited by
- 187
- References
- 59
- Citations by year
- 2026: 4 · 2025: 9 · 2024: 12 · 2023: 14 · 2022: 14 · 2021: 14 · 2020: 13 · 2019: 26 · 2018: 19 · 2017: 14 · 2016: 19 · 2015: 18 · 2014: 11
- FWCI
- 11.52
- Type
- journal article
- Language
- en
- Open access
- gold
- doi.org
- Locations
- PLoS ONE (publishedVersion, cc-by)
- Europe PMC (PubMed Central) (publishedVersion, cc-by)
- PubMed Central (publishedVersion, cc-by)
- PubMed (publishedVersion)
- DOAJ (DOAJ: Directory of Open Access Journals) (submittedVersion, cc-by-sa)
- Figshare (submittedVersion, cc-by)
- Funders
- James S. McDonnell Foundation (R01 MH096773)
- National Institutes of Health (MH091238, MH086654)
- Oregon Clinical and Translational Research Institute
- National Institute of Mental Health (MH086654, MH091238, R01MH115357, R00MH091238, R01MH096773, MH096773, R01MH086654)
- Topics
- Life Sciences › Neuroscience › Cognitive Neuroscience › Functional Brain Connectivity Studies
- Health Sciences › Medicine › Radiology, Nuclear Medicine and Imaging › Advanced Neuroimaging Techniques and Applications
- Physical Sciences › Physics and Astronomy › Statistical and Nonlinear Physics › Complex Network Analysis Techniques
- Keywords
- rich club, brain network organization, functional connectivity, structural connectivity, white matter, brain development, children, adults, default mode network, dorsal anterior cingulate cortex, posterior cingulate cortex, insula, inferior temporal cortex, supramarginal cortex, functional segregation, attention deficit hyperactivity disorder, autism spectrum disorder
- MeSH terms
- Adult, Brain, Brain Mapping, Child, Female, Humans, Magnetic Resonance Imaging, Male, Models, Anatomic, Models, Neurological, Nerve Net, Neural Pathways, Young Adult, Diffusion Tensor Imaging
About these checks
Registry, retraction, Cites and statistics results are computed, not judged, with one exception: a printed reference that no index lists is read once by a model before it counts as a citation error. Claims are extracted by a model and kept only when their quote appears verbatim in the text; each cited source is then checked, with a model’s help, for whether it says what the claim relies on. Those verdicts can be wrong — read the claim’s quote and the cited source before relying on one.
Statistics and arithmetic are recomputed, not judged.
Confidence bands are shown only for fields calibrated on our annotated test set. None is calibrated yet, so no band is shown.
What counts as a claim ›How we measure confidence ›How we check this ›
Are you an author, or do you see a problem with this page? Request a review
